


Bond Parameter Calibration and Crushing Process Analysis of Brown Rice Kernels

Abstract
:1. Introduction
2. Materials and Methods
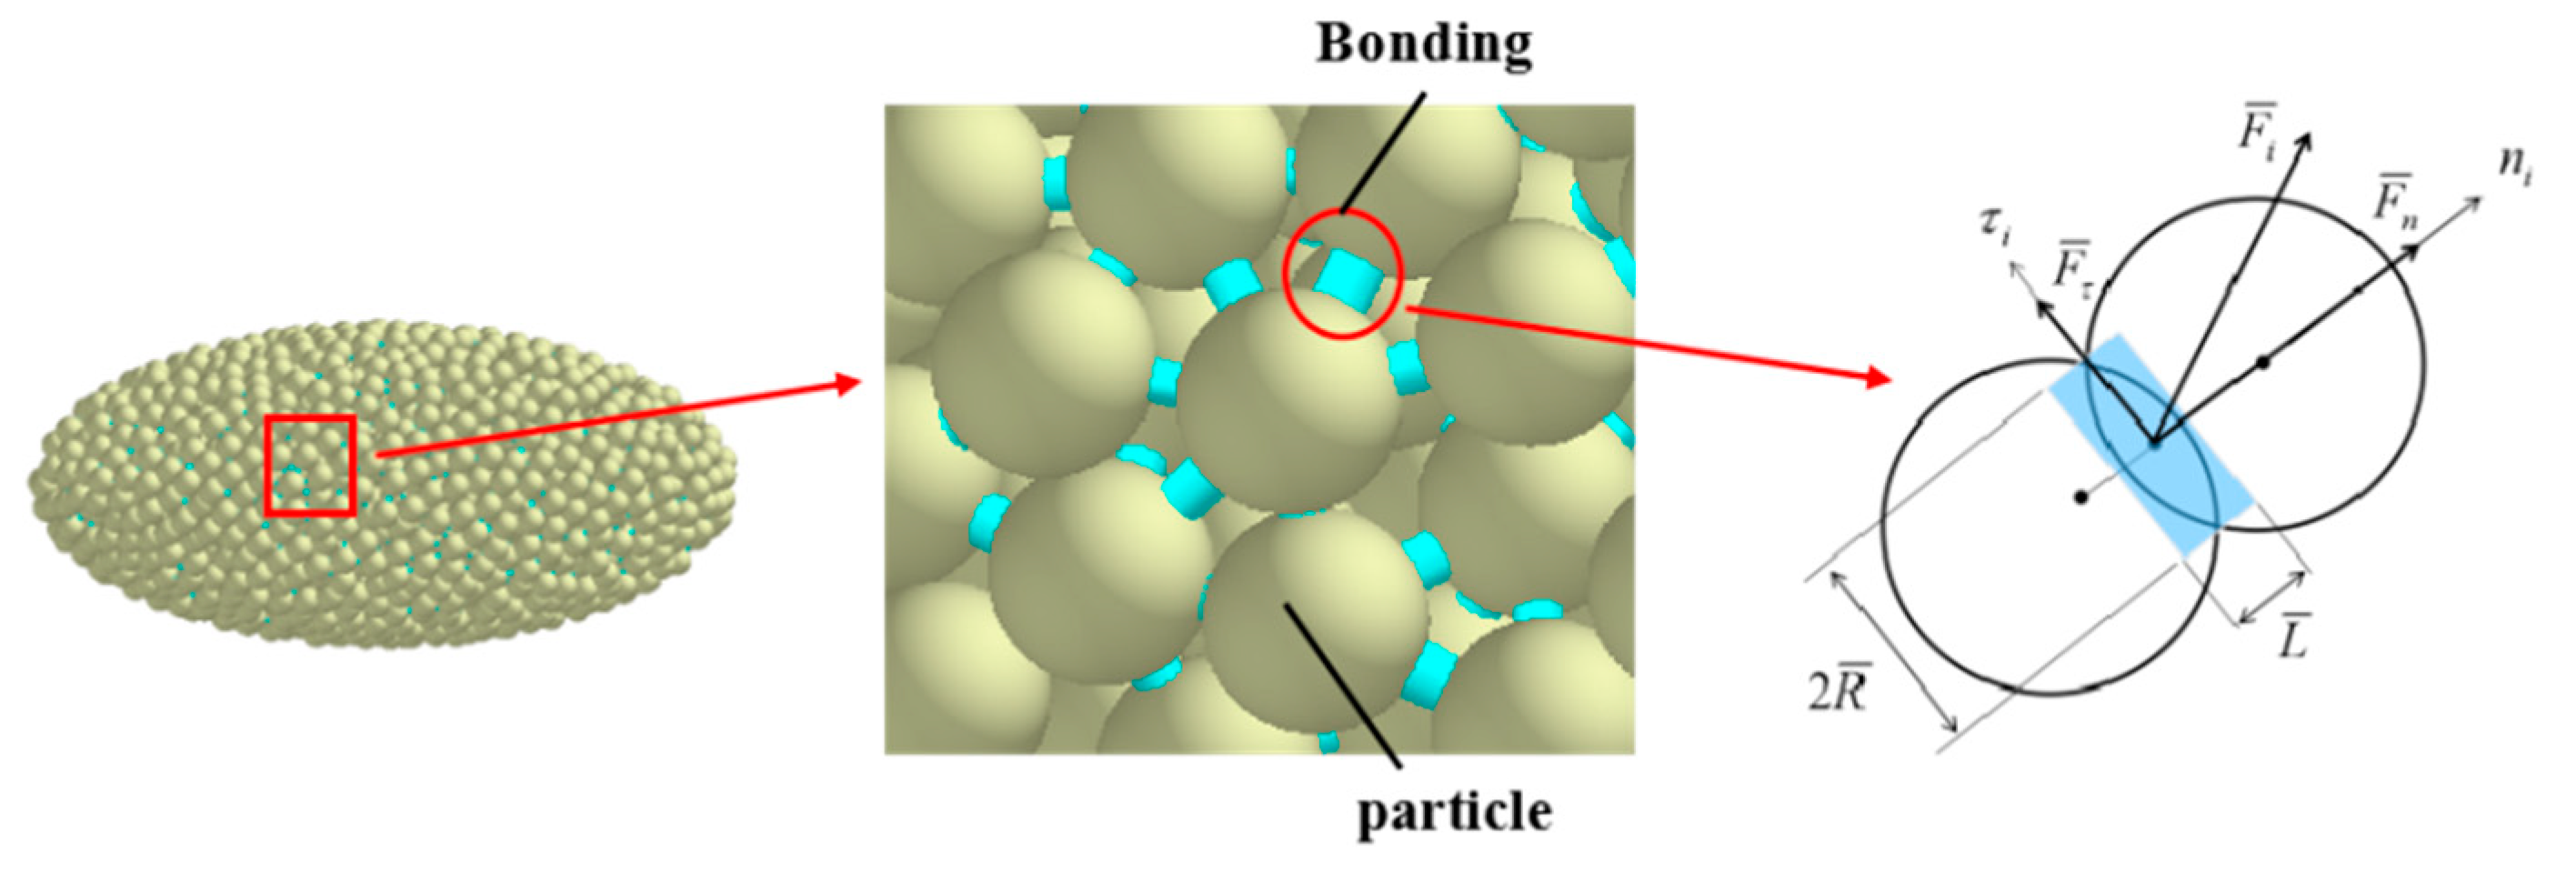
2.1. Particle Simulation Model
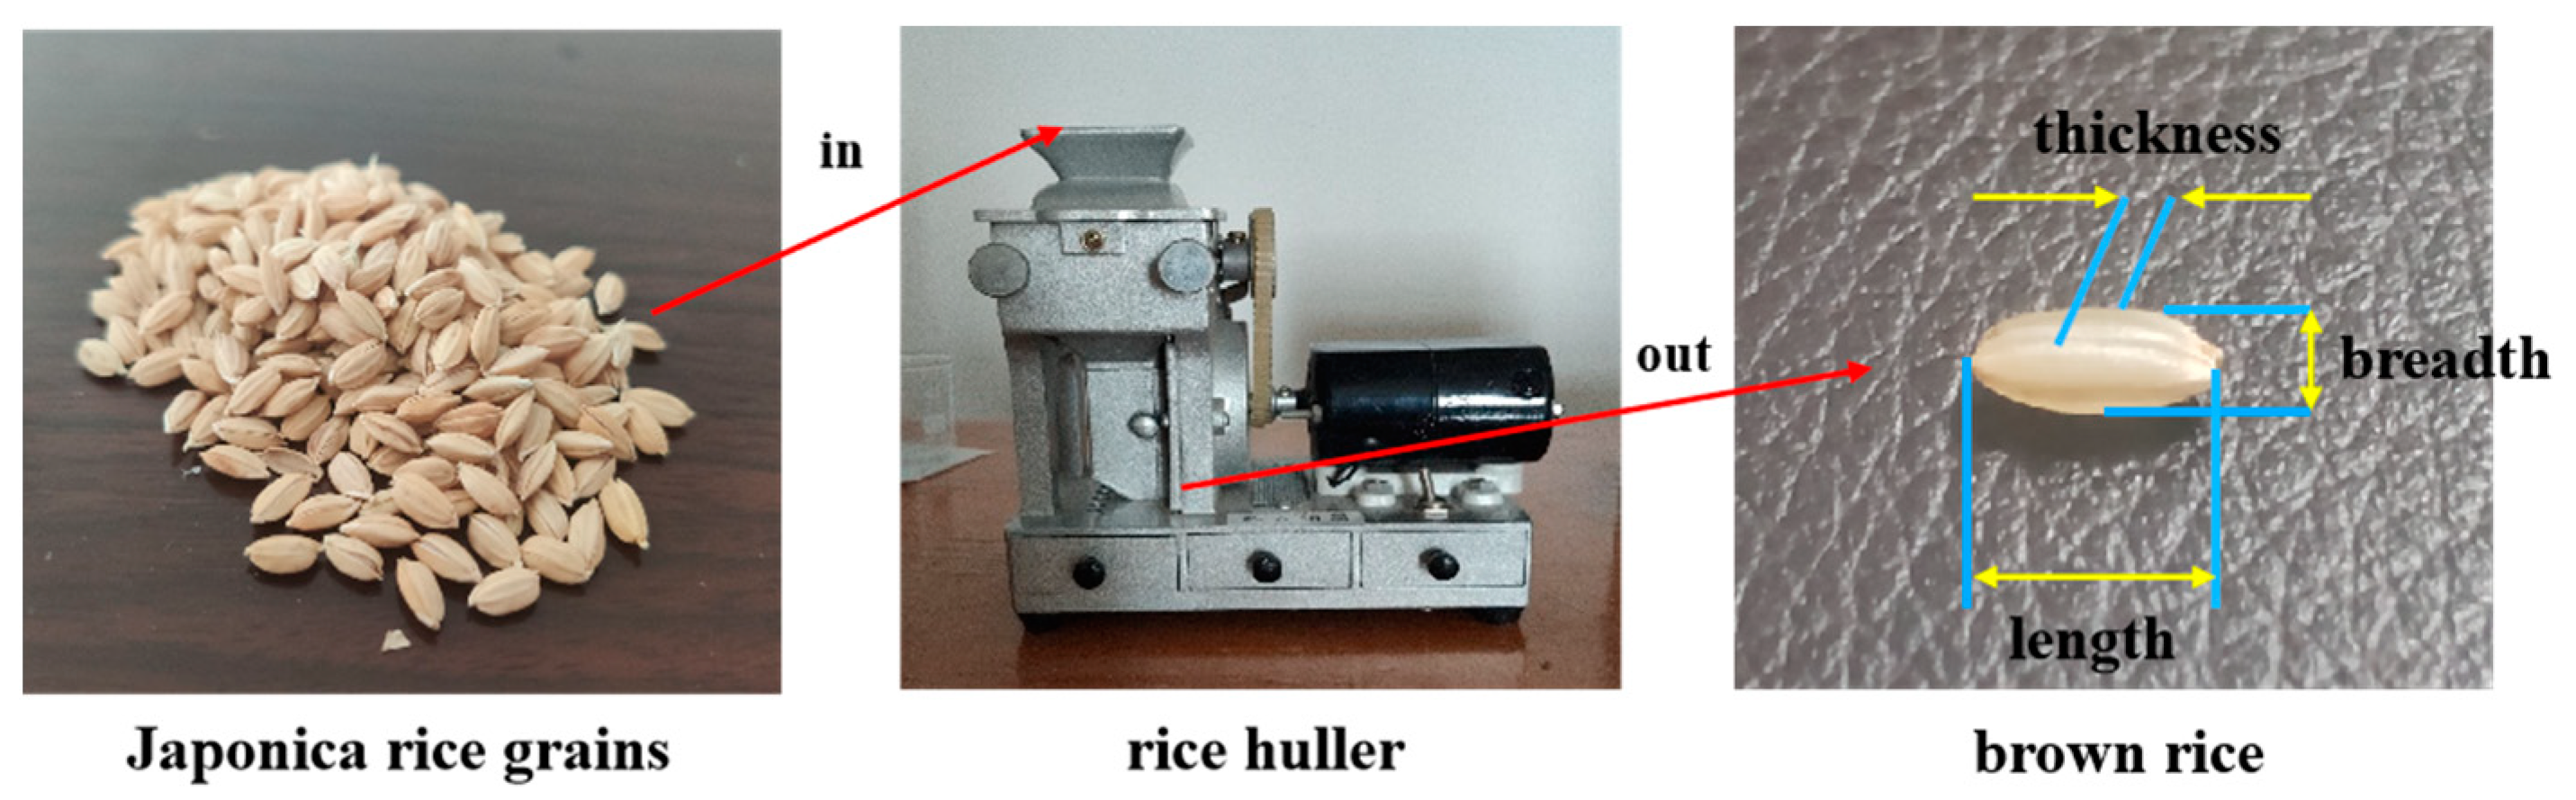
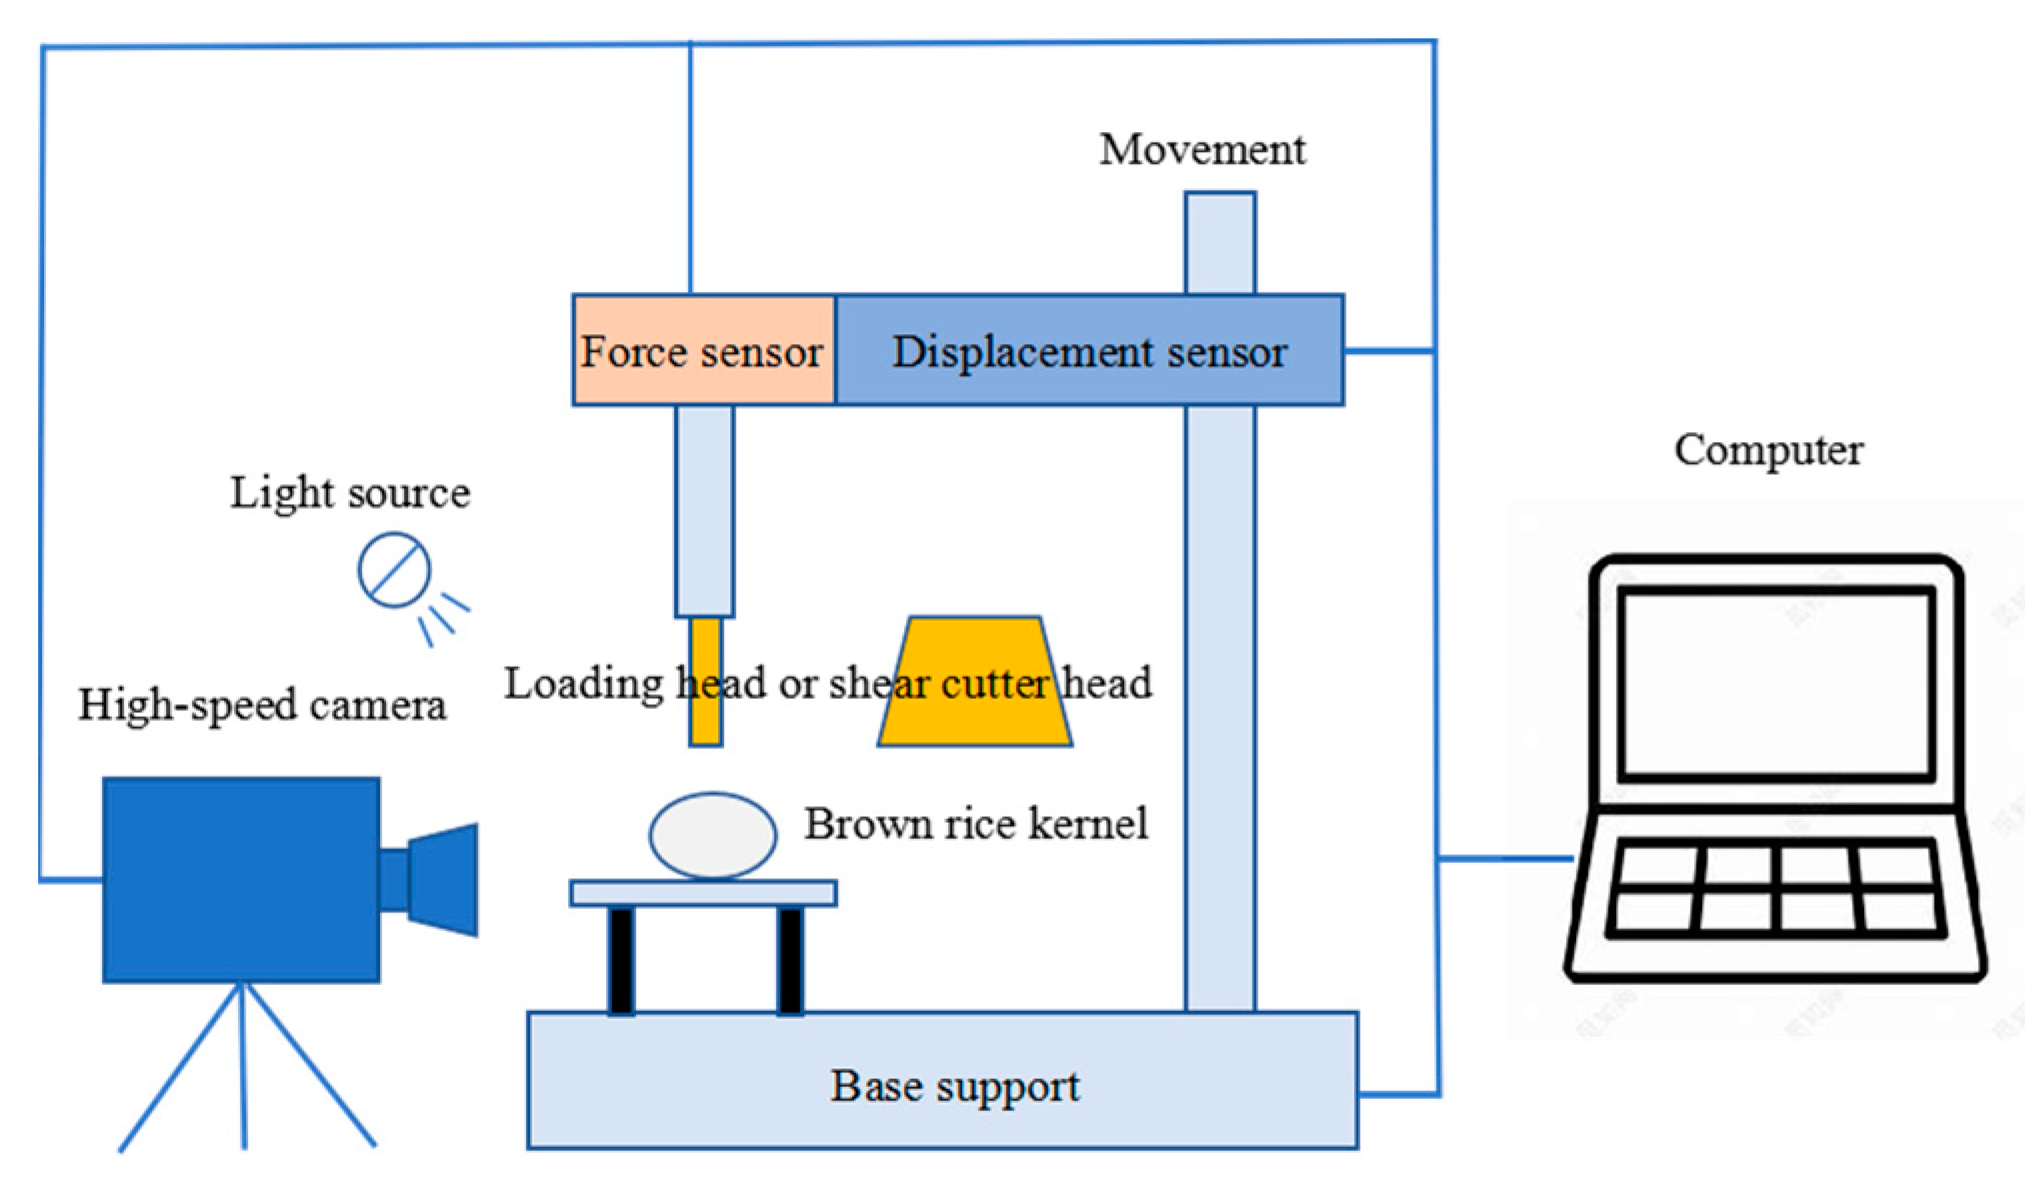
2.2. Bench Test
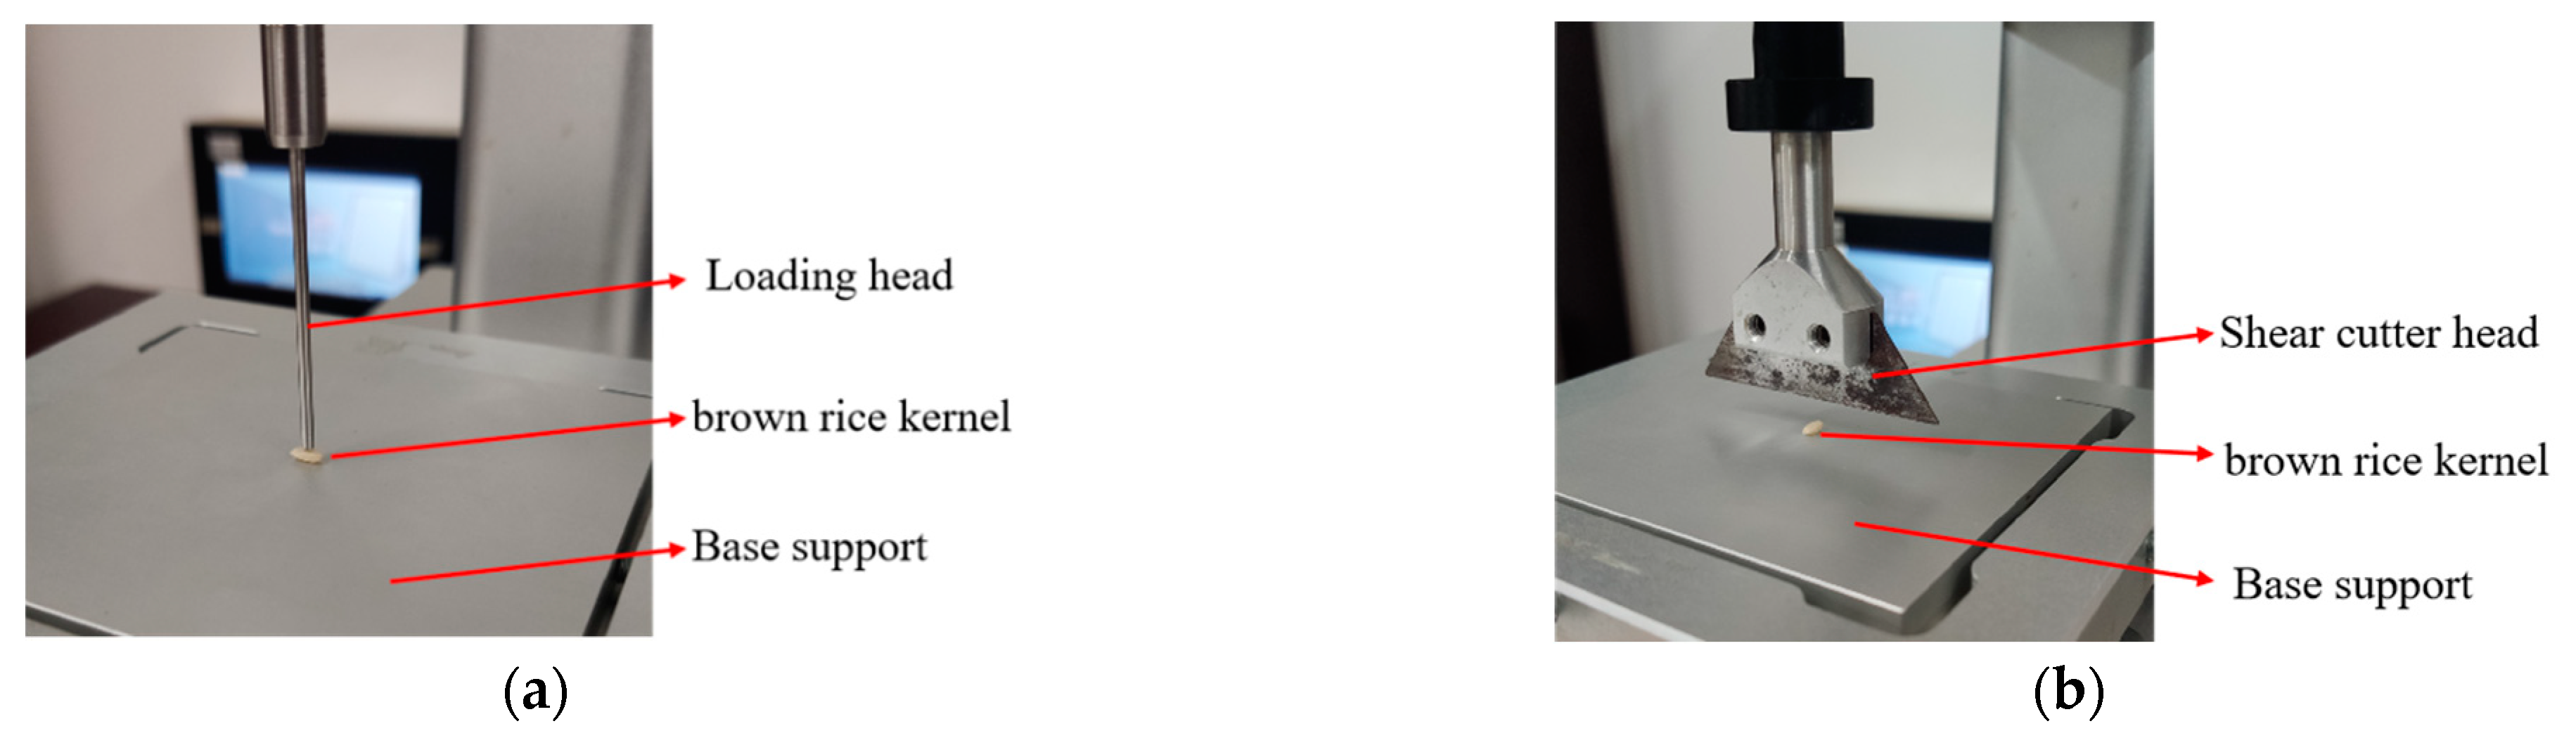
2.2.1. Extrusion and Shear Test
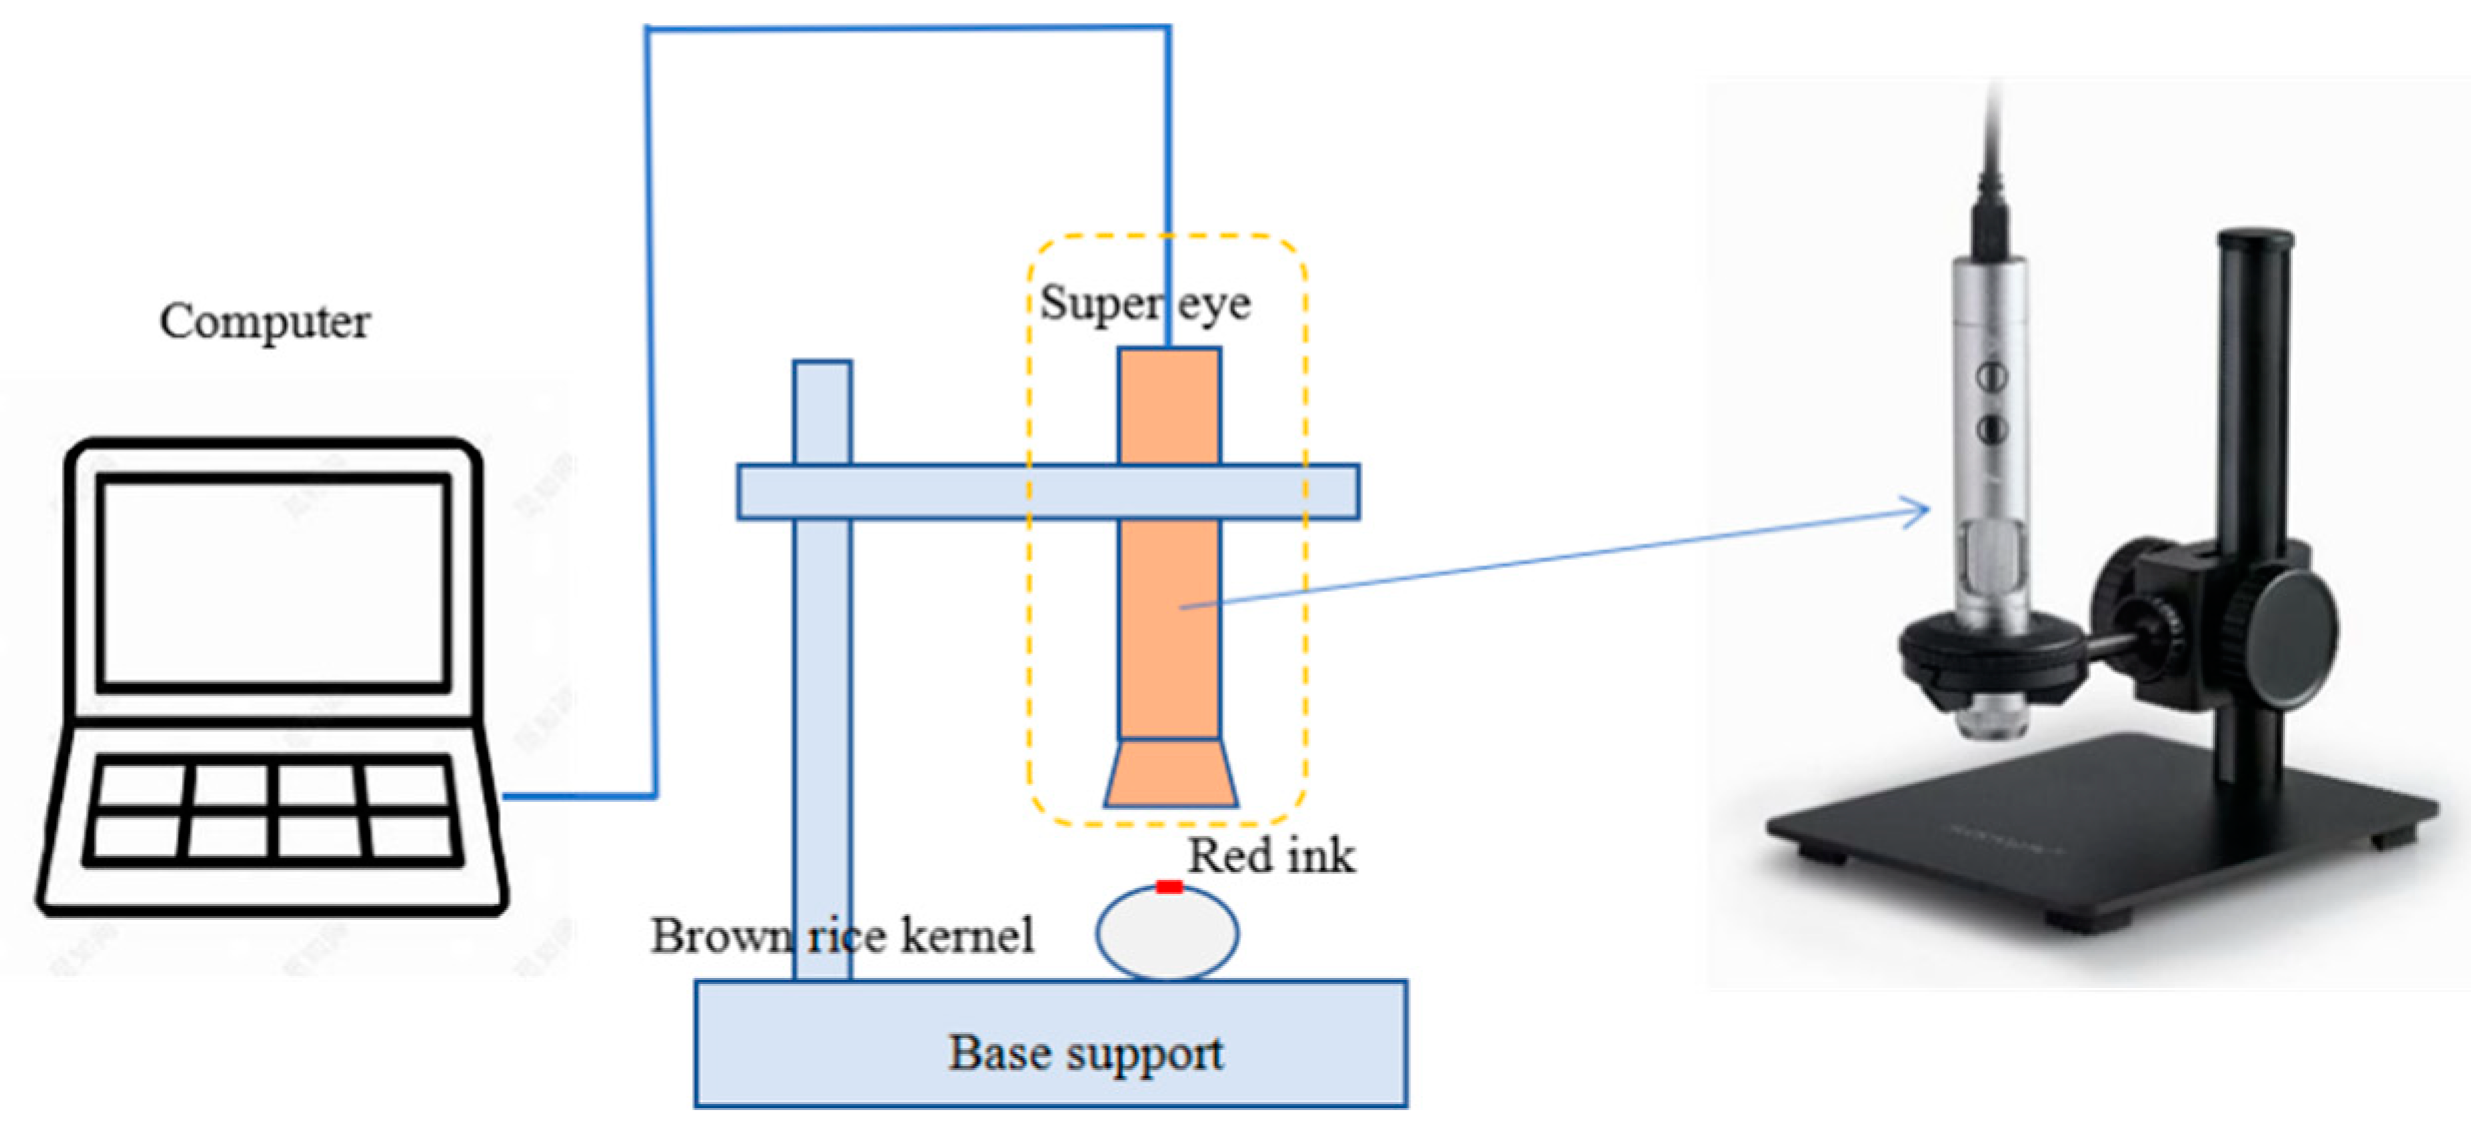
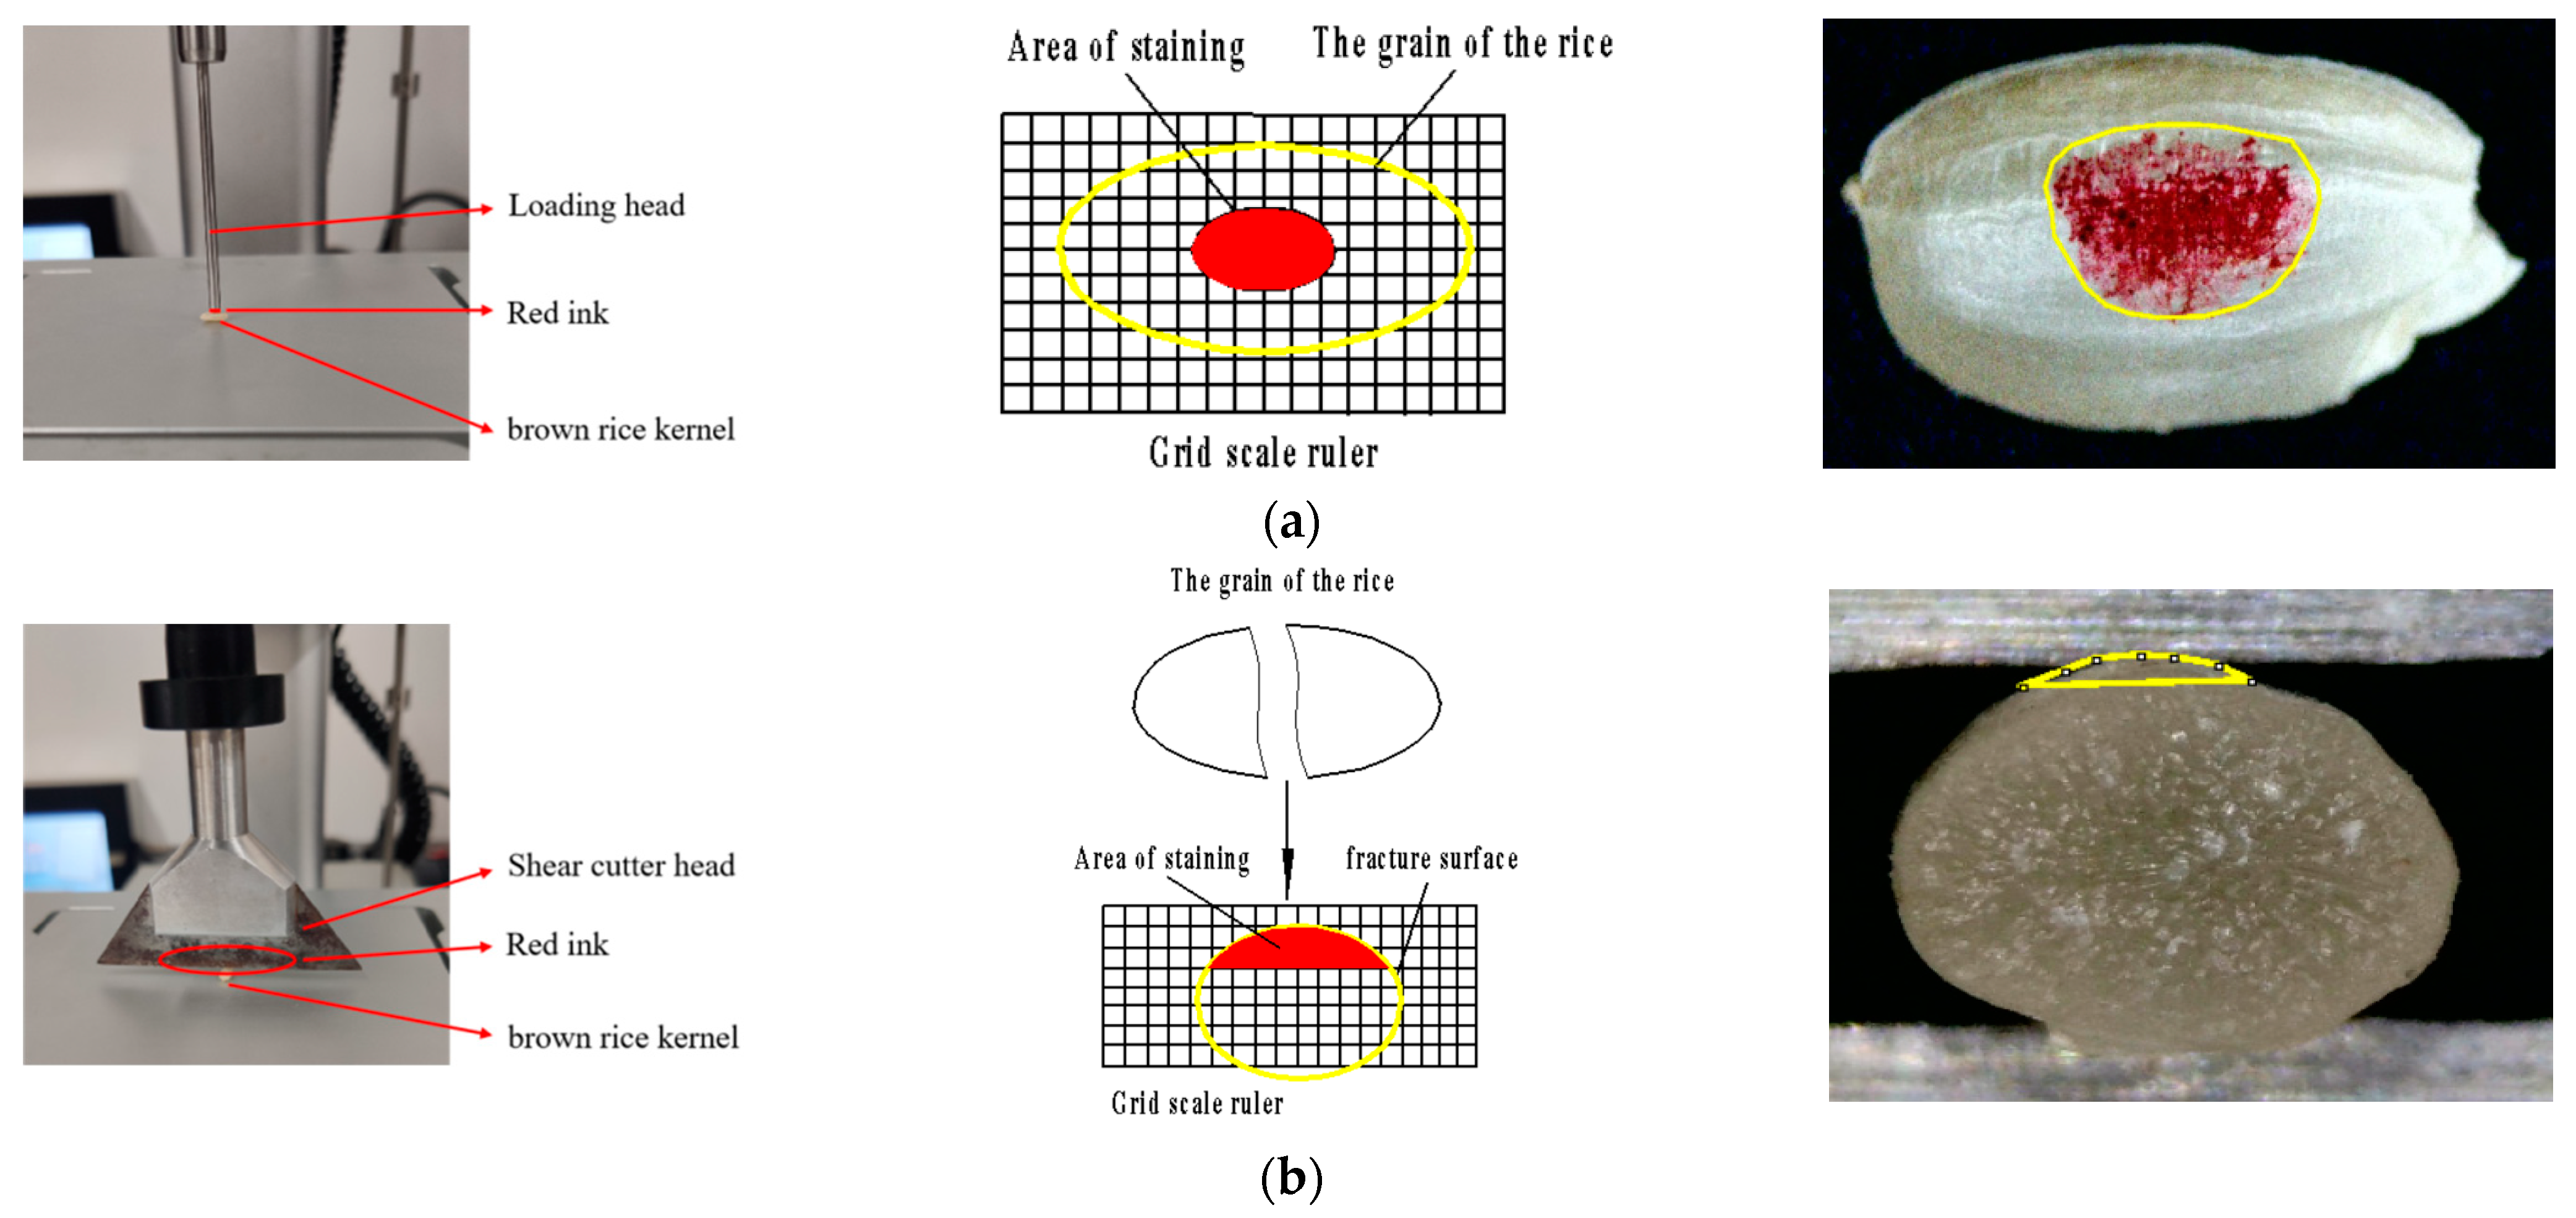
2.2.2. Estimation of Contact Area
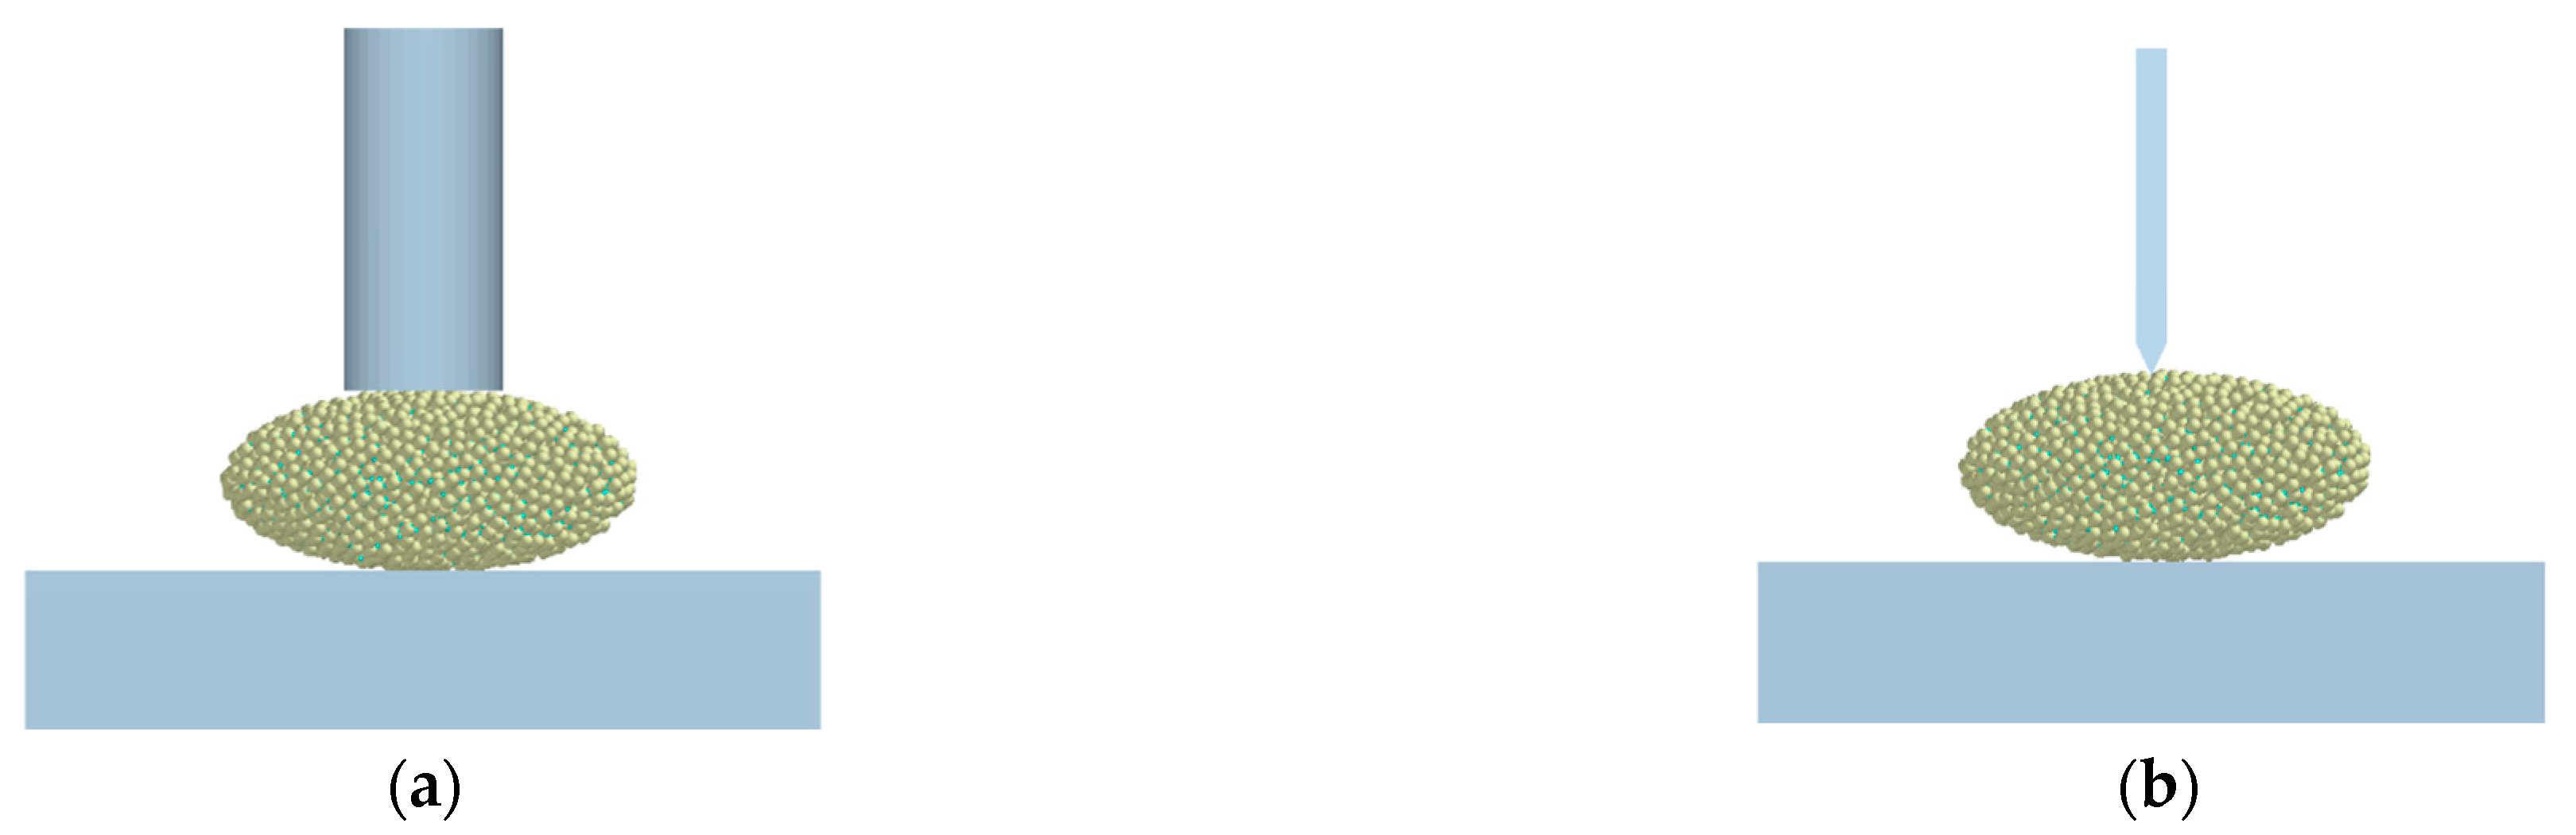
2.3. EDEM Simulation Experiment
3. Results
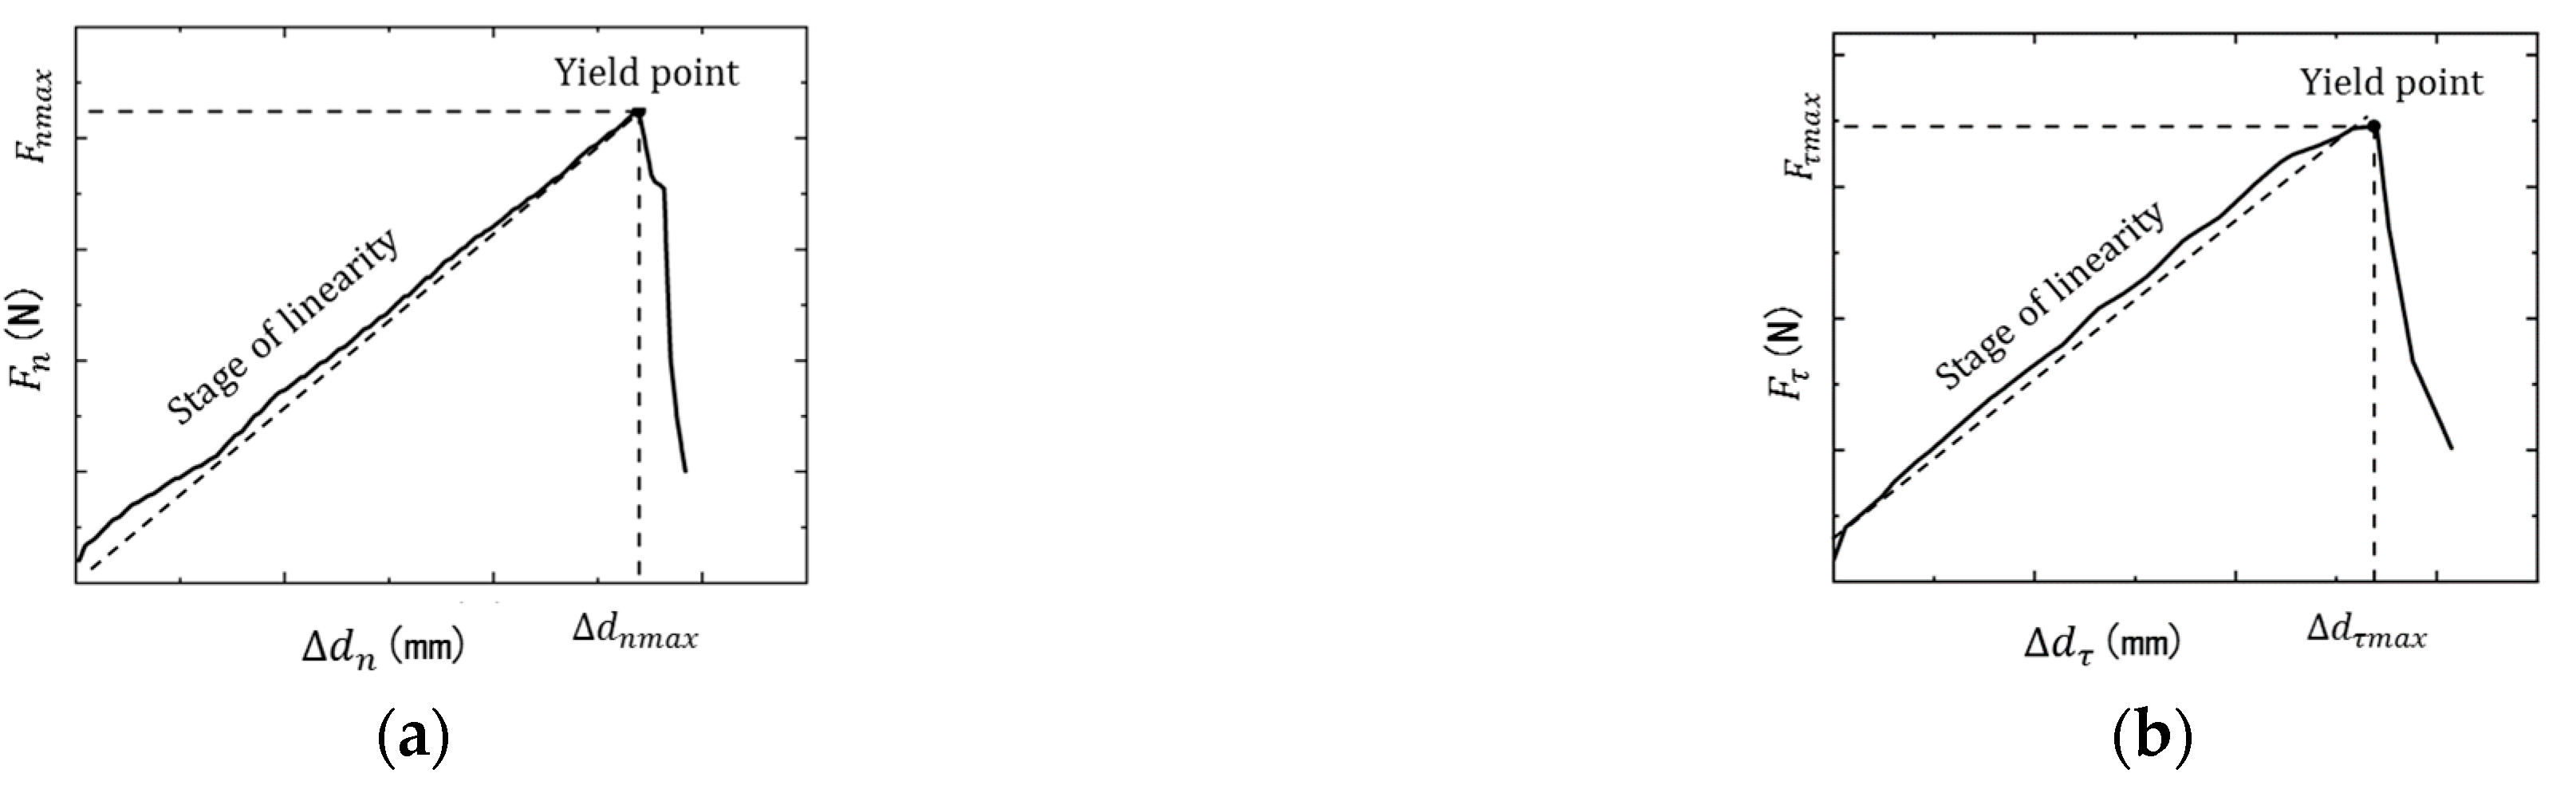
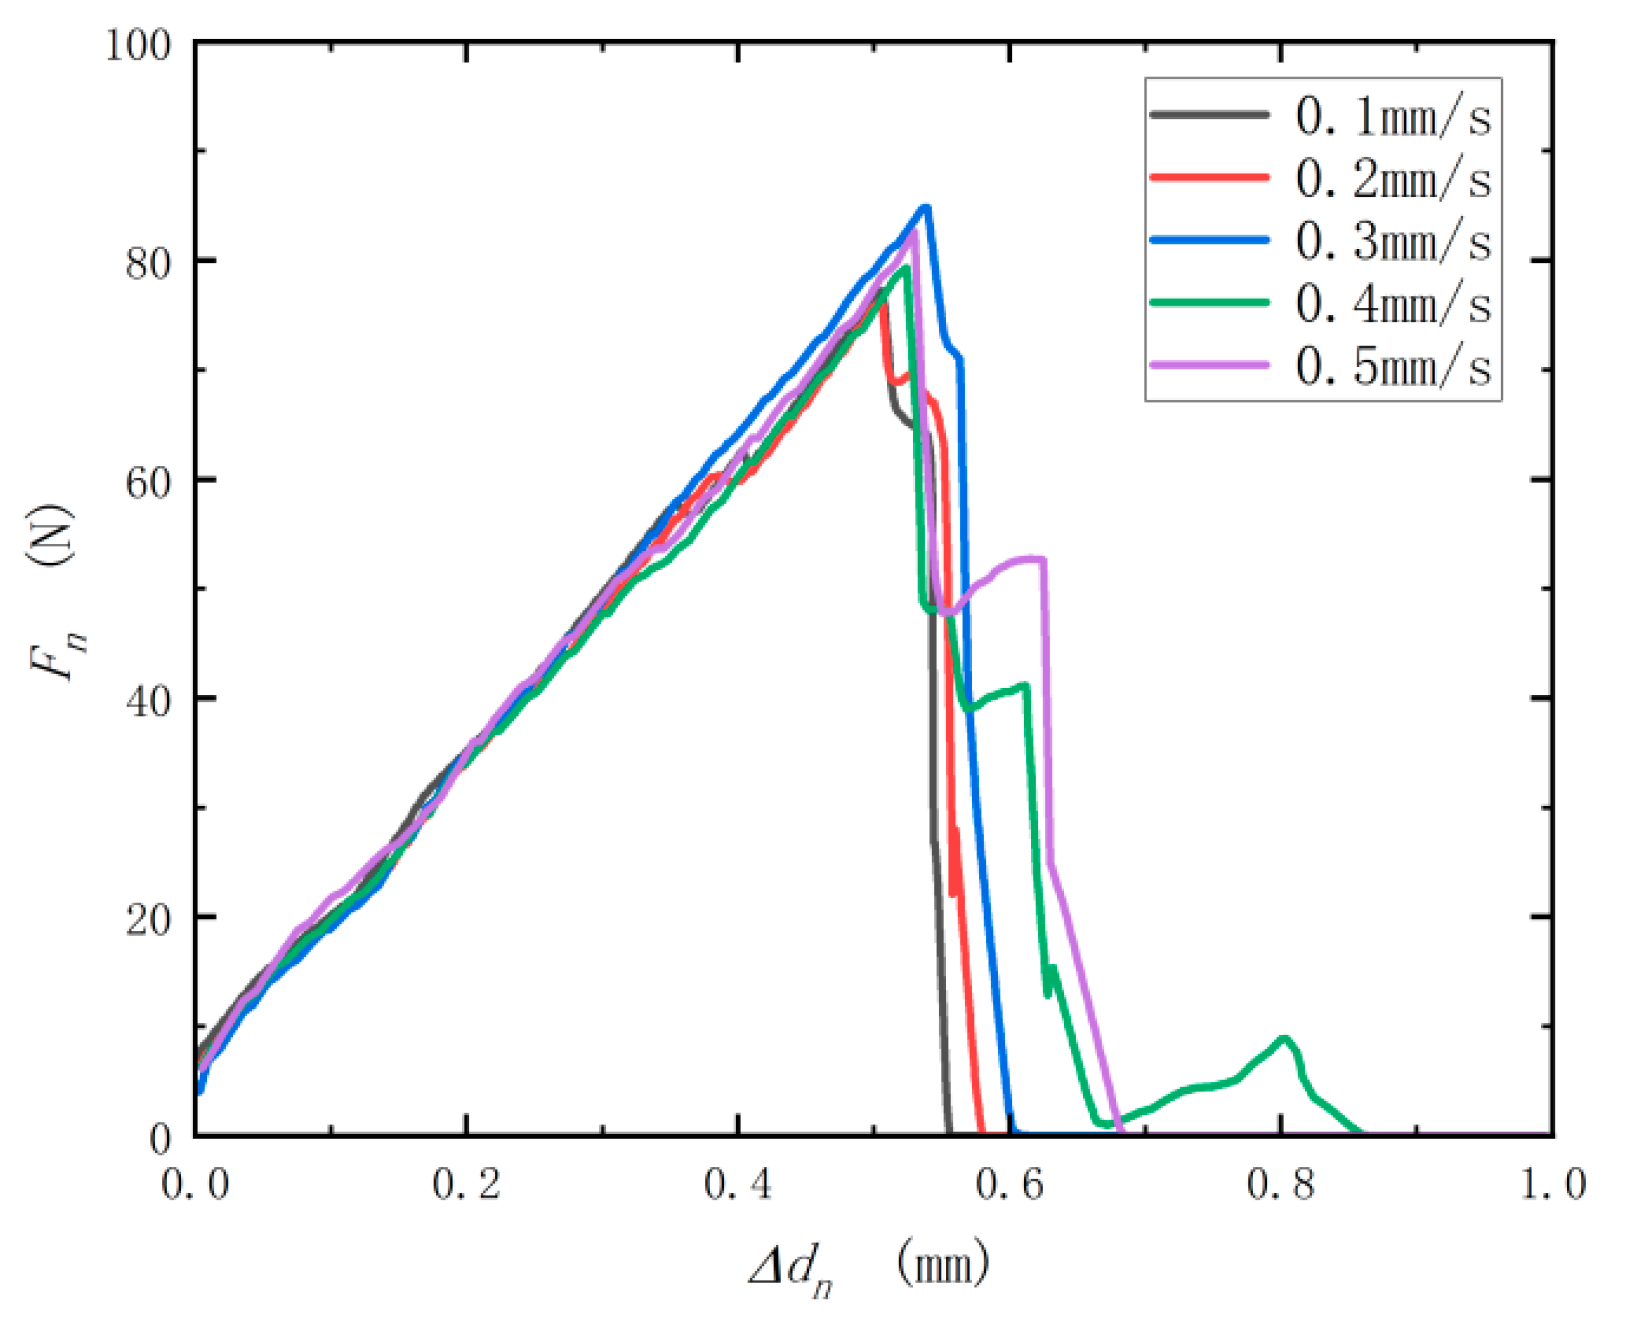
3.1. Extrusion Test
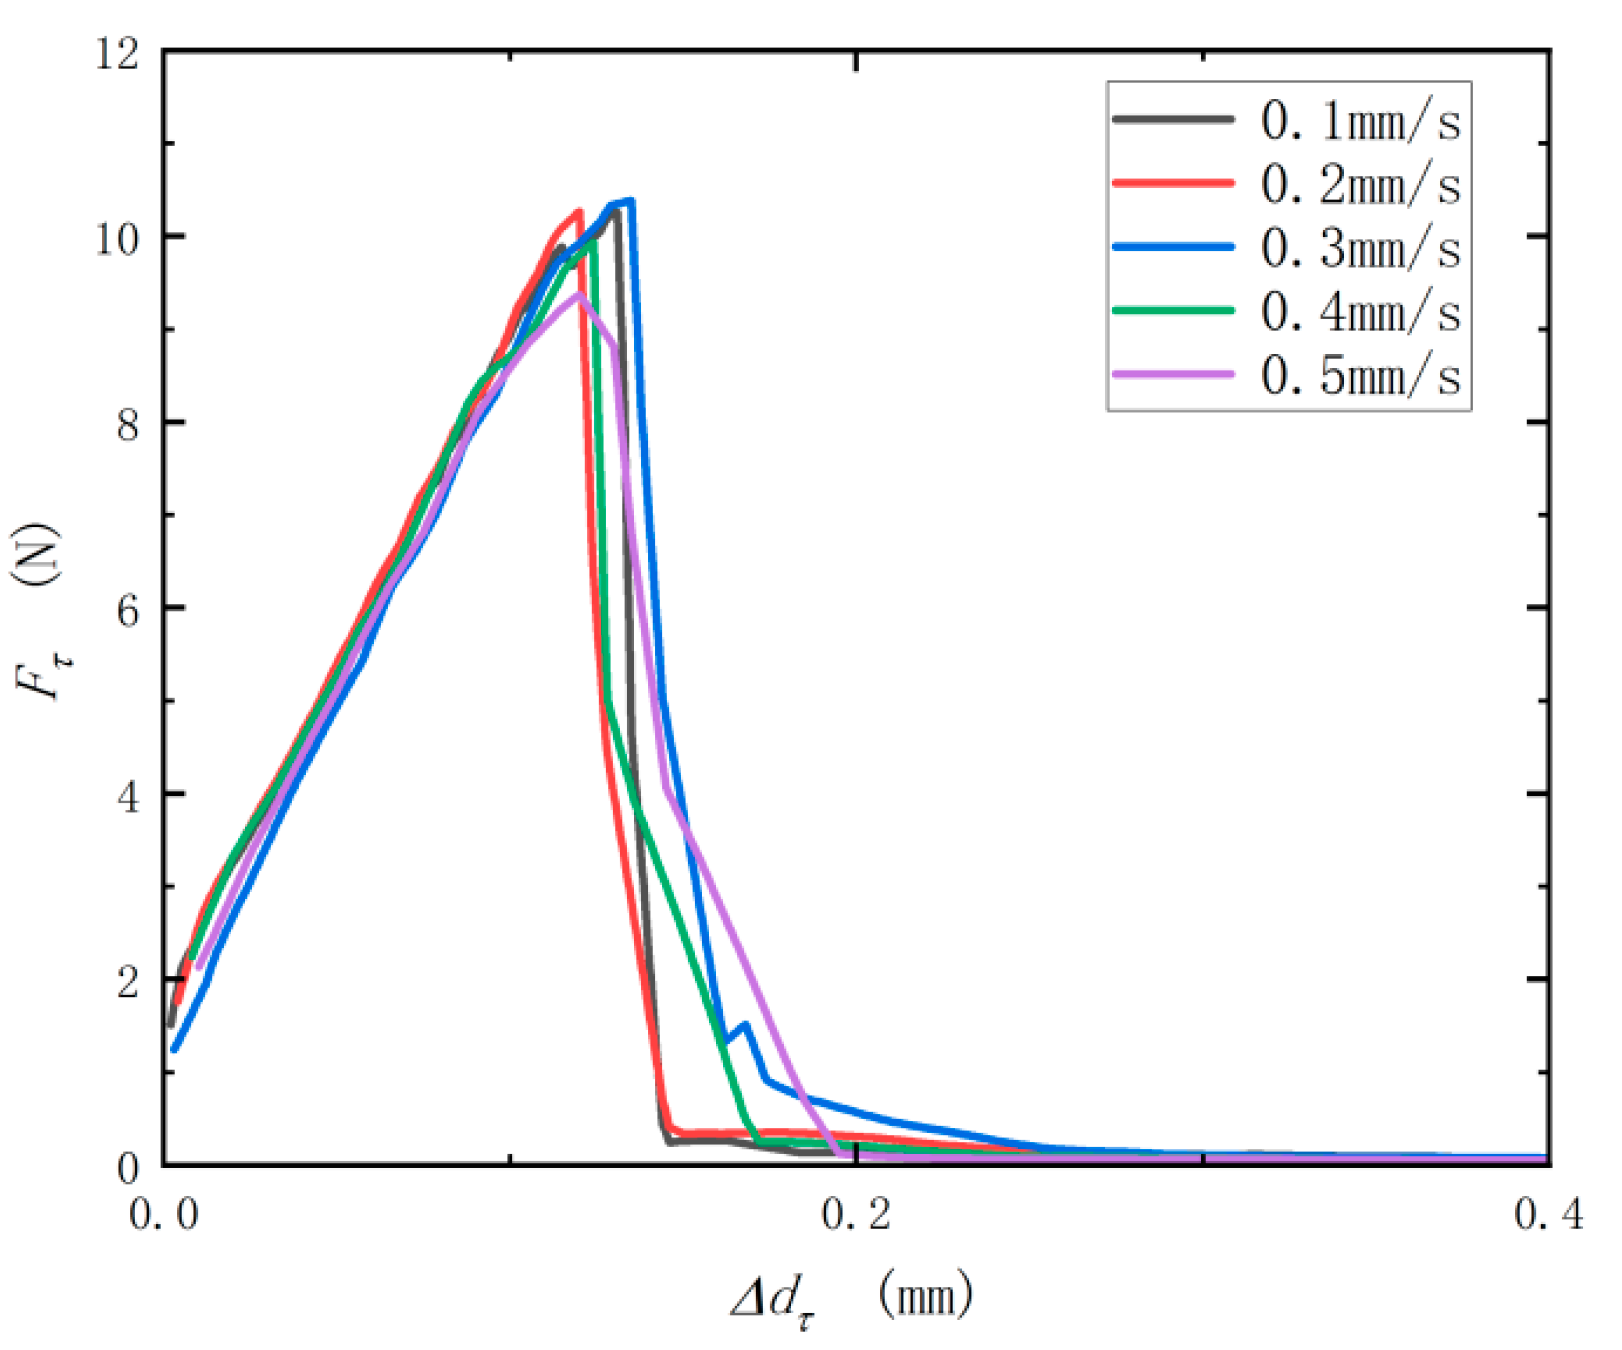
3.2. Shear Test
3.3. Analysis of Test Results
3.4. Calculation of Bonding Parameters
3.5. Simulation Calibration
3.6. Verification of Results
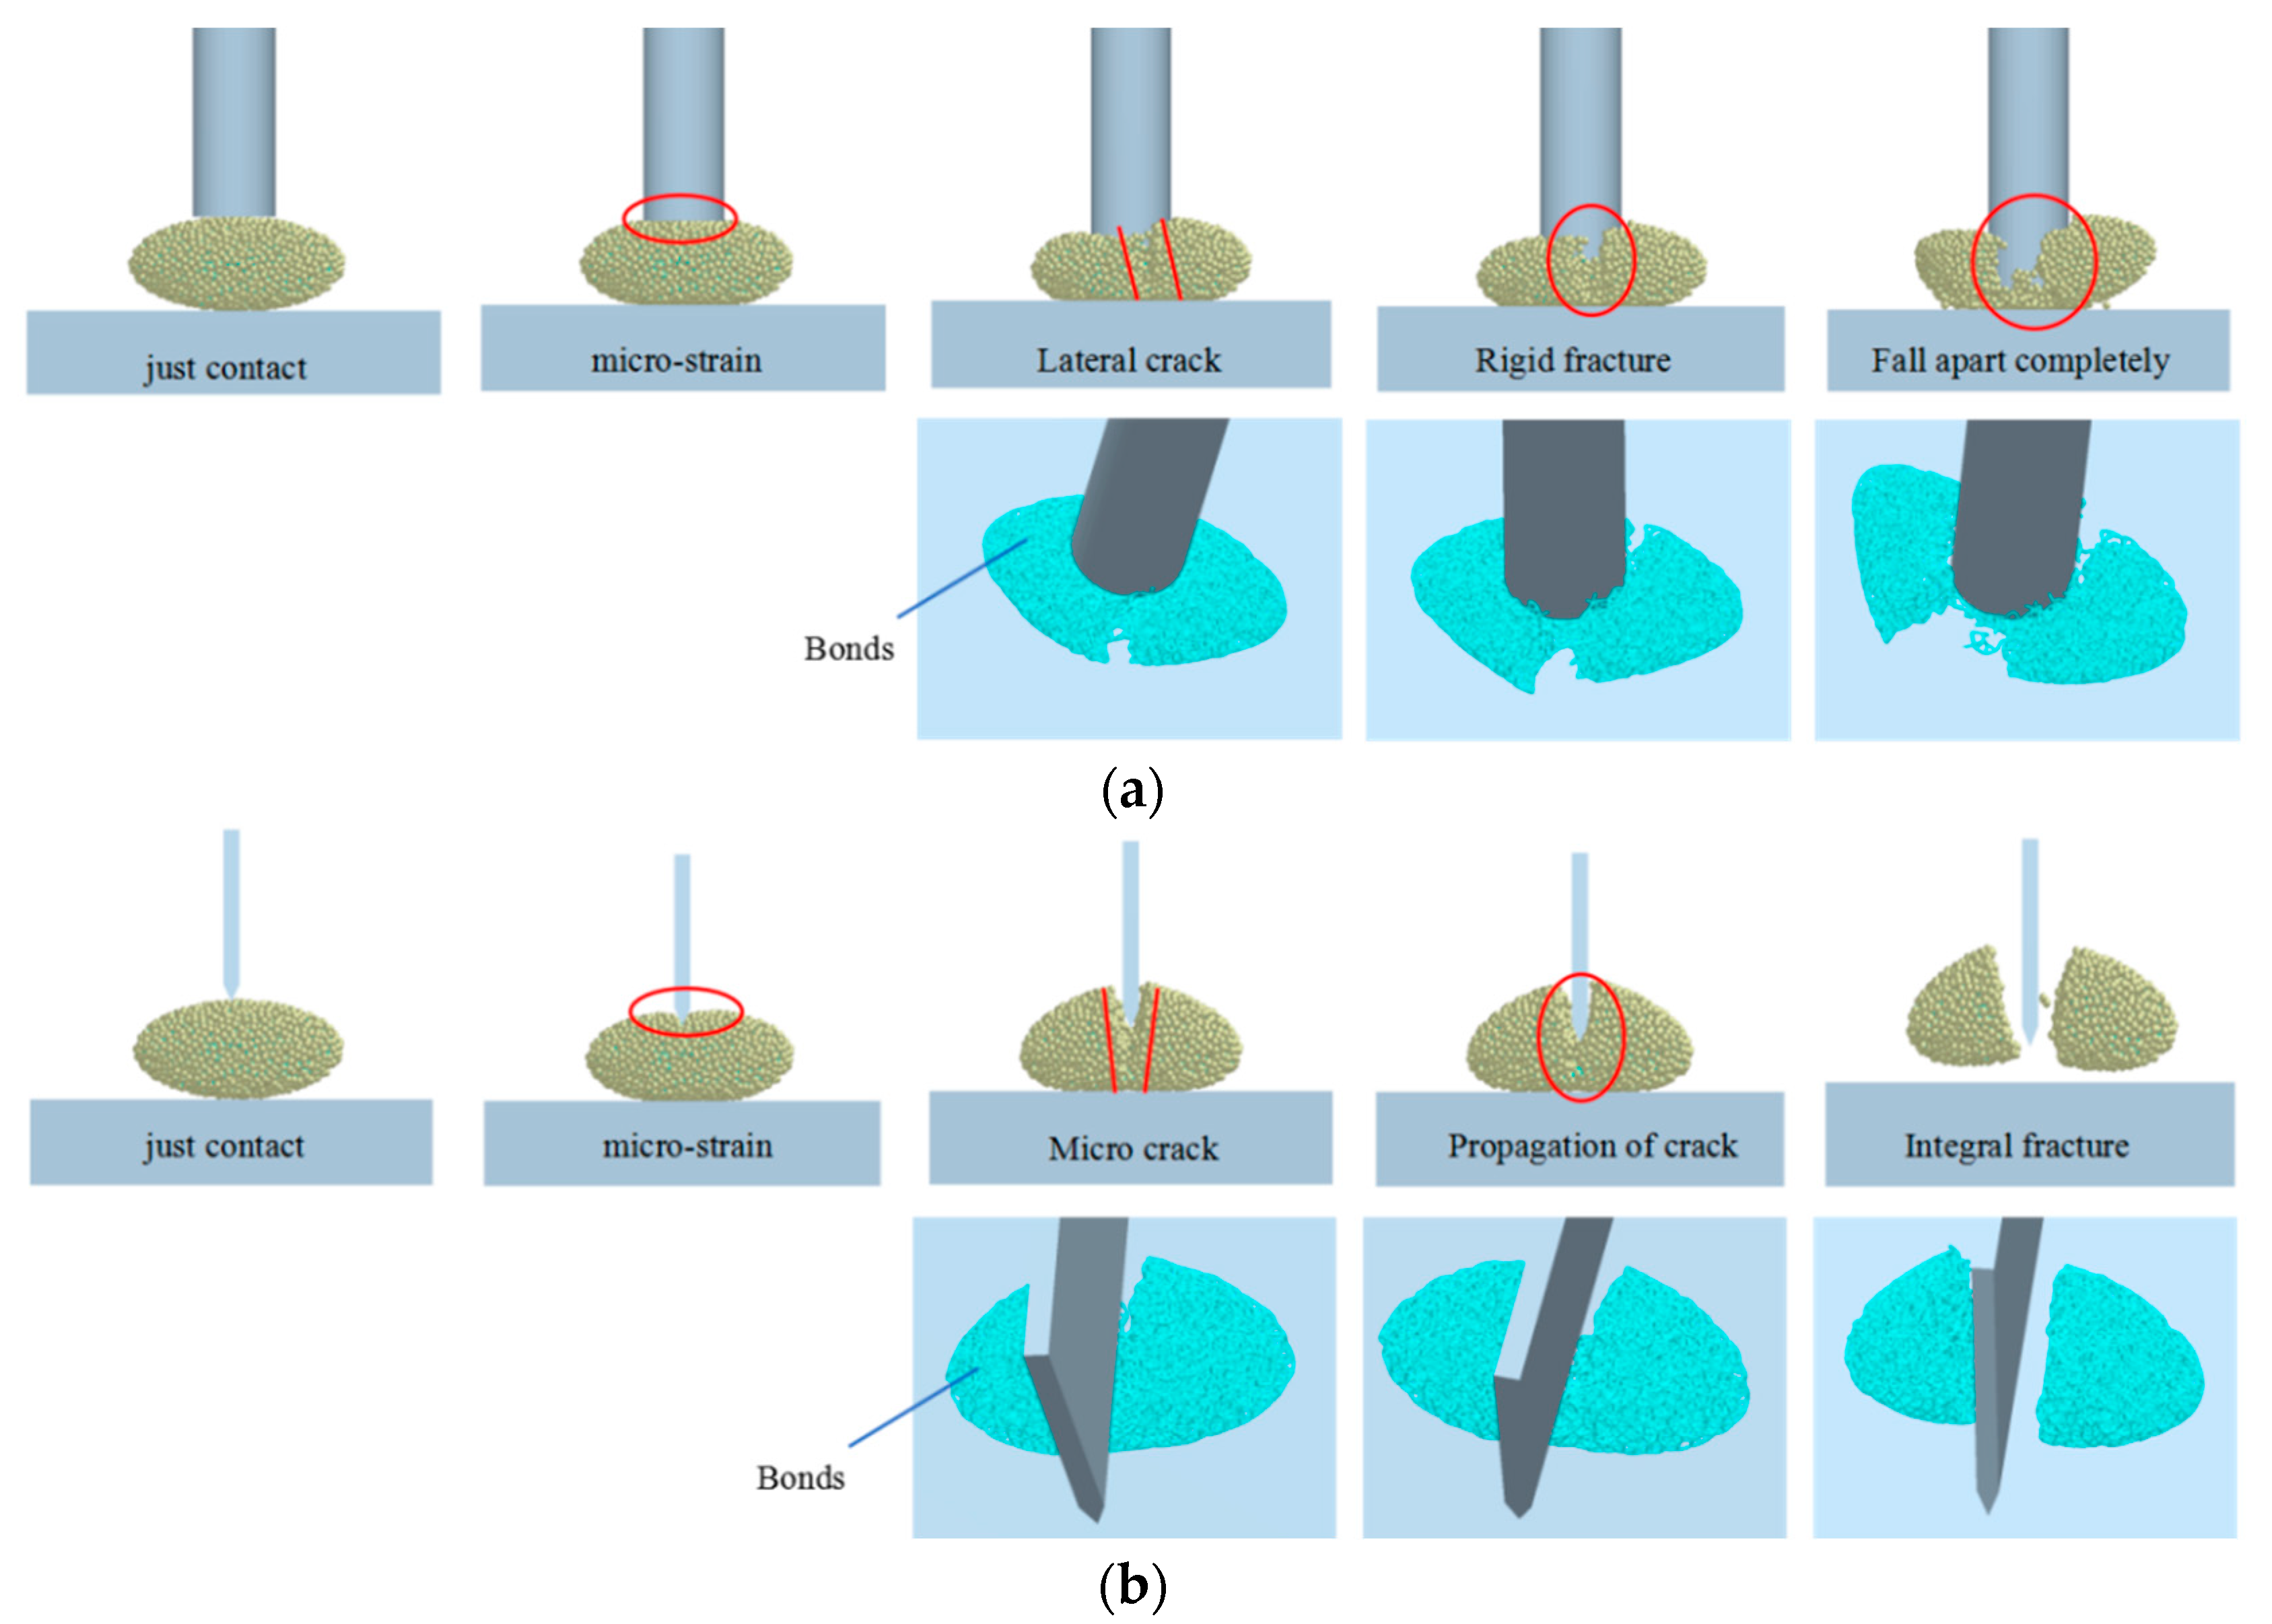
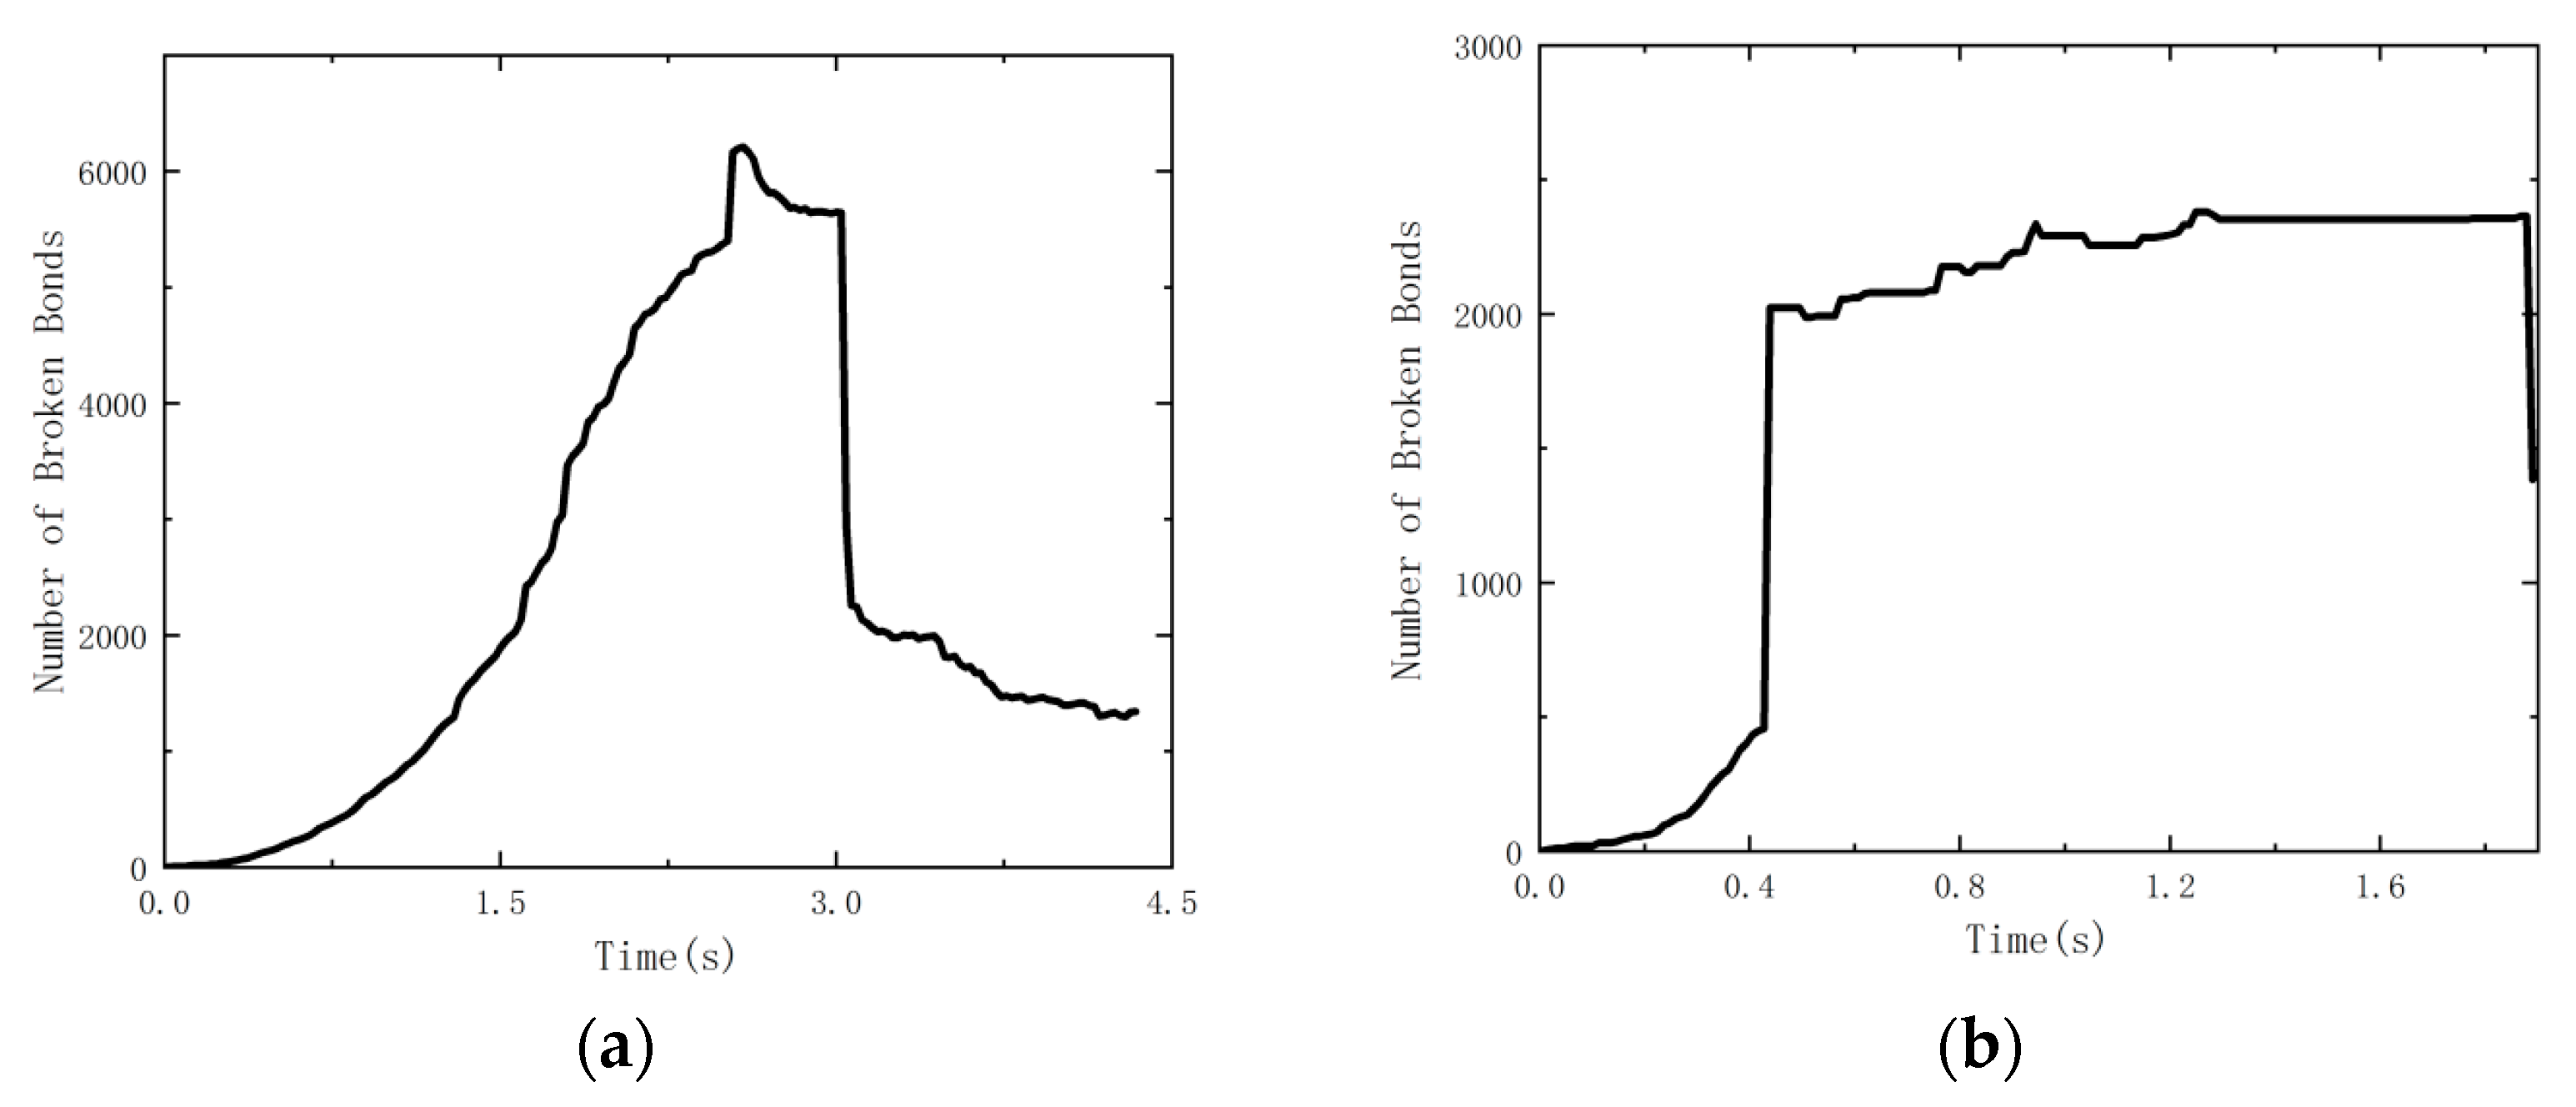
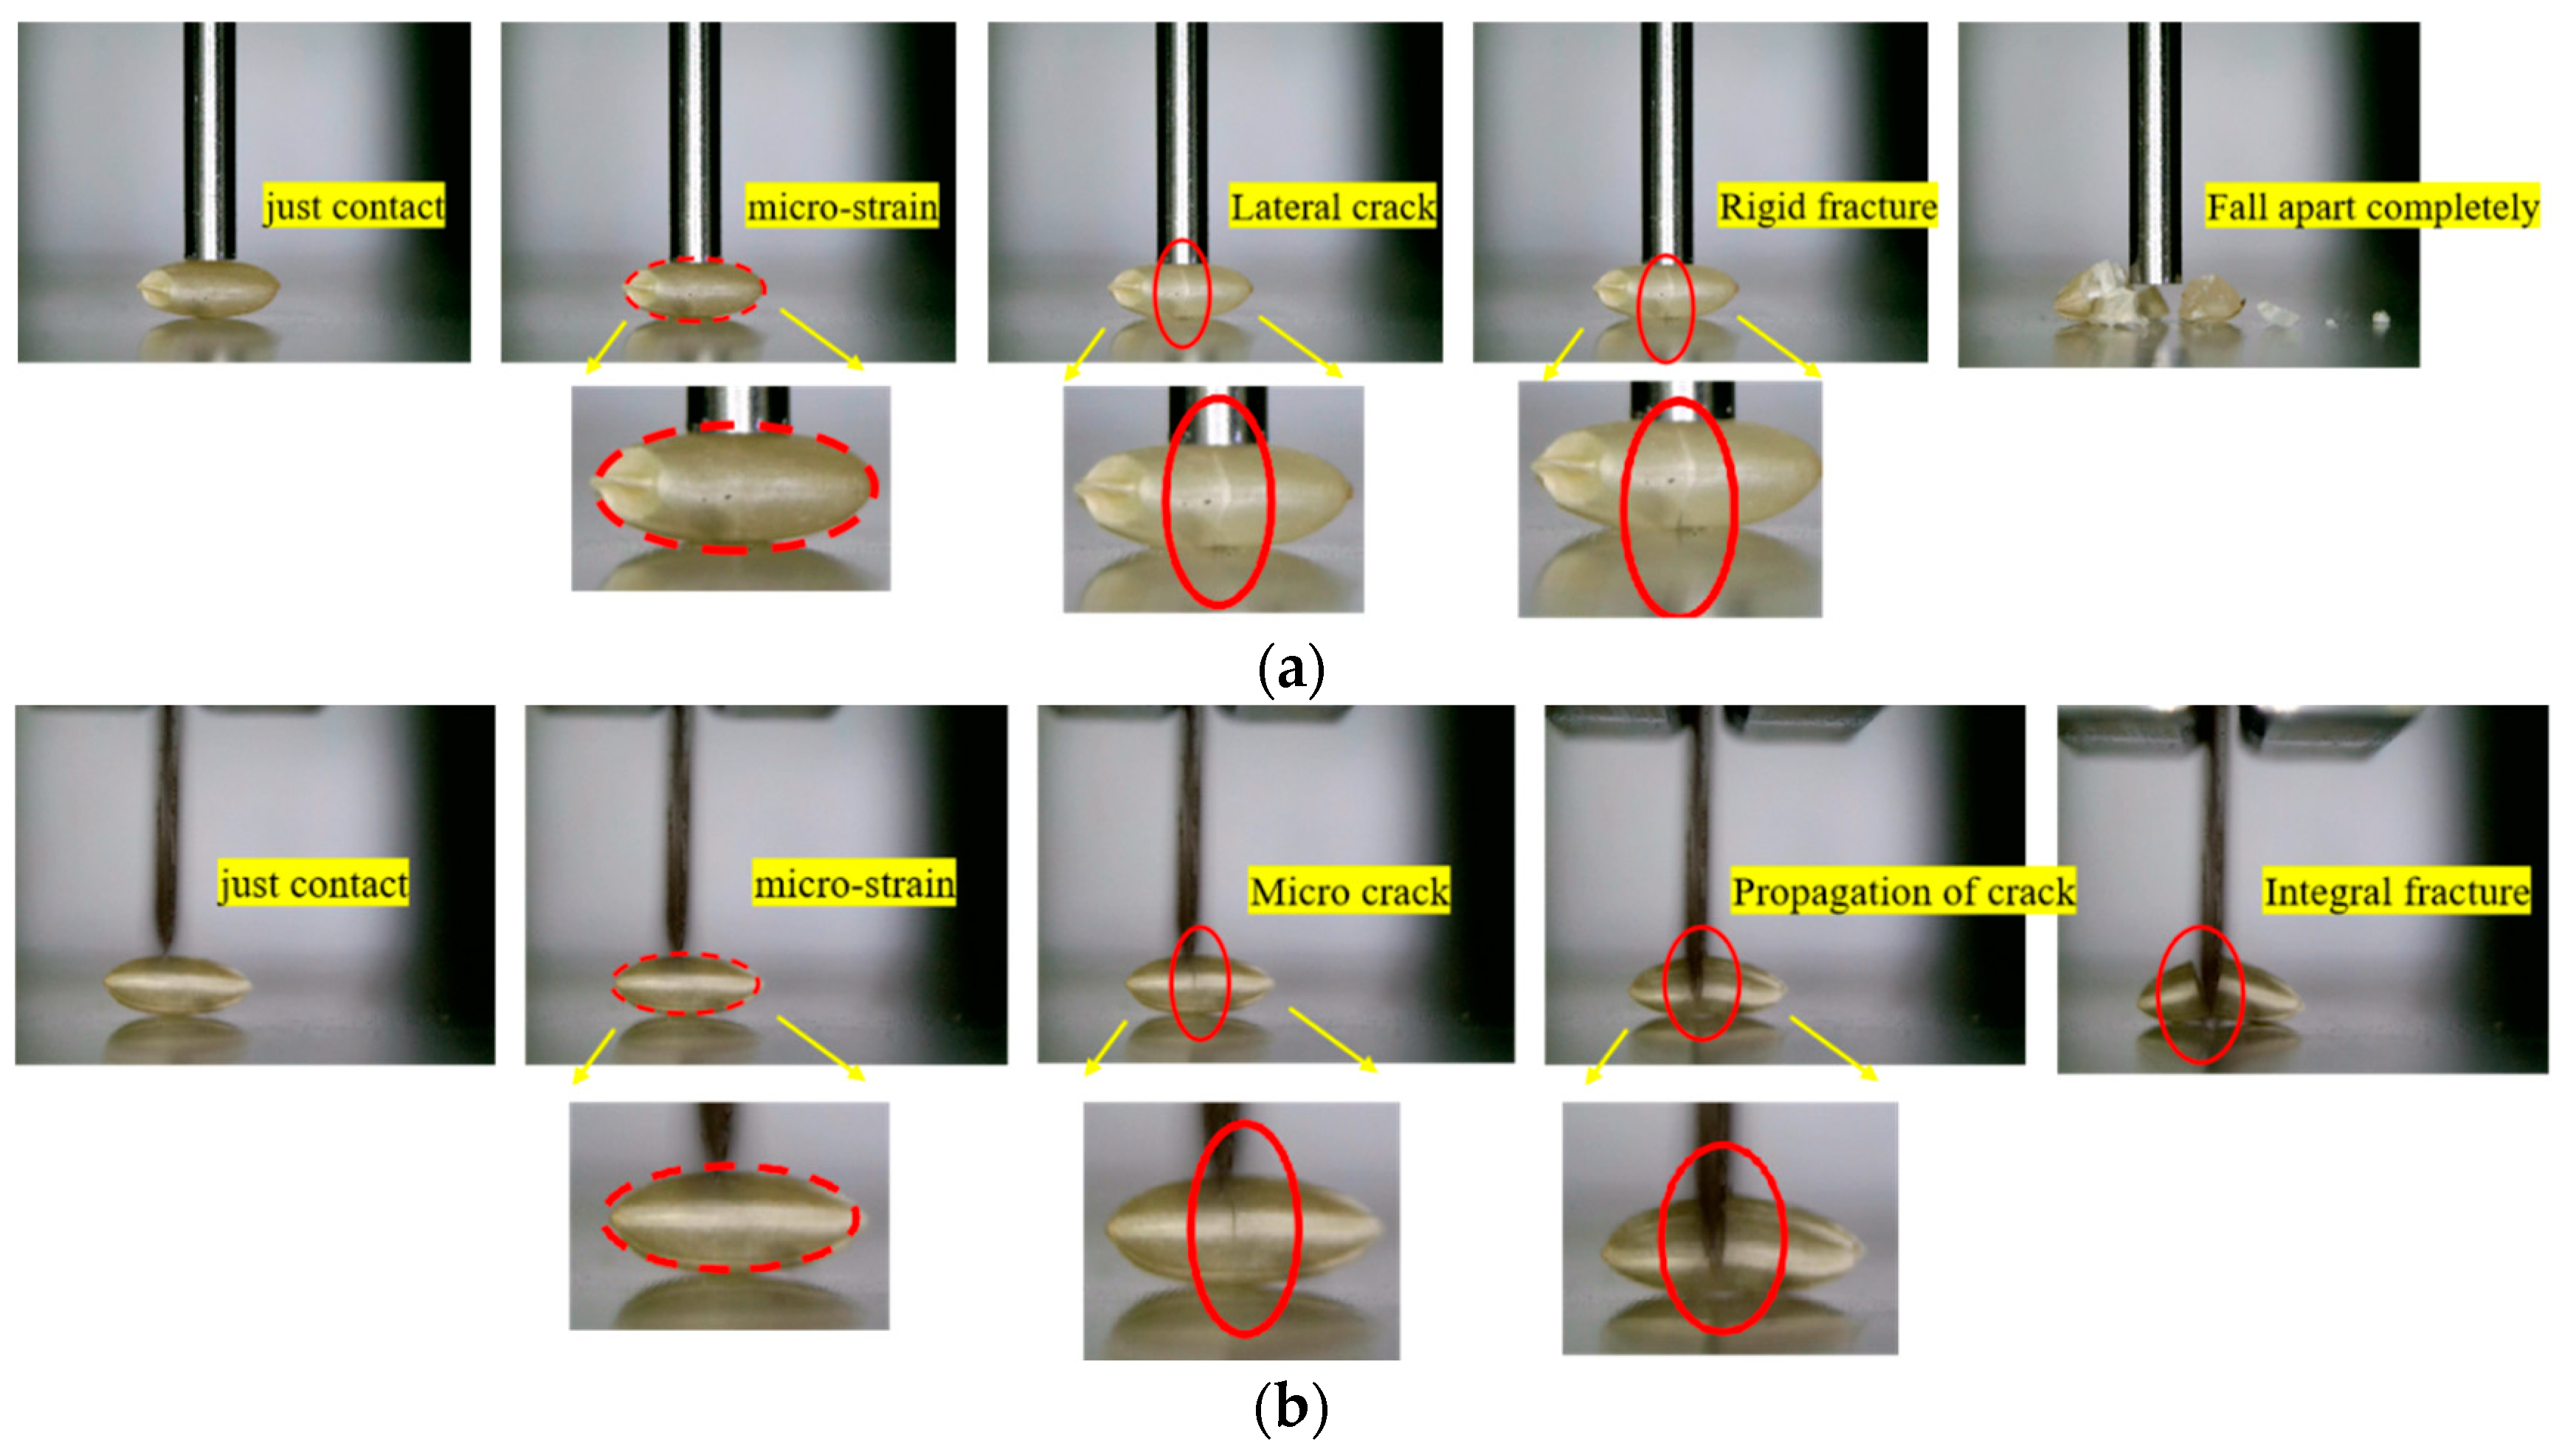
3.7. Analysis of Brown Rice Kernels’ Crushing Process
4. Conclusions
- (1)
- By carrying out extrusion, shear, and staining bench tests, the bond parameters of the discrete element model of brown rice kernels were tested and calculated. The critical normal stiffness Cn and the critical shear stiffness Cτ were determined to be 2.55 × 10⁷ Pa and 7.92 × 10⁷ Pa, respectively.
- (2)
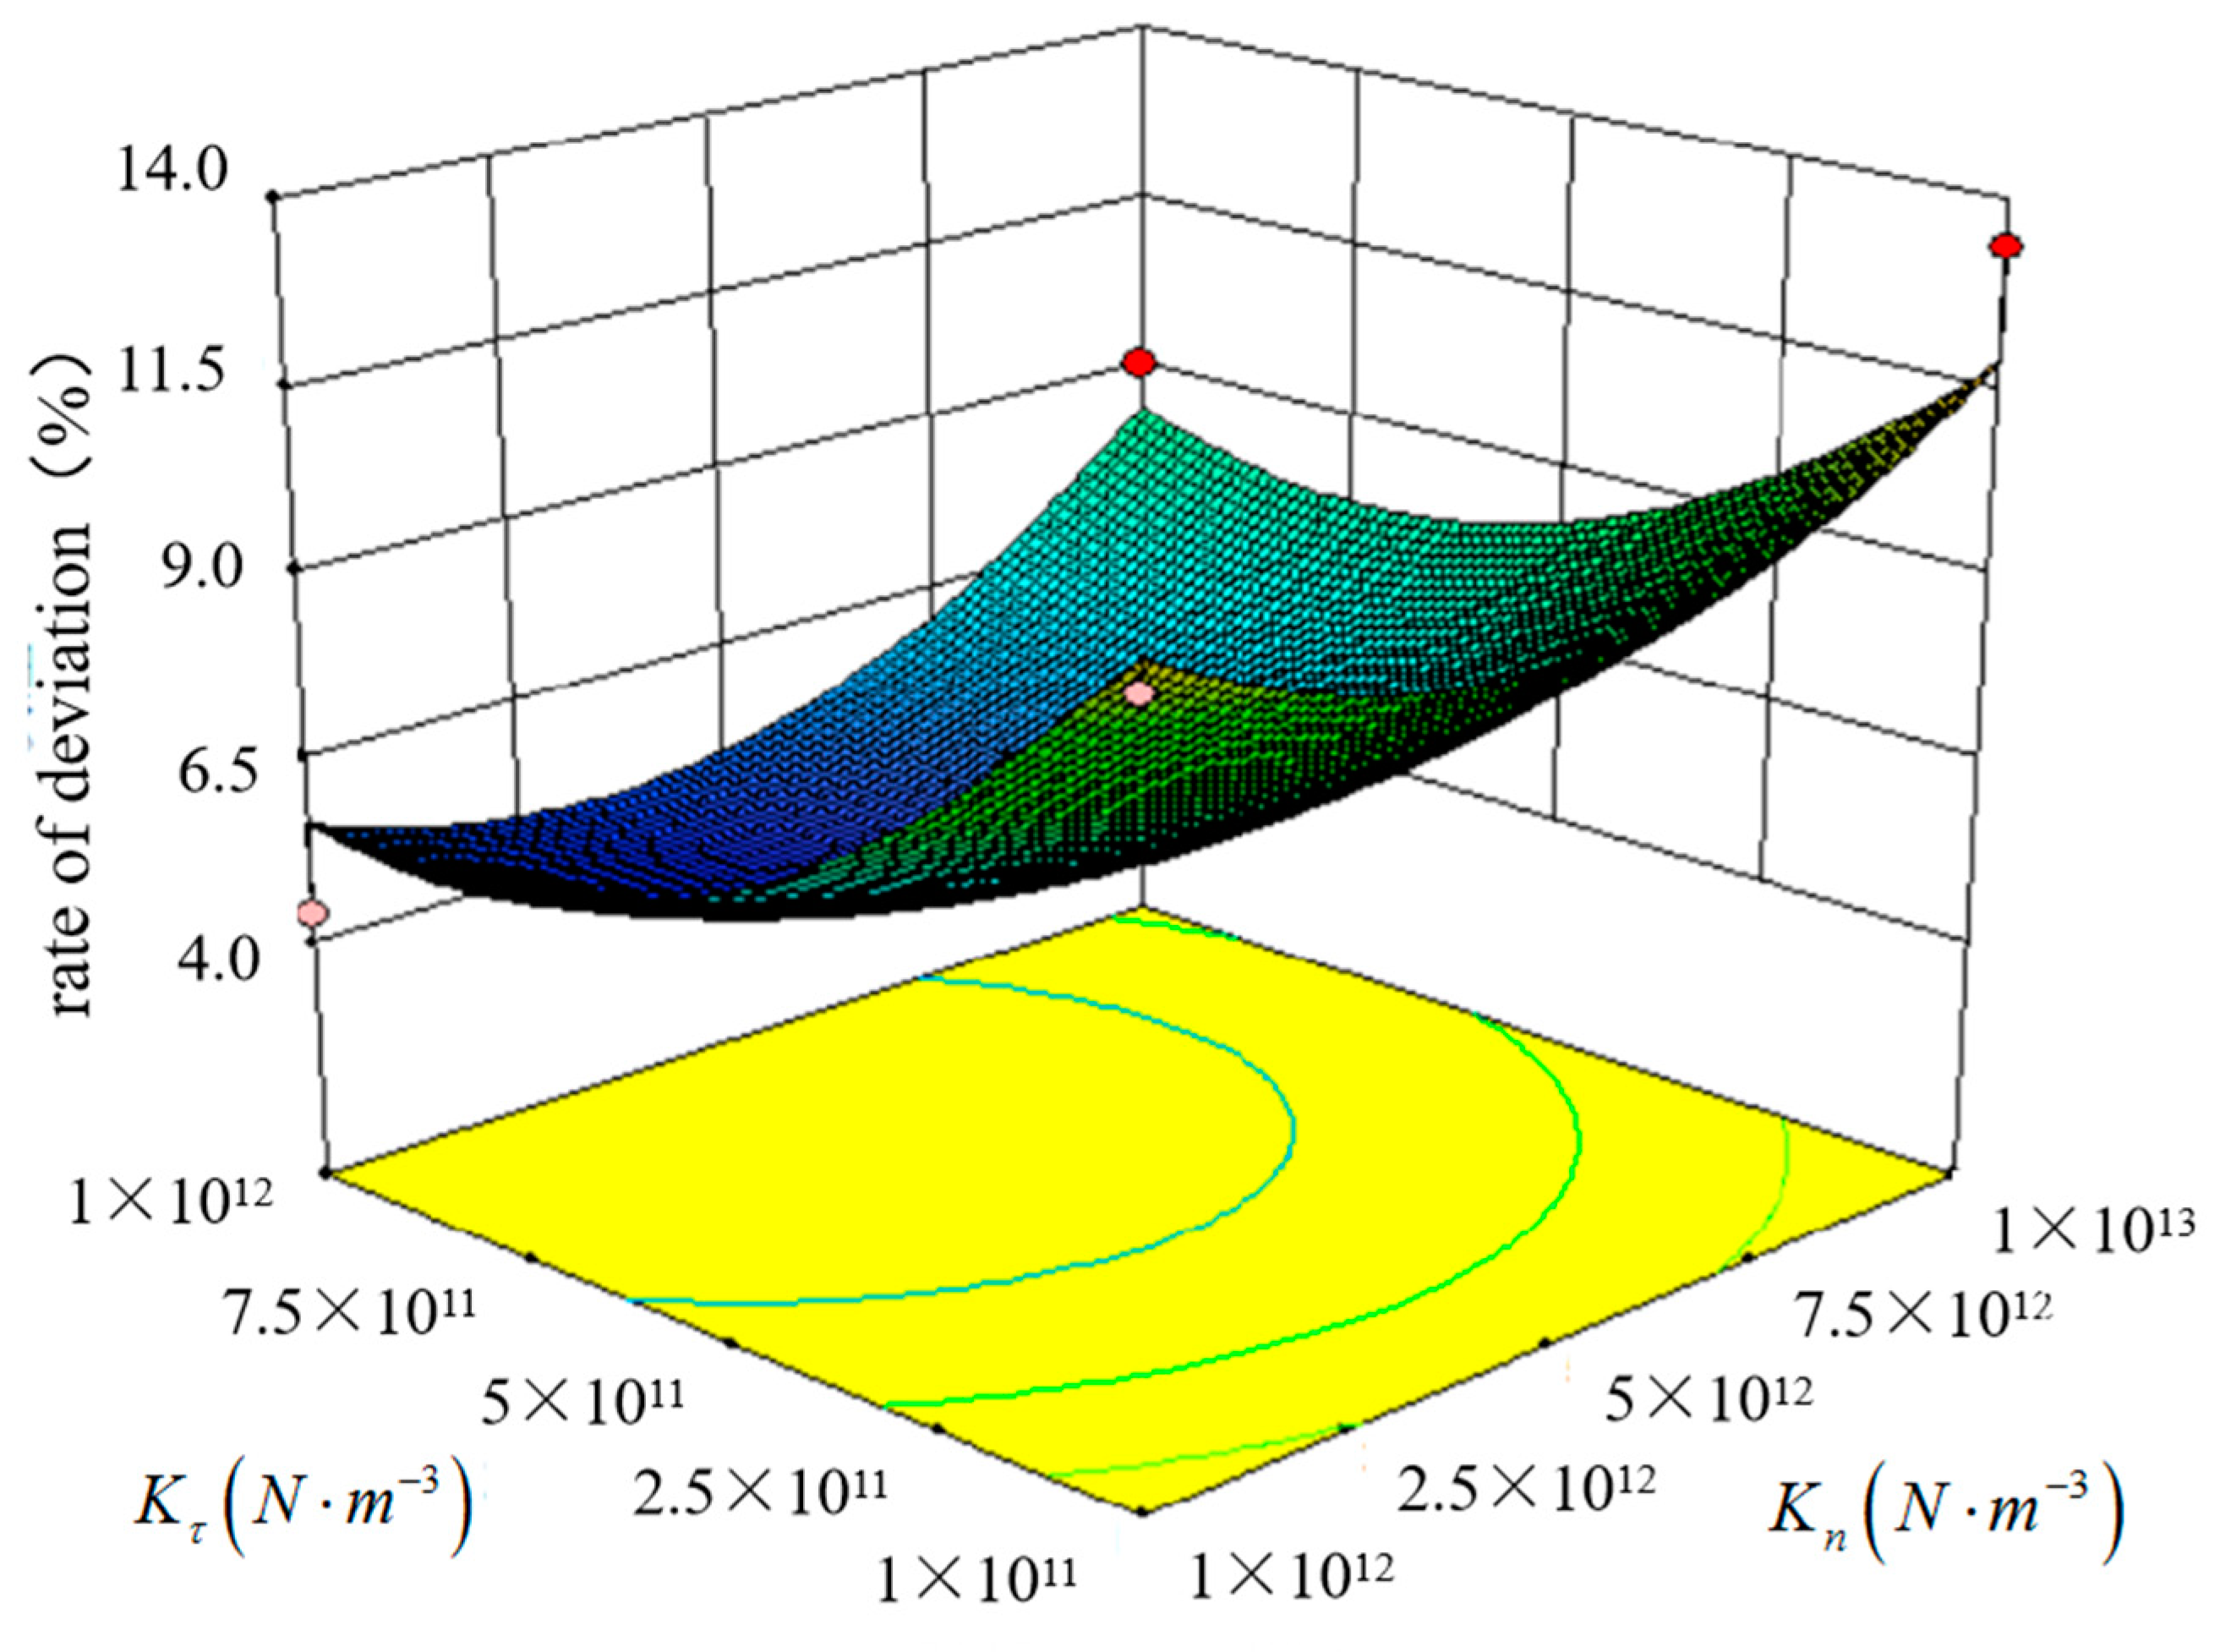
- By using bench testing and the EDEM simulation method, the bond parameters of the discrete element model of brown rice kernels were calibrated through quadratic orthogonal rotation combination testing. The normal stiffness per unit area Kn and shear stiffness per unit area Kτ were determined to be 4.43 × 10¹² N/m3 and 6.13 × 10¹¹ N/m3, respectively.
- (3)
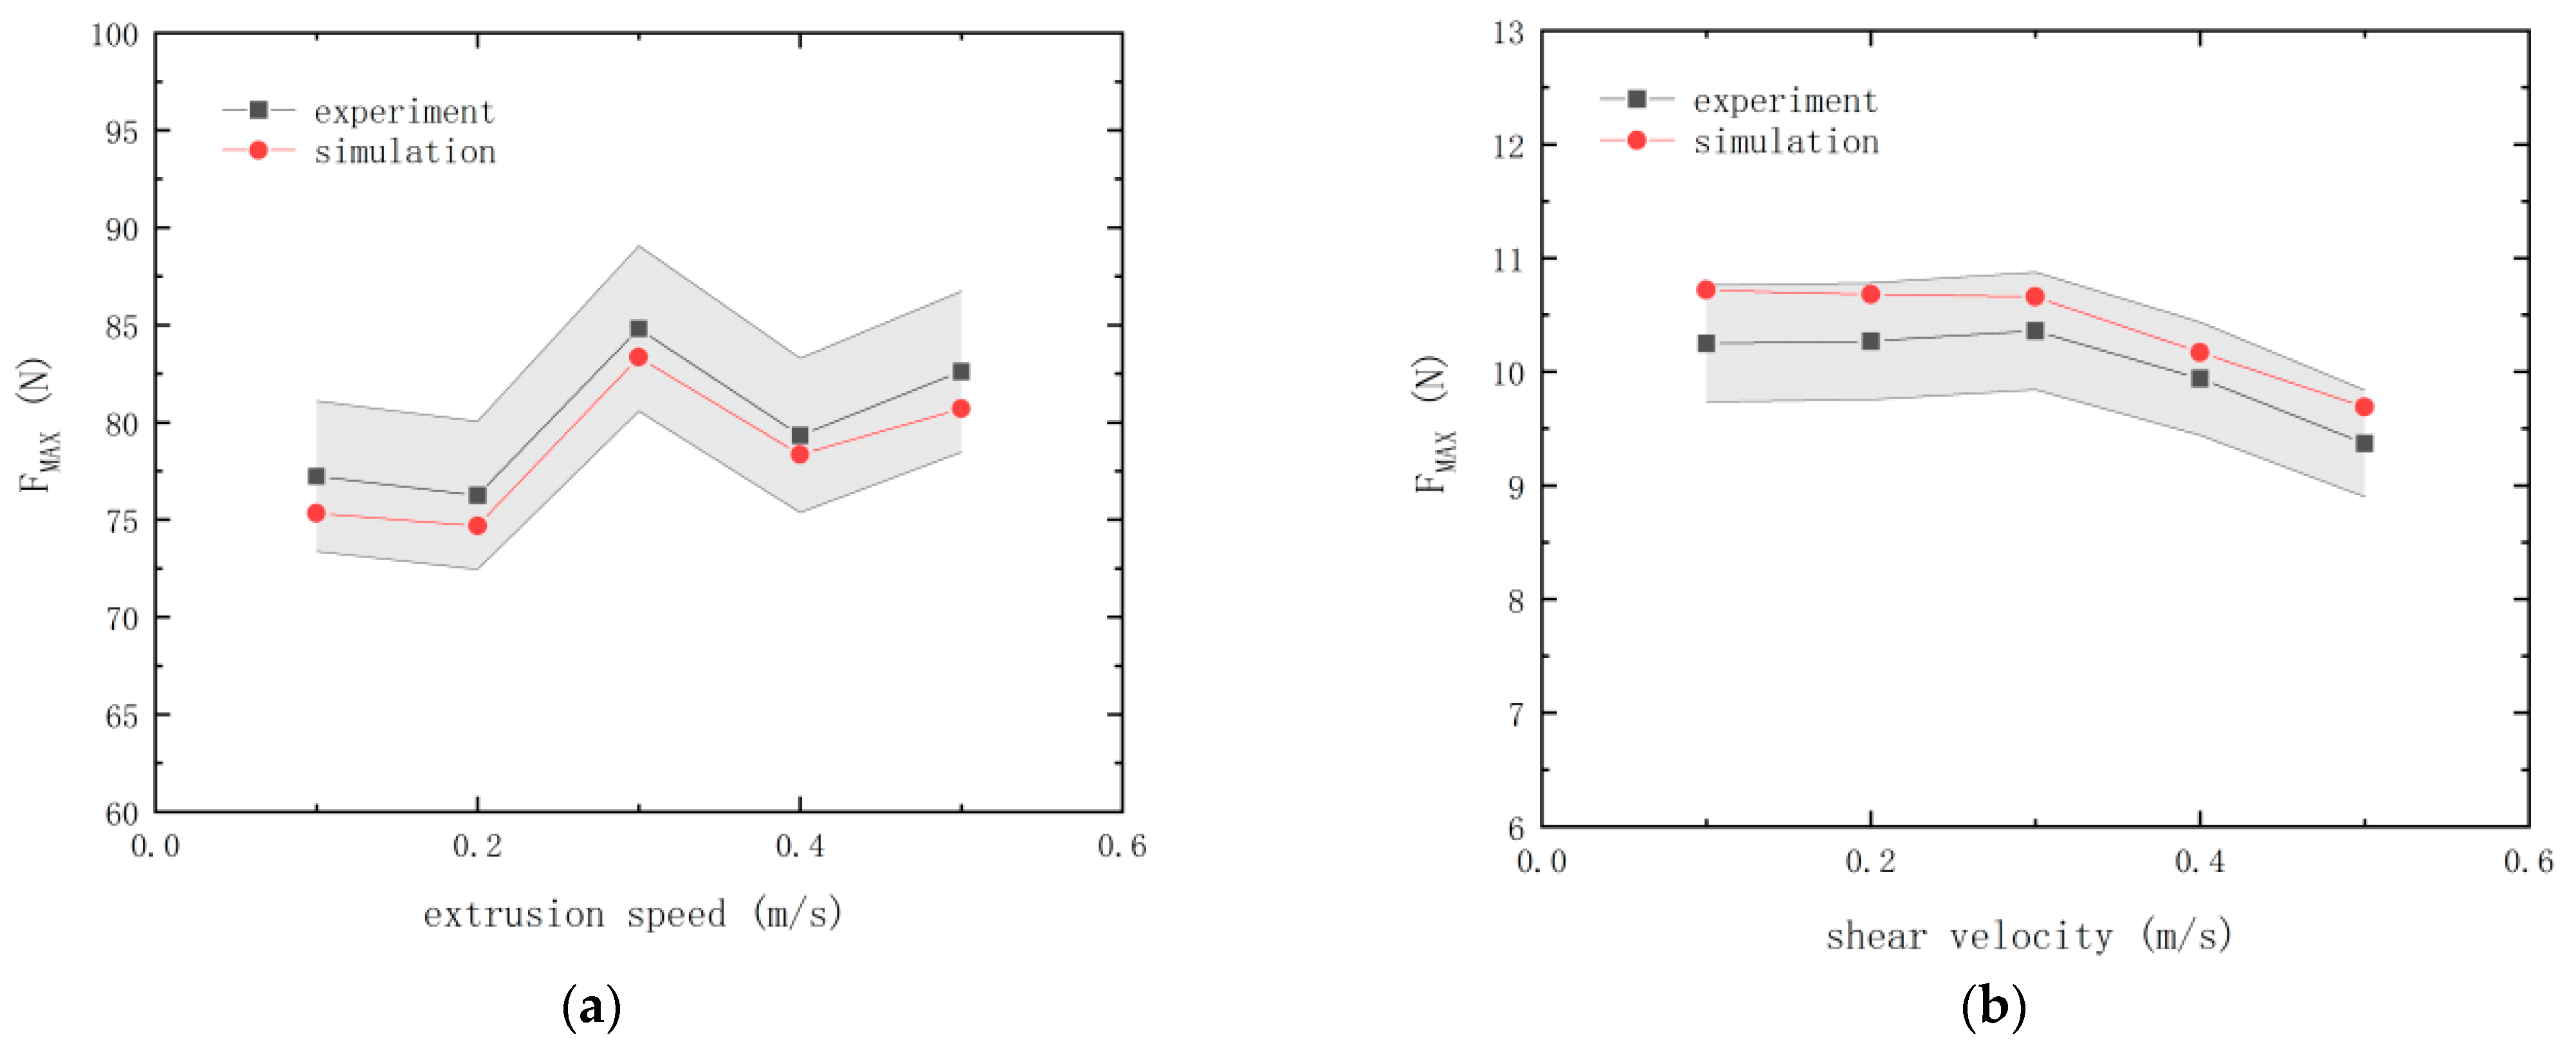
- The results from the bench test and the simulation test of brown rice kernels were compared. The relative error of the critical particle failure force measured by the bench test and the simulation test was less than 5%, indicating that the calibration parameters were accurate and reliable. According to the above, the calibrated critical shear stiffness optimal value and the average critical shear contact area calculation can be obtained from the theoretical critical shear Fτ = 9.11 N, using Fτ in the shear test within the range of the actual critical shear, once again, to verify that the calibrated parameters are accurate and reliable.
- (4)
- Brown rice kernels began to produce cracks when subjected to 40 N~70 N extrusion force. When subjected to 8 N~10 N shear force, the ability of brown rice kernels to withstand shear damage is nil, as is their pressure capacity. This paper determines the law of the bonding parameters of brown rice kernels. Therefore, in the design of the structure of the relevant processing and transportation machinery, the operating parameters should include the critical shear stiffness of brown rice kernels for the upper limit of the design, and the actual shear force Fτ* set during the processing should be smaller than the theoretical critical shear force Fτ (Fτ* < Fτ = 9.11 N). This will prevent structures, such as sharp bumps inside the machine, that cause the brown rice grain to be subjected to excessive shear force and breakage.
Author Contributions
Funding
Data Availability Statement
Acknowledgments
Conflicts of Interest
References
- Zeng, Y.; Jia, F.G.; Meng, X.Y.; Han, Y.L.; Xiao, Y.W. The effects of friction characteristic of particle on milling process in a horizontal rice mill. Adv. Powder Technol. 2018, 29, 1280–1291. [Google Scholar] [CrossRef]
- Zhao, F.; Sun, P.; Zhang, J. Modeling the Grain Import Trade: A Cointegration Analysis of China’s Panel Data. Discret. Dyn. Nat. Soc. 2021, 2021, 3673282. [Google Scholar] [CrossRef]
- Smith, C.W.; Dilday, R.H. Rice: Origin, History, Technology, and Production; John Wiley Sons: Toronto, ON, Canada, 2003; pp. 111–113. [Google Scholar]
- Reynolds, G.K.; Fu, J.S.; Cheong, Y.S.; Hounslow, M.J.; Salman, A.D. Breakage in granulation: A review. Chem. Eng. Sci. 2005, 60, 3969–3992. [Google Scholar] [CrossRef]
- Sharma, A.D.; Kunze, O.R.; Sarker, N.N. Impact damage on rough rice. Trans. ASAE 1992, 35, 1929–1934. [Google Scholar] [CrossRef]
- Halidan, M.; Chandratilleke, G.; Dong, K.; Yu, A. Mixing performance of ribbon mixers: Effects of operational parameters. Powder Technol. 2018, 325, 92–106. [Google Scholar] [CrossRef]
- Buggenhout, J.; Brijs, K.; Celus, I.; Delcour, J. The breakage susceptibility of raw and parboiled rice: A review. J. Food Eng. 2013, 117, 304–315. [Google Scholar] [CrossRef]
- Azmir, J.; Hou, Q.; Yu, A. Discrete particle simulation of food grain drying in a fluidised bed. Powder Technol. 2018, 323, 238–249. [Google Scholar] [CrossRef]
- Wang, W.; Luo, Y.; Ji, M. Experimental Study on Tensile Mechanical Properties of Rice Hull. J. Chin. J. Cereals Oils 2019, 34, 2050070. [Google Scholar]
- Siebenmorgen, T.J.; Qin, G. Relating rice kernel breaking force distributions to milling quality. Trans. ASAE 2005, 48, 223–228. [Google Scholar] [CrossRef]
- Yang, L.; Fan, Y.; Wang, C.; Yang, T.; Chen, H.; Song, S.; Zhang, Y.; Hu, Z. Mechanical Properties of Brown Rice Grains Based on in-situ Observation. J. Chin. J. Cereals Oils 2021, 36, 1–6. [Google Scholar]
- Zhang, Q.; Yang, W.; Sun, Z. Mechanical properties of sound and fissured rice kernels and their implications for rice breakage. J. Food Eng. 2004, 68, 65–67. [Google Scholar] [CrossRef]
- Zhou, X.; Zhang, Y.; Chu, H.; Liu, Y. Experiment and analysis on mechanical properties of mechanical crushing brown rice. Trans. Chin. Soc. Agric. Eng. 2012, 28, 255–261. [Google Scholar]
- Zhao, Z.; Li, Y.; Chen, Y.; Liang, Z.; Liu, L. Impact Mechanical Characteristics Analysis of Rice Grain. Trans. Chin. Soc. Agric. Mach. 2013, 44, 88–92. [Google Scholar]
- Sadeghi, M.; Araghi, H.A.; Hemmat, A. Physico-mechanical properties of rough rice (Oryza sativa L.) grain as affected by variety and moisture content. Agric. Eng. Int. CIGR J. 2010, 12, 129–136. [Google Scholar]
- Ardi, E.G.; Dong, K.; Yu, A.; Yang, R. A combined experimental and DEM approach to determine the breakage of particles in an impact mill. Powder Technol. 2017, 318, 543–548. [Google Scholar] [CrossRef]
- Patwa, A.; Ambrose, R.K.; Casada, M. Discrete element method as an approach to model the wheat milling process. Powder Technol. 2016, 302, 350–356. [Google Scholar] [CrossRef]
- Potyondy, D.O.; Cundall, P.A. A bonded-particle model for rock. Int. J. Rock Mech. Min. Sci. 2004, 41, 1329–1364. [Google Scholar] [CrossRef]
- Johansson, M.; Quist, J.; Evertsson, M.; Hulthén, E. Cone crusher performance evaluation using DEM simulations and laboratory experiments for model validation. Miner. Eng. 2017, 103–104, 93–101. [Google Scholar] [CrossRef]
- Gupta, V.; Sun, X.; Xu, W.; Sarv, H.; Farzan, H. A discrete element method-based approach to predict the breakage of coal. Adv. Powder Technol. 2017, 28, 2665–2677. [Google Scholar] [CrossRef]
- Han, Y.; Jia, F.; Zeng, Y.; Jiang, L.; Zhang, Y.; Cao, B. DEM study of particle conveying in a feed screw section of vertical rice mill. Powder Technol. 2017, 311, 213–225. [Google Scholar] [CrossRef]
- Zhou, J.; Liu, Y.; Du, C.; Liu, S.; Li, J. Numerical study of coarse coal particle breakage in pneumatic conveying. Particuology 2018, 38, 204–214. [Google Scholar] [CrossRef]
- Tong, Z.B.; Yang, R.Y.; Yu, A.B.; Adi, S.; Chan, H.K. Numerical modelling of the breakage of loose agglomerates of fine particles. Powder Technol. 2009, 196, 213–221. [Google Scholar] [CrossRef]
- Kafui, K.D.; Thornton, C. Numerical simulations of impact breakage of a spherical crystalline agglomerate. Powder Technol. 2000, 109, 113–132. [Google Scholar] [CrossRef]
- Rackl, M.; Hanley, K.-J. A methodical calibration procedure for discrete element models. Powder Technol. 2017, 307, 73–83. [Google Scholar] [CrossRef]
- Wang, Z.; Li, Y.; Xu, X. Parameter Calibration of Millet Discrete Element Based on Stacking experiment. J. Chin. J. Cereals Oils 2021, 36, 115–120. [Google Scholar]
- Schilde, C.; Burmeister, C.F.; Kwade, A. Measurement and simulation of micromechanical properties of nanostructured aggregates via nanoindentation and DEM-simulation. Powder Technol. 2014, 259, 1–13. [Google Scholar] [CrossRef]
- Dosta, M.; Dale, S.; Antonyuk, S.; Wassgren, C.; Heinrich, S.; Litster, J.D. Numerical and experimental analysis of influence of granule microstructure on its compression breakage. Powder Technol. 2016, 299, 87–97. [Google Scholar] [CrossRef]
- O’Sullivan, C.; Bray, J.D. Selecting a suitable time step for discrete element simulations that use the central difference time integration scheme. Eng. Comput. 2004, 21, 278–303. [Google Scholar] [CrossRef]
- Chehreghani, S.; Noaparast, M.; Rezai, B.; Shafaeia, S.Z. Bonded-particle model calibration using response surface methodology. Particuology 2017, 32, 141–152. [Google Scholar] [CrossRef]
- Goodman, R.E. Introduction to Rock Mechanics; John Wiley & Sons: New York, NY, USA, 1989. [Google Scholar]
- Chinese Academy of Agricultural Mechanization. Handbook of Agricultural Machinery (Part 2); Chinese Academy of Agricultural Mechanization: Beijing, China, 2007. [Google Scholar]
- Zeng, Y.; Jia, F.; Xiao, Y.; Han, Y.; Meng, X. Discrete element method modelling of impact breakage of ellipsoidal agglomerate. Powder Technol. 2019, 346, 57–69. [Google Scholar] [CrossRef]
- Tang, P.-Y.; Meng, F.-B.; Huang, D.-M.; Zheng, X.-Y.; Lin, M. Correlation between textural parameters and floral biological properties. Mod. Food Sci. Technol. 2021, 37, 294–301. [Google Scholar] [CrossRef]
- Vasseur, J.; Bimbenet, J.J.; Bonazzi, C. Effect of deformation rate and moisture content on the mechanical properties of rice grains. Trans. ASABE 2002, 45, 145. [Google Scholar]

| Particle | Parameters | Rice |
|---|---|---|
| Density (kg/m3) | 1460 | |
| Poisson’s ratio | 0.25 | |
| Shear modulus | 2 × 10⁸ | |
| Coefficient of restitution | 0.6 | |
| Coefficient of static friction | 0.43 | |
| Coefficient of rolling friction | 0.023 | |
| Particle | Parameters | Steel |
| Density(kg/m3) | 7800 | |
| Poisson’s ratio | 0.3 | |
| Shear modulus | 7 × 10¹⁰ | |
| Coefficient of restitution | 0.5 | |
| Coefficient of static friction | 0.56 | |
| Coefficient of rolling friction | 0.02 |
| Parameters | Extrusion Speed (mm/s) | ||||
|---|---|---|---|---|---|
| 0.1 | 0.2 | 0.3 | 0.4 | 0.5 | |
| kn | 136.59 | 137.40 | 134.86 | 136.17 | 139.09 |
| Fnmax/N | 77.23 | 76.25 | 84.82 | 79.33 | 82.61 |
| Parameters | Shear Velocity (mm/s) | ||||
|---|---|---|---|---|---|
| 0.1 | 0.2 | 0.3 | 0.4 | 0.5 | |
| kτ | 68.63 | 71.90 | 72.66 | 67.57 | 68.36 |
| Fτmax/N | 10.25 | 10.27 | 10.36 | 9.94 | 9.37 |
| Parameters | Indenter Velocity (mm/s) | Mean Value | ||||
|---|---|---|---|---|---|---|
| 0.1 | 0.2 | 0.3 | 0.4 | 0.5 | ||
| Sn (mm2) | 2.00–3.14 | 2.28–3.14 | 2.50–3.14 | 2.67–3.14 | 2.21–3.14 | — |
| Snmax (mm2) | 3.14 | 3.14 | 3.14 | 3.14 | 3.14 | — |
| Sτ (mm2) | 0.095–0.123 | 0.102–0.126 | 0.104–0.130 | 0.106–0.134 | 0.097–0.119 | — |
| Sτmax (mm2) | 0.123 | 0.126 | 0.130 | 0.134 | 0.119 | — |
| Cn (Pa) | 2.46 × 10⁷ | 2.43 × 10⁷ | 2.70 × 10⁷ | 2.53 × 10⁷ | 2.63 × 10⁷ | 2.55 × 10⁷ |
| Cτ (Pa) | 8.33 × 10⁷ | 8.15 × 10⁷ | 7.82 × 10⁷ | 7.42 × 10⁷ | 7.87 × 10⁷ | 7.92 × 10⁷ |
| Code | Parameters | |
|---|---|---|
| Kn (N/m3) | Kτ (N/m3) | |
| −1.414 | 1 × 10¹² | 1 × 10¹¹ |
| −1 | 2.17 × 10¹² | 2.17 × 10¹¹ |
| 0 | 5 × 10¹² | 5 × 10¹¹ |
| 1 | 7.83 × 10¹² | 7.83 × 10¹¹ |
| 1.414 | 1 × 10¹³ | 1 × 10¹² |
| Serial Number | Kn (N/m3) | Kτ (N/m3) | Error Δ/% |
|---|---|---|---|
| 1 | 1 | 1 | 9.09 |
| 2 | 1 | −1 | 13.36 |
| 3 | −1 | 1 | 5.18 |
| 4 | −1 | −1 | 10.85 |
| 5 | −1.414 | 0 | 9.52 |
| 6 | 1.414 | 0 | 11.95 |
| 7 | 0 | −1.414 | 11.82 |
| 8 | 0 | 1.414 | 7.89 |
| 9 | 0 | 0 | 5.34 |
| 10 | 0 | 0 | 5.34 |
| 11 | 0 | 0 | 5.34 |
| 12 | 0 | 0 | 5.34 |
| 13 | 0 | 0 | 5.34 |
| 14 | 0 | 0 | 5.34 |
| 15 | 0 | 0 | 5.34 |
| 16 | 0 | 0 | 5.34 |
| Source | Sum of Squares | df | F | p |
|---|---|---|---|---|
| Model | 126.74 | 5 | 39.63 | <0.0001 |
| Kn | 4.75 | 1 | 7.43 | 0.0214 |
| Kτ | 41.35 | 1 | 64.65 | <0.0001 |
| Kn∗Kτ | 0.49 | 1 | 0.77 | 0.4020 |
| Kn2 | 47.28 | 1 | 73.91 | <0.0001 |
| Kτ2 | 46.65 | 1 | 72.93 | <0.0001 |
| Residual | 6.40 | 10 | ||
| Lack of fit | 6.40 | 3 | ||
| Pure error | 0 | 7 | ||
| Cor total | 133.14 | 15 | ||
| R2 | 0.9520 | C.V. % | 10.46 | |
| Pred R2 | 0.6526 | Adj R2 | 0.9279 | |
| Adeq precision | 15.462 |
| Test | Critical Squeeze Force Crushing Force/N | Critical Shear Crushing Force/N | ||||||||
|---|---|---|---|---|---|---|---|---|---|---|
| 0.1 mm/s | 0.2 mm/s | 0.3 mm/s | 0.4 mm/s | 0.5 mm/s | 0.1 mm/s | 0.2 mm/s | 0.3 mm/s | 0.4 mm/s | 0.5 mm/s | |
| Bench test | 77.23 | 76.25 | 84.82 | 79.33 | 82.61 | 10.25 | 10.27 | 10.36 | 9.94 | 9.37 |
| Simulation test | 75.34 | 74.68 | 83.35 | 78.34 | 80.71 | 10.72 | 10.68 | 10.66 | 10.17 | 9.69 |
| Relative error | 2.45% | 2.06% | 1.73% | 1.25% | 2.30% | 4.59% | 3.99% | 2.90% | 2.31% | 3.42% |
Disclaimer/Publisher’s Note: The statements, opinions and data contained in all publications are solely those of the individual author(s) and contributor(s) and not of MDPI and/or the editor(s). MDPI and/or the editor(s) disclaim responsibility for any injury to people or property resulting from any ideas, methods, instructions or products referred to in the content. |
© 2023 by the authors. Licensee MDPI, Basel, Switzerland. This article is an open access article distributed under the terms and conditions of the Creative Commons Attribution (CC BY) license (https://creativecommons.org/licenses/by/4.0/).
Share and Cite
Shi, Z.; Liu, X.; Zhang, Y.; Zhou, J.; Li, H.; Duan, F. Bond Parameter Calibration and Crushing Process Analysis of Brown Rice Kernels. Processes 2023, 11, 2992. https://doi.org/10.3390/pr11102992
Shi Z, Liu X, Zhang Y, Zhou J, Li H, Duan F. Bond Parameter Calibration and Crushing Process Analysis of Brown Rice Kernels. Processes. 2023; 11(10):2992. https://doi.org/10.3390/pr11102992
Chicago/Turabian StyleShi, Ziang, Xiaopeng Liu, Yonglin Zhang, Jin Zhou, Hui Li, and Feng Duan. 2023. "Bond Parameter Calibration and Crushing Process Analysis of Brown Rice Kernels" Processes 11, no. 10: 2992. https://doi.org/10.3390/pr11102992
APA StyleShi, Z., Liu, X., Zhang, Y., Zhou, J., Li, H., & Duan, F. (2023). Bond Parameter Calibration and Crushing Process Analysis of Brown Rice Kernels. Processes, 11(10), 2992. https://doi.org/10.3390/pr11102992