Article

Experimental Study of the Influences of Operating Parameters on the Performance, Energy and Exergy Characteristics of a Turbocharged Marine Low-Speed Engine

1
School of Energy and Power Engineering, Dalian University of Technology, Dalian 116024, China
2
College of Power and Energy Engineering, Harbin Engineering University, Harbin 150009, China
3
School of Mechanical Engineering, Shanghai Jiao Tong University, Shanghai 200240, China
4
China Shipbuilding Power Engineering Institute Co., Ltd., Shanghai 200136, China
*
Author to whom correspondence should be addressed.
Processes 2023, 11(10), 2924; https://doi.org/10.3390/pr11102924
Submission received: 30 August 2023 / Revised: 29 September 2023 / Accepted: 5 October 2023 / Published: 7 October 2023
(This article belongs to the Section Energy Systems)

Abstract

:
With appropriate strategy of EVC timing and fuel injection, the engine NOx emission could be reduced with acceptable deterioration of fuel consumption. However, for the mechanism of these favorable results, few studies focus on improving the fuel economy from the perspective of energy and exergy analysis, which could be helpful for providing a deeper comprehensive to researchers. Therefore, an experimental study for the combination of EVC timing and fuel injection strategy is conducted based on a marine low-speed engine with 340 mm bore, then the energy and the exergy analysis are separately carried out according to the obtained experimental results. The experimental results show that delaying the exhaust valve closing (EVC), complemented with an appropriate injection strategy, could improve the marine low-speed diesel engine brake specific fuel consumption (BSFC) with the NOx emission almost kept constant. The following energy balance analysis demonstrates that the losses from exhaust gas and heat transfer account for about 50% of total energy. However, from the perspective of exergy analysis, an opposite conclusion could be obtained; the proportion of exhaust gas and heat transfer exergy could reach about 15%, and the ratio of heat transfer could be higher relatively. The losses caused by irreversibility is the biggest source of all, and the irreversibility from combustion could takes about 70% of the total irreversibility. Finally, the reduction of total irreversibility could reach about 4% by optimizing the parameters of marine low-speed engines.

1. Introduction

Large low-speed two-stroke diesel engines are widely used in the maritime industry due to their superior power and economy [1]. However, they have also become one of the major sources of pollution. As emission regulations become stricter, marine diesel engines face increasingly stringent challenges [2]. Taking the International Maritime Organization (IMO) emission standards as an example, in emission control areas, the NOx emissions of low-speed two-stroke marine engines in the Tier III stage must be below 3.4 g/kWh, which is a reduction of over 80% compared to the Tier I stage [3].
Therefore, various kinds of measures have been taken to achieve the Tier III standard, including exhaust gas recirculation (EGR) [4], selective catalytic reduction (SCR) [5], water-related technologies, etc. [6,7]. EGR is a widely recognized and effective technique for reducing NOx emissions in marine engines. By reintroducing a portion of cooled exhaust gases into the combustion chamber, EGR technology can reduce the oxygen concentration of the charge mixture, increase its specific heat capacity, and consequently lower combustion temperature, suppressing NOx formation [8]. SCR technology is a prominent solution for mitigating NOx emissions from marine diesel engines without directly intervening in the combustion process [9]. The method involves injecting a urea–water solution into the exhaust gas stream, which generates ammonia (NH3) through thermolysis [10]. The ammonia then reacts with NOx and O2 over a metal oxide-based catalyst. However, the SCR system demands specific operating temperature conditions (300–400 °C) to ensure a high conversion efficiency [11]. Deviating from the optimal temperature range can result in incomplete reactions or reduced performance, indirectly imposing requirements on the combustion process for optimal SCR functionality. Water-related technologies refer to advanced methods implemented in marine engines to mitigate NOx emissions by incorporating water into the combustion process. These techniques, including Intake Air Humidification (IAH) [12], Direct Water Injection (DWI) [13], and Fuel Water Emulsion (FWE) [14], work by capitalizing on water’s heat absorption and evaporation properties.
The implementation of the aforementioned techniques inevitably leads to an increase in fuel consumption. However, adjusting operational parameters, including the timing of exhaust valve closing (EVC), fuel injection pressure, and timing, is an efficient and convenient strategy to improve the fuel consumption of low-speed engines. Ji et al. [15] developed a three-dimensional CFD model for a low-speed marine engine and studied the impact of relevant emission control strategies on performance. The research results indicate that combining the Miller cycle with appropriate EGR and water injection strategies can effectively reduce NOx emissions, while adopting suitable fuel injection strategies can eliminate the increase in fuel consumption. Zhou et al. [16] established a simplified chemical reaction mechanism-based model for in-cylinder combustion in low-speed engines and investigated the influence of late EVC timing on the trade-off between NOx emissions and BSFC. Based on this, they optimized the fuel injection direction to meet Tier III emission standards without increasing fuel consumption. Feng et al. [17] evaluated the emission reduction capabilities of different methods on low-speed two-stroke engines using a 1-D- and 3-D-coupled approach. The research results show that delaying EVC timing combined with a 20% EGR rate and two-stage turbocharging can reduce NOx emissions without sacrificing fuel consumption. Liu et al. [18] examined the impact of delaying EVC timing, combining it with a higher geometric compression ratio on the economy and emissions of marine engines. The research results indicate that this approach can effectively offset the increase in fuel consumption caused by EGR and FWE. However, there is still insufficient research on adjusting operational parameters of marine low-speed engines, with most studies primarily focusing on their combination with other technologies to improve engine BSFC. From the perspective of the entire engine, there is limited research, especially in terms of energy and efficiency analysis [19].
Energy analysis evaluates the energy conversion process and energy losses in an engine, while exergy analysis assesses the effective utilization of energy in the engine system. Therefore, energy analysis and exergy analysis have been extensively discussed and explored in four-stroke engines, demonstrating their significant guidance in improving engine efficiency [20,21,22,23,24]. As a result, some researchers have also applied this method to low-speed two-stroke marine engines.
Zhu et al. [25,26] established a complex two-stroke engine thermal system model and designed a steam injection turbine compound system that utilizes waste heat recovery using energy analysis and exergy analysis methods, achieving a reduction of approximately 5% in fuel consumption. Furthermore, based on the parametric method, they also conducted a detailed comparison of the energy distribution and exergy distribution of each sub-cycle in the waste heat recovery system. The research results showed that by adjusting the ratio of turbocharging and exhaust bypass, the energy and exergy distribution in the exhaust can be effectively allocated, resulting in a 7.3% improvement in fuel economy. Yoshida et al. [27] categorized the energy losses in marine engines into three categories using exergy analysis methods, including exergy losses during heating processes, exergy losses during scavenging processes, and heat losses due to exhaust and cooling water dissipation. By reducing the losses in these processes, overall thermal efficiency can be effectively improved. Marty et al. [28] analyzed the energy system of ships using exergy analysis and proposed energy-saving strategies for marine engines and ships. Wang et al. [29,30] also explored the main forms of energy loss caused by exhaust gas recirculation using overall energy and exergy analysis, specifically the exergy losses caused by the irreversibility of combustion. They concluded that in order to further improve thermal efficiency, it is possible to suppress the irreversibility of in-cylinder combustion by reducing the combustion process and temperature gradients.
However, there remains a distinct deficiency regarding the influence of engine operating parameters on energy and exergy distribution in low-speed two-stroke engines. The exploration of the impact of various engine operating parameters, particularly from an energy and exergy analysis standpoint, remains relatively untouched in the existing literature. To address this gap, the present study proposes the following investigations. (1) An experimental setup is established specifically to scrutinize the impact of operating parameters on the performance and NOx emissions of low-speed marine engines. (2) Based on the data acquired from these experiments, an in-depth energy and exergy analysis is conducted to investigate the influence of these operating parameters on the distribution of energy and exergy. (3) The instantaneous in-cylinder exergy analysis is carried out to discern the variation in the components of in-cylinder exergy under different operating parameters. (4) Based on the above, recommendations are put forth with the aim of enhancing the performance of marine low-speed engines through the adjustment of operating parameters.

2. Methodology

2.1. Experimental Setup

In this paper, the studied marine low-speed two-stroke diesel engine is the 6EX340EF from the China Shipbuilding Power Engineering Institute Co., Ltd. in Shanghai, China. The main engine components and subsystem schematic diagram are shown in Figure 1. This engine owns 6 cylinders, adopts uni-flow scavenging and equips with the constant pressure turbocharger system. The main parameters of this engine are shown in Table 1.
The radial compressor boosts the air from the surrounding environment, which then passes through the intercooler to reduce its temperature. After the intercooler, a water mist catcher (WMC) is installed to remove any condensed liquid water. The scavenging air receiver and box collect the treated air for the subsequent scavenging process. At 100%, 75%, and 50% loads, the treated air directly enters the scavenge air receiver to prepare for scavenging. However, at 25% load, the pressure generated by the compressor is insufficient for the engine’s requirements. In this case, the air first goes through the auxiliary blower for an additional boost. When the piston moves and opens the scavenge port, the air in the scavenge box enters the cylinder, rotates, rises, and mixes with the burned gas. It then pushes the burned gas out of the cylinder. The expelled burned gas flows into the exhaust gas receiver through the exhaust valve, driving the axial turbine to generate power.
For marine low-speed engines, the typical operating load is usually within 60~90%, rarely reaching 100%. When NOx emissions are tested under the E3 cycle, the weight coefficient at 75% load can reach up to 0.5. Therefore, all tests were conducted at 75% load. Table 2 provides the relevant test conditions. This study primarily focuses on valve timing and fuel injection strategies. The Exhaust Valve Opening (EVO) timing remains constant at 110 °CA ATDC, while there are three levels for EVC timing: 264 °CA ATDC, 272 °CA ATDC, and 280 °CA ATDC. Three levels of injection timing and pressure are also adopted in this experiment: the injection timing varies from −1 to 3 °CA ATDC, and the injection pressure consists of 600 bar, 800 bar, 1000 bar, respectively.
Injection parameters are all adjusted based on the high-pressure common rail system equipped on this marine low-speed engine. Increasing the common rail pressure could increase the fuel injection pressure, and adjusting the start and the duration of the electrical pulse signal could change the start and the duration of fuel injection. As for the exhaust valve closing (EVC) timing, since a hydraulic system is used to drive the exhaust valve, retarding the EVC could also be achieved by extending the duration of electrical pulse signal.
The main test parameters, equipment, and uncertainty analysis are shown in Table 3. The uncertainty is defined as the sum of measurement error and instrument error, as shown in the formula. It can be observed that the errors are within the allowable range, indicating the reliability of the experimental data in this study.
u r e l = ± i = 1 n ( X i X ¯ ) 2 n ( n 1 ) + i n s 2 X ¯ × 100 %  
where X i represents the value obtained from each test, X ¯ represents the average value of each parameter test, n represents the number of repetitions, and i n s represents the error of the equipment.

2.2. Energy Analysis

The second law of thermodynamics, based on the concept of exergy, can be used to assess the potential of a system to produce useful work. By conducting an exergy balance analysis on the engine, one can obtain a deeper understanding of the exergy flow within the system, thereby elucidating the mechanisms by which operating parameters influence the irreversibility in low-speed engines and the overall efficiency. This paper begins by calculating the energy balance of a low-speed marine engine, as energy analysis serves as the foundation for exergy analysis. The reference states for pressure and temperature are 1.01325 bar and 298.15 K, respectively.
The available energy for the engine is derived from the fuel and intake air, both of which are consumed in various ways. These include the indicated work produced by the piston, the increase in internal energy of the in-cylinder charge, the heat dissipated from the engine, the energy carried away by the exhaust gas, and the energy lost due to incomplete combustion. Thus, the energy balance of the marine engine can be calculated as follows [31,32].
d Q i n d φ + d Q F d φ = d U d φ + d W i n d i d φ + d Q H T d φ + d Q e x h d φ + d Q I C d φ
where Qin represents the heat carried by the engine’s inlet air, QF denotes the heat released by the fuel, U represents the internal energy of the in-cylinder charge, Windi represents the indicated work produced by the piston, QHT represents the heat dissipated from the engine, Qexh represents the energy carried away by the exhaust gas, and QIC represents the energy lost due to incomplete combustion.
The energy provided by fuel can be determined by considering the mass of the fuel and its lower heating value:
Q F = L H V m F
where LHV is the lower heating value of fuel, and mF is the fuel mass.
The energy released from the fuel is absorbed by the charge inside the cylinder, which in turn heats up and pushes the piston to generate the indicated work.
d W i n d i d φ = P c y l d V d φ
where Pcyl represents the recorded cylinder pressure at a specific moment, and V represents the corresponding cylinder volume at that same moment.
The dissipation of heat from the engine primarily occurs through two pathways: the cylinder liner and the intercooler.
d Q H T d φ = d Q H T , c y l d φ + d Q H T , I n t C d φ
where QHT,cyl represents the heat transfer within the cylinder, and QHT,IntC refers to the heat transfer within both the turbocharger intercooler and the EGR intercooler.
Regarding the scavenging process, fresh air enters the cylinders and displaces the burned gases, resulting in the expulsion of exhaust gases. It is important to note that this process requires a significant amount of energy.
d Q e x h d φ d Q i n d φ = 1 4 m ˙ e x h h e x h , i m ˙ i n h i n , i
where exh and in represent the mass flow rates of the exhaust gas and inlet air, respectively, hexh and hin denote the specific enthalpy of the exhaust gas and inlet air, and “i” corresponds to different components, including oxygen (O2), nitrogen (N2), carbon dioxide (CO2), and water (H2O) [33].
The mechanical loss can be determined by calculating the difference between the indicated work and the brake work:
d W f r d φ = d W i n d i d φ d W b r d φ
where Wfr represents the work wasted due to engine friction and Wb represents the brake work outputted by the engine crank.
The engine brake work is primarily determined based on the measured engine brake power.
W b r = W ˙ b r 6 N
where br represents the engine brake power that is measured using an engine dynamometer.

2.3. Exergy Analysis

Utilizing the aforementioned energy balance, the subsequent exergy analysis will be carried out accordingly.
The origin of total exergy is analogous to that of energy, originating from the inlet air and fuel. The consumption pathways typically include the following: the indicated work produced by the piston, heat dissipated from the engine, increased internal energy of the control volume, exergy extracted from the engine by exhaust gas, and exergy destruction resulting from irreversibility [31,32].
d A F d φ + d m i n d φ b i n = d A W d φ + d A Q d φ + d A C V d φ + d m e x h d φ b e x h + d I d φ
where AF represents the exergy of the fuel, bin and bexh denote the specific flow exergy of the inlet air and exhaust gas, respectively, min and mexh represent the mass of the inlet air and exhaust gas, AW corresponds to the exergy consumed by indicated work, AQ signifies the exergy resulting from heat transfer, ACV represents the exergy of the control volume, and I denotes the irreversibility.
The primary source of exergy entering the cylinders is derived from the injected fuel. The calculation for this can be performed as follows:
A F = a c h , F m F
where the chemical specific exergy of the fuel, represented as ach,F, can be calculated using the following method [31]:
a c h , F = L H V 1.04224 + 0.011925 y z 0.042 z
where “y” represents the number of hydrogen atoms and “z” represents the number of carbon atoms.
The calculation of specific flow exergy is dependent on the reference state and can be expressed in the following way:
b = h h 0 T 0 s s 0
where the equation for specific flow exergy involves the specific enthalpy, temperature, and entropy of the reference state, denoted as h0, T0 and s0, respectively.
To produce the indicated work, the piston of an engine consumes a certain amount of engine exergy. This quantity can be determined by analyzing the movement of the piston and the cylinder pressure measurements.
d A w d φ = P c y l P 0 d V d φ
where P0 is the pressure of reference state.
The exergy of heat transfer is influenced by both the working fluid temperature and the amount of heat transfer energy, and it is also dependent on the reference state. This relationship can be expressed mathematically as:
d A Q d φ = 1 T 0 T f d Q H T d φ
where Tf is the temperature of working fluid in engine.
When a turbine is used to harness the exergy of exhaust gas and drive a compressor, it generates a certain amount of engine irreversibility. To calculate this irreversibility, the following equations can be used:
d W c d φ = d m i n d φ b i n d m o u t , c d φ b o u t , c d I c d φ
The calculation of engine irreversibility involves several variables. These include the compressor work (Wc), the mass (mout,c) and flow (bout,c) exergy of the compressor outlet, as well as the irreversibility caused by the compressor, denoted by Ic.
d W t d φ = d m i n , t d φ b i n , t d m e x h d φ b e x h d I t d φ
Similarly, the calculation of engine irreversibility also involves variables such as the turbine work (Wt), the mass (min,t) and flow (bin,t) exergy of the turbine inlet, and the irreversibility generated by the turbine, denoted as It.

3. Results and Discussion

3.1. Effects of EVC and Fuel Injection Parameters

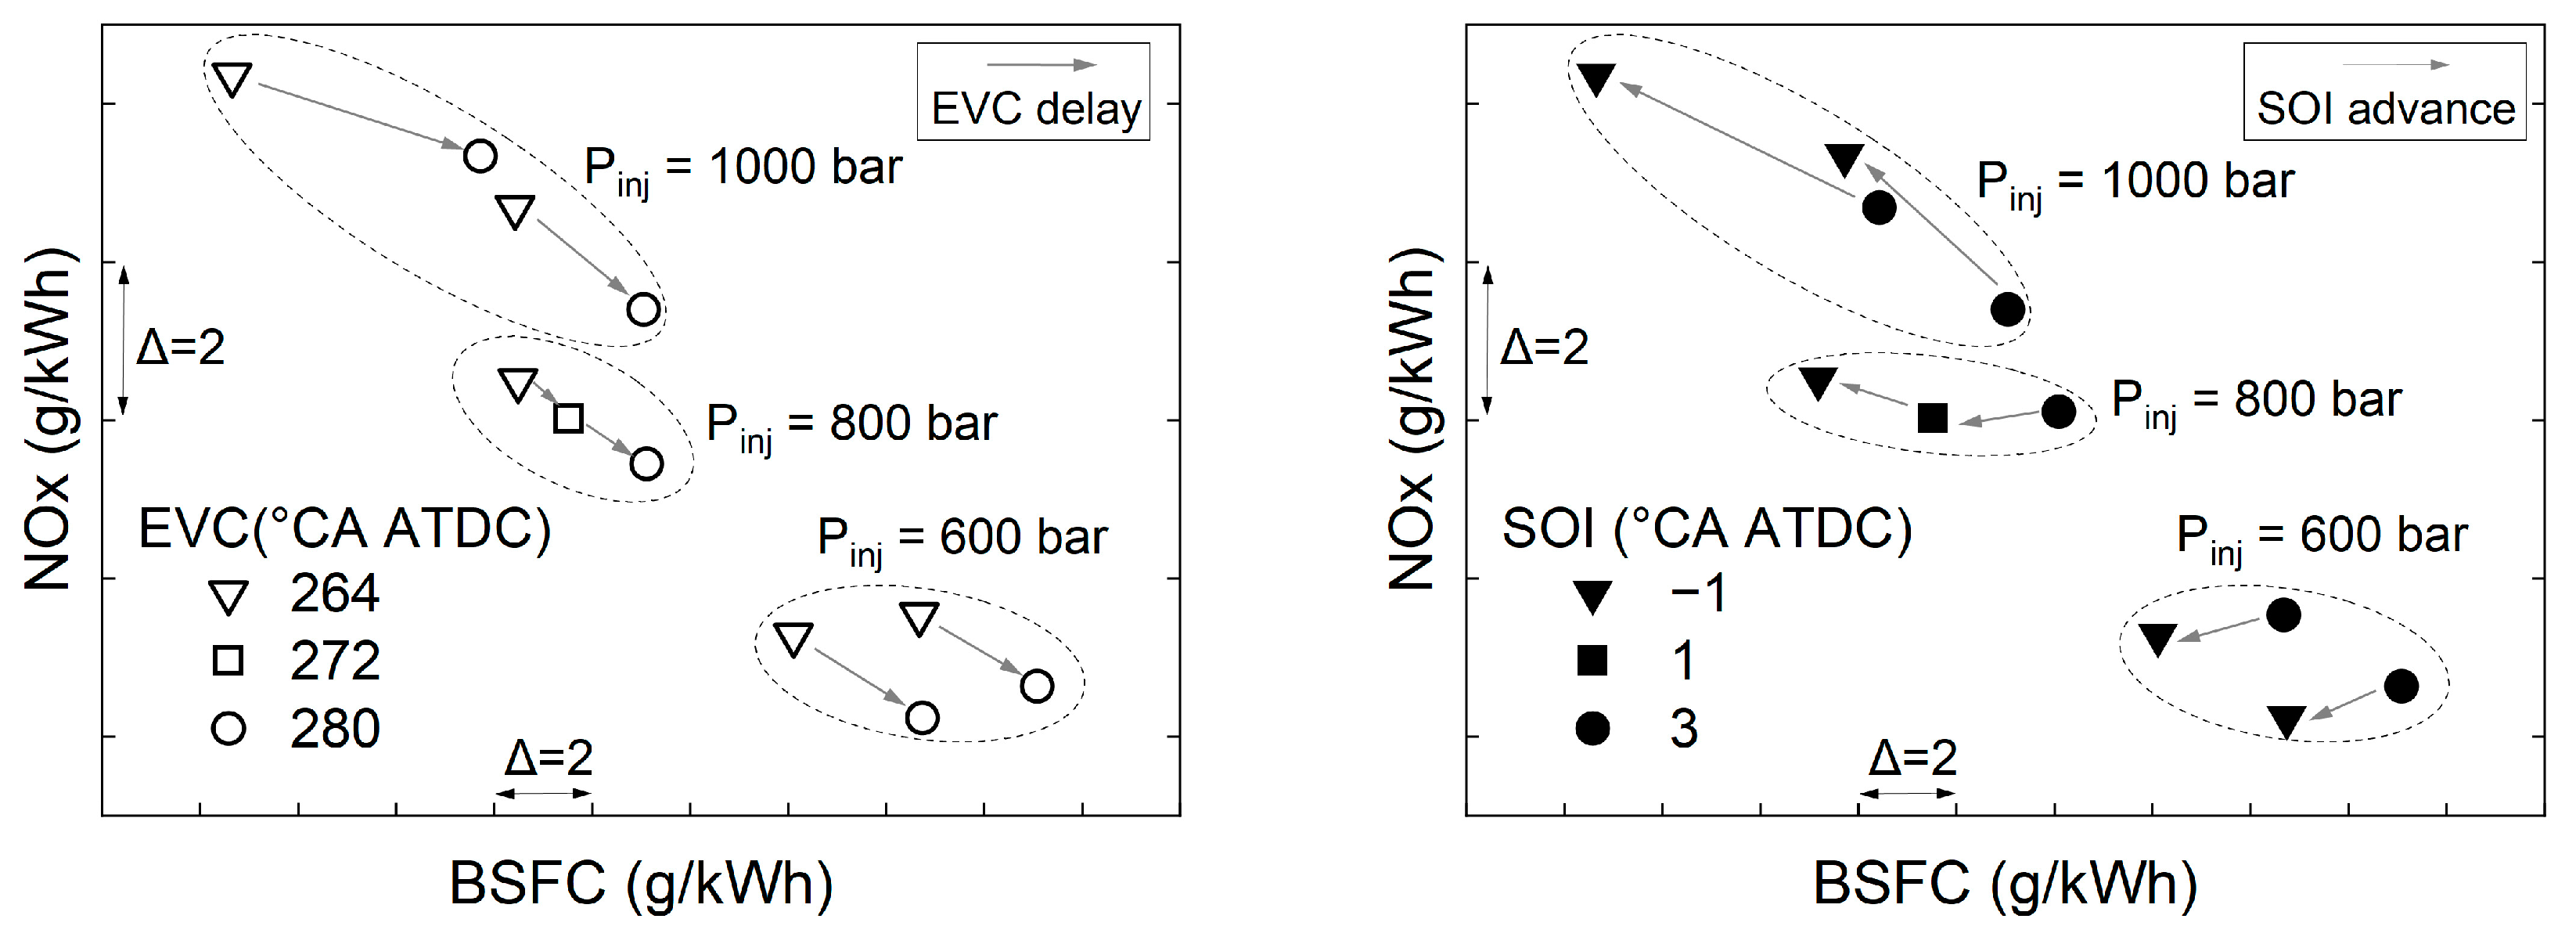
Figure 2 illustrates the influence of EVC and fuel injection parameters on NOx and BSFC. It is evident that the impact of fuel injection pressure is significantly higher than the other two parameters. An increase in fuel injection pressure can effectively enhance fuel efficiency. As fuel injection pressure is elevated from 600 bar to 1000 bar, the reduction range of BSFC is from 8.0 to 11.5 g/kWh, while NOx emissions increase by 4.7 to 7.1 g/kWh. The effect of delayed EVC timing remains relatively constant with increasing fuel injection pressure. As EVC timing is delayed, NOx emissions can be reduced, and fuel consumption can be improved. When the fuel injection pressure is below 1000 bar, a delay of 16 °CA in EVC timing results in a reduction of NOx by approximately 1.0 g/kWh and an increase in BSFC by around 2.5 g/kWh. However, at a fuel injection pressure of 1000 bar, with the same crank angle delay in EVC timing, the degradation of BSFC under an advanced SOI condition is more severe, reaching 5 g/kWh, while in the case of a retarded SOI, NOx emissions can be reduced more, 1.3 times than under low-fuel injection pressure.
The increase in fuel injection pressure results in a different impact trend on the advancement of SOI. When the fuel injection pressure is relatively low, advancing SOI can improve both BSFC and NOx emissions, albeit the reduction scale of NOx is not significant. When the fuel injection pressure is higher, although the advance of SOI can improve fuel consumption to a greater extent, it concurrently leads to an increase in NOx emissions. When the fuel injection pressure remains constant, the earlier the EVC, the better engine performance brought about by the same degree of SOI advance. This difference becomes more pronounced with higher fuel injection pressure. For instance, when the fuel injection pressure is 1000 bar, advancing SOI by 4 °CA at EVC timing of 264 °CA ATDC can reduce BSFC by 5.8 g/kWh and only increase NOx emissions by 1.7 g/kWh. Conversely, at EVC of 280 °CA ATDC, these values are 3.3 g/kWh and 2.0 g/kWh, respectively.
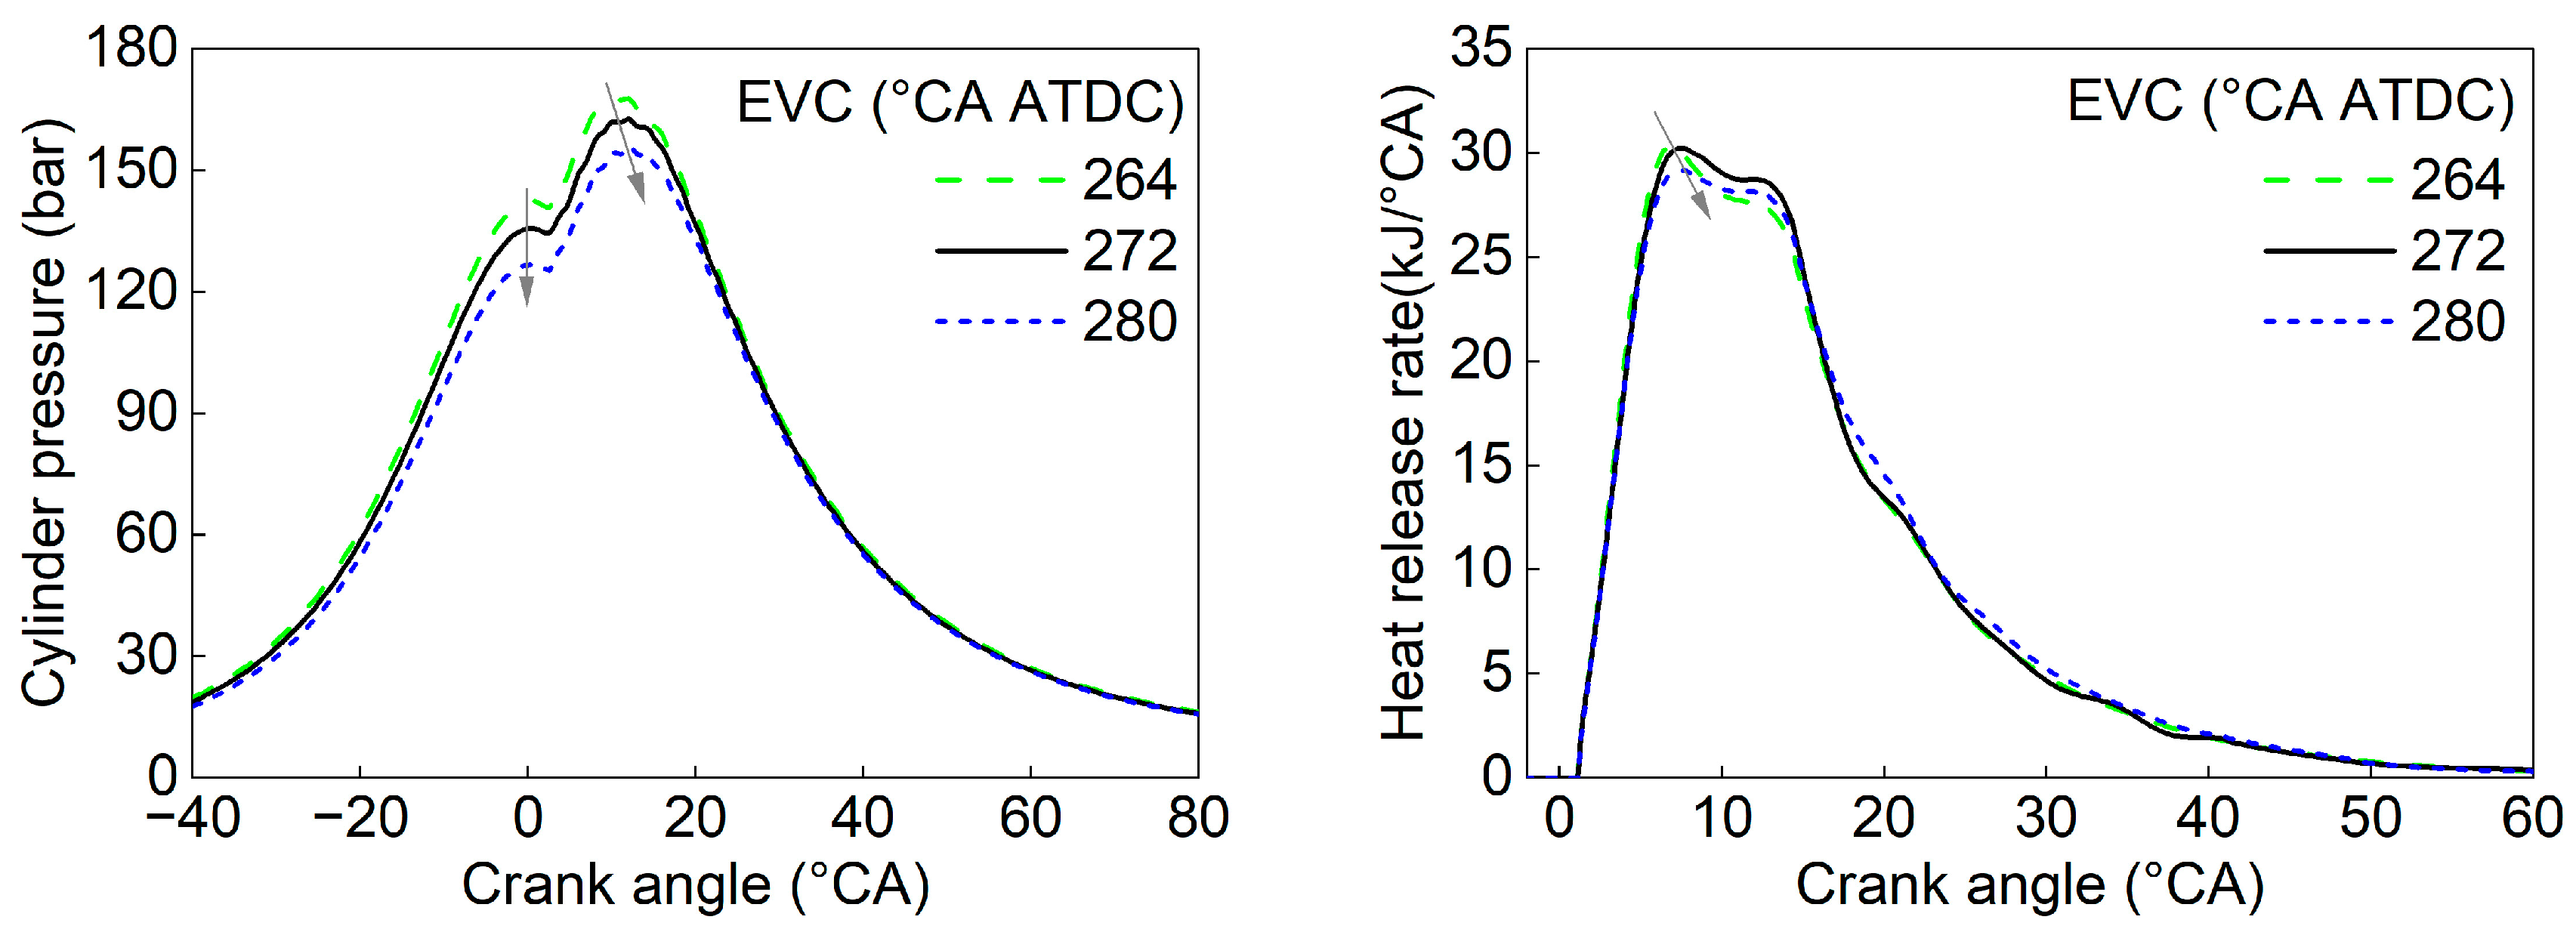
The variation in operational parameters can instigate changes within the the in-cylinder process of low-speed engine. Figure 3 illustrates the influence of EVC on the cylinder pressure curve and the apparent heat release rate (AHRR). When EVC timing is delayed, it significantly reduces the cylinder pressure, affecting both the maximum cylinder pressure (Pmax) and the compression cylinder pressure (Pcomp). Compression cylinder pressure refers to the cylinder pressure when the piston is at the top dead center (TDC). On one hand, delaying EVC timing reduces the effective compression ratio. A lower cylinder pressure is related to a lower cylinder temperature, which benefits the reduction of NOx emissions. On the other hand, the decrease in maximum cylinder pressure is naturally detrimental to BSFC [34]. The AHRR curve demonstrates a double-peak characteristic, yet the disparity between the two peaks is relatively minor. The impact of delaying EVC timing on AHRR is not particularly conspicuous; it induces a slight decrease in the first peak and a minor phase shift delay.
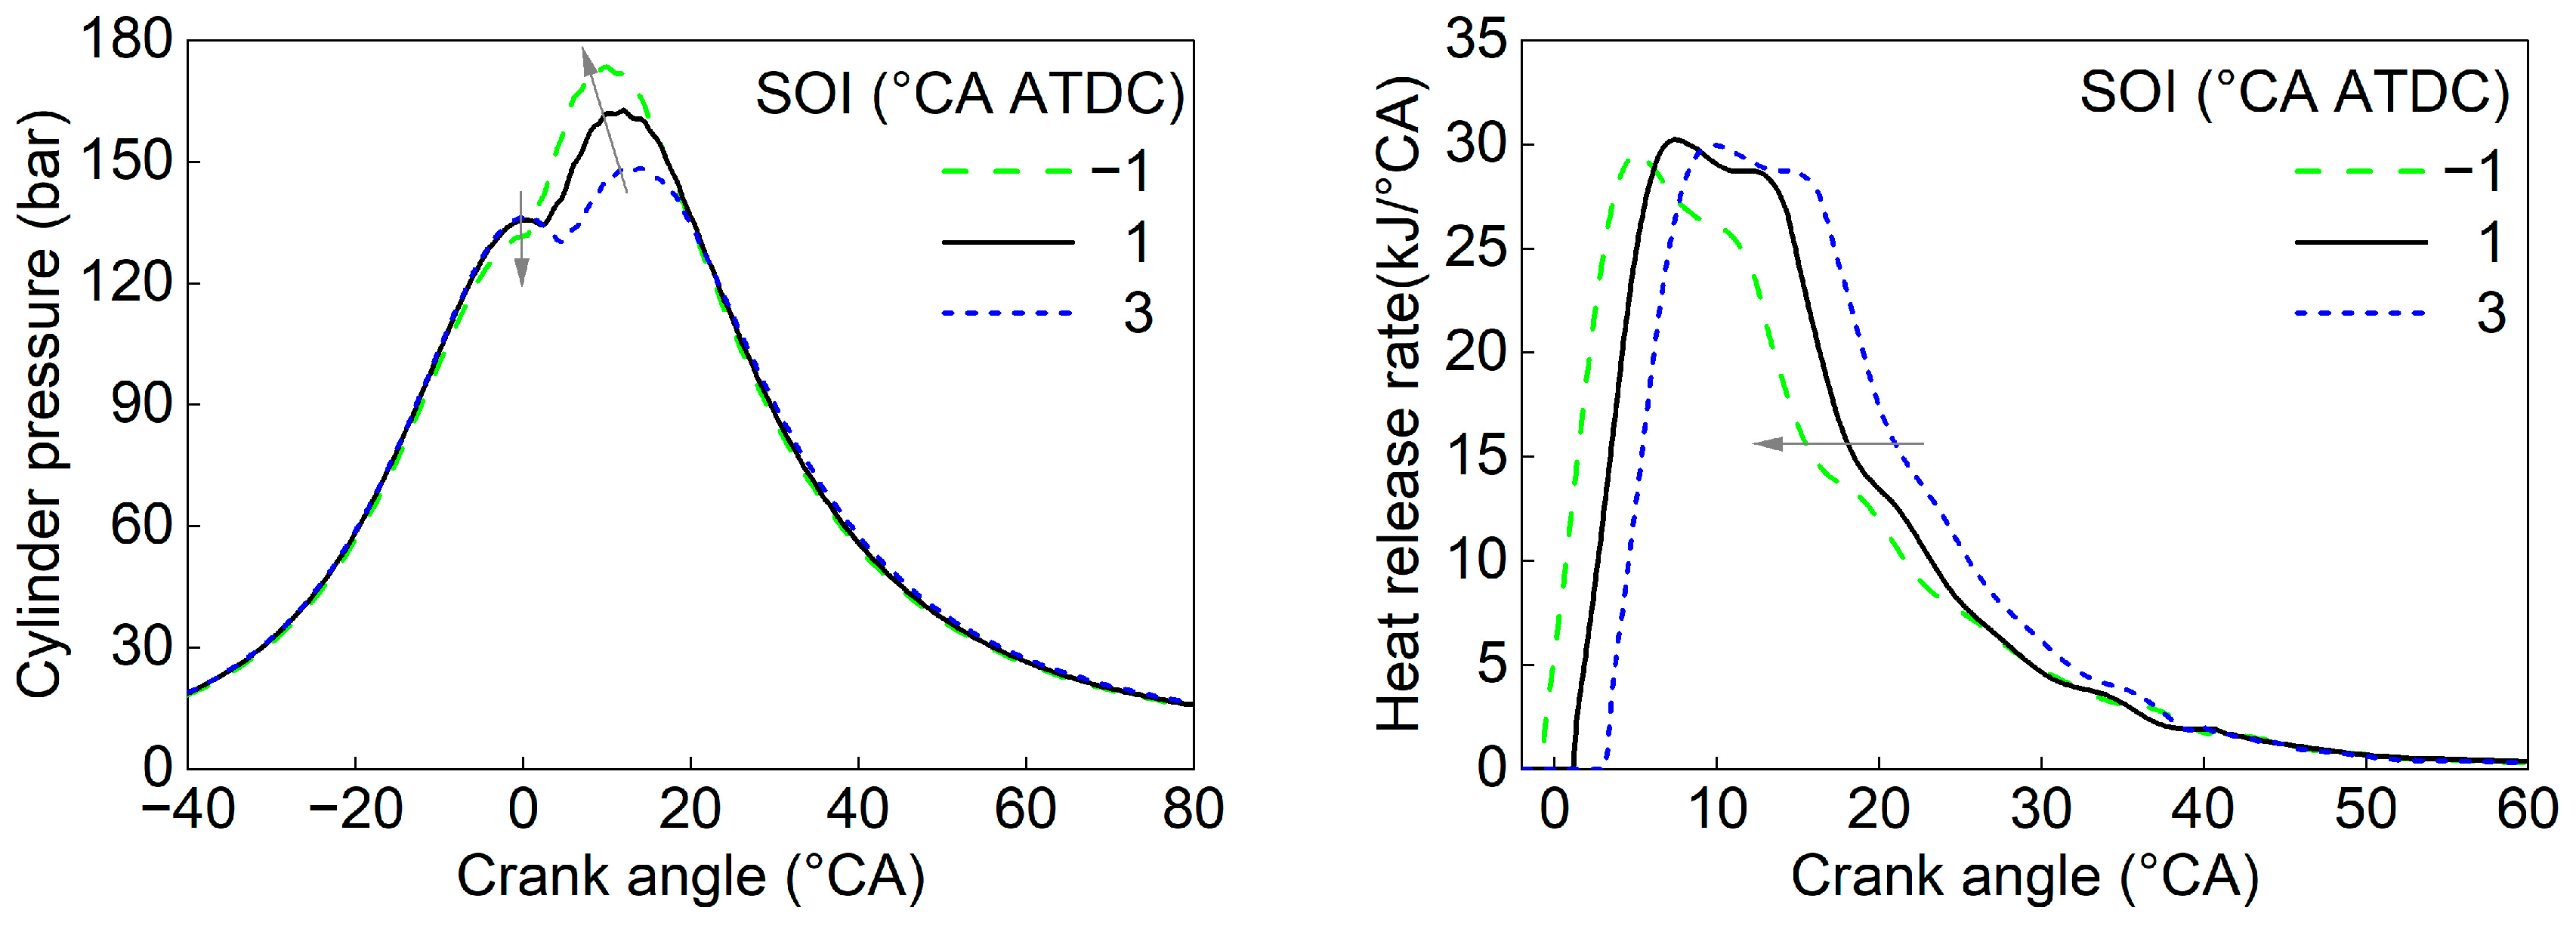
The impact of an advance in SOI on the compression cylinder pressure is minimal, but it significantly elevates the maximum cylinder pressure. Therefore, by advancing the SOI, the BSFC can be reduced. However, it should be noted that the disparity between Pcomp and Pmax also escalates, implying that the SOI should not be excessively advanced, as a large pressure difference is detrimental to the stable operation of the marine low-speed engine [6]. As the SOI advances, the AHRR curve shifts to the left. As depicted in Figure 4, the first peak does not exhibit substantial change. Nevertheless, when the SOI is advanced to a point before TDC, the second peak experiences a notable decline. This results in a more gradual decrease in AHRR during the later stage of the combustion process, reaching an equivalent level at approximately 38 °CA ATDC.
Raising fuel injection pressure has a different influence on the in-cylinder process, compared with the two factors above. As shown in Figure 5, it could raise the maximum cylinder pressure and reduce the compression cylinder pressure at the same time, indicating a reduction in compression negative work. Therefore, increasing fuel injection pressure can contribute to the reduction of BSFC. However, similar to the advancement of SOI, the amplification of the difference between Pmax and Pcomp can impose a limitation on the extent to which fuel injection pressure can be raised. In contrast to EVC and SOI, an increase in fuel injection pressure can notably influence the peak of the AHRR curve and slightly advance its phase. During the later stage of the combustion process, a higher fuel injection pressure corresponds to a lower AHRR.
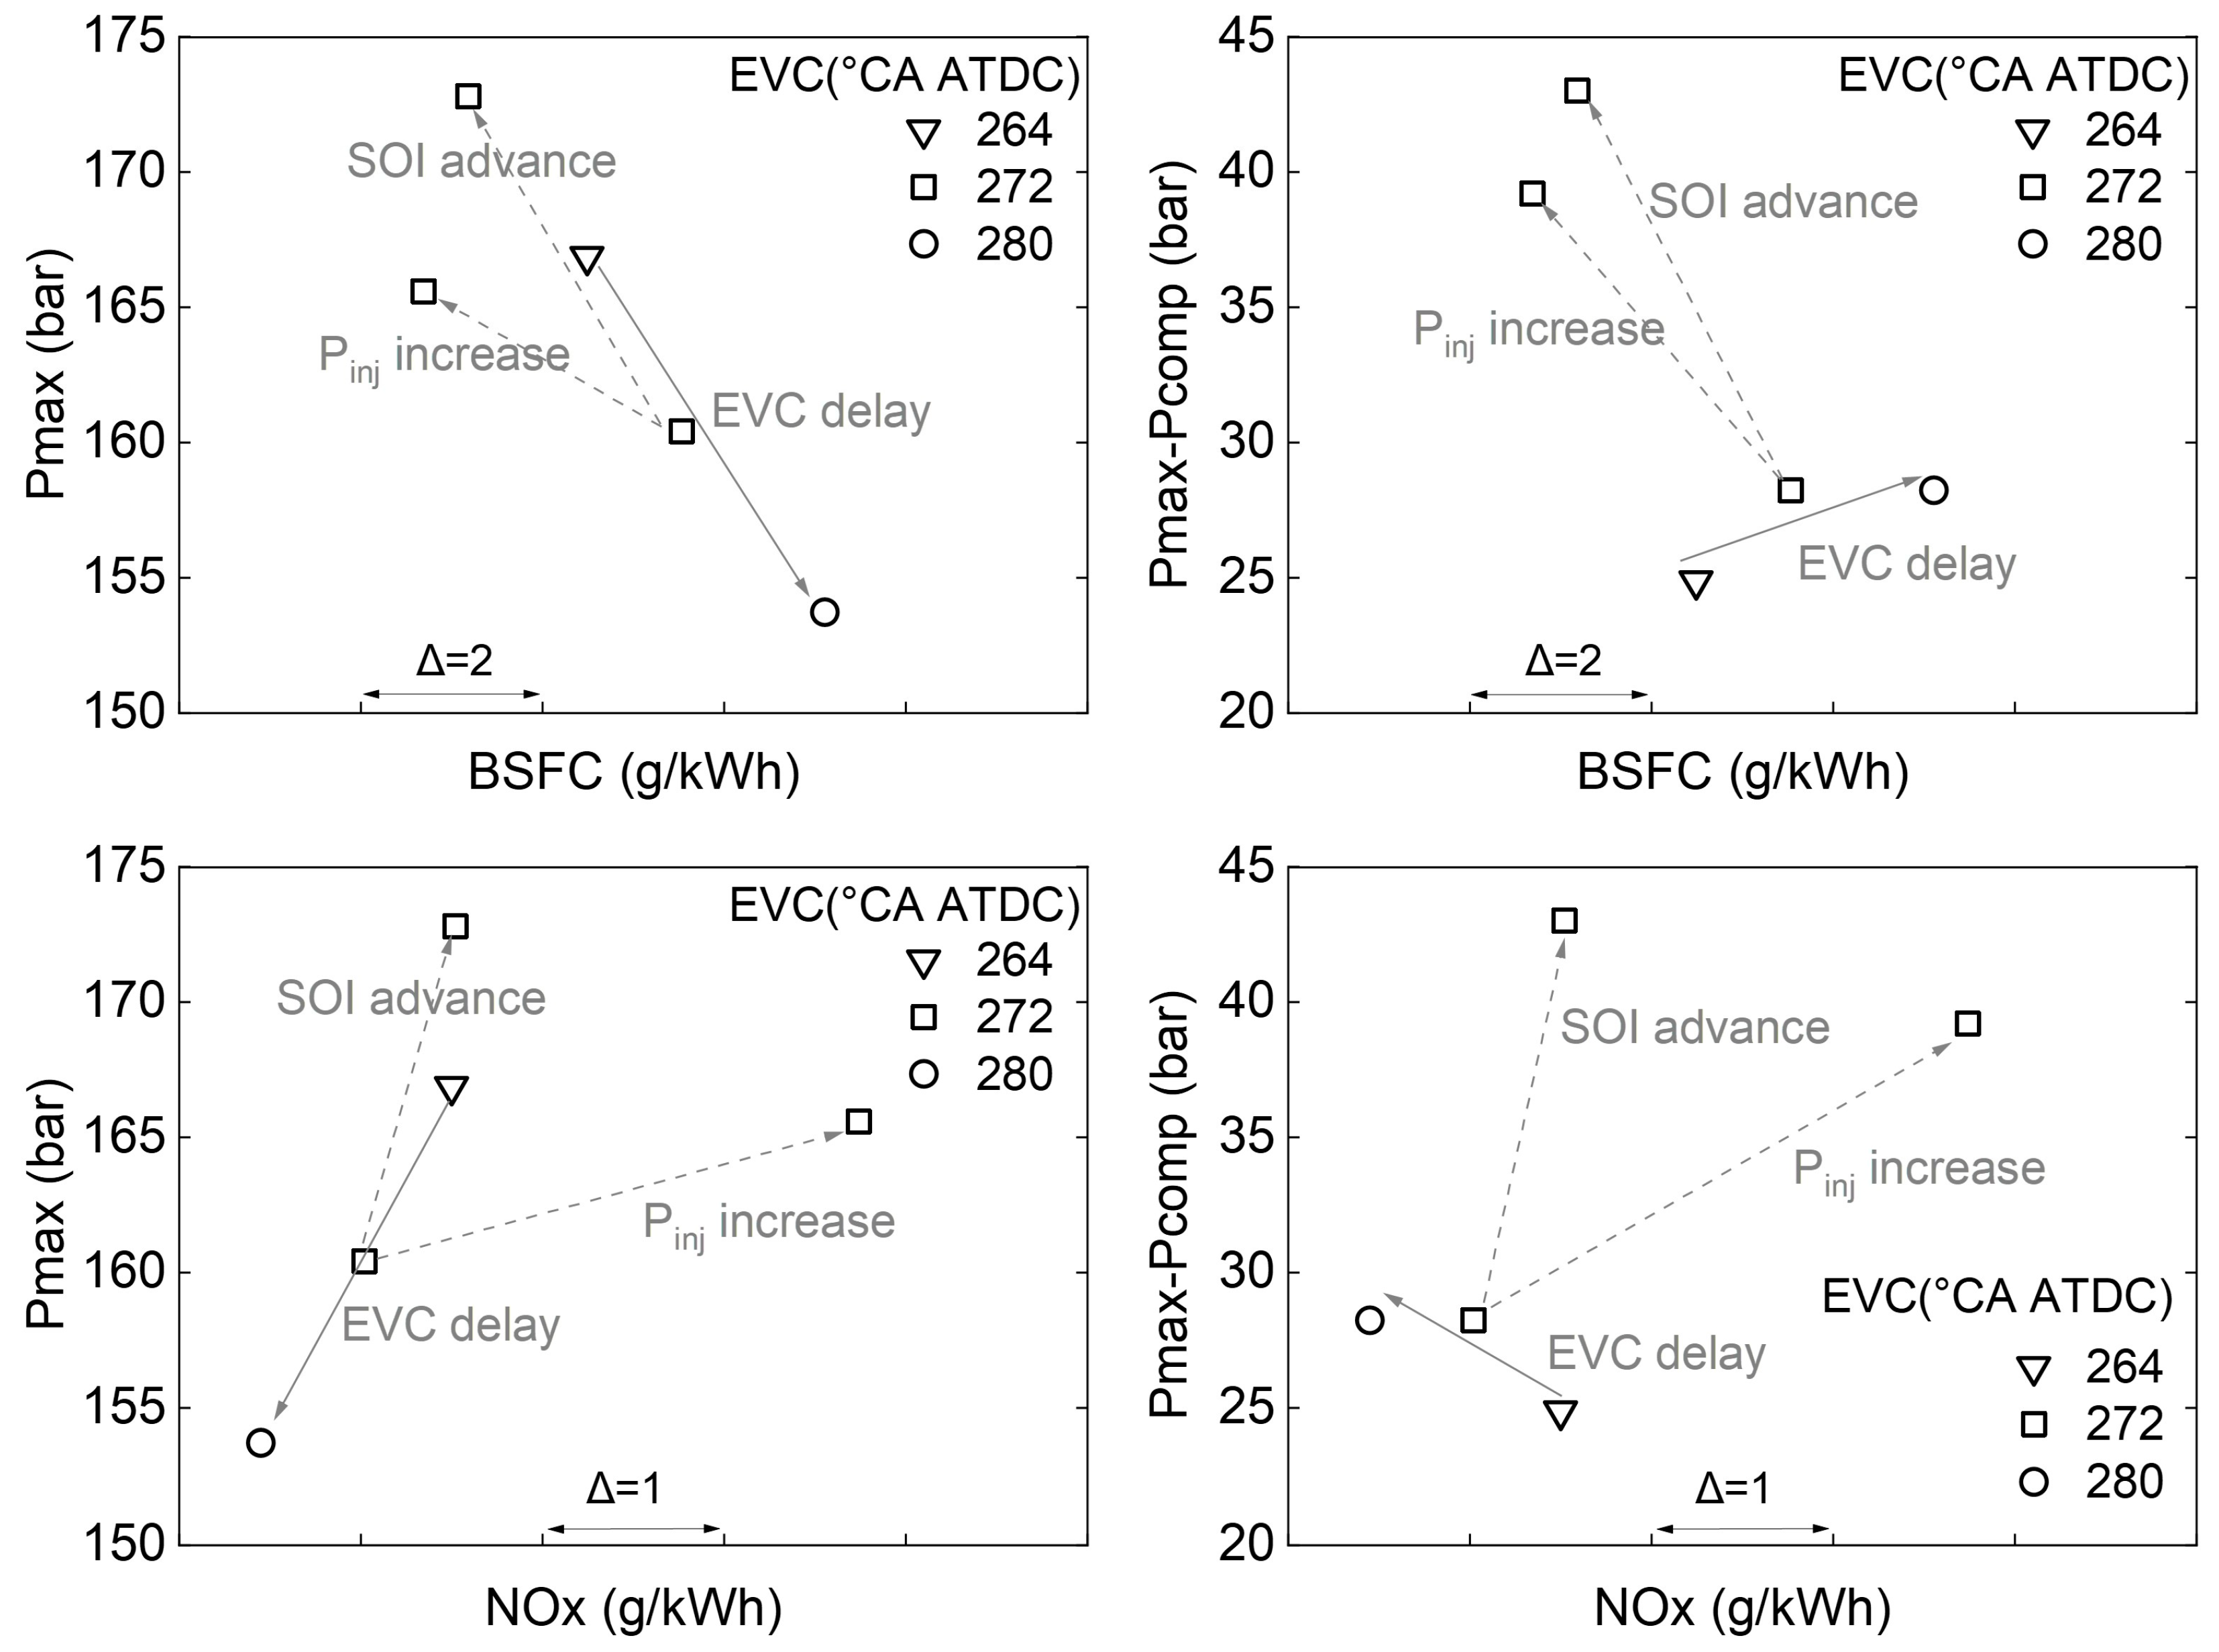
In general, at the same engine load, a higher maximum cylinder pressure is favorable to the improvement of BSFC, and vice versa. As shown in Figure 6, along with the delay of EVC, that around a 10 bar decline in maximum cylinder pressure will lead to about 2 g/kWh increment of BSFC, while raising the fuel injection pressure could bring a lower BSFC at the same maximum cylinder pressure; thus, more NOx emissions will be brought, which could exceed the original level. As for the advance of fuel injection timing, the BSFC of the marine low-speed engine could be reduced with the original magnitude of NOx emission. Moreover, for the stable operation of engine, not only the maximum cylinder pressure, but also the pressure difference between maximum (Pmax) and compression cylinder pressure (Pcomp) should be limited in the specific range. Delaying the EVC will slightly raise the pressure difference between Pmax and Pcomp, while optimizing the marine low-speed engine performance by raising the fuel injection pressure, and advancing the fuel injection timing will obviously increase this pressure difference. Experimental results showed that, when the NOx emission is recovered to the original level by advancing the fuel injection timing, the pressure difference between Pmax and Pcomp has already exceeded 40 bar, which is quite close to the limitation value 45 bar on medium engine loads.
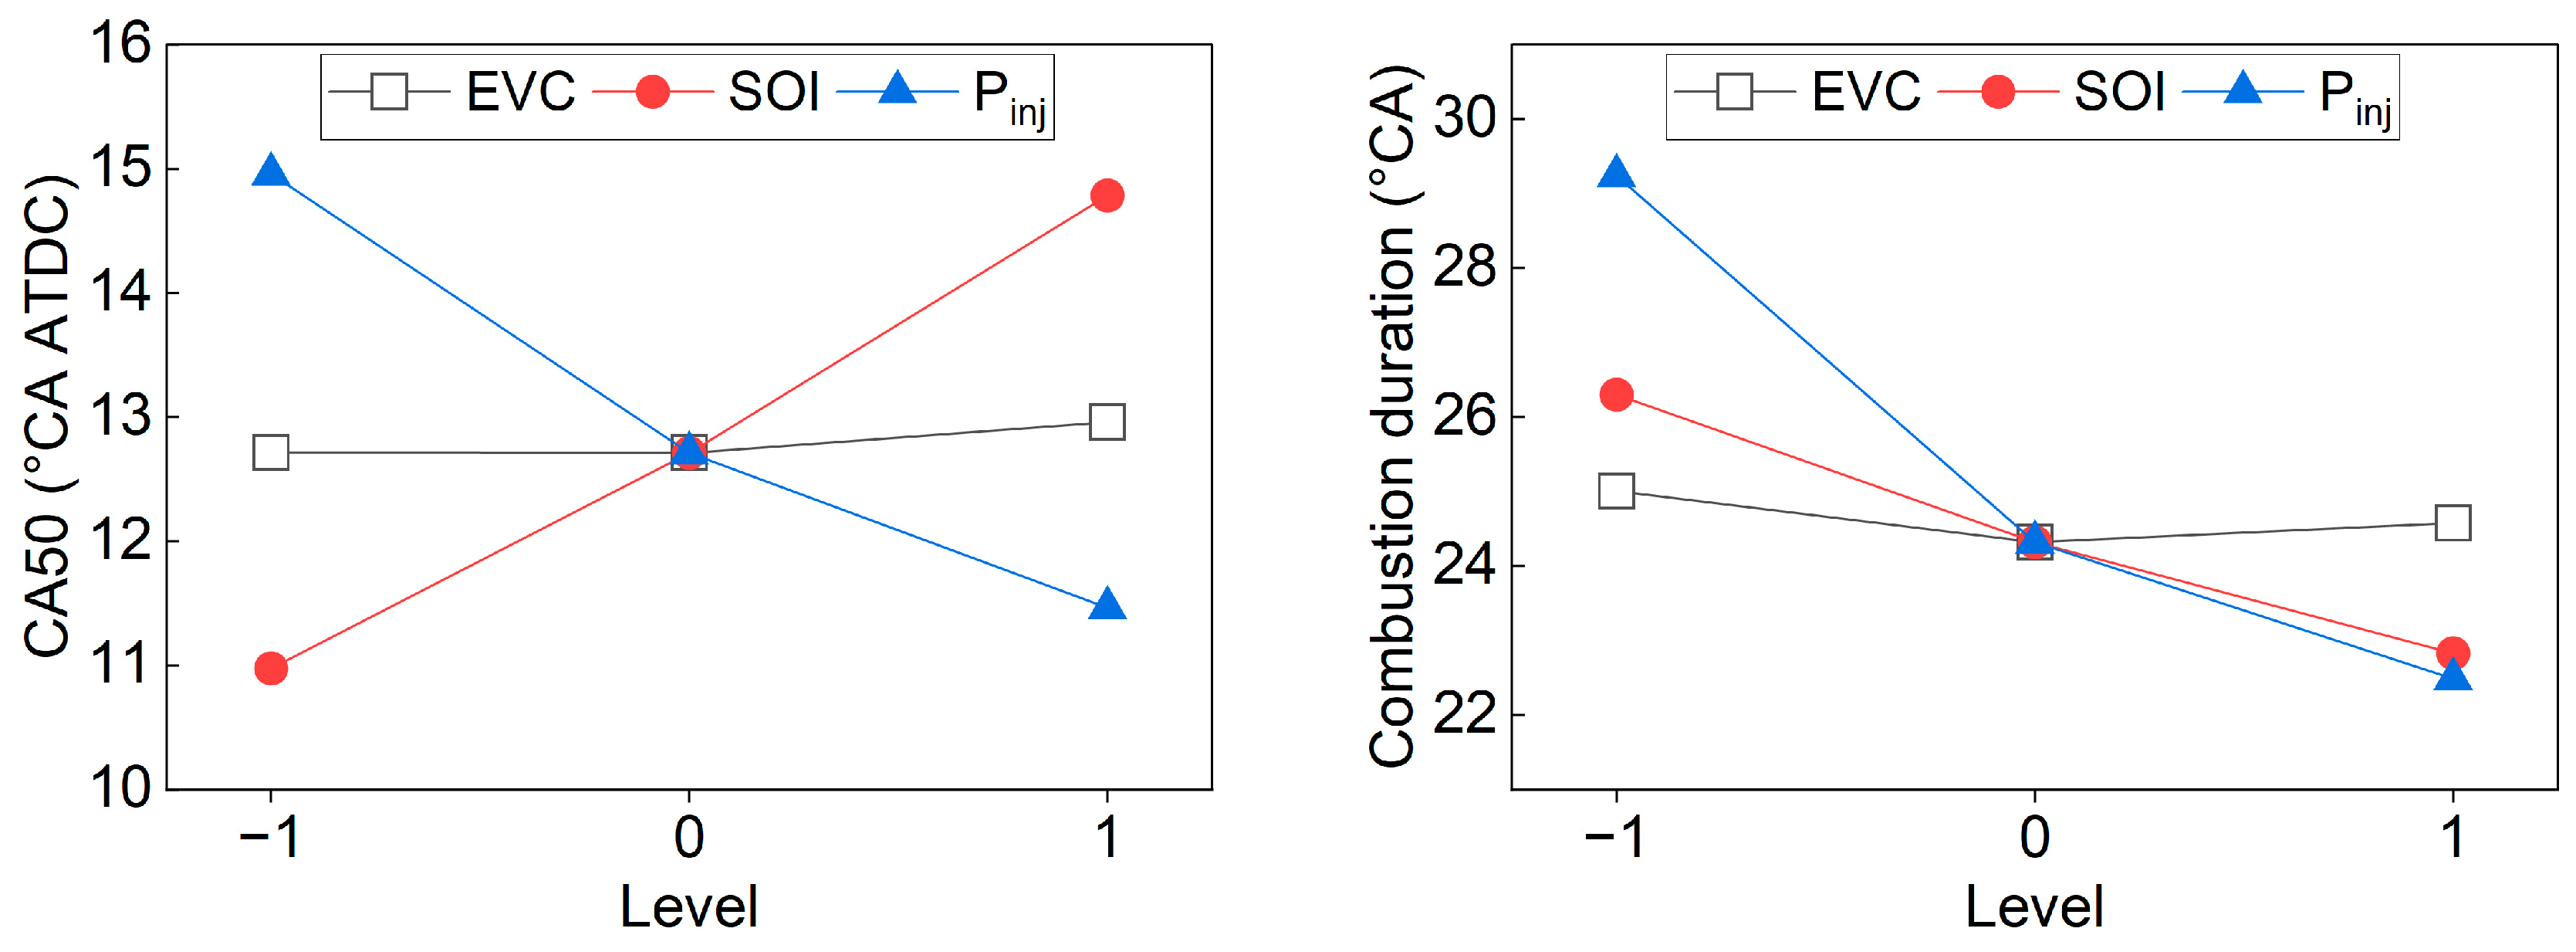
Delaying the EVC could slightly increase the CA50 and the combustion duration will decline first and then decrease, as shown in Figure 7. Advancing the SOI and increasing the fuel injection pressure have almost the same influence. The change of fuel injection pressure has a more significant influence of the combustion duration due to better atomization and fuel/air mixing. When the fuel injection pressure raises from 600 bar to 800 bar, the CA50 is advanced by 2.2 °CA and the combustion duration is roughly shortened by 17%. The fuel injection pressure continuously rises to 1000 bar, the CA50 is advanced by 1.2 °CA and the combustion duration is reduced by 8% in total.
As for their influence on the low-speed engine scavenge and exhaust system, as shown in Figure 8, delaying the EVC reduces the scavenge air pressure (Psca). The exhaust gas pressure (Pexh) also rises with it. Hence, the pressure between scavenge and exhaust almost remains constant, but delaying the EVC will push more in-cylinder charge out. Consequently, the in-cylinder relative air/fuel ratio is reduced, and the exhaust gas temperature will rise with the delay of EVC. A higher exhaust gas temperature will benefit to improve the power of turbine, which is one of reasons for the increment of scavenge air pressure.
Due to the reduction in exhaust gas temperature, increasing the fuel injection pressure and advancing the injection timing will lead to a decrease in scavenging air pressure. Different from delaying EVC, changes in injection parameters result in significant variations in the pressure difference between scavenging and exhaust, and their impact on in-cylinder relative air/fuel ratio is minimal.

3.2. Energy and Exergy Distribution

According to the experimental results, the performance and fuel economy of the marine low-speed engine could be roughly obtained along with the variation of EVC and fuel injection strategy, but more fundamental reasons should be found for a further improvement of BSFC. Consequently, the energy and the exergy analysis are conducted in the following section.
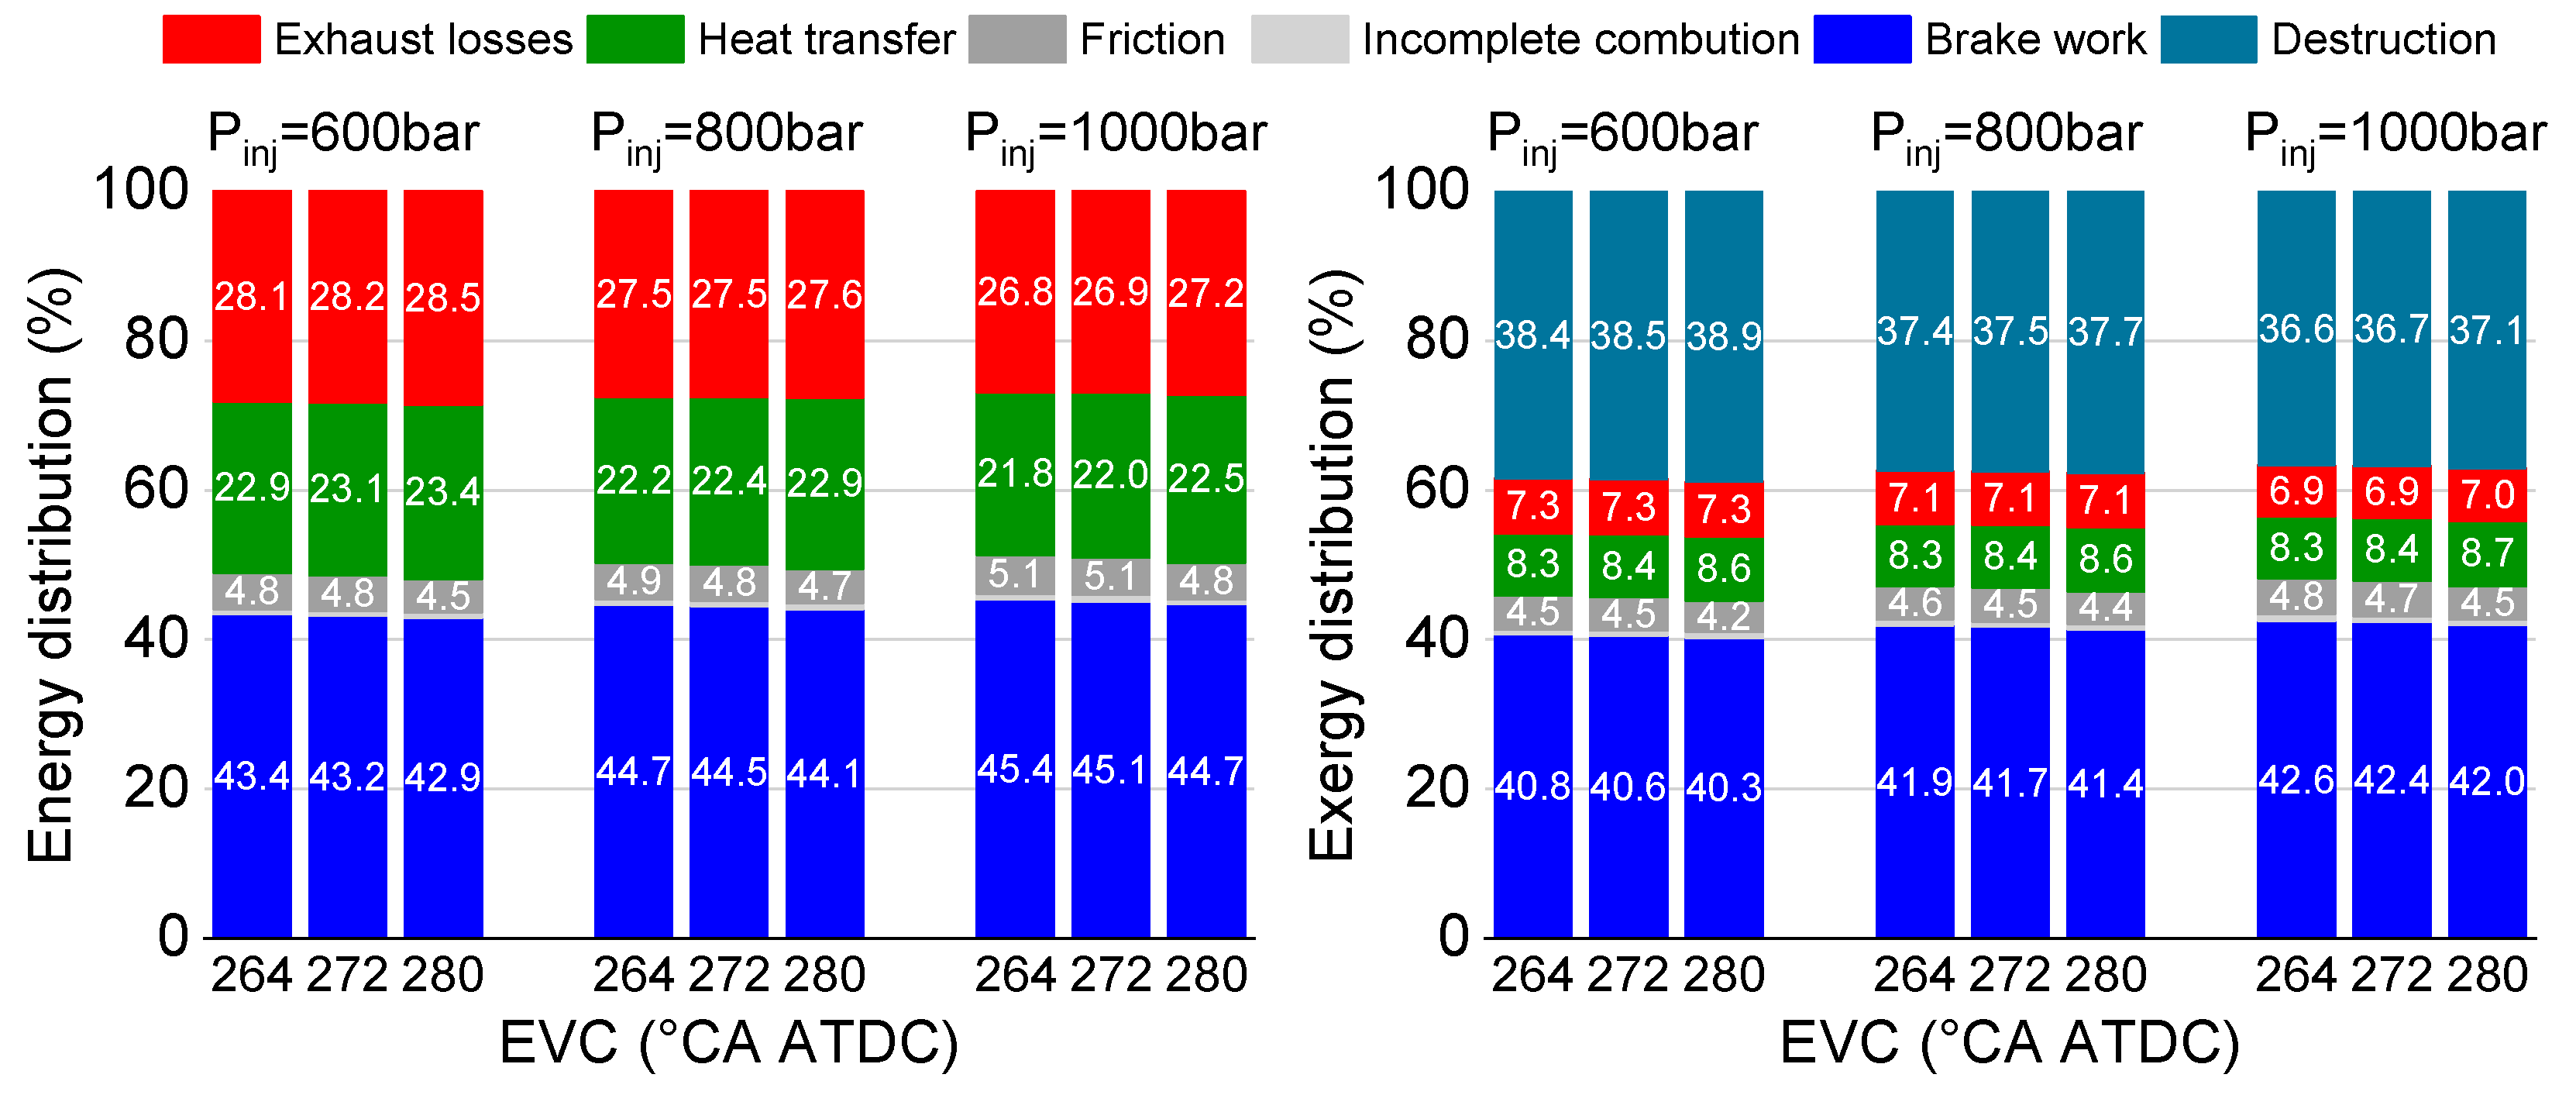
When the fuel injection timing is kept at −1 °CA ATDC, the influence of fuel injection pressure and EVC timing on energy and exergy distribution is shown in Figure 9. The fuel injection pressure is set as 600, 800 and 1000 bar, respectively. The EVC timing is set as 264, 272 and 280 °CA ATDC, separately.
According to the energy balance analysis, it could be shown that delaying the EVC timing will raise the proportion of heat transfer and exhaust gas simultaneously. The increment of heat transfer is larger, which is about two times larger than that of exhaust gas. The proportion of friction is reduced along with the delay of EVC timing. Within the limitation of maximum cylinder pressure and pressure rising rate, increasing the fuel injection pressure could obviously improve the brake thermal efficiency: when the injection pressure rises from 600 bar to 800 bar, the brake thermal efficiency could be improved by about 1.9% on average, whereas continuing to increase the injection pressure to 1000 bar means that the improvement will be no more than 1%, and the later the EVC timing is, the less the improvement is. With the increment of fuel injection pressure, the energy losses caused by exhaust gas and heat transfer are both reduced, and the variation of them are roughly equal.
According to the exergy balance analysis, only about 37% to 40% of heat transfer could be recycled through other measures in theory. As for the exhaust gas, less proportion of it could be recycled, only about 25% to 27%. Although the energy proportion of exhaust gas is about 5% higher than that of heat transfer, the exergy of exhaust gas is about 1% to 2% less than that of heat transfer. At the condition with constant fuel injection timing, the delay of EVC will be favorable to reduce the destruction: when the EVC is delayed from 264 to 272 °CA, the destruction is reduced about 1.2%, and when the EVC is continuously delayed to 280 °CA, the destruction will be reduced about 0.7%, while the increment of fuel injection pressure will lead to a slight increment of destruction. Figure 10 and Figure 11 present the results of thermodynamic balance analysis under two different injection timings. When the fuel injection timing is delay, the exergy efficiency will be reduced accordingly, and the higher the fuel injection pressure is, the larger the decrement of exergy efficiency will be.

3.3. Quantification of Engine Irreversibilities

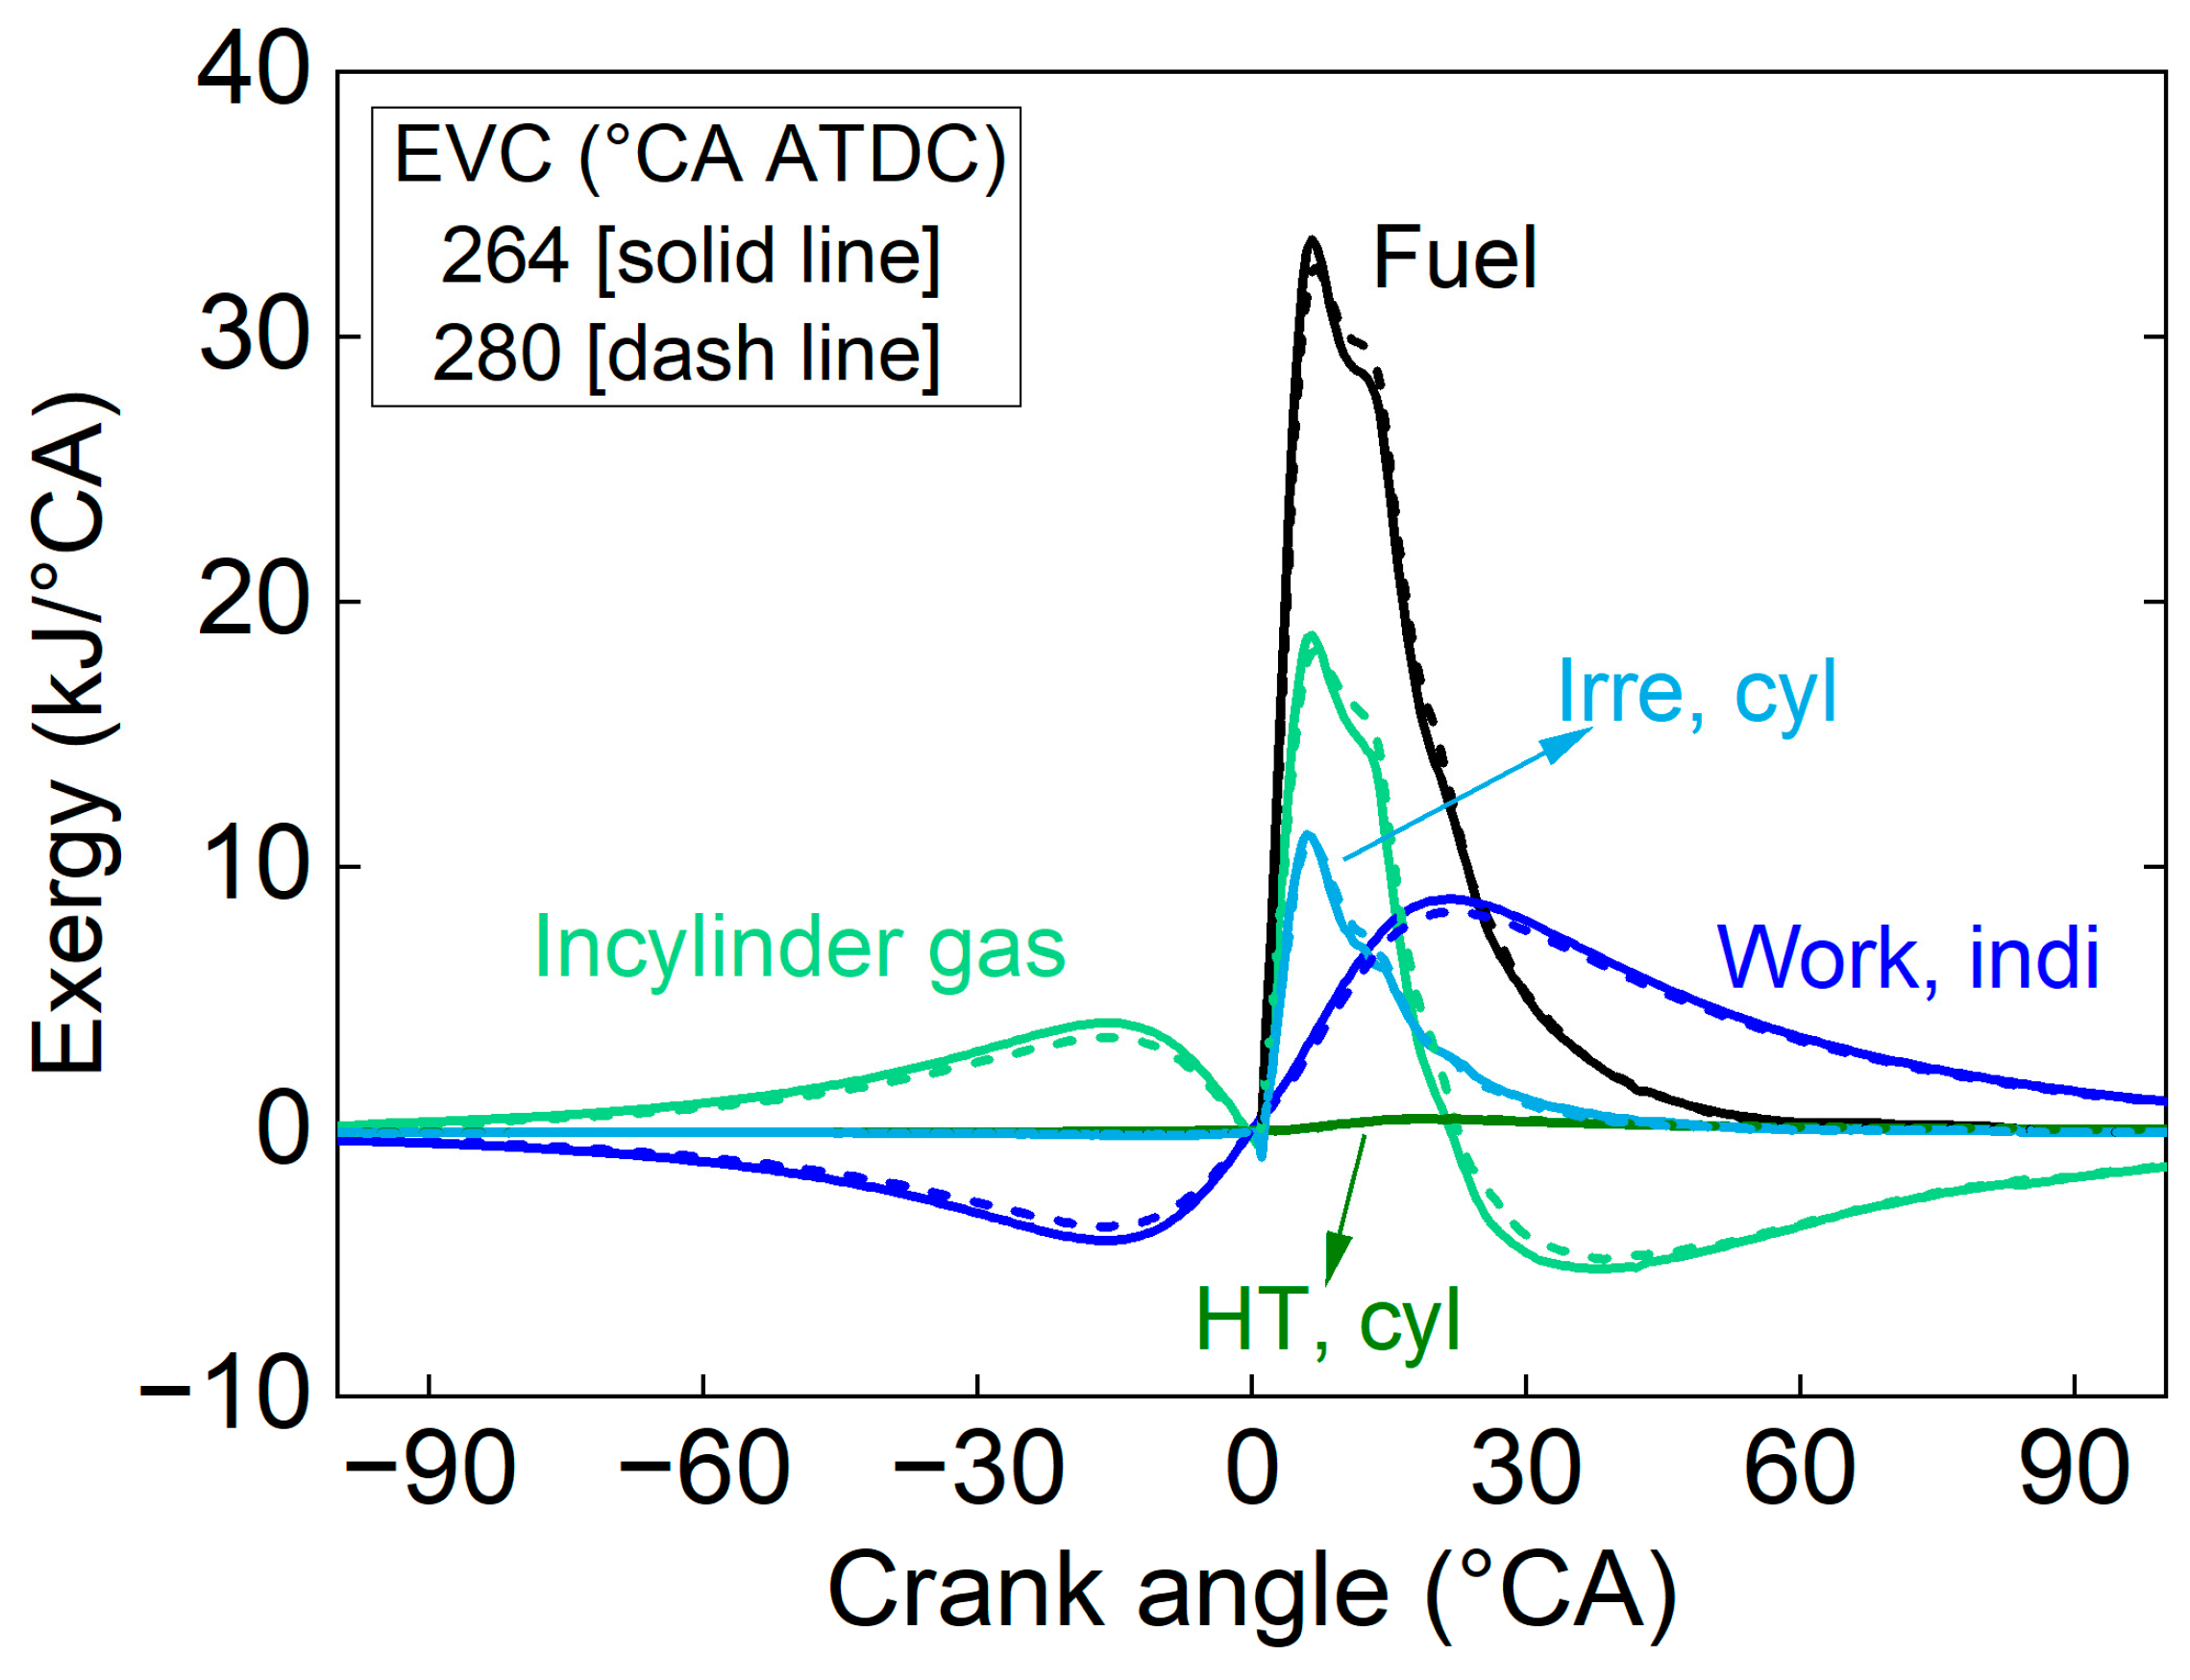
The influence of EVC, SOI and fuel injection pressure on the development of rate in-cylinder exergy terms is shown in Figure 12, Figure 13 and Figure 14. Along with the delay of EVC, during the compression stroke, the negative work caused by piston is reduced, and the exergy rate of in-cylinder charge also rises more slowly. The variation of fuel exergy rate demonstrates the characteristic with double peaks, which is in coincidence with heat release rate. As for the in-cylinder destruction rate, which is the deviation form of destruction, is constant in general. When the SOI is delayed, each term after the top dead center (TDC) is retarded accordingly, and the peak of piston working rate will appears more lately too. When the fuel injection pressure is increased, the peak value of in-cylinder destruction rate will rise, the peak timing is almost constant, and the decline part of in-cylinder destruction rate will decrease more rapidly.
Cumulative in-cylinder destruction is shown in Figure 15. Delaying the EVC will slightly reduce the total in-cylinder destruction, while the delay of SOI will raise that in some degree. The increment of fuel injection pressure could make the destruction rise more rapidly at the beginning combustion, but the total in-cylinder destruction is then reduced.
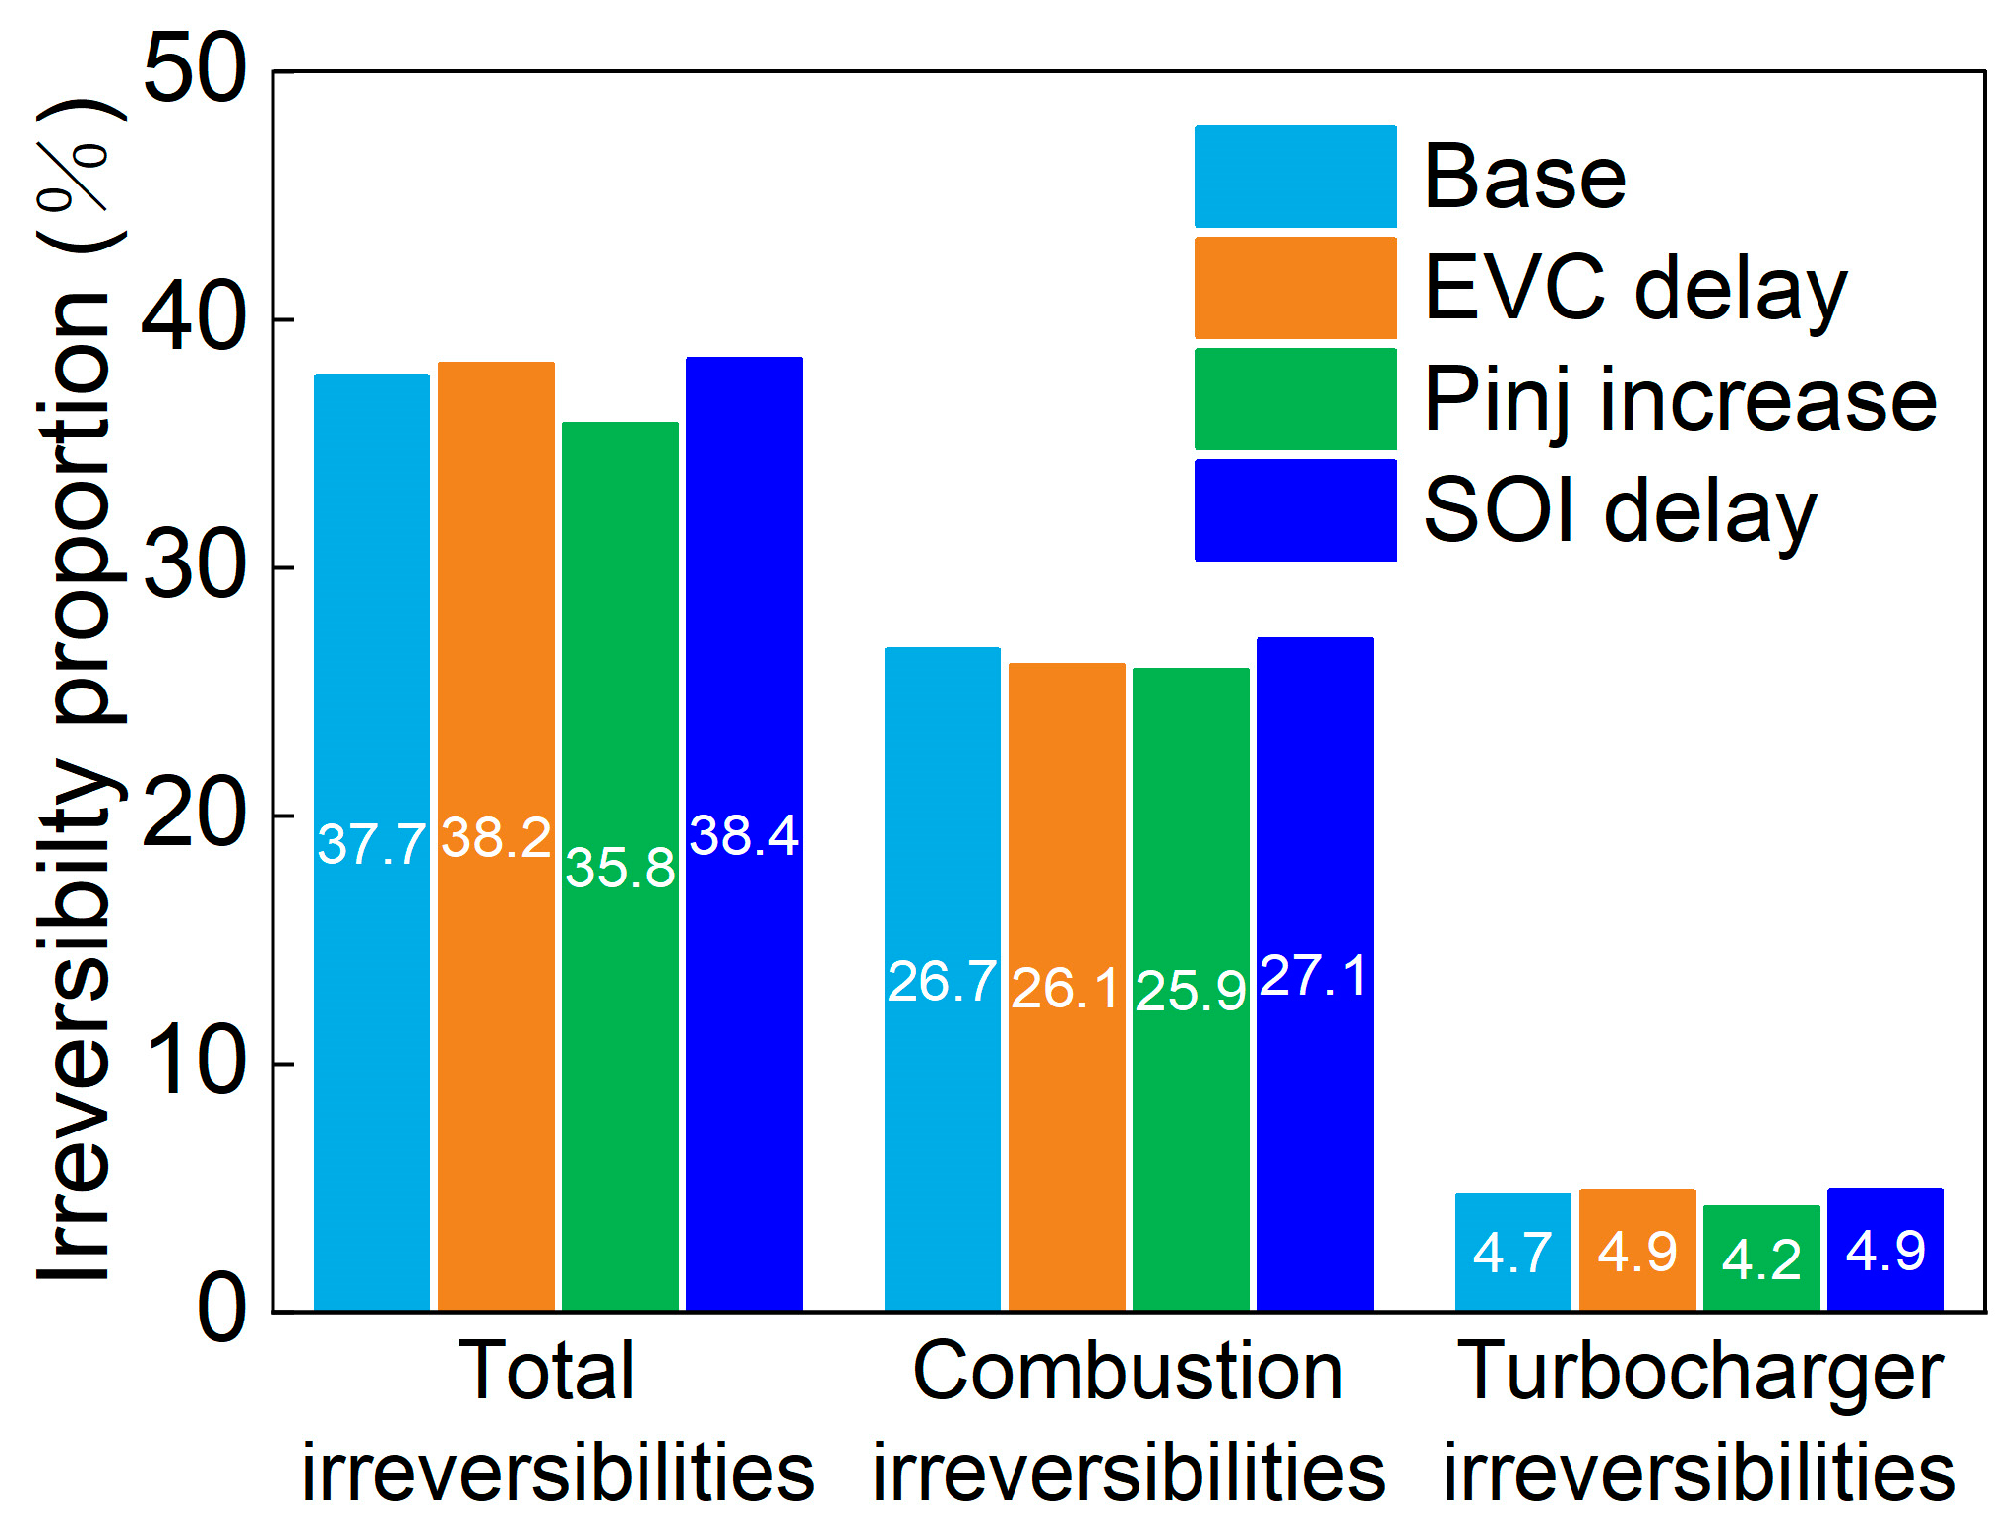
According to the engine cycle and the second law analysis of in-cylinder process, delaying the EVC will lead to the increment of irreversibility; the destruction of in-cylinder combustion process will decrease slightly and the destruction caused by turbocharger could increase, while increasing the fuel injection pressure will reduce them simultaneously, including the total irreversibility and the destruction of combustion and turbocharger. However, delaying the SOI will lead to the opposite results compared with increasing the fuel injection pressure: all of them will be increased (Figure 16).

4. Conclusions

The energy and the exergy analysis are correspondingly conducted based on the experimental results, combining exhaust valve closing (EVC) timing and fuel injection strategy. Related results could be concluded as below:
  • Experimental results show that delaying EVC could reduce the NOx emission by decreasing the effective compression ratio. With the same fuel injection strategy, a 16 °CA delay of EVC could achieve about 8% decrement of NOx emission.
  • According to the following energy analysis based on the experimental results, the loss of heat transfer and exhaust gas both take more than 20% in proportion. Retarding the EVC and the start of injection (SOI) could raise the energy loss of heat transfer and exhaust gas. Increasing the fuel injection pressure reduces these two losses and the brake specific fuel consumption could be obviously improved, while this kind of improvement will be limited by the maximum cylinder pressure and the pressure difference of maximum and compression cylinder pressure.
  • The following exergy analysis demonstrated that the exergy of heat transfer and exhaust gas are both below 9% in proportion, and the heat transfer exergy is about 1% higher than that of exhaust gas. Delaying the EVC will not change the ratio of exhaust gas exergy, but will raise the proportion of heat transfer. The main reason is that the decline of relative air/fuel ratio led to the increment of in-cylinder temperature during the combustion process. Retarding the start of injection has less influence on the exhaust gas and the heat transfer exergy. Increasing the fuel injection pressure will not change the proportion of heat transfer exergy, but could reduce that of exhaust gas, improving the exergy efficiency of marine low-speed engine.
  • The total irreversibility could take about 35% to 39% of fuel exergy, the combustion process could account, roughly, 70%, and the proportion produced by turbocharger is about 12%. Delaying the EVC almost has no influence on the combustion irreversibility, and retarding the SOI could raise it while increasing the fuel injection pressure could effectively reduce the irreversibility during the combustion process.
  • For future research, the combination of delaying EVC, variable compression ratio and suitable fuel-air organization will be a powerful measure to improve the fuel consumption and eliminate the NOx emission simultaneously. All the above methods, especially the suitable fuel-air organization, will be effective to achieve this target, the reason of which is mainly due to the limitation of irreversibility in cylinders.

Author Contributions

H.Z., formal analysis, methodology, writing—original draft, writing—review and editing; W.L., formal analysis, funding acquisition; G.X., Data curation, funding acquisition, formal analysis.; J.T., Data curation, funding acquisition, formal analysis.; B.L., writing—review and editing; D.W., Resources, data curation, experiment; Y.Q., Resources, data curation, project administration. All authors have read and agreed to the published version of the manuscript.

Funding

This research was supported by National Key R&D Program of China (No. 2022YFB4300700).

Data Availability Statement

The data presented in this study are available on request from the corresponding author.

Conflicts of Interest

The authors declare no conflict of interest.

Abbreviations

AHRRApparent heat release rate
BSFCBrake specific fuel consumption, g/kWh
ISFCIndicated specific fuel consumption, g/kWh
CACrank angle, °CA
EGRExhaust gas recirculation
EVCExhaust valve closing, °CA
EVOExhaust valve opening, °CA
LHVLower heating value, J/kg
SCRSelective catalytic reduction
TDCTop dead center, °CA
ATDCAfter top dead center, °CA
SOIStart of injection
WMCWater mist catcher

References

  1. DieselNet. Emission Standards: IMO Marine Engine Regulations. DieselNet. 2023. Available online: https://dieselnet.com/standards/inter/imo.php (accessed on 28 August 2023).
  2. IMO. Prevention of Air Pollution from Ships. International Maritime Organization. 2019. Available online: https://www.imo.org/en/OurWork/Environment/Pages/Clean%20air%20in%20shipping.aspx (accessed on 4 October 2023).
  3. UNCTAD. Review of Maritime Transport 2021; United Nations: New York, NY, USA, 2021. [Google Scholar]
  4. Notteboom, T.E. Container Shipping and Ports: An Overview. Rev. Netw. Econ. 2004, 3, 1045. [Google Scholar] [CrossRef]
  5. Wik, C. Reducing medium-speed engine emissions. J. Mar. Eng. Technol. 2010, 9, 37–44. [Google Scholar] [CrossRef]
  6. Woodyard, D. Pounder’s Marine Diesel Engines and Gas Turbines, 9th ed.; Butterworth-Heinemann: Oxford, UK, 2009. [Google Scholar]
  7. Wik, C. Choice of Tier III Technologies—Ship Owners’ Viewpoints; CIMAC: Helsinki, Finland, 2016. [Google Scholar]
  8. Elkelawy, M.; El Shenawy, E.A.; Mohamed, S.A.; Elarabi, M.M.; Alm-Eldin Bastawissi, H. Impacts of EGR on RCCI engines management: A comprehensive review. Energy Convers. Manag. X 2022, 14, 100216. [Google Scholar] [CrossRef]
  9. Zhou, L.; Song, Y.; Hua, J.; Liu, F.; Wei, H. Effects of miller cycle strategies on combustion characteristics and knock resistance in a spark assisted compression ignition (SACI) engine. Energy 2020, 206, 118119. [Google Scholar] [CrossRef]
  10. Zhu, S.; Deng, K.; Liu, S.; Qu, S. Comparative analysis and evaluation of turbocharged Dual and Miller cycles under different operating conditions. Energy 2015, 93, 75–87. [Google Scholar] [CrossRef]
  11. Gonca, G.; Sahin, B.; Parlak, A.; Ayhan, V.; Cesur, İ.; Koksal, S. Application of the Miller cycle and turbo charging into a diesel engine to improve performance and decrease NO emissions. Energy 2015, 93, 795–800. [Google Scholar] [CrossRef]
  12. Verschaeren, R.; Schaepdryver, W.; Serruys, T.; Bastiaen, M.; Vervaeke, L.; Verhelst, S. Experimental study of NOx reduction on a medium speed heavy duty diesel engine by the application of EGR (exhaust gas recirculation) and Miller timing. Energy 2014, 76, 614–621. [Google Scholar] [CrossRef]
  13. Guan, W.; Pedrozo, V.; Zhao, H.; Ban, Z.; Lin, T. Investigation of EGR and Miller Cycle for NOx Emissions and Exhaust Temperature Control of a Heavy-Duty Diesel Engine. SAE Tech. Pap. 2017. [Google Scholar] [CrossRef]
  14. Pedrozo, V.B.; Zhao, H. Improvement in high load ethanol-diesel dual-fuel combustion by Miller cycle and charge air cooling. Appl. Energy 2018, 210, 138–151. [Google Scholar] [CrossRef]
  15. Ji, W.; Li, A.; Lu, X.; Huang, Z.; Zhu, L. Numerical study on NOx and ISFC co-optimization for a low-speed two-stroke engine via Miller cycle, EGR, intake air humidification, and injection strategy implementation. Appl. Therm. Eng. 2019, 153, 398–408. [Google Scholar] [CrossRef]
  16. Zhou, S.; Gao, R.; Feng, Y.; Zhu, Y. Evaluation of Miller cycle and fuel injection direction strategies for low NOx emission in marine two-stroke engine. Int. J. Hydrog. Energy 2017, 42, 20351–20360. [Google Scholar] [CrossRef]
  17. Feng, L.; Tian, J.; Long, W.; Gong, W.; Du, B.; Li, D.; Chen, L. Decreasing NOx of a Low-Speed Two-Stroke Marine Diesel Engine by Using In-Cylinder Emission Control Measures. Energies 2016, 9, 304. [Google Scholar] [CrossRef]
  18. Liu, H.; Zhang, H.; Wang, H.; Zou, X.; Yao, M. A Numerical Study on Combustion and Emission Characteristics of Marine Engine through Miller Cycle Coupled with EGR and Water Emulsified Fuel. SAE Tech. Pap. 2016. [Google Scholar] [CrossRef]
  19. Pugnali, L.D.; Chen, R. Feasibility Study of Operating 2-Stroke Miller Cycles on a 4-Stroke Platform through Variable Valve Train; SAE International: Warrendale, PA, USA, 2015. [Google Scholar]
  20. Bejan, A.; Tsatsaronis, G.; Moran, M. Thermal Design and Optimization; John Wiley and Sons Inc.: New York, NY, USA, 1996. [Google Scholar]
  21. Azoumah, Y.; Blin, J.; Daho, T. Exergy efficiency applied for the performance optimization of a direct injection compression ignition (CI) engine using biofuels. Renew. Energy 2009, 34, 1494–1500. [Google Scholar] [CrossRef]
  22. Wang, P.; Tang, X.; Shi, L.; Ni, X.; Hu, Z.; Deng, K. Experimental investigation of the influences of Miller cycle combined with EGR on performance, energy and exergy characteristics of a four-stroke marine regulated two-stage turbocharged diesel engine. Fuel 2021, 300, 120940. [Google Scholar] [CrossRef]
  23. Fu, J.; Liu, J.; Feng, R.; Yang, Y.; Wang, L.; Wang, Y. Energy and exergy analysis on gasoline engine based on mapping characteristics experiment. Appl. Energy 2013, 102, 622–630. [Google Scholar] [CrossRef]
  24. Hong, B.; Mahendar, S.K.; Hyvönen, J.; Cronhjort, A.; Erlandsson, A.C. Quantification of Losses and Irreversibilities in a Marine Engine for Gas and Diesel Fuelled Operation Using an Exergy Analysis Approach. American Society of Mechanical Engineers Digital Collection. In Proceedings of the ASME 2020 Internal Combustion Engine Division Fall Technical Conference, Virtual, 4–6 November 2020. [Google Scholar]
  25. Zhu, S.; Ma, Z.; Zhang, K.; Deng, K. Energy and exergy analysis of a novel steam injected turbocompounding system applied on the marine two-stroke diesel engine. Energy Convers. Manag. 2020, 221, 113207. [Google Scholar] [CrossRef]
  26. Zhu, S.; Ma, Z.; Zhang, K.; Deng, K. Energy and exergy analysis of the combined cycle power plant recovering waste heat from the marine two-stroke engine under design and off-design conditions. Energy 2020, 210, 118558. [Google Scholar] [CrossRef]
  27. Yoshida, S.; Yamamoto, H. Exergy analysis of a diesel engine cycle and its performance improvement. Int. J. Exergy 2005, 2, 284–298. [Google Scholar] [CrossRef]
  28. Marty, P.; Hétet, J.-F.; Chalet, D.; Corrignan, P. Exergy analysis of complex ship energy systems. Entropy 2016, 18, 127. [Google Scholar] [CrossRef]
  29. Zhang, H.; Wang, D.; Long, W.; Qian, Y. Analysis of Energy and Exergy Distribution for Improving Fuel Economy of Marine Low-speed Two-stroke Diesel Engine. SAE Tech. Pap. 2022. [Google Scholar] [CrossRef]
  30. Wang, D.; Zhang, H.; Qian, Y.; Deng, K. Experimental energy and exergy analysis of turbocharged marine low-speed engine with high pressure exhaust gas recirculation. Fuel 2022, 323, 124360. [Google Scholar] [CrossRef]
  31. Caton, J.A. A Review of Investigations Using the Second Law of Thermodynamics to Study Internal-Combustion Engines. SAE Tech. Pap. 2000. [Google Scholar] [CrossRef]
  32. Rakopoulos, C.D.; Giakoumis, E.G. Second-law analyses applied to internal combustion engines operation. Prog. Energy Combust. Sci. 2006, 32, 2–47. [Google Scholar] [CrossRef]
  33. Zehe, M.J.; McBride, B.J.; Gordon, S. CAP: A Computer Code for Generating Tabular Thermodynamic Functions from NASA Lewis Coefficients. 2002. Available online: https://ntrs.nasa.gov/citations/20020012428 (accessed on 4 October 2023).
  34. Mayer, S.; Elena, T.A.; Andreasen, A. Design of Experiments Analysis of the NOx-SFOC Trade-Off in Two-Stroke Marine Engine; CIMAC: Bergen, Norway, 2010. [Google Scholar]
Figure 1. Schematic of 6EX340EF marine low-speed engine and main sensor locations.
Processes 11 02924 g001
Figure 2. Influence of operating parameters on NOx and BSFC.
Processes 11 02924 g002
Figure 3. Influence of EVC on in-cylinder pressure and heat release rate.
Processes 11 02924 g003
Figure 4. Influence of SOI on in-cylinder pressure and heat release.
Processes 11 02924 g004
Figure 5. Influence of Pinj on in-cylinder pressure and heat release rate.
Processes 11 02924 g005
Figure 6. Influence of operating parameters on Pmax and Pmax-Pcomp.
Processes 11 02924 g006
Figure 7. Influence of operating parameters on combustion center (CA50) and combustion duration (CA10-90).
Processes 11 02924 g007
Figure 8. Influence of operating parameters scavenge and exhaust status.
Processes 11 02924 g008
Figure 9. Influence of EVC and Pinj on energy and exergy distribution (SOI= −1 °CA).
Processes 11 02924 g009
Figure 10. Influence of EVC and Pinj on energy and exergy distribution (SOI = 1 °CA).
Processes 11 02924 g010
Figure 11. Influence of EVC and Pinj on energy and exergy distribution (SOI = 3 °CA).
Processes 11 02924 g011
Figure 12. Influence of EVC on each component of in-cylinder exergy rate.
Processes 11 02924 g012
Figure 13. Influence of SOI on each component of in-cylinder exergy rate.
Processes 11 02924 g013
Figure 14. Influence of Pinj on each component of in-cylinder exergy rate.
Processes 11 02924 g014
Figure 15. Influence of EVC, SOI and Pinj on accumulative combustion irreversibility.
Processes 11 02924 g015
Figure 16. Influence of EVC, SOI and Pinj on irreversibility type.
Processes 11 02924 g016
Table 1. Main parameters of engine.
Engine ParameterValue
Bore (mm)340
Number of cylinders6
Stroke (mm)1600
Geometric compression ratio19.8
Connecting rod length (mm)1600
Rated rotation speed (revolutions per minute, RPM)157
Rated power (kW)4896
Table 2. Test conditions of low-speed engine.
ParametersValue
Engine load (%)75
Speed (RPM)142.6
Power (kW)3679
EVC (°CA ATDC)264, 272, 280
Fuel injection pressure (bar)600, 800, 1000
Start of injection (°CA ATDC)−1, 1, 3
Table 3. The model and error of the main equipment.
ParameterEquipmentUncertainty
SpeedNabtesco: Governor Unit±1%
TorqueJAPAN: CSFR-22.00.2%
TemperatureKONGSBERG: PO702457±1%
PressureTempress: 0–4 bar±0.5%
HumidityTEST0: TESTO623±3%
Cylinder pressureABB: CylMate±0.2%
Fuel flowEndress Hauser: 80F40–10C2/0±0.16%
Disclaimer/Publisher’s Note: The statements, opinions and data contained in all publications are solely those of the individual author(s) and contributor(s) and not of MDPI and/or the editor(s). MDPI and/or the editor(s) disclaim responsibility for any injury to people or property resulting from any ideas, methods, instructions or products referred to in the content.