Article

Is Hydrogen Peroxide Generated in Infusions of Medicinal Herbs?

by
Anna Tama
1,
Natalia Pieńkowska
1,
Ireneusz Stefaniuk
2,
Grzegorz Bartosz
3,
Ireneusz Kapusta
4 and
Izabela Sadowska-Bartosz
1,*
1
Laboratory of Analytical Biochemistry, Institute of Food Technology and Nutrition, College of Natural Sciences, University of Rzeszow, 35-601 Rzeszow, Poland
2
Institute of Materials Engineering, College of Natural Sciences, University of Rzeszow, 35-310 Rzeszow, Poland
3
Department of Bioenergetics, Food Analysis and Microbiology, Institute of Food Technology and Nutrition, College of Natural Sciences, University of Rzeszow, 35-601 Rzeszow, Poland
4
Department of Food Technology and Human Nutrition, College of Natural Sciences, University of Rzeszow, 35-601 Rzeszow, Poland
*
Author to whom correspondence should be addressed.
Processes 2023, 11(10), 2855; https://doi.org/10.3390/pr11102855
Submission received: 10 September 2023 / Revised: 23 September 2023 / Accepted: 26 September 2023 / Published: 28 September 2023
(This article belongs to the Section Biological Processes and Systems)

Abstract

:
Hydrogen peroxide is an important intra- and inter-cellular messenger. It has been reported that beverages such as tea and coffee generate H2O2. The aim of this study was to examine whether H2O2 is formed in infusions of medicinal herbs and to explain the mechanism of its formation. Infusions of sixteen herbs were studied and the presence of H2O2 was found in all cases. The highest concentrations of H2O2, exceeding 50 µM, were found in the infusions of leaves of Betula and Polygonum, as well as of the inflorescence of Tilia. Considerable amounts of diverse phenolic compounds were detected in the infusions. Two successive one-electron oxidations of phenolics are the main source of H2O2 in these infusions; as expected, the generation of semiquinone and superoxide radicals was confirmed. The infusions of medicinal herbs were also able to scavenge H2O2. The herbal infusions were cytotoxic to human ovary cancer SKOV-3 and PEO1 cells; this cytotoxicity was compromised by catalase added to the growth medium, demonstrating the contribution of H2O2 to the cytotoxic action of herbal extracts.

1. Introduction

Hydrogen peroxide (H2O2) is an oxidizing compound mainly used in industry for bleaching cotton, other textiles and wood pulp, as a rocket propellant and for cosmetic and medicinal purposes [1]. Hydrogen peroxide is a bactericidal and virucidal agent [2,3,4]. Solutions (1–6%) of H2O2 are used as a debriding agent for wound care [5]. In 1% formulations, H2O2 is used to treat acne; it is studied in concentrations of 25% to 40% to treat skin tumors and in concentrations of 40–45% to treat common warts [6]. Hydrogen peroxide is also used for dental whitening [7,8] and as a component of mouthwash [9]. However, H2O2 should be used with caution, as exposure to this compound can cause adverse effects due to its oxidant capabilities. Hydrogen peroxide solutions containing more than about 8 percent hydrogen peroxide are corrosive to the skin [6]. The accidental ingestion of 3% (i.e., ca 0.88 M) hydrogen peroxide may lead to gastric injury in children [10].
Hydrogen peroxide is a physiologically relevant compound; it is important in the defense against pathogenic microorganisms at micromolar up to low millimolar concentrations and participates in intra- and inter-cellular signaling at nanomolar up to low micromolar concentrations [11,12]. However, higher H2O2 concentrations are also cytotoxic to mammalian cells. The sensitivity of cells to hydrogen peroxide differs substantially, depending mainly on the activity of catalase [13,14,15]. We found H2O2 concentrations half-inhibiting the proliferation of two fibroblast cell lines, which differed considerably in their catalase activity, to be 528 and 33.5 μM, respectively [15].
Interestingly, humans are permanently ingesting H2O2, from the first days of life, albeit in micromolar concentrations. Human milk contains H2O2; average H2O2 concentrations of 27 μM and 25 μM were reported in human milk collected 1–5 days post-partum [16] and in the first week after birth, respectively [17]. It has been convincingly demonstrated that commonly consumed beverages such as tea [18,19,20,21] and coffee [22,23,24] generate H2O2 upon brewing and subsequent standing. The hydrogen peroxide concentration in freshly brewed coffee was found to be 20–80 µM, depending on the type of coffee [23], while in green and black tea, it exceeded 200 µM and 700 µM after standing for 1 and 12 h, respectively [19]. We recently documented the generation of H2O2 in cooked vegetables [25,26]. Wines, especially red wines, generate H2O2 [27,28], although wine components may also react with this compound [28].
In addition to the most popular beverages from plants, infusions of medicinal herbs are also often consumed as they are recommended by traditional or complementary medicine or as tea substituents. To the best of our knowledge, there is no information on the presence of H2O2 in infusions of medicinal herbs. The aim of this study was to check whether H2O2 is generated in infusions of the chosen medicinal herbs, like in tea, and to investigate the mechanism of H2O2 formation in the infusions.
It has been reported that the cytotoxic effects of tea and wine in vitro were contributed by the hydrogen peroxide generated by them in the cell culture media [27]. The cytotoxicity of medicinal herbs has been also the subject of numerous in vitro studies, e.g., [29,30,31,32,33]. Another aim of this study was thus to examine whether H2O2 also contributes to the cytotoxicity of several herbal infusions to human cancer cells in vitro.

2. Materials and Methods

2.1. Materials and Equipment

Cell culture medium (McCoy’s 5A (cat. no 22330-021)), RPMI + GlutaMAX (cat. no 72400-021), DMEM + GlutaMax (cat. no. 21885-025) and Dulbecco’s Phosphate Buffered Saline (DPBS) (cat. no. 14040-117) were purchased from Thermo Fisher Scientific (Waltham, MA, USA). Fetal Bovine Serum (cat. no. S1813), Penicillin-Streptomycin solution (cat. no. L0022), Trypsin-EDTA solution (10×) (cat. no. X0930) and Phosphate-Buffered Saline without Ca2+ and Mg2+ (cat. no. P0750) were obtained from Biowest (Nuaillé, France). Ethanol (96%, cat. no. 396420113), glacial acetic acid (cat. no. 568760114) and Xylenol Orange were obtained from Avantor Performance Materials (Gliwice, Poland). Other reagents including catalase (cat. no. C40; ≥10,000 units/mg protein), superoxide dismutase (cat. no. S9697), Nitrotetrazolium Blue (NBT; cat. no. N6876) and dihydroethidium (cat. no. 309800) were purchased from Merck (Poznań, Poland).
Additionally, 75 cm2 flasks (cat. no. 156499) were provided by ThermoFisher Scientific (Waltham, MA, USA). Transparent 96-well culture plates (cat. no 655180) were obtained from Greiner (Kremsmünster, Austria). Other sterile cell culture materials were provided by Nerbe (Winsen, Germany).
Human ovarian cancer cell lines (SKOV-3) and the human lung normal fibroblast cell line (MRC-5) were obtained from the American Type Culture Collection (ATCC). We also used a second ovarian cancer cell line (PEO1). purchased from the European Collection of Authenticated Cell Cultures (ECACC).
Spectrophotometric and fluorimetric measurements were conducted using a Spark multimode microplate reader (Tecan Group Ltd., Männedorf, Switzerland).

2.2. Plant Material

Sixteen different herbs were examined. Their basic characteristics and application in traditional and alternative medicine are given in the Supplementary material. The herbs of Achillea millefolium, Artemisia absinthium, Cistus incanus, Hypericum perforatum and Polygonum aviculare; leaves of Betula pendula, Taraxacum officinale, Melissa officinalis, Mentha piperica, Plantago lanceolata, Tussilago farfara and Urtica dioica; inflorescence of Tilia cordata; and flowers of Calendula officinalis and Lavandula angustifolia were purchased from a local herbal store in Rzeszów, Poland. Data on their origin and time of collection were not available. Leaves of Ginkgo biloba were collected from a tree grown in the garden of the corresponding author in Rzeszow (podkarpackie region, Poland, in August 2022).

2.3. Preparation of Infusions

The material was crushed in a mortar and 250 mg of the dry material was treated with 25 mL of hot tap water to imitate the standard conditions of preparations of herbal infusions. Immediately and after standing for 1 and 3 h, aliquots of the infusions were withdrawn for the assay of hydrogen peroxide. For the detection of semiquinone radicals and production of superoxide, 10% infusions were prepared (100 mg herb + 900 μL of water). The infusions used for the assay of cytotoxicity were prepared by treating 250 mg of the herbs with 25 mL of boiling phosphate-buffered saline (to provide isotonicity with the cell culture medium). After 30 min incubation, the infusions were centrifuged and sterilized using a syringe filter (0.22 μM).

2.4. Determination of Hydrogen Peroxide

Hydrogen peroxide was estimated using Xylenol Orange [34]. Although the results obtained using this method are generally assumed to reflect the actual level of peroxides, our experience points to the possibility of artifacts when analyzing complex mixtures. Firstly, colored solutions can have basic absorbance at the analytical wavelength used, which may contribute to absorbance readings. Secondly, as the method is based on the oxidation of Fe2+ to Fe3+ by hydrogen peroxide, it can be affected by the presence of other compounds able to oxidize Fe2+. The presence of significant amounts of peroxides other than H2O2 is rather improbable in herbal infusions, but polyphenols—such as epigallocatechin gallate, gallic acid, and epicatechin, as well as their oxidation products, which can be present in plant infusions—can oxidize ferrous ions [35]. Therefore, we used two procedures, which should at least partly eliminate the artifacts, but are also not free from drawbacks.
Procedure (i) using Reagent Blank: The infusion (180 µL) was added to two wells of a 96-well plate. One was supplemented with 20 µL of the Xylenol Orange Reagent (2.5 mM Xylenol Orange/2.5 mM Mohr salt in 1.1 M perchloric acid) and the other with a Blank Reagent containing the Mohr salt and perchloric acid, but no Xylenol Orange. In parallel, a blank for Xylenol Orange was prepared: two wells with 180 µL of water were supplemented with 20 µL of the Xylenol Orange Reagent and Blank Reagent, respectively. After 30 min incubation, the absorbance of the samples was measured at 560 nm. The hydrogen peroxide concentration in the infusions was calculated on the basis of corrected absorbance Acorr:
Acorr = AS,XO − AS,B − (AW,XO − AW,B)
where AS,XO—absorbance of a sample added with the Xylenol Orange Reagent;
  • AS,B—absorbance of a sample added with the Blank Reagent;
  • AW,XO—absorbance of water added with the Xylenol Orange Reagent;
  • AS,B—absorbance of water added with the Blank Reagent.
Procedure (ii) using catalase: The infusion (180 µL) was added to two wells of a 96-well plate. One well was supplemented with 2 µL of water and the other with 2 µL of a 1 mg/mL catalase solution. After 15 min incubation, 20.2 µL of the Xylenol Orange Reagent was added to both wells; after 30 min incubation, the absorbance was read at 560 nm. The difference in absorbance between the sample not treated with catalase and the catalase-treated sample was used as a measure of the hydrogen peroxide concentration. Preliminary experiments showed that the amount of catalase used was sufficient to fully decompose 1 mM hydrogen peroxide present in a 200-µL sample during the incubation time employed. The concentration of hydrogen peroxide was calculated using a calibration curve.
Procedure (i) using a Reagent Blank should eliminate the effect of the endogenous color of the solutions, as well as the basic absorbance of the Xylenol Orange Reagent, but it can be still subject to interference by compounds other than hydrogen peroxide that are able to oxidize Fe2+. Procedure (ii), based on the use of the absorbance difference between a sample not treated with catalase and a sample treated with catalase to decompose H2O2, should be specific for H2O2, irrespective of reactions of the sample components with Fe2+. However, this procedure may lead to an underestimation of the H2O2 concentration as some polyphenols inhibit catalase. The compounds most potent in catalase inhibition are epicatechin gallate and epigallocatechin gallate (IC50 values < 1 µM); they are even better inhibitors of the enzyme than the standard inhibitor azide [36]. As the strong inhibitors of catalase may be present in the infusions at various concentrations, the extent of the underestimation of the H2O2 concentration may be different for various infusions, depending on their composition.

2.5. Determination of Hydrogen Peroxide Scavenging by Herbal Extracts

Herbal infusions were added with 25 µL (final) of hydrogen peroxide, and the H2O2 concentrations were estimated immediately after the addition and after 1, 2 and 3 h of incubation. The difference—(sum of concentrations of H2O2 generated in the absence of added H2O2 and that of added H2O2) minus (the H2O2 concentrations determined in the H2O2-supplemented extracts)—was assumed to represent the magnitude of H2O2 scavenging.

2.6. Determination of Polyphenols by UPLC-PDA-MS/MS

Determination of polyphenolic compounds was carried out using the UPLC equipped with a binary pump, column and sample manager, photodiode array detector and tandem quadrupole mass spectrometer, with the electrospray ionization source working in the negative mode (Waters, Milford, MA, USA), as described elsewhere [37]. Separation was performed using the UPLC BEH C18 column (1.7 µm, 100 mm × 2.1 mm, Waters) at 50 °C, at a flow rate of 0.35 mL/min. The injection volume of the samples was 5 µL. The mobile phase consisted of water (solvent A) and 40% acetonitrile in water, v/v (solvent B). The following parameters were used: capillary voltage of 3500 V; con voltage of 30 V; con gas flow 100 L/h; source temperature of 120 °C; desolvation temperature of 350 °C; desolvation gas flow rate of 800 L/h. Polyphenolic identification and quantitative analyses were performed on the basis of the mass-to-charge ratio, retention time, specific PDA spectra, fragment ions and comparison of the data obtained from the commercial standards and literature findings. The analyses were performed in two replications.

2.7. Detection of Semiquinone Radicals

Electron paramagnetic resonance (EPR) measurements were performed using a Bruker multifrequency and multiresonance FT-EPR ELEXSYS E580 spectrometer (Bruker Analytische Messtechnik, Rheinstetten, Germany) operating at the X-band (9.378989 GHz). The following settings were used: modulation amplitude, 0.4 G; modulation frequency, 100 kHz; microwave power, 94.64 mW; power attenuation, 2 dB; conversion time, 25 ms; sweep time, 102.4 s; powder sample: central field, 3501 G; scan range, 7000 G; liquid sample: central field, 3353.15 G; scan range, 100 G; accumulation, 10.
The test samples (10% herbal infusions, prepared as below) were measured in quartz glass capillary tubes (Bruker, ER 221TUB/4 CFQ).

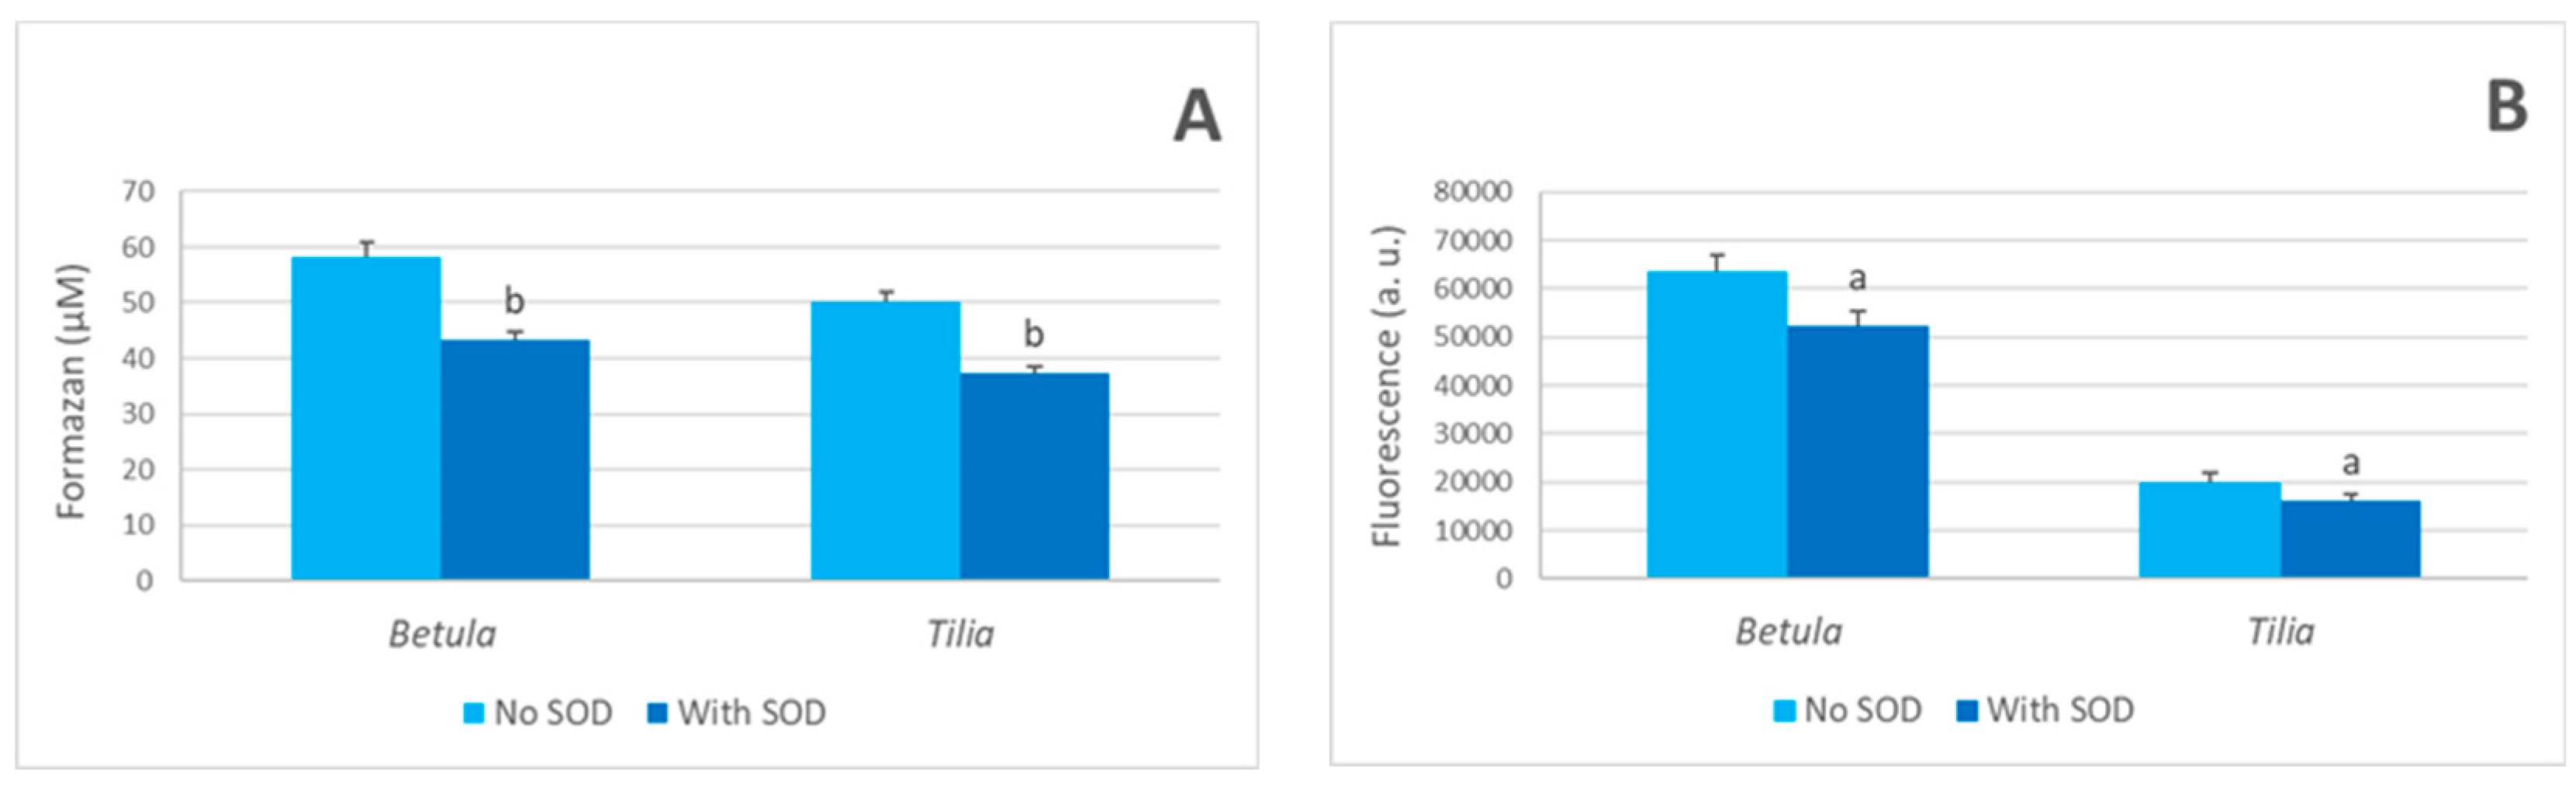
2.8. Detection of Superoxide Generation

Pulverized herbs (10%) herbal extracts supplemented with NBT solution to a final concentration of 250 μM or dihydroethidium to a final concentration of 10 μM, superoxide dismutase (SOD) to a final concentration of 10 μg/mL (if present were heated in a thermoblock at 60 °C for 60 min, cooled and centrifuged. NBT reduction was measured at 530 nm; the concentration of the formazan in the supernatants was calculated using a millimolar absorption coefficient of 25.4 mM−1 cm−1 [38]. The fluorescence of ethidium was measured at the excitation wavelength of 405 nm and the emission wavelength of 570 nm to increase its specificity for the detection of the superoxide reaction product [39].

2.9. Cell Culture

SKOV-3 cells were cultured in McCoy’s 5A medium; PEO1 cells were cultured in RPMI + GlutaMAX; MRC-5 cells were cultured in DMEM + GlutaMax. The media used in the experiment were supplemented with 1% v/v penicillin and streptomycin solution and 10% heat-inactivated fetal bovine serum (FBS). The cells were incubated at 37 °C under 5% carbon dioxide and 95% humidity and were passaged at about 85% confluence. Cell morphology was examined under an inverted Zeiss Primo Vert microscope with phase contrast (Oberkochen, Germany). The viability of ovarian adenocarcinoma cells and fibroblasts was estimated using the Trypan Blue exclusion test. The cells were counted in a Thoma hemocytometer (Superior Marienfeld, Lauda-Königshofen, Germany).

2.10. Estimation of Cytotoxicity of Herbal Infusions

SKOV-3 cells were seeded in wells of a clear 96-well plate at a density of 1 × 10⁴ cells/well in 100 µL of culture medium. PEO1 cells were seeded at a density of 1.5 × 10⁴ cells/well, and MRC-5 cells were seeded at a density of 7.5 × 10³ cells/well and allowed to attach for 24 h at 37 °C. Six 1% (w/v) herbal infusions (of leaves of Betula, Cistus, Ginkgo, Melissa and Taraxacum) were used for determination of their toxicity towards human cancer ovary cells and fibroblasts. After 30 min incubation, the infusions were centrifuged and sterilized using a syringe filter (0.2 μM). Cells were treated with different volumes of the infusions made with PBS (0 μL, 2 μL, 5 μL, 10 μL and 20 μL added to 100 μL of the medium) for 24 h. After 24 h exposure, the medium was removed, replaced with 100 µL of 2% Neutral Red solution, and incubated for 1 h at 37 °C. Then, the cells were washed with PBS, fixed with 100 µL/well 50% ethanol, 49% H2O and 1% glacial acetic acid, and shaken for 20 min (1000× g) at room temperature. Absorbance was measured at 540 nm against 620 nm in a Spark multimode microplate reader (Tecan Group Ltd., Männedorf, Switzerland). Measurements were performed in sextuplicate.

2.11. Effect of Catalase on the Cytotoxicity of Herbal Infusions

PEO1 cells were seeded in a 96-well clear plate at density 1.5 × 10⁴ cells/well and allowed to attach for 24 h at 37 °C. After incubation, the cells were treated with the three most cytotoxic infusions as above but in the presence of 10 μg catalase/mL. After 24 h exposure, the medium was removed and the cytotoxicity was estimated using Neutral Red, as described above.

2.12. Statistical Analysis

The significance of differences, shown in Figures 1 and 3, was obtained using the two-tailed Student’s “t” test. Differences in cellular systems (Figures 5 and 6) were assessed using the U Mann-Whitney test, assuming a significance level of p ≤ 0.05. Statistical analysis of the data was performed using STATISTICA software package (version 13.1, StatSoft Inc. 2016, Tulsa, OK, USA).

3. Results

3.1. Hydrogen Peroxide Is Generated in Herbal Infusions

Both of the applied procedures demonstrated the generation of hydrogen peroxide in herbal infusions (Figure 1). Under Procedure (i), based on the subtraction of a sample blank to eliminate the background color of the samples, all of the infusions showed the presence of hydrogen peroxide, albeit at different concentrations; under Procedure (ii), based on the measurement of the difference in the absorbance readings between the samples incubated and not incubated with catalase, the vast majority of the infusions contained significant amounts of H2O2, with the exception of the infusions of Artemisia, Taraxacum, Tussilago and Urtica. The highest generation occurred during brewing and within the first hour; however, further incubation for up to 3 h augmented the level of hydrogen peroxide in most cases, with the exception of Cistus, Urtica (both Procedures), Tussilago (Procedure (i)), Gingko and Lavandula (Procedure (ii)). In Procedure (i), the highest concentrations of H2O2, reaching or even exceeding 50 µM, were detected in the infusions of the leaves of Betula (up to 70 µM) and Polygonum, and of the inflorescence of Tilia (up to over 50 µM). These concentrations exceeded those found in the green tea used for comparison (up to 35 µM). In general, Procedure (ii) yielded lower H2O2 concentrations than Procedure (i), although, in some cases (extracts of Achillea and Mentha), an inverse relationship was observed.

3.2. Herbal Infusions Contain Phenolic Compounds

The content of phenolic compounds was analyzed in the infusions of the chosen herbs. The presence of various phenolic compounds was demonstrated in all of the studied extracts (Table 1, Table 2, Table 3 and Table 4).
The concentrations of phenolics in the studied extracts are presented in Table 5, Table 6, Table 7 and Table 8. The extract of Betula leaves, generating the highest concentrations of hydrogen peroxide, was characterized by an especially high total concentration of phenolic compounds, mainly due to the high content of betuloside (Table 5).

3.3. Mechanism of Hydrogen Peroxide Generation

The generation of H2O2 in tea and coffee has been ascribed to the autoxidation of the phenolic compounds present in these beverages [18,19,20,21,23]. Apparently, this mechanism also operates in infusions of medicinal herbs, which contain polyphenols. Phenolics may generate H2O2, especially upon cooking/heating, which inactivates the enzymes that decompose this compound in vivo (mainly catalase, peroxidases and peroxiredoxins). The formation of H2O2 due to phenolic oxidation is known to proceed in two steps: a polyphenol H2Q is oxidized to a semiquinone free radical HQ in a reaction coupled to the reduction in molecular oxygen to the superoxide anion radical O2●− (1); then, semiquinone is oxidized to quinone Q, producing the second superoxide radical (2):
H2Q + O2 → HQ + O2●− + H+
HQ + O2 → Q + O2●− + H+
The dismutation of superoxide radicals (3) or the oxidation of another molecule by the superoxide radical (4) produces hydrogen peroxide:
O2●− + O2●− + 2H+ → H2O2
H2S + O2●− + H+ → HS + H2O2
where H2S is an oxidizable substrate and HS represents a radical product of its one-electron oxidation.
The EPR spectra of pulverized dry herbs and freshly prepared infusions demonstrated the presence of a singlet signal corresponding to the semiquinone radical. In the spectra of dry herbs, this signal was superimposed on the complex broad Mn and perhaps Fe signals, especially in dry samples (not shown). The EPR signals of the infusions of leaves of Betula and Tilia, which showed the highest H2O2 generation (Figure 1), are reported in Figure 2.
The plant material used in this study also contained also compounds that produce hydrogen peroxide upon autoxidation; e.g., ascorbic acid [20], although the content of ascorbate is expected to be rather low in herbal infusions, and no signal of ascorbyl radical was detected in the EPR spectra.
The formation of superoxide radicals in herbal infusions was demonstrated through the superoxide-dismutase (SOD) inhibitable reduction in Nitro Blue Tetrazolium (NBT) and SOD-inhibitable oxidation of dihydroethidium (DHE) (Figure 3).
The concentration of NBT formazan, formed in a SOD-inhibitable manner during the 15 min brewing at 60 °C, was 23.3 ± 4.6 μM and 20.8.1 ± 3.7 μM for 10% infusions of Betula leaves and Tilia inflorescence, respectively. These values probably underestimate the real superoxide production as a fraction of the superoxide could still react with the probe or extract components, avoiding dismutation by SOD. Nevertheless, these results document superoxide production—an intermediate in hydrogen formation—in herbal extracts.

3.4. Herbal Infusions Scavenge Hydrogen Peroxide

In most cases, the H2O2 concentration increased upon the incubation of the herbal infusions; however, in some cases, it decreased with time. This suggests that herbal infusions may not only generate, but also scavenge, H2O2. To test this possibility, some of the herbal extracts were supplemented with H2O2, and the time course of the H2O2 concentration was monitored in the infusions supplemented and not supplemented with hydrogen peroxide. Figure 4 shows that, in all cases, the H2O2 concentration measured in the herbal infusions was significantly lower than the sum of the concentration measured without the addition of exogenous H2O2 and the concentration of added H2O2 (25 µM final). This difference between the measured and expected hydrogen peroxide concentration was observed from the first measurement (“zero” time), and was higher in the infusion of herbs showing a decrease in the H2O2 concentration in the absence of exogenous H2O2 (Urtica and Taraxacum) than in the infusion of herbs in which the H2O2 concentration increased with time (exemplified by Betula and Tilia). The difference between the H2O2 concentrations measured in the samples supplemented with H2O2 and the not-supplemented samples had a tendency to decrease with time (with the exception of the Tilia inflorescence infusions). These results demonstrate that herbal infusions react with H2O2. The reaction was apparently the most rapid upon the addition of exogenous H2O2 (the “zero” time measurements were in fact performed 4 ± 1 min after the addition of H2O2). Thus, the H2O2 measured in this herbal infusion represents a net outcome of the rate of production and scavenging of this compound.

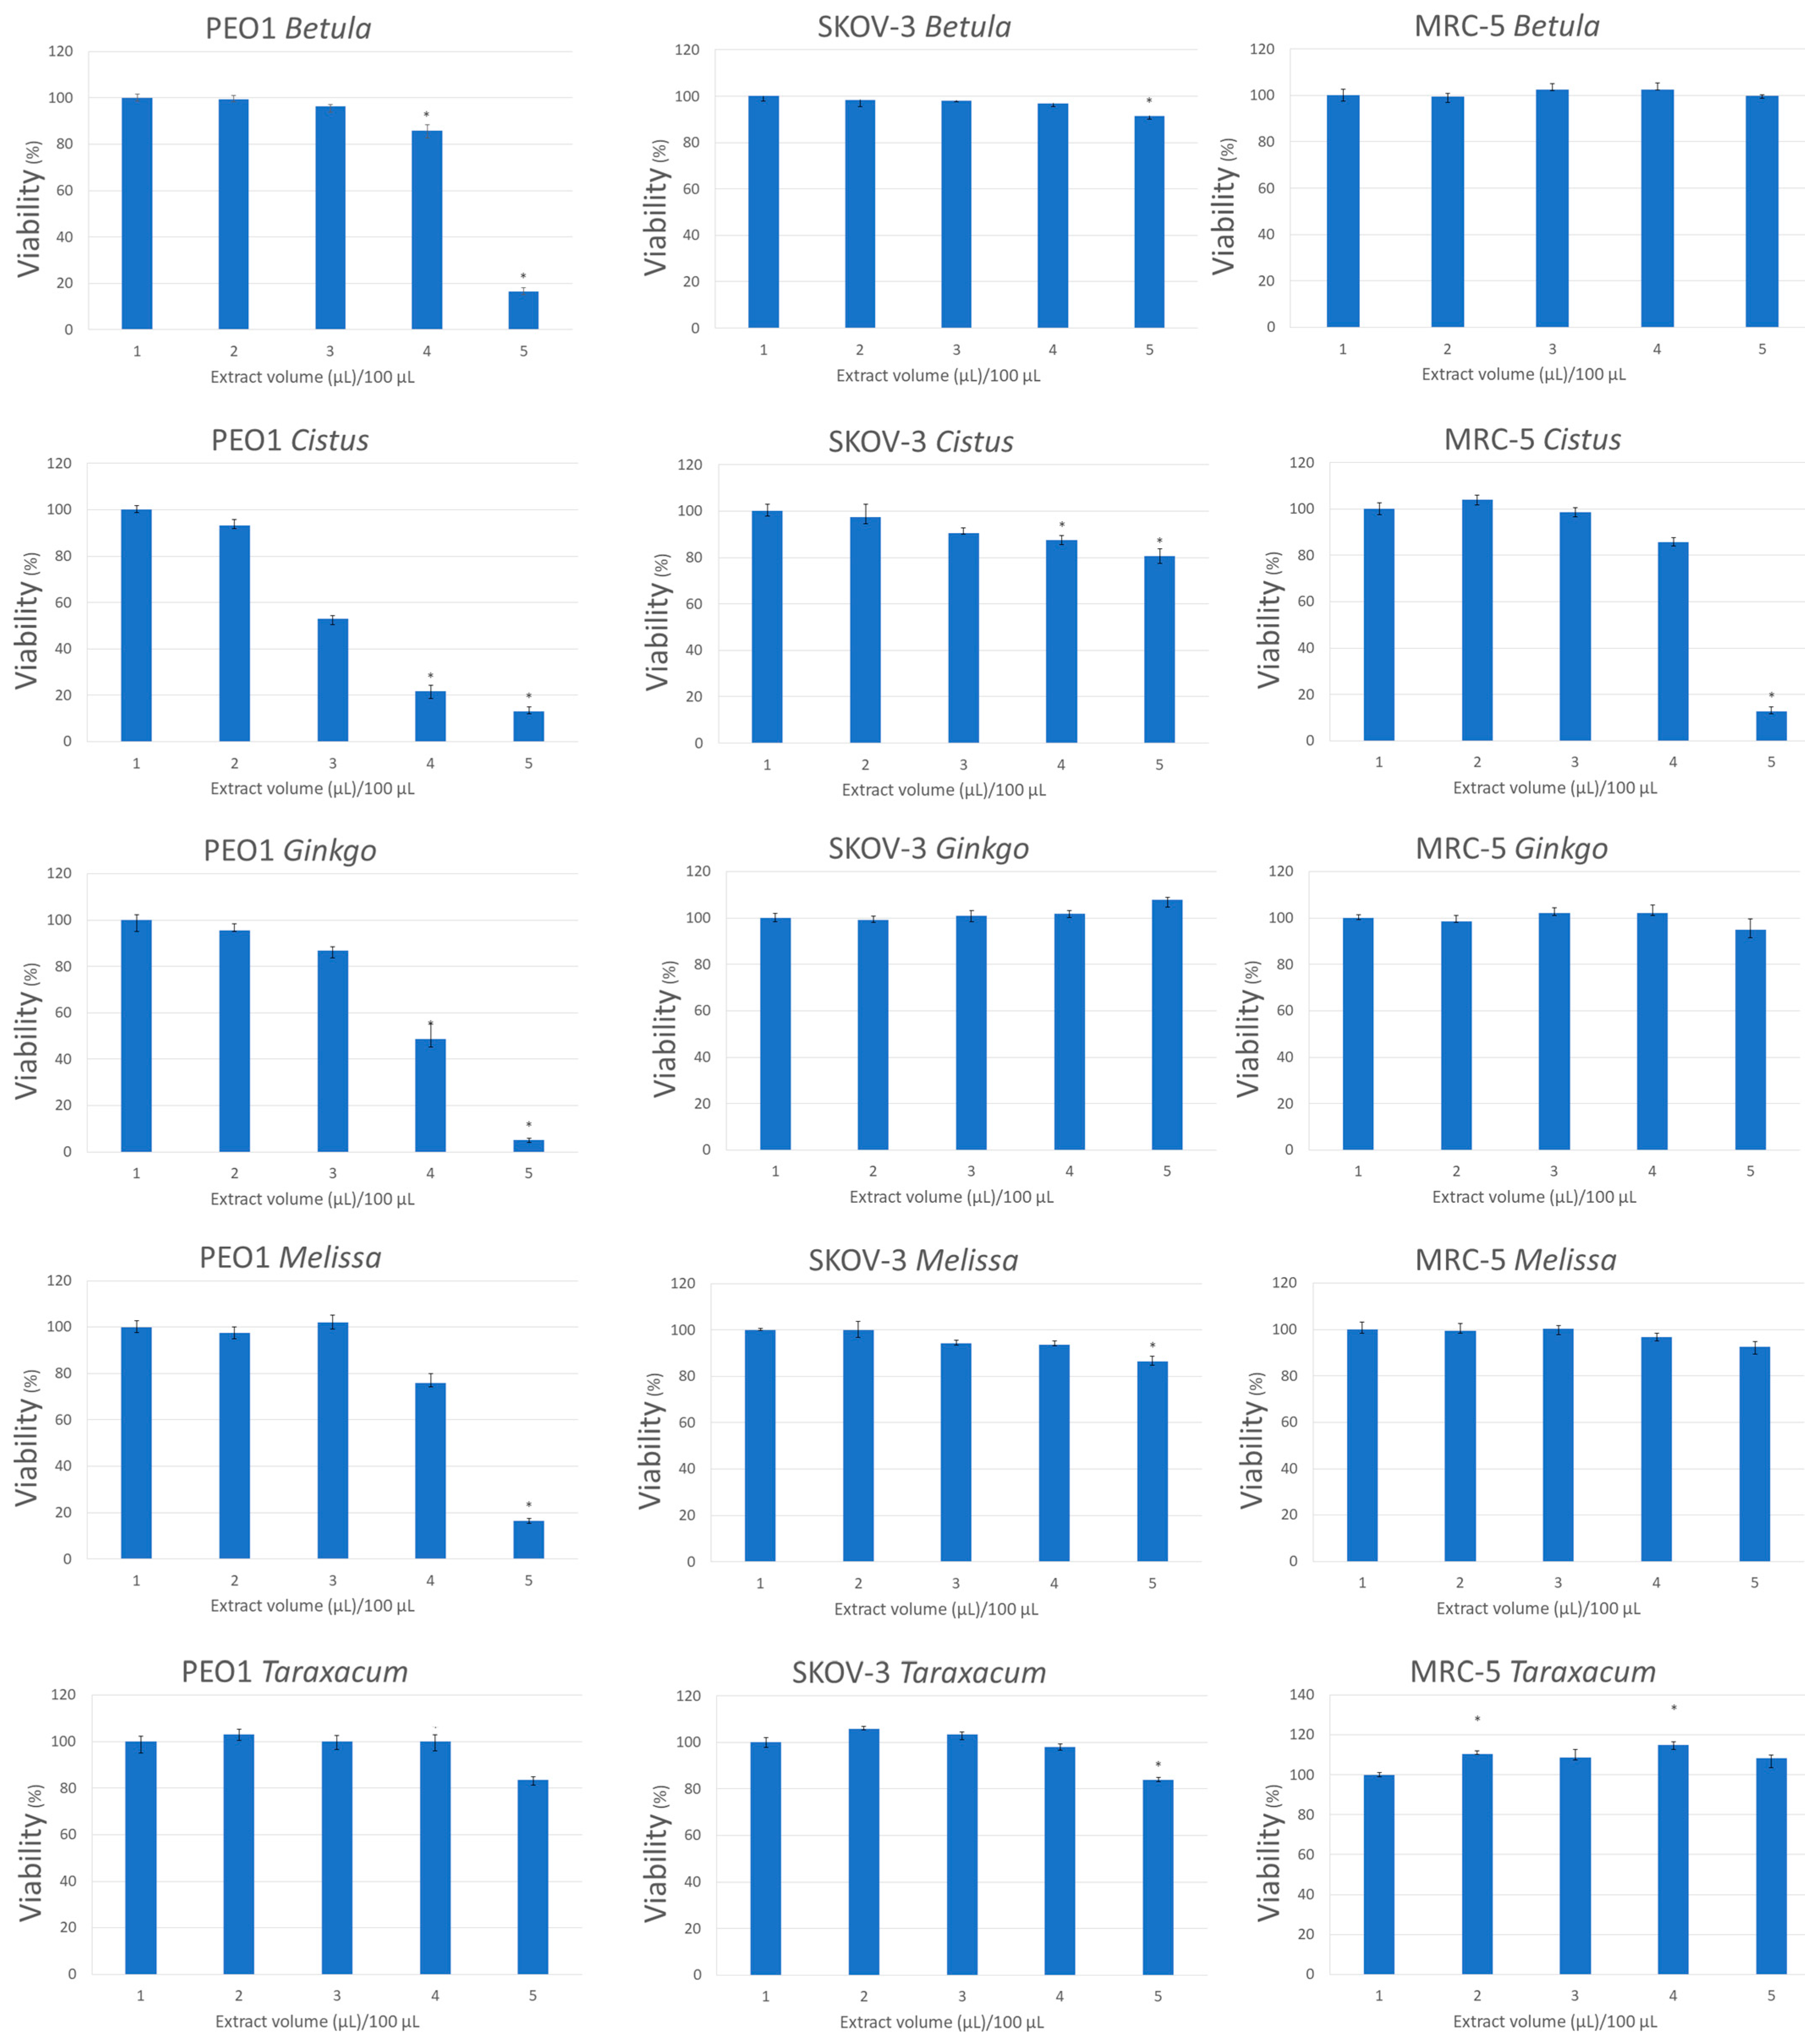
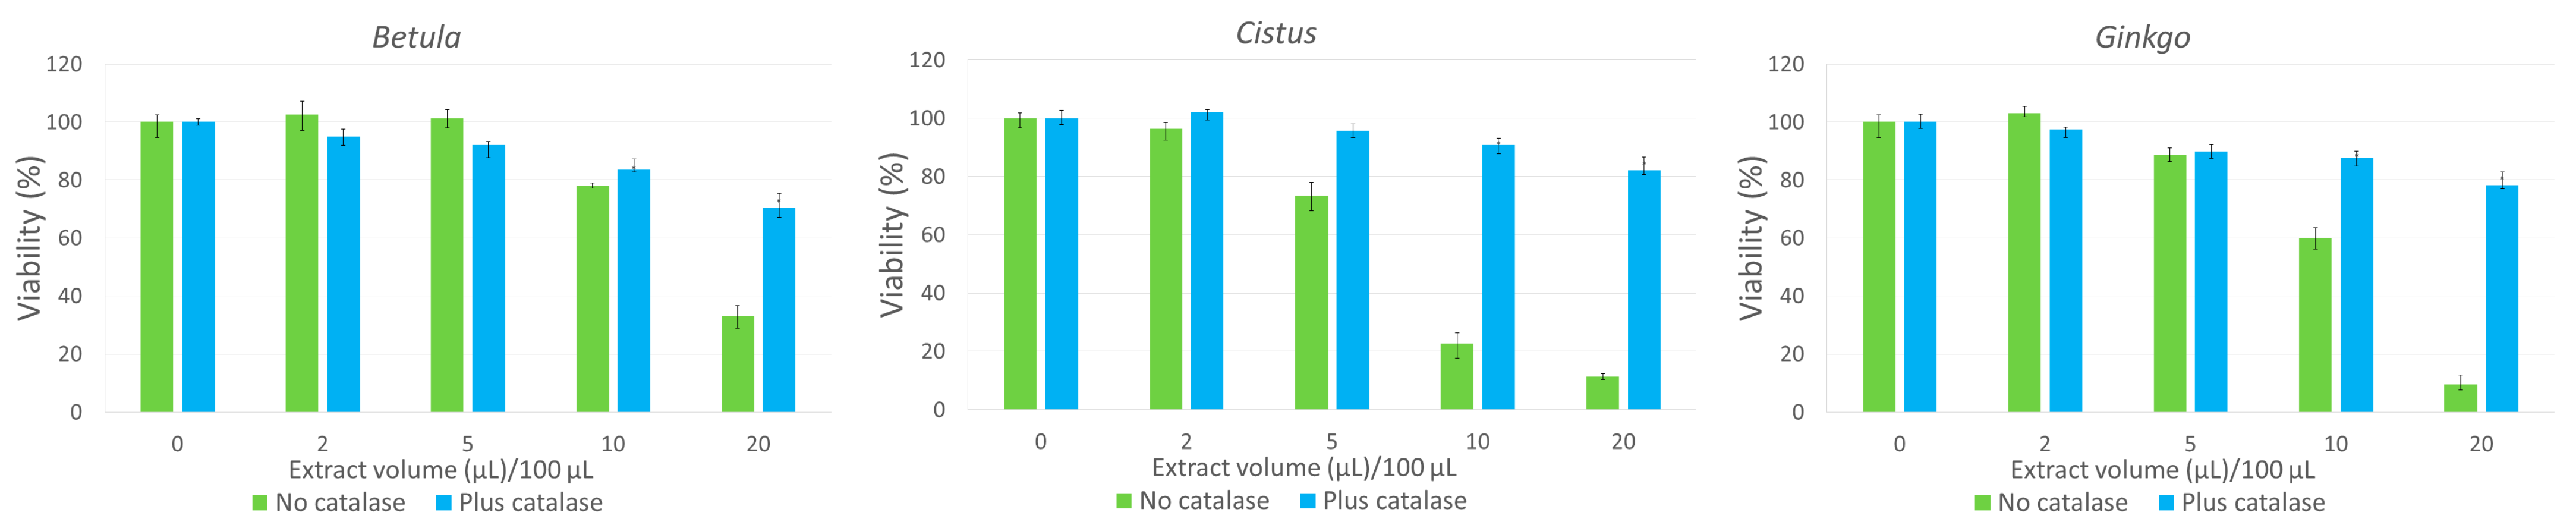
3.5. Hydrogen Peroxide Contributes to the Cytotoxic Action of Herbal Infusions

An important consequence of H2O2 formation by herbal infusions concerns in vitro studies of their cytotoxic effects. We compared the cytotoxicity of five herbal infusions to human cancer ovary cells of two lines (SKOV-3 and PEO1) and human MRC-5 fibroblasts used as reference cells. PEO1 is a high-grade serous, and SKOV-3 is a non-serous, ovary cancer cell line. All of the studied infusions, with the exception of the infusion of Taraxacum leaves, added at volumes of up to 20 µL (corresponding to infusions of 200 ng of dry herb) per 100 µL medium significantly decreased the survival of PEO1 cells; all the infusions except for those of Ginkgo leaves decreased the survival of SKOV-3 cells. The survival of MRC-5 fibroblasts was compromised only by the highest concentration of the infusions of Cistus, and was slightly enhanced by the infusions of Taraxacum (Figure 5).
In order to check whether the toxicity of the three infusions that were most effective with respect to the more sensitive PEO1 cells, which is indeed dependent on the production of H2O2, the effect of catalase on the cell survival treated with these extracts was studied. The presence of catalase, which decomposes H2O2, significantly attenuated the cytotoxicity of all the infusions (Figure 6). The toxic effects of the extracts included an H2O2-independent component, which was prevailing, but the effect of the H2O2 also contributed to their toxicity, as demonstrated by the protective action of catalase on the cell survival.

4. Discussion

4.1. Formation and Scavenging of Hydrogen Peroxide by Herbal Infusions

The two-step mechanism of hydrogen peroxide formation proposed for tea polyphenols (Reactions (1)–(4)) [18,40] was demonstrated to also be valid for infusions of medicinal plants. The formation of semiquinone radicals—products of reaction (1)—was detected in the studied extracts of Betula leaves and Tilia inflorescence (Figure 2). Previously, EPR signals of semiquinone radicals were reported for dry samples of teas [41,42,43] and Salvia officinalis [44]; however, to the best of our knowledge, no signals of semiquinone radicals in herb extracts have been published.
This study also confirms the formation of superoxide radicals—another product of reactions (1) and (2)—through the SOD-inhibitable reduction in NBT and oxidation of DHE.
Both probes are not specific in their reactions. A reduction in NBT is often used to quantify superoxide production in animal and plant tissues [38,45,46], but other compounds may also reduce NBT; therefore, the SOD-inhibitable reduction is a more reliable measure of superoxide production. Similarly, superoxide was suggested to be the main, but not the only, reactive oxygen species responsible for DHE oxidation [47,48]. The employed conditions of the fluorescence measurements [39] were claimed to increase the selectivity of the method of DHE oxidation for superoxide; nevertheless, even this version of the method is far from being specific [47,48]. Thus, the SOD-inhibitable DHE oxidation is more reliable.
The herbal extracts were shown to generate H2O2, but also to scavenge H2O2. Polyphenols are known to react with hydrogen peroxide, although they show varying reactivities. Phenolic acids, especially gallic acid and pyrogallol, were reported to react with hydrogen peroxide [49]. Benzoate derivatives were found to be much stronger H2O2 scavengers than cinnamic acids [50]. Among benzoic acid derivatives, vanillic acid (3-hydroxy-4-methoxybenzoic acid) was found to be the most efficient H2O2 scavenger, with the hydrogen peroxide scavenging activity of 170.2 μM−1, whereas protocatechuic acid (3,4-dihydroxybenzoic acid) exhibited the weakest activity (5.90 μM−1) [51]. In another study, among six phenolic acids, caffeic acid was found to be the most efficient H2O2 scavenger, with the H2O2-scavenging activity of 125 × 10−3 μM−1, while trans-cinnamic acid exhibited the weakest activity (0.73 × 10⁻³ μM−1). In that study, the H2O2-scavenging activity of various herbal extracts was also estimated, with black and green tea showing activities of about 1.1 × 10⁵ mL/g and 1.3 × 10⁵ mL/g, respectively [52]. Hydrotyrosol, a polyphenol from olive oil, was also found to react with hydrogen peroxide [53]. In an aqueous peppermint extract, eriocitrin showed the highest H2O2-scavenging activity, followed by rosmarinic acid, while hesperidin showed a low scavenging activity, and diosmin, narirutin and isorhoifolin exhibited almost no H2O2-scavenging activity [54]. Thus, the behavior of various phenolics is different both with respect to the rate of generation and to the rate of scavenging of hydrogen peroxide, which may explain the difference in the rate of generation and the time-dependent changes in the hydrogen peroxide concentration in the extracts of various herbs.

4.2. Biomedical Relevance of the Presence of Hydrogen Peroxide in Infusions of Medicinal Herbs

This study demonstrates that infusions of medicinal herbs contain some amounts of H2O2. It should be taken into account that the cultivar, location, growth conditions, time of collection and even the extent of fragmentation may considerably affect the composition of phenolics and other compounds that generate H2O2 [55,56]; therefore, the values obtained in this study may not necessarily be representative of other batches of medicinal herbs.
The presence of micromolar concentrations of H2O2 in herbal infusions should not have deleterious consequences for health; on the contrary, it may even exert some beneficial effects. In the digestive tract, H2O2 may be partly decomposed by the catalase and peroxidase activities present in the saliva and in gastric juice [57,58]; i.a., saliva contains catalase and peroxidases that are important in the defense against the H2O2 produced by mouth bacteria [59]. The residual H2O2 can exert bactericidal and virucidal action, and thus may contribute to mouth hygiene and health [60,61] and act against Helicobacter pylori in the stomach [62]. Hydrogen peroxide promotes gastric motility [63]. High concentrations of H2O2 may damage colon cells, but low concentrations were suggested to stimulate cell divisions in the damaged intestine, thus contributing to epithelial repair [64]. Reaction with available iron in the intestine forms the hydroxyl radical and other free radicals, which facilitate digestion as proteins subjected to free radical action may show enhanced susceptibility to proteolytic enzymes [65]. One can speculate whether the generation of H2O2 in the infusions of medicinal herbs in this study can contribute to the prophylactic and therapeutic effects of at least some of these herbs.

4.3. Generation of Hydrogen Peroxide May Introduce Artifacts in Cellular In Vitro Experiments

The cytotoxicity of various herbal extracts in vitro has been reported, e.g.,: G. biloba leaf extracts were found to be cytotoxic to carcinoma HSC-2 cells [29]; Plantago extracts were found to be cytotoxic for human leukemia cells [30], MCF-7 breast cancer cells, A431 epidermal cells and U87-MG glioma cells [31]; extracts of Tilia were found to inhibit the proliferation of AGS stomach adenocarcinoma and SKOV-3 ovarian cancer cells [32]; extracts of Artemisia absinthium showed cytotoxicity against HaCaT keratinocytes and HGF-1 gingival fibroblasts [33]. The H2O2 formed in the infusions may contribute to the cytotoxicity of infusions of medicinal herbs, green tea and wines [27], like individual flavonoids such as pyrogallol, epigallocatechin gallate and quercetin [20].
This study demonstrated that the cytotoxic effects of herbal extracts are partly dependent on the hydrogen peroxide present in the extracts. This is an artifact of in vitro experiments, which does not occur under in vivo conditions. The difference between the in vitro and in vivo conditions should be kept in mind when evaluating the effect of herbal infusions on malignant cells. These infusions may be more effective in vitro, and one reason for this may be the formation of H2O2 under in vitro conditions (availability of oxygen). They may be less cytotoxic under in vivo conditions when the oxygen concentration is much smaller, the formation of hydrogen H2O2 due to autoxidation of herb components is much lower (if any) and the contribution of H2O2 to the herb cytotoxicity is much lower or absent. Thus, under in vivo conditions, the adsorbed polyphenols may exhibit antioxidant and not prooxidant properties (scavenging of H2O2 rather than net H2O2 generation).

5. Conclusions

Hydrogen peroxide is generated in infusions of medicinal herbs in micromolar concentrations due mainly to the autoxidation of phenolic compounds. The infusions have also the ability to scavenge hydrogen peroxide so the net concentration of H2O2 is the result of the rates of these two processes. Hydrogen peroxide present in the infusions of medicinal herbs contributes to their cytotoxic effects in vitro.

Supplementary Materials

The following supporting information can be downloaded at: https://www.mdpi.com/article/10.3390/pr11102855/s1, short description of the herbs used and their applications. Refs. [66,67,68,69,70,71,72,73,74,75,76,77,78,79,80,81,82,83] are cited in Supplementary Materials.

Author Contributions

Conceptualization, I.S.-B. and G.B.; methodology, I.S.-B., I.S., I.K. and G.B.; validation, I.S.-B.; investigation, A.T., N.P., I.S.-B., I.S. and I.K.; writing—original draft preparation, I.S.-B., I.S., I.K. and G.B.; writing—review and editing, I.S.-B. and G.B.; supervision, I.S.-B.; project administration, I.S.-B. All authors have read and agreed to the published version of the manuscript.

Funding

This research received no external funding.

Data Availability Statement

Data is available from the corresponding author upon reasonable request.

Acknowledgments

We are indebted to Edyta Bieszczad-Bedrejczuk, for the excellent technical help.

Conflicts of Interest

The authors declare no conflict of interest.

References

  1. Ciriminna, R.; Albanese, L.; Meneguzzo, F.; Pagliaro, M. Hydrogen peroxide: A key chemical for today’s sustainable development. ChemSusChem 2016, 9, 3374–3381. [Google Scholar] [CrossRef] [PubMed]
  2. Baldry, M.G.C. The bactericidal, fungicidal and sporicidal properties of hydrogen peroxide and peracetic acid. J. Appl. Bacteriol. 1983, 54, 417–423. [Google Scholar] [CrossRef] [PubMed]
  3. Zonta, W.; Mauroy, A.; Farnir, F.; Thiry, E. Virucidal efficacy of a hydrogen peroxide nebulization against murine norovirus and feline calicivirus, two surrogates of human norovirus. Food Environ. Virol. 2016, 8, 275–282. [Google Scholar] [CrossRef] [PubMed]
  4. Mileto, D.; Mancon, A.; Staurenghi, F.; Rizzo, A.; Econdi, S.; Gismondo, M.R.; Guidotti, M. Inactivation of SARS-CoV-2 in the liquid phase: Are aqueous hydrogen peroxide and sodium percarbonate efficient decontamination agents? ACS Chem. Health Saf. 2021, 28, 260–267. [Google Scholar] [CrossRef] [PubMed]
  5. Urban, M.V.; Rath, T.; Radtke, C. Hydrogen peroxide (H2O2): A review of its use in surgery. Wien. Med. Wochenschr. 2017, 169, 222–225. [Google Scholar] [CrossRef] [PubMed]
  6. Murphy, E.C.; Friedman, A.J. Hydrogen peroxide and cutaneous biology: Translational applications, benefits, and risks. J. Am. Acad. Dermatol. 2019, 81, 1379–1386. [Google Scholar] [CrossRef] [PubMed]
  7. Alkahtani, R.; Stone, S.; German, M.; Waterhouse, P. A review on dental whitening. J. Dent. 2020, 100, 103423. [Google Scholar] [CrossRef] [PubMed]
  8. Alshammery, S. Evaluation of light activation on in-office dental bleaching: A systematic review. J. Contemp. Dent. Pract. 2019, 20, 1355–1360. [Google Scholar] [CrossRef]
  9. Ortega, K.L.; Rech, B.D.O.; El Haje, G.L.C.; Gallo, C.D.B.; Pérez-Sayáns, M.; Braz-Silva, P.H. Do hydrogen peroxide mouthwashes have a virucidal effect? A systematic review. J. Hosp. Infect. 2020, 106, 657–662. [Google Scholar] [CrossRef]
  10. Henry, M.C.; Wheeler, J.; Mofenson, H.C.; Caraccio, T.R.; Marsh, M.; Comer, G.M.; Singer, U.J. Hydrogen peroxide 3% exposures. J. Toxicol. Clin. Toxicol. 1996, 34, 323–327. [Google Scholar] [CrossRef]
  11. Sies, H.; Jones, D.P. Reactive oxygen species (ROS) as pleiotropic physiological signalling agents. Nat. Rev. Mol. Cell Biol. 2020, 21, 363–383. [Google Scholar] [CrossRef] [PubMed]
  12. Sies, H.; Belousov, V.V.; Chandel, N.S.; Davies, M.J.; Jones, D.P.; Mann, G.E.; Murphy, M.P.; Yamamoto, M.; Winterbourn, C. Defining roles of specific reactive oxygen species (ROS) in cell biology and physiology. Nat. Rev. Mol. Cell Biol. 2022, 23, 499–515. [Google Scholar] [CrossRef] [PubMed]
  13. Horwitz, L.D.; Leff, J.A. Catalase and hydrogen peroxide cytotoxicity in cultured cardiac myocytes. J. Mol. Cell. Cardiol. 1995, 27, 909–915. [Google Scholar] [CrossRef] [PubMed]
  14. Zhao, M.X.; Wen, J.L.; Wang, L.; Wang, X.P.; Chen, T.S. Intracellular catalase activity instead of glutathione level dominates the resistance of cells to reactive oxygen species. Cell Stres Chaperones 2019, 24, 609–619. [Google Scholar] [CrossRef] [PubMed]
  15. Pieńkowska, N.; Bartosz, G.; Pichla, M.; Grzesik-Pietrasiewicz, M.; Gruchala, M.; Sadowska-Bartosz, I. Effect of antioxidants on the H2O2-induced premature senescence of human fibroblasts. Aging 2020, 12, 1910–1927. [Google Scholar] [CrossRef] [PubMed]
  16. Al-Shehri, S.S.; Knox, C.L.; Liley, H.G.; Cowley, D.M.; Wright, J.R.; Henman, M.G.; Hewavitharana, A.K.; Charles, B.G.; Shaw, P.N.; Sweeney, E.L.; et al. Breastmilk-saliva interactions boost innate immunity by regulating the oral microbiome in early infancy. PLoS ONE 2015, 10, e0135047. [Google Scholar] [CrossRef] [PubMed]
  17. Al-Kerwi, E.A.; Al-Hashimi, A.H.; Salman, A.M. Mother’s milk and hydrogen peroxide. Asia Pac. J. Clin. Nutr. 2005, 14, 428–431. [Google Scholar] [PubMed]
  18. Akagawa, M.; Shigemitsu, T.; Suyama, K. Production of hydrogen peroxide by polyphenols and polyphenol-rich beverages under quasi-physiological conditions. Biosci. Biotechnol. Biochem. 2003, 67, 2632–2640. [Google Scholar] [CrossRef]
  19. Arakawa, H.; Maeda, M.; Okubo, S.; Shimamura, T. Role of hydrogen peroxide in bactericidal action of catechin. Biol. Pharm. Bull. 2004, 27, 277–281. [Google Scholar] [CrossRef]
  20. Grzesik, M.; Bartosz, G.; Stefaniuk, I.; Pichla, M.; Namieśnik, J.; Sadowska-Bartosz, I. Dietary antioxidants as a source of hydrogen peroxide. Food Chem. 2019, 278, 692–699. [Google Scholar] [CrossRef]
  21. Wang, J.Q.; Gao, Y.; Long, D.; Yin, J.F.; Zeng, L.; Xu, Y.Q.; Xu, Y.Q. Effects of hydrogen peroxide produced by catechins on the aroma of tea beverages. Foods 2022, 11, 1273. [Google Scholar] [CrossRef]
  22. Hegele, J.; Münch, G.; Pischetsrieder, M. Identification of hydrogen peroxide as a major cytotoxic component in Maillard reaction mixtures and coffee. Mol. Nutr. Food Res. 2009, 53, 760–769. [Google Scholar] [CrossRef] [PubMed]
  23. Fujita, Y.; Wakabayashi, K.; Nagao, M.; Sugimura, T. Implication of hydrogen peroxide in the mutagenicity of coffee. Mut. Res. Lett. 1985, 144, 227–230. [Google Scholar] [CrossRef] [PubMed]
  24. Nagao, M.; Fujita, Y.; Wakabayashi, K.; Nukaya, H.; Kosuge, T.; Sugimura, T. Mutagens in coffee and other beverages. Environ. Health Perspect. 1986, 67, 89–91. [Google Scholar] [CrossRef] [PubMed]
  25. Bartosz, G.; Baran, S.; Grzesik-Pietrasiewicz, M.; Sadowska-Bartosz, I. The antioxidant capacity and hydrogen peroxide formation by black and orange carrots. Agric. Food Sci. 2022, 31, 71–77. [Google Scholar] [CrossRef]
  26. Bartosz, G.; Rajzer, K.; Grzesik-Pietrasiewicz, M.; Sadowska-Bartosz, I. Hydrogen peroxide is formed upon cooking of vegetables. Acta Biochim. Pol. 2022, 69, 471–474. [Google Scholar] [CrossRef] [PubMed]
  27. Chai, P.C.; Long, L.H.; Halliwell, B. Contribution of hydrogen peroxide to the cytotoxicity of green tea and red wines. Biochem. Biophys. Res. Commun. 2003, 304, 650–654. [Google Scholar] [CrossRef] [PubMed]
  28. Tama, A.; Bartosz, G.; Sadowska-Bartosz, I. Is hydrogen peroxide generated in wine? Food Biosci. 2022, 45, 101487. [Google Scholar] [CrossRef]
  29. Babich, H.; Ackerman, N.J.; Burekhovich, F.; Zuckerbraun, H.L.; Schuck, A.G. Gingko biloba leaf extract induces oxidative stress in carcinoma HSC-2 cells. Toxicol. In Vitro 2009, 23, 992–999. [Google Scholar] [CrossRef]
  30. Mohamed, I.K.; Osama, M.A.; Samiha, M.; Zahrat, E.M. Biochemical studies on Plantago major L. and Cyamopsis tetragonoloba L. Int. J. Biodivers. Conserv. 2011, 3, 83–91. [Google Scholar]
  31. Rezadoost, M.H.; Kumleh, H.H.; Ghasempour, A. Cytotoxicity and apoptosis induction in breast cancer, skin cancer and glioblastoma cells by plant extracts. Mol. Biol. Rep. 2019, 46, 5131–5142. [Google Scholar] [CrossRef] [PubMed]
  32. Zarringhalami, R.; Hanachi, P.; Ramezani Tamijani, R. Cytotoxic effect of Tilia dasystyla and Polygonatum orientale Desf extracts on AGS and SKOV-3 cancer cell lines. Iran. J. Pharm. Sci. 2020, 16, 9–16. [Google Scholar]
  33. Ivanov, M.; Gašić, U.; Stojković, D.; Kostić, M.; Mišić, D.; Soković, M. New evidence for Artemisia absinthium L. application in gastrointestinal ailments: Ethnopharmacology, antimicrobial capacity, cytotoxicity, and phenolic profile. Evid. Based Compl. Altern. Med. 2021, 2021, 9961089. [Google Scholar] [CrossRef] [PubMed]
  34. Gay, C.A.; Gebicki, J.M. Measurement of protein and lipid hydroperoxides in biological systems by the ferric-xylenol orange method. Anal. Biochem. 2003, 315, 29–35. [Google Scholar] [CrossRef] [PubMed]
  35. Perron, N.R.; Wang, H.C.; Deguire, S.N.; Jenkins, M.; Lawson, M.; Brumaghim, J.L. Kinetics of iron oxidation upon polyphenol binding. Dalton Trans. 2010, 39, 9982–9987. [Google Scholar] [CrossRef] [PubMed]
  36. Krych, J.; Gebicka, L. Catalase is inhibited by flavonoids. Int. J. Biol. Macromol. 2013, 58, 148–153. [Google Scholar] [CrossRef] [PubMed]
  37. Żurek, N.; Karatsai, O.; Rędowicz, M.J.; Kapusta, I. Polyphenolic compounds of Crataegus berry, leaf, and flower extracts affect viability and invasive potential of human glioblastoma cells. Molecules 2021, 26, 2656. [Google Scholar] [CrossRef] [PubMed]
  38. Oritani, T.; Fukuhara, N.; Okajima, T.; Kitamura, F.; Ohsaka, T. Electrochemical and spectroscopic studies on electron-transfer reaction between novel water-soluble tetrazolium salts and a superoxide ion. Inorgan. Chim. Acta 2004, 357, 436–442. [Google Scholar] [CrossRef]
  39. Nazarewicz, R.R.; Bikineyeva, A.; Dikalov, S.I. Rapid and specific measurements of superoxide using fluorescence spectroscopy. J. Biomol. Screen. 2013, 18, 498–503. [Google Scholar] [CrossRef]
  40. Nakayama, T.; Ichiba, M.; Kuwabara, M.; Kajiya, K.; Kumazawa, S. Mechanisms and structural specificity of hydrogen peroxide formation during oxidation of catechins. Food Sci. Technol. Res. 2002, 8, 261–267. [Google Scholar] [CrossRef]
  41. Morsy, M.A.; Khaled, M.M. Novel EPR characterization of the antioxidant activity of tea leaves. Spectrochim. Acta A Mol. Biomol. Spectrosc. 2002, 58, 1271–1277. [Google Scholar] [CrossRef] [PubMed]
  42. Polovka, M.; Brezová, V.; Stasko, A. Antioxidant properties of tea investigated by EPR spectroscopy. Biophys. Chem. 2003, 106, 39–56. [Google Scholar] [CrossRef]
  43. Polat, M.; Korkmaz, M. Detection of irradiated black tea (Camellia sinensis) and rooibos tea (Aspalathus linearis) by ESR spectroscopy. Food Chem. 2008, 107, 956–961. [Google Scholar] [CrossRef]
  44. Çam, S.T.; Engin, B. Identification of irradiated sage tea (Salvia officinalis L.) by ESR spectroscopy. Radiat. Phys. Chem. 2010, 79, 540–544. [Google Scholar]
  45. Bournonville, C.F.; Díaz-Ricci, J.C. Quantitative determination of superoxide in plant leaves using a modified NBT staining method. Phytochem. Anal. 2011, 22, 268–271. [Google Scholar] [CrossRef]
  46. Wohlgemuth, H.; Mittelstrass, K.; Kschieschan, S.; Bender, J.; Weigel, H.J.; Overmyer, K.; Kangasjärvi, J.; Sandermann, H.; Langebartels, C. Activation of an oxidative burst is a general feature of sensitive plants exposed to the air pollutant ozone. Plant Cell Environ. 2002, 25, 717–726. [Google Scholar] [CrossRef]
  47. Fink, B.; Laude, K.; McCann, L.; Doughan, A.; Harrison, D.G.; Dikalov, S. Detection of intracellular superoxide formation in endothelial cells and intact tissues using dihydroethidium and an HPLC-based assay. Am. J. Physiol. Cell Physiol. 2004, 287, C895–C902. [Google Scholar] [CrossRef] [PubMed]
  48. Zielonka, J.; Kalyanaraman, B. Hydroethidine- and MitoSOX-derived red fluorescence is not a reliable indicator of intracellular superoxide formation: Another inconvenient truth. Free Radic. Biol. Med. 2010, 48, 983–1001. [Google Scholar] [CrossRef] [PubMed]
  49. Sroka, Z.; Cisowski, W. Hydrogen peroxide scavenging, antioxidant and anti-radical activity of some phenolic acids. Food Chem. Toxicol. 2003, 41, 753–758. [Google Scholar] [CrossRef] [PubMed]
  50. Özyürek, M.; Bektaşoğlu, B.; Güçlü, K.; Güngör, N.; Apak, R. A novel hydrogen peroxide scavenging assay of phenolics and flavonoids using cupric reducing antioxidant capacity (CUPRAC) methodology. J. Food Comp. Anal. 2010, 23, 689–698. [Google Scholar] [CrossRef]
  51. Mansouri, A.; Makris, D.P.; Kefalas, P. Determination of hydrogen peroxide scavenging activity of cinnamic and benzoic acids employing a highly sensitive peroxyoxalate chemiluminescence-based assay: Structure–activity relationships. J. Pharm. Biomed. Anal. 2005, 39, 22–26. [Google Scholar] [CrossRef] [PubMed]
  52. Ma, X.; Li, H.; Dong, J.; Qian, W. Determination of hydrogen peroxide scavenging activity of phenolic acids by employing gold nanoshells precursor composites as nanoprobes. Food Chem. 2011, 126, 698–704. [Google Scholar] [CrossRef]
  53. Yvonne, O.; Driss, F.; Dang, P.M.-C.; Elbim, C.; Gougerot-Pocidalo, M.-A.; Pasquier, C.; El-Benna, J. Antioxidant effect of hydroxytyrosol, a polyphenol from olive oil: Scavenging of hydrogen peroxide but not superoxide anion produced by human neutrophils. Biochem. Pharmacol. 2004, 68, 2003–2008. [Google Scholar]
  54. Sroka, Z.; Fecka, I.; Cisowski, W. Antiradical and anti-H2O2 properties of polyphenolic compounds from an aqueous peppermint extract. Z. Naturforsch. C 2005, 60, 826–832. [Google Scholar]
  55. Nguyen, P.M.; Niemeyer, E.D. Effects of nitrogen fertilization on the phenolic composition and antioxidant properties of basil (Ocimum basilicum L.). J. Agric. Food Chem. 2008, 56, 8685–8691. [Google Scholar] [CrossRef] [PubMed]
  56. Sati, P.; Pandey, A.; Rawat, S.; Rani, A. Phytochemicals and antioxidants in leaf extracts of Ginkgo biloba with reference to location, seasonal variation and solvent system. J. Pharm. Res. 2013, 7, 804–809. [Google Scholar] [CrossRef]
  57. Toczewska, J.; Konopka, T. Activity of enzymatic antioxidants in periodontitis: A systematic overview of the literature. Dent. Med. Probl. 2019, 56, 419–426. [Google Scholar] [CrossRef] [PubMed]
  58. Durak, I.; Ormeci, N.; Akyol, O.; Canbolat, O.; Kavutçu, M.; Bülbül, M. Adenosine deaminase 5’-nucleotidase xanthine oxidase superoxide dismutase and catalase activities in gastric juices from patients with gastric cancer ulcer and atrophic gastritis. Dig. Dis. Sci. 1994, 39, 721–728. [Google Scholar] [CrossRef]
  59. Damirchi, A.; Kiani, M.; Jafarian, V.; Sariri, R. Response of salivary peroxidase to exercise intensity. Eur. J. Appl. Physiol. 2010, 108, 1233–1237. [Google Scholar] [CrossRef]
  60. Caruso, A.A.; Del Prete, A.; Lazzarino, A.I. Hydrogen peroxide and viral infections: A literature review with research hypothesis definition in relation to the current covid-19 pandemic. Med. Hypoth. 2020, 144, 109910. [Google Scholar] [CrossRef]
  61. Hernandez, P.; Sager, B.; Fa, A.; Liang, T.; Lozano, C.; Khazzam, M. Bactericidal efficacy of hydrogen peroxide on Cutibacterium acnes. Bone Jt. Res. 2019, 8, 3–10. [Google Scholar] [CrossRef] [PubMed]
  62. Di, J.; Zhang, J.; Cao, L.; Huang, T.T.; Zhang, J.X.; Mi, Y.N.; Xiao, X.; Yan, P.P.; Wu, M.L.; Yao, T.; et al. Hydrogen Peroxide-Mediated Oxygen Enrichment Eradicates Helicobacter pylori In Vitro and In Vivo. Antimicrob. Agents Chemother. 2020, 64, e02192–e02219. [Google Scholar] [CrossRef] [PubMed]
  63. Fajardo, A.F.; Sobchak, C.; Shifrin, Y.; Pan, J.; Gonska, T.; Belik, J. Hydrogen peroxide promotes gastric motility in the newborn rat. Ped. Res. 2018, 84, 751–756. [Google Scholar] [CrossRef] [PubMed]
  64. Craven, P.A.; Pfanstiel, J.; DeRubertis, F.R. Role of reactive oxygen in bile salt stimulation of colonic epithelial proliferation. J. Clin. Investig. 1986, 77, 850–859. [Google Scholar] [CrossRef] [PubMed]
  65. Wolff, S.P.; Dean, R.T. Fragmentation of proteins by free radicals and its effect on their susceptibility to enzymic hydrolysis. Biochem. J. 1986, 234, 399–403. [Google Scholar] [CrossRef] [PubMed]
  66. Benedek, B.; Kopp, B. Achillea millefolium L. s.l. revisited: Recent findings confirm the traditional use. Wien Med Wochensch. 2007, 157, 312–314. [Google Scholar] [CrossRef] [PubMed]
  67. Batiha, G.E.; Olatunde, A.; El-Mleeh, A.; Hetta, H.F.; Al-Rejaie, S.; Alghamdi, S.; Zahoor, M.; Magdy Beshbishy, A.; Murata, T.; Zaragoza-Bastida, A.; et al. Bioactive compounds pharmacological actions and pharmacokinetics of wormwood (Artemisia absinthium). Antibiotics 2020, 9, 353. [Google Scholar] [CrossRef]
  68. Rastogi, S.; Pandey, M.M.; Kumar Singh Rawat, A. Medicinal plants of the genus Betula - traditional uses and a phytochemical-pharmacological review. J. Ethnopharmacol. 2015, 159, 62–83. [Google Scholar] [CrossRef]
  69. Muley, B.P.; Khadabadi, S.S.; Banarase, N.B. Phytochemical constituents and pharmacological activities of Calendula officinalis Linn (Asteraceae) A Review. Trop. J. Pharm. Res. 2009, 8, 455–465. [Google Scholar] [CrossRef]
  70. Cabrera, C.; Artacho, R.; Giménez, R. Beneficial effects of green tea—A review. J. Am. Coll. Nutr. 2006, 25, 79–99. [Google Scholar] [CrossRef]
  71. Barrajón-Catalán, E.; Fernández-Arroyo, S.; Saura, D.; Guillén, E.; Fernández-Gutiérrez, A.; Segura-Carretero, A.; Micol, V. Cistaceae aqueous extracts containing ellagitannins show antioxidant and antimicrobial capacity and cytotoxic activity against human cancer cells. Food Chem. Toxicol. 2010, 48, 2273–2282. [Google Scholar] [CrossRef] [PubMed]
  72. Singh, B.; Kaur, P.; Singh, G.R.D.; Ahuja, P.S. Biology and chemistry of Ginkgo biloba. Fitoterapia 2008, 79, 401–418. [Google Scholar] [CrossRef] [PubMed]
  73. Barnes, J.; Anderson, L.A.; Phillipson, J.D. St John’s wort (Hypericum perforatum L.): A review of its chemistry pharmacology and clinical properties. J. Pharm. Pharmacol. 2001, 53, 583–600. [Google Scholar] [CrossRef] [PubMed]
  74. Hajhashemi, V.; Ghannadi, A.; Sharif, B. Anti-inflammatory and analgesic properties of the leaf extracts and essential oil of Lavandula angustifolia Mill. J. Ethnopharmacol. 2003, 89, 67–71. [Google Scholar] [CrossRef] [PubMed]
  75. Shakeri, A.; Sahebkar, A.; Javadi, B. Melissa officinalis L.—A review of its traditional uses phytochemistry and pharmacology. J. Ethnopharmacol. 2016, 188, 204–228. [Google Scholar] [PubMed]
  76. Herro, E.; Jacob, S.E. Mentha piperita (peppermint). Dermatitis 2010, 21, 327–329. [Google Scholar] [CrossRef] [PubMed]
  77. Marchesan, M.; Paper, D.H.; Hose, S.; Franz, G. Investigation of the antiinflammatory activity of liquid extracts of Plantago lanceolata L. Phytother. Res. 1998, 12, S33–S34. [Google Scholar] [CrossRef]
  78. Wegener, T.; Kraft, K. Der Spitzwegerich (Plantago lanceolata L.): Reizlinderung bei Infektionen der oberen Atemwege [Plantain (Plantago lanceolata L.): Anti-inflammatory action in upper respiratory tract infections]. Wiener Med Wochenschr. 1999, 149, 211–216. [Google Scholar]
  79. Sung, Y.Y.; Yoon, T.; Yang, W.K.; Kim, S.J.; Kim, D.S.; Kim, H.K. The antiobesity effect of Polygonum aviculare L. ethanol extract in high-fat diet-induced obese mice. Evid. Based Compl Altern Med. 2013, 2013, 626397. [Google Scholar]
  80. Mir, M.A.; Sawhney, S.S.; Jassal, M.M.S. Qualitative and quantitative analysis of phytochemicals of Taraxacum officinale. Wudpecker J. Pharm. Pharmacol. 2013, 2, 1–5. [Google Scholar]
  81. Siger, A.; Antkowiak, W.; Dwiecki, K.; Rokosik, E.; Rudzińska, M. Nutlets of Tilia cordata Mill. and Tilia platyphyllos Scop.—Source of bioactive compounds. Food Chem. 2021, 346, 128888. [Google Scholar] [CrossRef]
  82. Chen, S.; Dong, L.; Quan, H.; Zhou, X.; Ma, J.; Xia, W.; Zhou, H.; Fu, X. A review of the ethnobotanical value phytochemistry pharmacology toxicity and quality control of Tussilago farfara L. (coltsfoot). J. Ethnopharmacol. 2021, 267, 113478. [Google Scholar] [CrossRef]
  83. Joshi, B.C.; Mukhija, M.; Kalia, A.N. Pharmacognostical review of Urtica dioica L. Int. J. Green Pharm. 2014, 8, 202–209. [Google Scholar]
Figure 1. The concentration of hydrogen peroxide in the infusions of medicinal herbs and green tea immediately after brewing and after 1 h and 3 h standing at ambient temperature. H2O2 concentration was estimated by two procedures, based on the use of a reagent blank (i) and on the decomposition of H2O2 by 10 µg/mL catalase in one of two parallel samples (ii). a p < 0.05, b p < 0.01, c p < 0.001 with respect to zero generation.
Processes 11 02855 g001
Figure 2. EPR signals of the semiquinone radical measured in infusions of selected herbs.
Processes 11 02855 g002
Figure 3. Superoxide dismutase inhibition of NBT reduction (A) and DHE oxidation (B) in plant infusions. a p < 0.05, b p < 0.01 (with SOD vs. no SOD).
Processes 11 02855 g003
Figure 4. Time course of hydrogen peroxide concentration in herbal infusions not supplemented with H2O2 and added with 25 μM (final) H2O2. Expected, H2O2 concentration calculated on the basis of concentration in non-supplemented infusions plus 25 μM. * p < 0.05, ** p < 0.01, *** p < 0.001 (supplemented vs not supplemented infusions); a p < 0.05, b p < 0.01, c p < 0.001 (supplemented with H2O2, measured vs. expected).
Processes 11 02855 g004
Figure 5. Survival of SKOV-3 and PEO1 ovary cancer cells, and MRC-5 fibroblasts treated with various volumes of herbal infusions after 24 h incubation; * p < 0.05.
Processes 11 02855 g005
Figure 6. Effect of catalase (10 µg/mL) on the survival of PEO1 cells treated with various volumes of infusions of Betula, Cistus and Gingko infusions. * p < 0.05 (catalase vs. no catalase).
Processes 11 02855 g006
Table 1. Identification of phenolic compounds by UPLC-PDA-MS/MS in the Betula extract.
Compound [M-H] m/z
Rt (min)λmax (nm)MSMS/MS
Neo-chlorogenic acid2.27322353191
Betuloside2.68276327165
Coumaryl-quinic acid I2.79310337163
Chlorogenic acid2.88324353191
3-(4-Hydroxyphenyl)-1-methylpropyl2.99276165-
Feruloyl-quinic acid3.00322357193
Caffeic acid glucoside3.21324341179
Coumaryl-quinic acid II3.54310337163
Myricetin 3-O-glucoside3.89253, 354479317
Kaempferol 3-O-rhamnoside3.97264, 342431285
Myricetin 3-O-pentoside4.37253, 354449317
Quercetin 3-O-glucoside4.54255, 355463301
Quercetin 3-O-glucuronide4.57255, 355477301
Quercetin 3-O-pentoside I4.96255, 355433301
Quercetin 3-O-pentoside II5.06255, 355433301
Quercetin 3-O-pentoside III5.16255, 355433301
Quercetin 3-O-rhamnoside5.26255, 355447301
Table 2. Identification of phenolic compounds by UPLC-PDA-MS/MS in the Tilia extract.
Compound [M-H] m/z
Rt (min)λmax (nm)MSMS/MS
Neo-chlorogenic acid2.28322353191
Ferulic acid glucoside2.62324355193
Coumarylo-quinic acid I2.79310337163
Chlorogenic acid2.88324353191
Coumarylo-quinic acid II2.95310337163
Coumarylic acid glucoside310310325163
Procyanidin dimer 3.23274577289
Procyanidin trimer I3.30274865577, 289
(+)Catechin3.39274289141
Coumaryl-quinic acid III3.53310337163
Undefined derivative3.67284401189
Procyanidin trimer II3.83278865577, 289
Procyanidin tetramer3.972771152865, 577
Kaempferol 3-O-sophoroside4.29264, 352609285
Quercetin 3-O-rutinoside4.51255, 355609301
Quercetin 3-O-glucoside4.66255, 355463301
Quercetin 3-O-(6″-malonyl)-glucoside4.94255, 352549505, 463, 301
Kaempferol 3-O-rutinoside5.00264, 347593285
Kaempferol 3-O-glucoside5.21264, 347447285
Quercetin 3-O-glucuronide5.44355, 350477301
Chrysoeriol 7-O-rutinoside5.60345607299
Quercetin 4′-O-glucoside5.76255, 355463301
Kaempferol 3-O-glucuronide6.07264, 342461285
Kaempferol 3-O-(6″-acetyl)-rutinoside7.01264, 333637593, 301
Table 3. Identification of phenolic compounds by UPLC-PDA-MS/MS in the Taraxaxum extract.
Compound [M-H] m/z
Rt (min)λmax (nm)MSMS/MS
Caftaric acid2.25327311179
Chlorogenic acid2.88327353191
tri-Caffeoyl-tartaric acid3.35324635473, 311
Coutaric acid3.66309295163
Chicoric acid4.32324473311, 179
Table 4. Identification of phenolic compounds by UPLC-PDA-MS/MS in the Urtica extract.
Compound [M-H] m/z
Rt (min)λmax (nm)MSMS/MS
Caffeic acid cinnamyl ester3.68327295179
p-Coumaric acid4.09309163116
Coumaroyl-malic acid I4.41312279163
Coumaroyl-malic acid II4.62324279163
Feruloyl-sinapoyl-tartaric acid4.85324531309, 193
Table 5. The concentrations of polyphenolic compounds in the Betula extract.
CompoundConcentration (μg/mL)
Neo-chlorogenic acid12.08 ± 0.05
Betuloside394.77 ± 18.87
Chlorogenic acid46.73 ± 2.02
3-(4-Hydroxyphenyl)-1-methylpropyl78.38 ± 1.79
Feruloyl-quinic acid2.85 ± 0.07
Caffeic acid glucoside2.50 ± 0.01
Coumarylo-quinic acid II5.58 ± 0.19
Myricetin 3-O-glucoside66.20 ± 2.19
Kaempferol 3-O-rhamnoside9.00 ± 0.01
Myricetin 3-O-pentoside4.64 ± 0.29
Quercetin 3-O-glucoside78.46 ± 0.96
Quercetin 3-O-glucuronide62.25 ± 0.55
Quercetin 3-O-pentoside I15.74 ± 0.40
Quercetin 3-O-pentoside II8.46 ± 0.08
Quercetin 3-O-pentoside III5.61 ± 0.13
Quercetin 3-O-rhamnoside9.81 ± 0.05
Total808.99 ± 12.51
Table 6. The concentrations of polyphenolic compounds in the Tilia extract.
CompoundConcentration (μg/mL)
Neo-chlorogenic acid2.95 ± 0.03
Ferulic acid glucoside
Coumaryl-quinic acid I1.35 ± 0.07
Chlorogenic acid3.06 ± 0.01
Coumaryl-quinic acid II2.22 ± 0.10
Coumarylic acid glucoside1.30 ± 0.03
Procyanidin dimer 1.68 ± 0.04
Procyanidin trimer I2.97 ± 0.01
(+)Catechin0.85 ± 0.03
Coumaryl-quinic acid III5.07 ± 0.17
Undefined derivative3.03 ± 0.00
Procyanidin trimer II2.75 ± 0.18
Procyanidin tetramer3.70 ± 0.05
Kaempferol 3-O-sophoroside11.15 ± 0.10
Quercetin 3-O-rutinoside21.92 ± 0.56
Quercetin 3-O-glucoside48.33 ± 0.48
Quercetin 3-O-(6″-malonyl)-glucoside8.88 ± 0.21
Kaempferol 3-O-rutinoside6.71 ± 0.11
Kaempferol 3-O-glucoside9.61 ± 0.25
Quercetin 3-O-glucuronide10.54 ± 0.42
Chrysoeriol 7-O-rutinoside6.76 ± 0.16
Quercetin 4′-O-glucoside4.20 ± 0.05
Kaempferol 3-O-glucuronide3.46 ± 0.06
Kaempferol 3-O-(6″-acetyl)-rutinoside10.11 ± 0.17
Total174.56 ± 1.02
Table 7. The concentrations of polyphenolic compounds in the Taraxacum extract.
CompoundConcentration (μg/mL)
Caftaric acid88.19 ± 2.28
Chlorogenic acid12.57 ± 0.50
tri-Caffeoyl-tartaric acid5.28 ± 0.12
Coutaric acid6.20 ± 0.07
Chicoric acid54.14 ± 0.92
Total163.24 ± 2.77
Table 8. The concentrations of polyphenolic compounds in the Urtica extract.
CompoundConcentration (μg/mL)
Caffeic acid cinnamyl ester24.57 ± 0.30
p-Coumaric acid2.32 ± 0.02
Coumaroyl-malic acid I6.21 ± 0.16
Coumaroyl-malic acid II9.77 ± 0.10
Feruloyl-sinapoyl-tartaric acid43.35 ± 1.03
Total86.22 ± 0.89
Disclaimer/Publisher’s Note: The statements, opinions and data contained in all publications are solely those of the individual author(s) and contributor(s) and not of MDPI and/or the editor(s). MDPI and/or the editor(s) disclaim responsibility for any injury to people or property resulting from any ideas, methods, instructions or products referred to in the content.

