1. Introduction
Many organisations exist for the purpose of standardising methods of measurement. Organisations such as these (e.g., the International Organization for Standardization, ISO [
1]; the European Committee for Standardization, CEN [
2]; the British Standards Institution, BSI [
3]; the American Society for Testing and Materials, ASTM [
4]; and Standards Australia, AS [
5]) set forth standards which are used to ensure the consistent measurement of various material characteristics, thereby enabling the easy sharing of data. Yield strength in metallic materials, for example, is standardised in much the same way by all the organisations considered here. However, this does not mean that the methods defined as standard are necessarily straightforward. In fact, the growing prevalence of materials incorporating macroscopic structures such as surface textures complicate this further, often resulting in the use of alternative, non-standard methods to quantify yield.
In the present work, plain and dimpled steels are tested in tension for use as example cases representing both discontinuous yield and severely continuous yield. ‘Severely’ is used here to denote a substantial departure from linearity prior to macroscopic yield in the stress–strain curve. Additionally, typical data regarding the tensile load response of both porous and lattice materials from the literature are incorporated as further examples for this investigation, exhibiting conventional continuous yield.
First, the standard methods for the quantification of yield strength are defined with consideration for the applicability of each and any limitations imposed by their formulation. This reveals that the standard methods are not representative of the yield behaviour of all the example cases. Therefore, existing non-standard methods are explored to address the limitations identified in the standard measures. Subsequently, a novel method for the quantification of yield strength is proposed. Applied successfully to each of the example cases, this novel method is shown to be widely applicable irrespective of the category of yield behaviour, thereby eliminating the need, in some cases, to compare mutually incompatible measures. It is also shown to be more representative of the load response where macroscopic structures such as dimples result in severely continuous yielding.
1.1. Standard Methods for the Quantification of Yield
The macroscopic yield for metallic materials in tension is generally defined as the stress at which appreciable plastic flow begins [
6,
7,
8]. Enabling the application of this to identify a ‘yield point’, standard methods stipulate that the type of yield behaviour exhibited by a test sample must first be categorised as either continuous or discontinuous [
7,
9]. Even this categorisation can be unclear in some cases; however, the appropriate method for the quantification of yield strength can be selected only once this has been completed. With some variation in the name assigned to each, there are currently four such standard measures recognised by these organisations:
Proof Strength, Non-Proportional Extension, alternatively known as the ‘Offset Yield’ (σY);
Proof Strength, Total Extension, alternatively known as the ‘Extension Under Load’ (σEUL);
Upper Yield Strength (σUY);
Lower Yield Strength (σLY).
Even though these measures are distinct from one another and applicable to different circumstances, they are not all-encompassing. Due to certain assumptions made in the formulations of these measures, each has limitations to its applicability. Currently, these limitations render all four methods inapplicable in some cases, leaving the Offset Yield as the default measure [
10], even when the resulting readings may be misleading. Furthermore, the standardised acceptance of multiple measures results in a substantial potential for confusion and miscommunication in situations where differences in yield strengths are important, as this may result in the necessary comparison of incompatible measures. This is particularly evident in cases where the samples compared exhibit different yield behaviours, continuous and discontinuous, since the standard methods for the measurement of yield strength in each case are based on somewhat different principles.
1.2. Upper and Lower Yield—Discontinuous Yielding
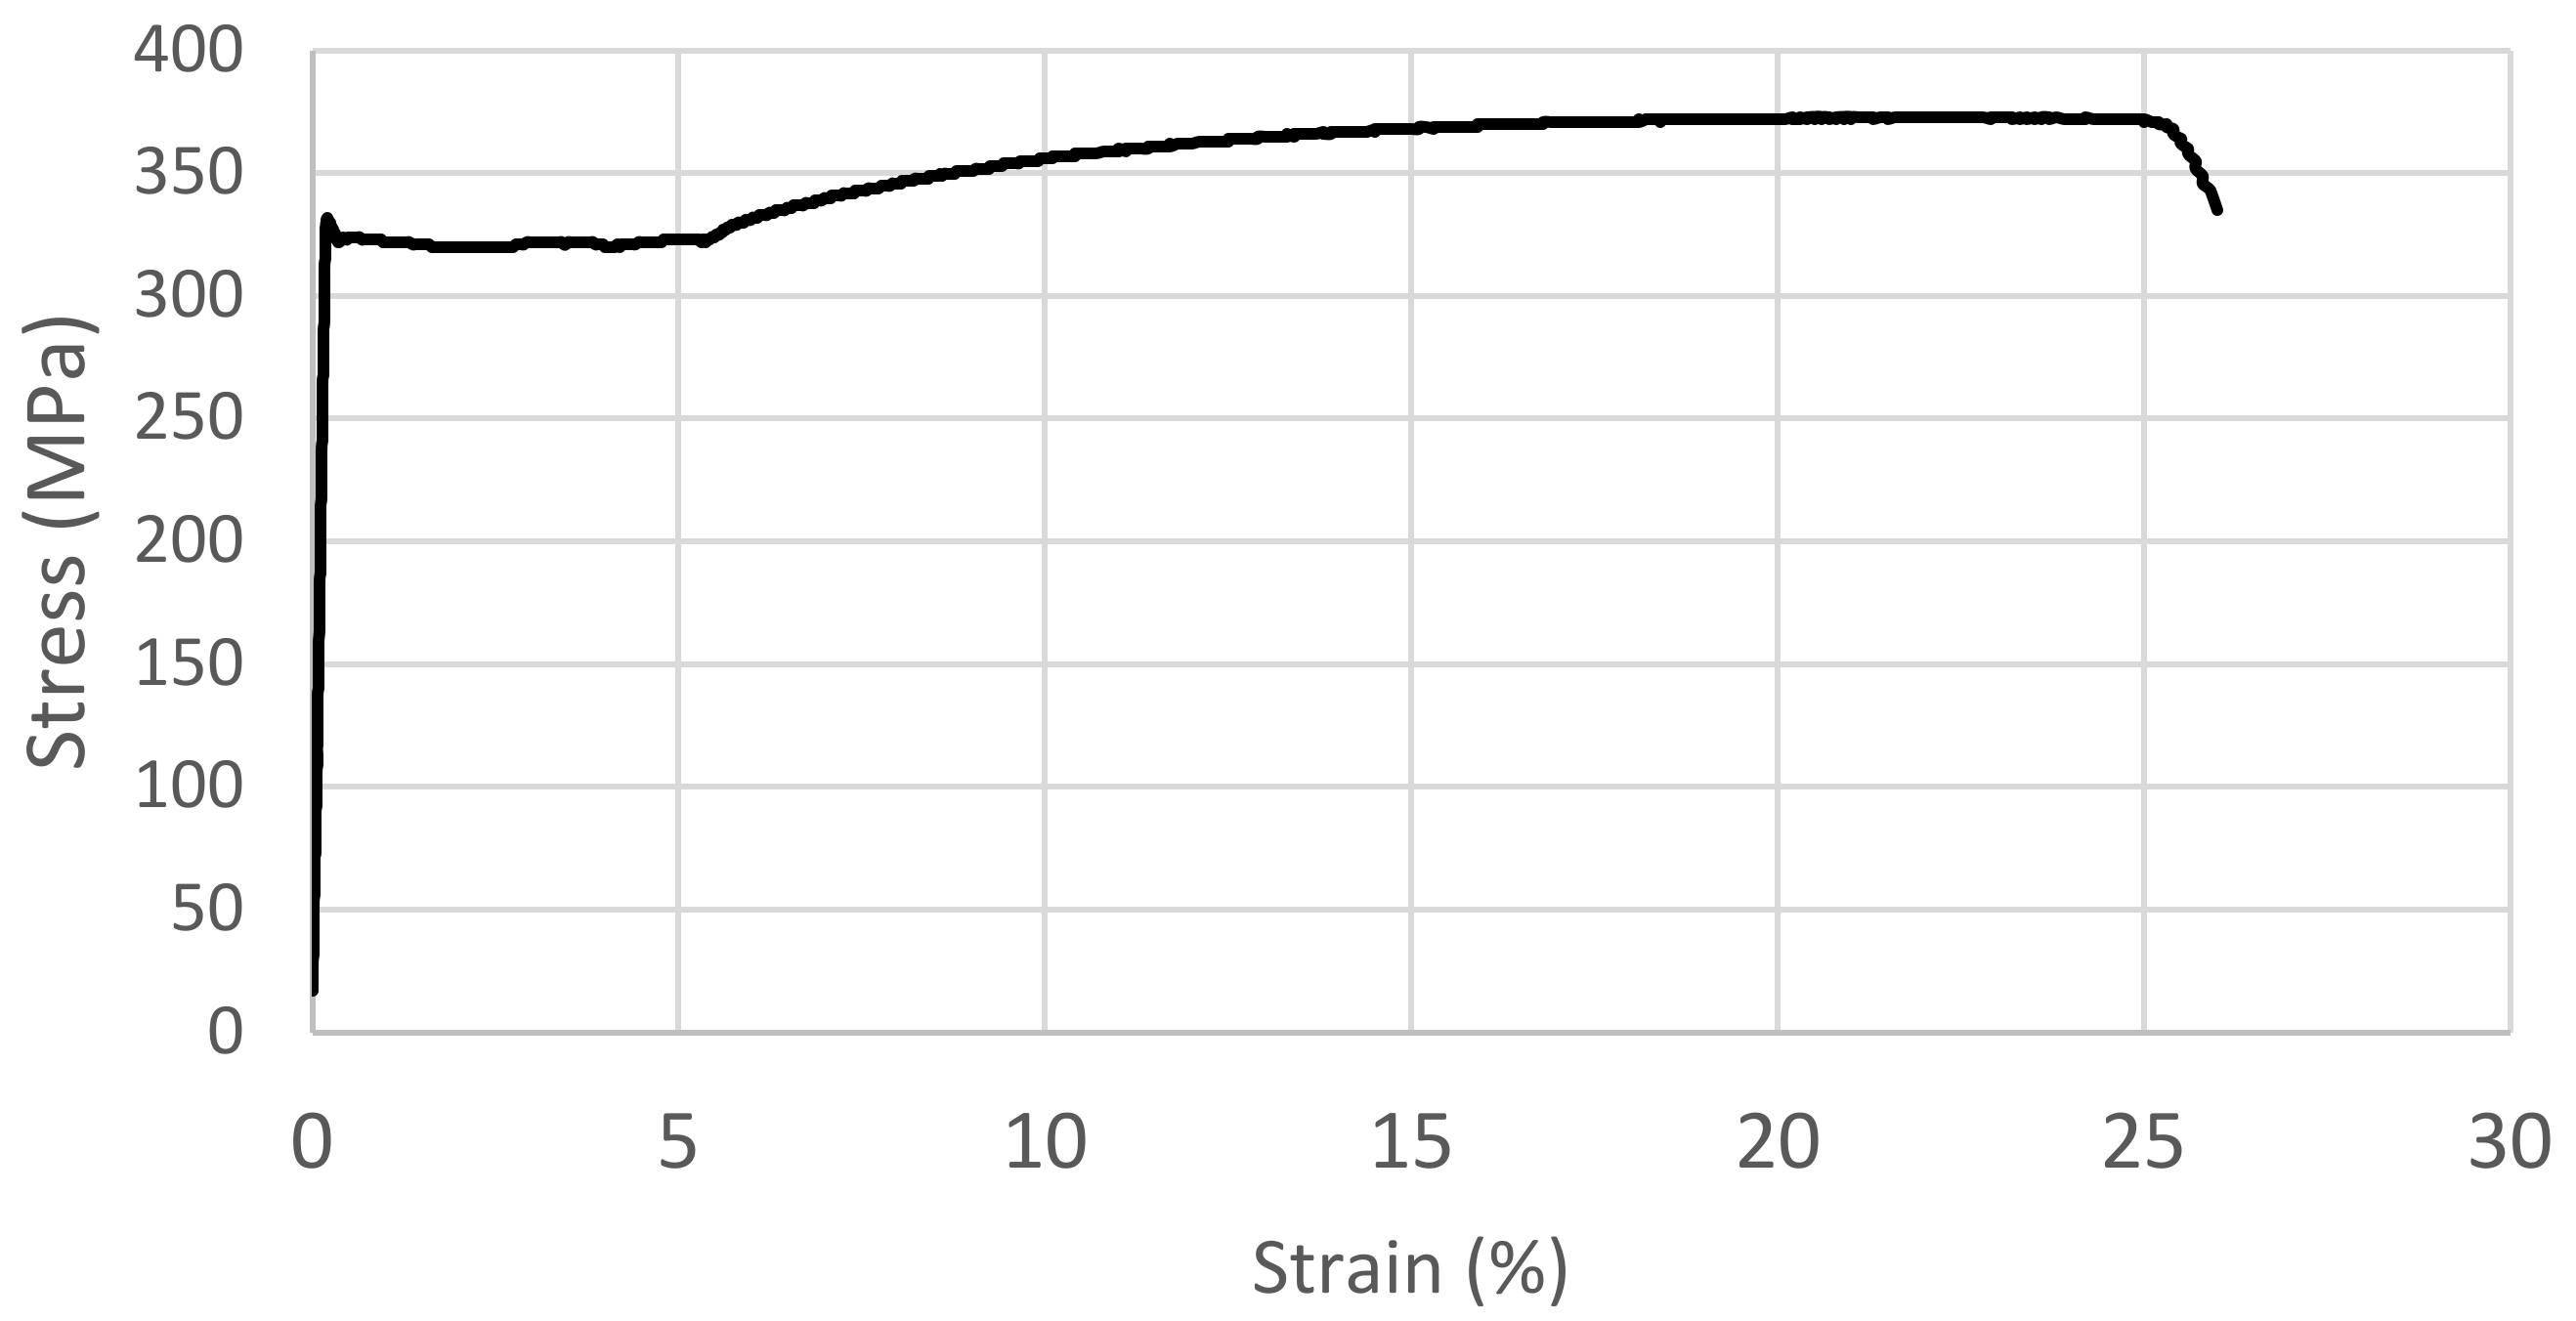
When the material being tested exhibits a discontinuous yield behaviour, characterised by Yield Point Extension (YPE), as illustrated in
Figure 1, the standard measures for yield are the Upper Yield Strength (UYS or σ
UY) and Lower Yield Strength (LYS or σ
LY).
The σ
UY stems from the observation that this type of yield behaviour exhibits a definite point of departure from elastic strain, the as-defined beginning of plastic flow, and is simply the maximum stress achieved by the initial peak, marking the initiation of YPE. While this is of theoretical use, it has been determined that the height of the peak is dependent on the test environment and rig setup [
9,
11]. Therefore, the σ
LY is sometimes used in industry.
The σLY, rather than focusing on the peak, is defined as the minimum stress measured during YPE. In this way, a minimum tensile yield capacity is defined for the material in question, effectively incorporating a safety margin into the measurement.
The limitation, common to both methods, is that they are reliant on the presence of YPE, such that the yield behaviour is discontinuous. As illustrated in
Figure 2, the plain steel samples tested here clearly undergo discontinuous yielding. Therefore, the quantification of yield for these is simply based upon the initial peak prior to YPE, the σ
UY. Where the available data do not extend to 0 MPa, that which was available has been provided without modification in all figures.
1.3. Proof Strengths—Continuous Yielding
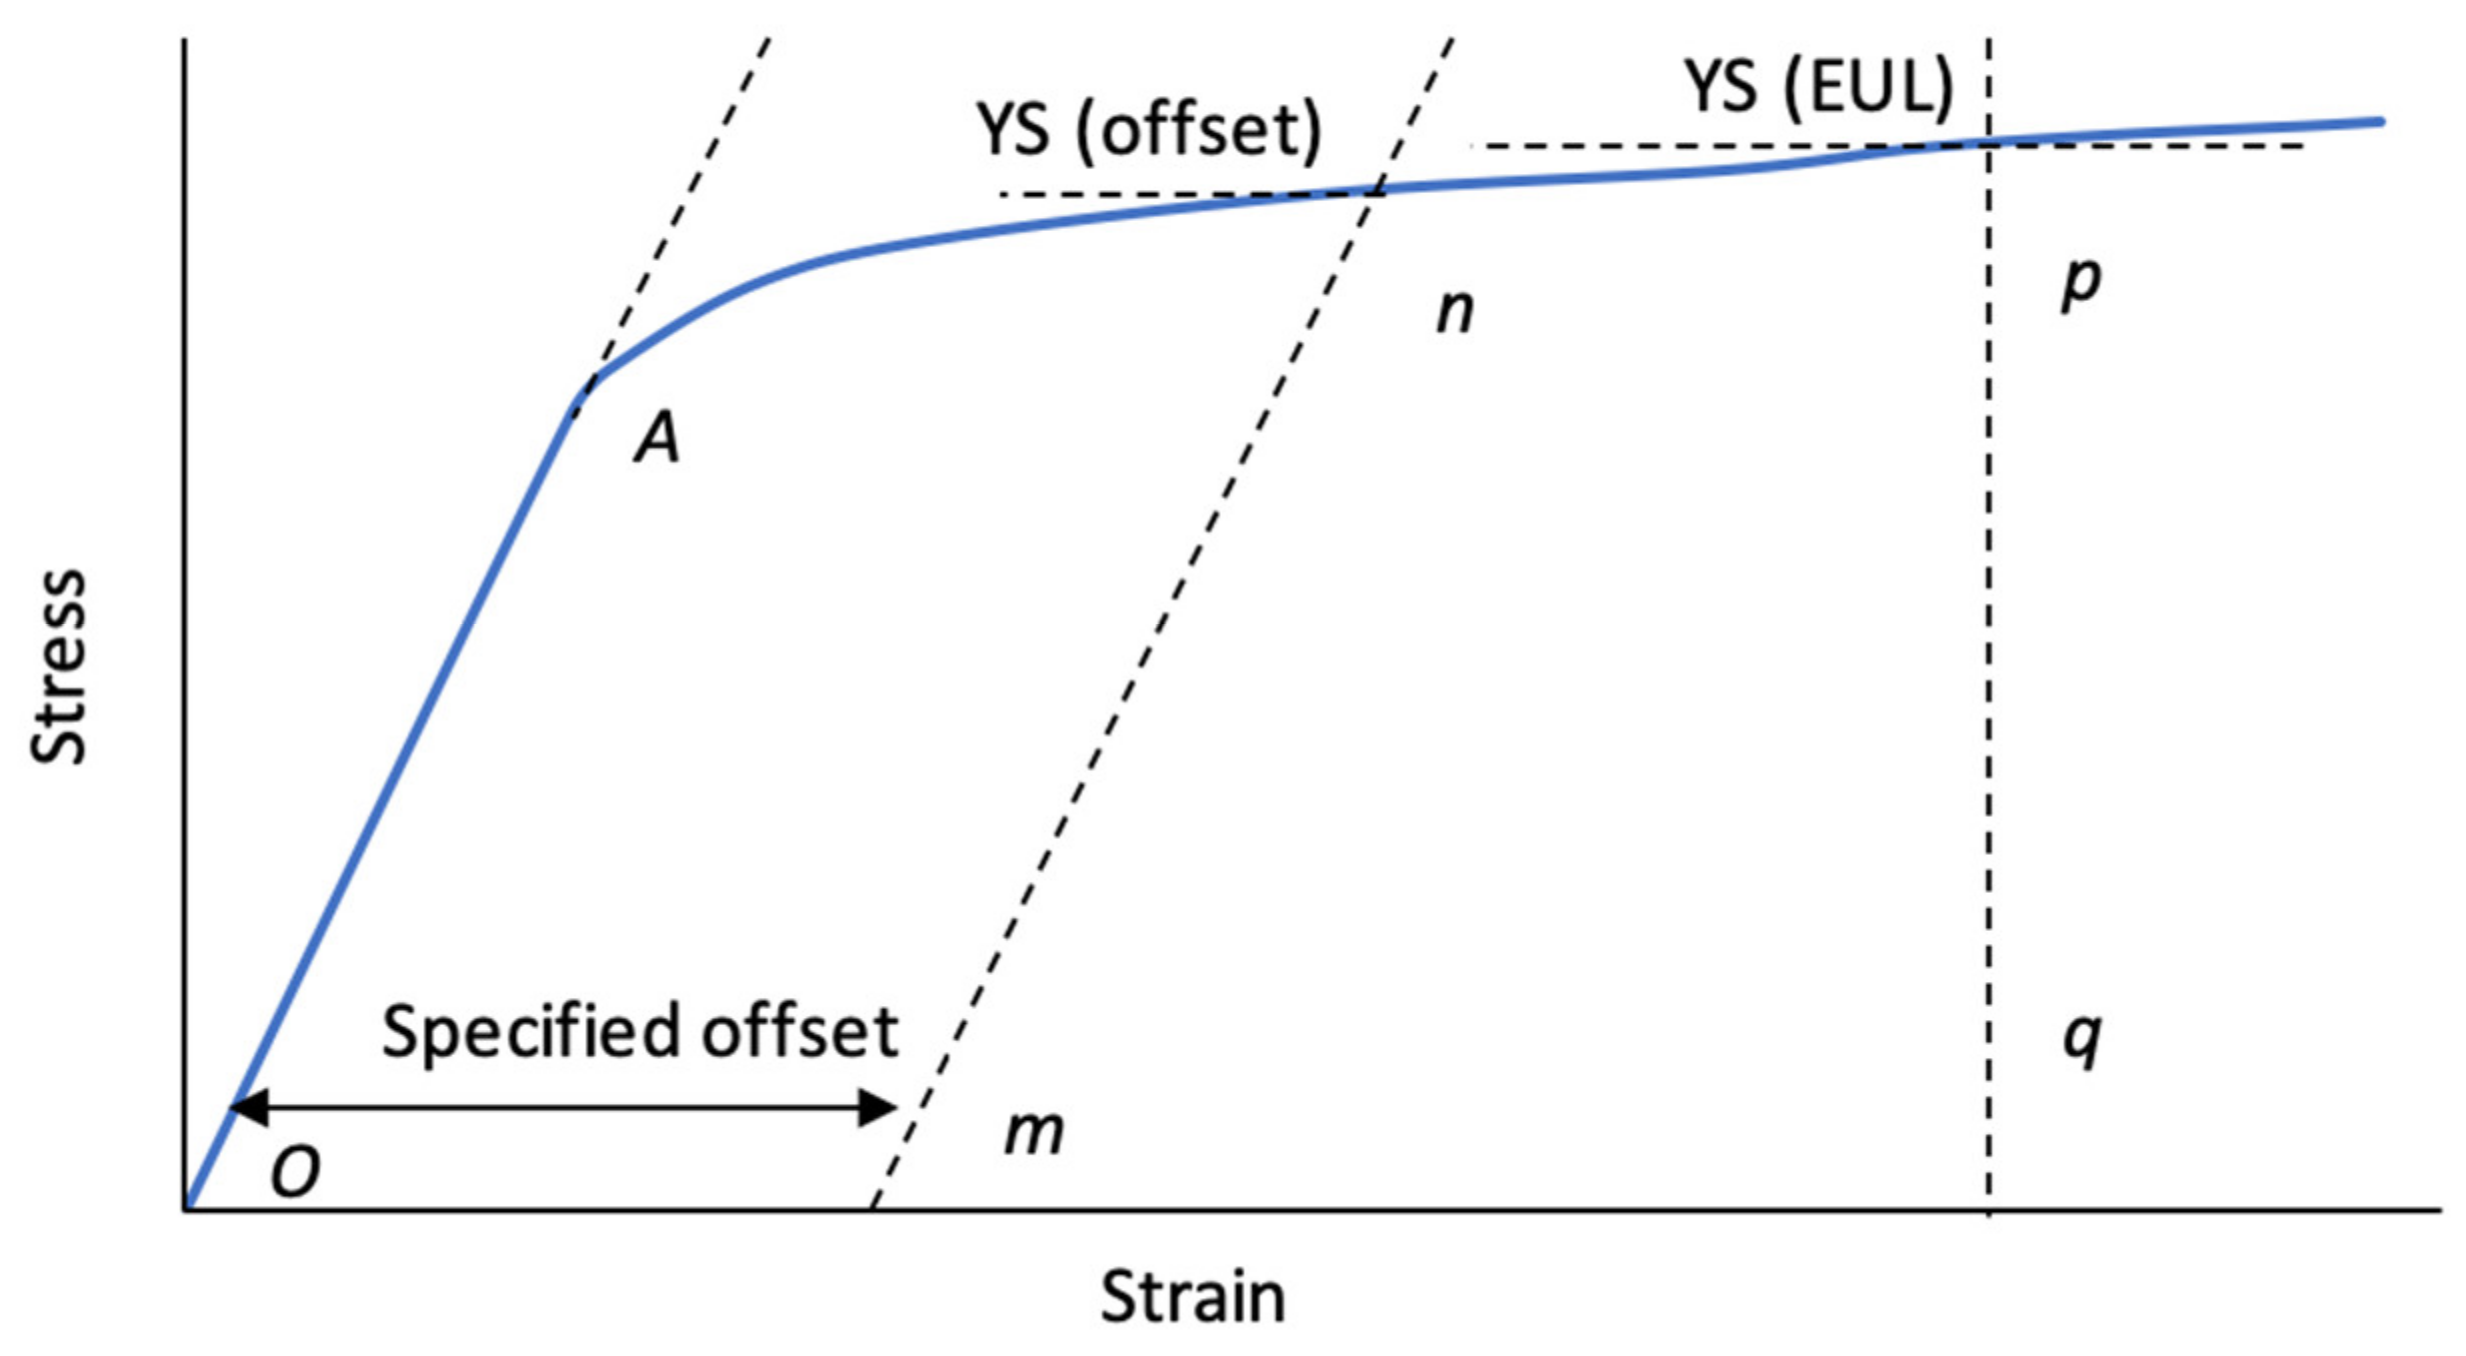
Materials that do not undergo YPE during loading are categorised as exhibiting continuous yield behaviour (see
Figure 3). In these cases, the standard methods for measuring yield strength are the Proof Strength, Non-Proportional Extension (or Offset Yield, σ
Y) and the Proof Strength, Total Extension (or Extension Under Load, σ
EUL).
Based on a somewhat arbitrary offset (most commonly 0.2% strain [
10,
12]) of the line OA in
Figure 3, representing the Elastic Modulus, along the strain axis, the σ
Y is measured as the stress where this offset line,
mn, intersects the stress–strain curve. This is also considered the default method for the determination of yield strength as is detailed in Note 33 of the ASTM specification [
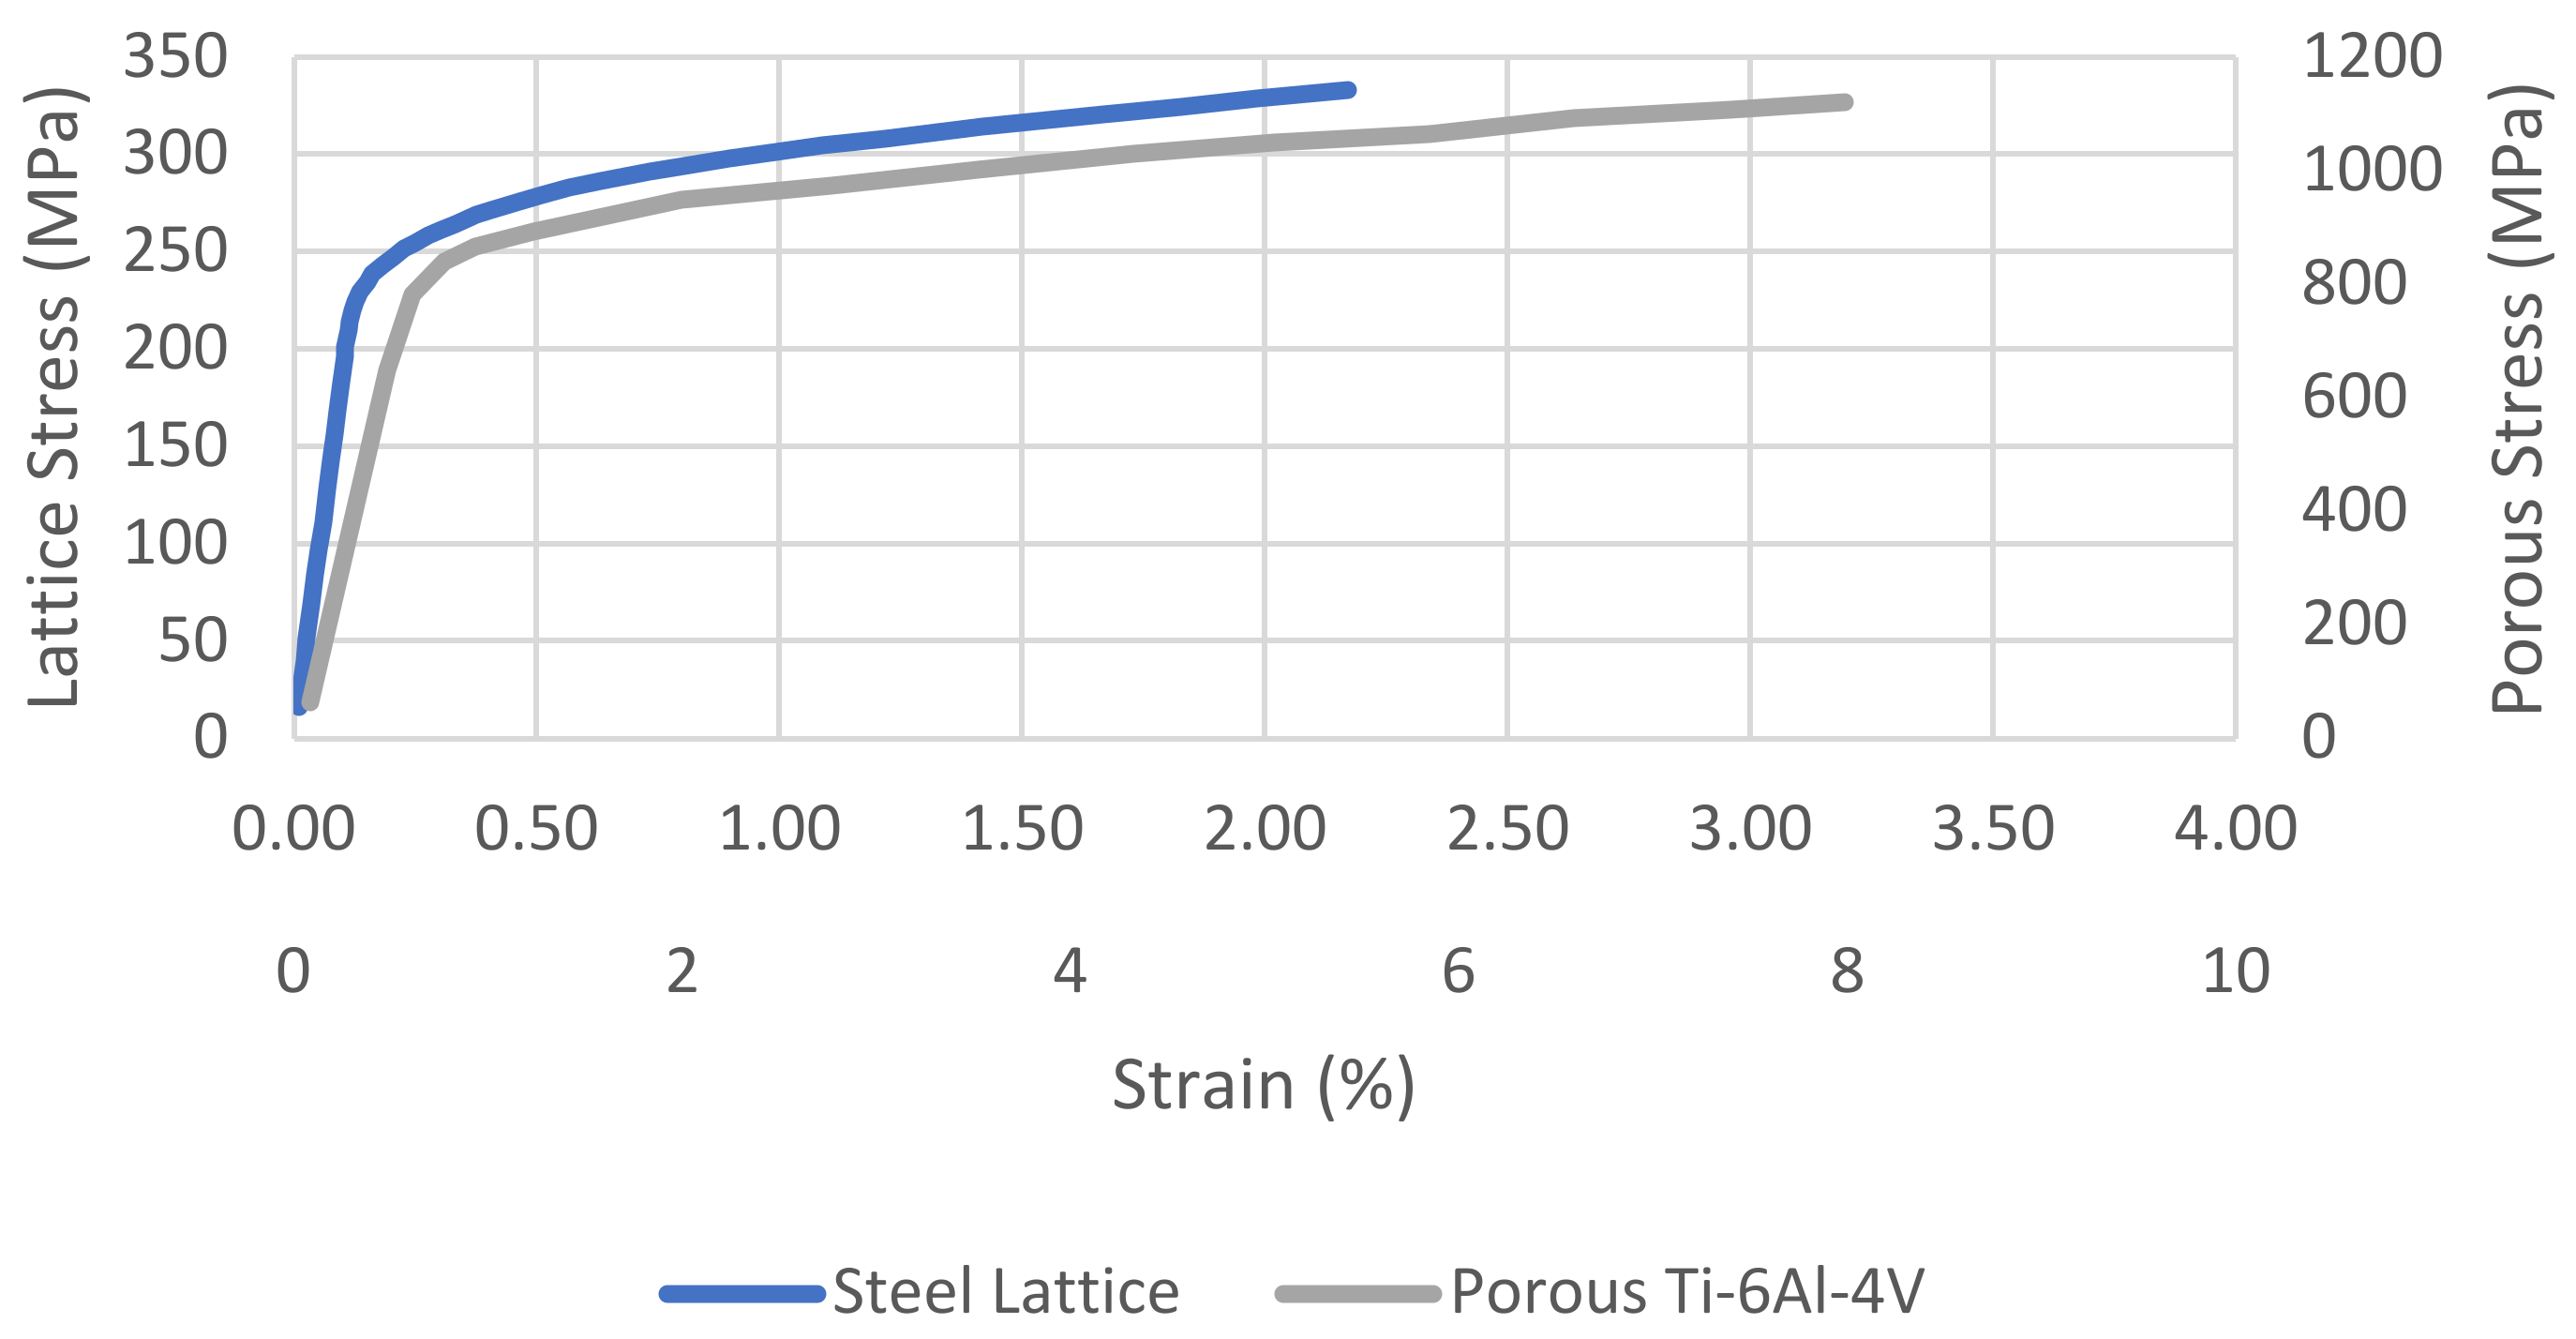
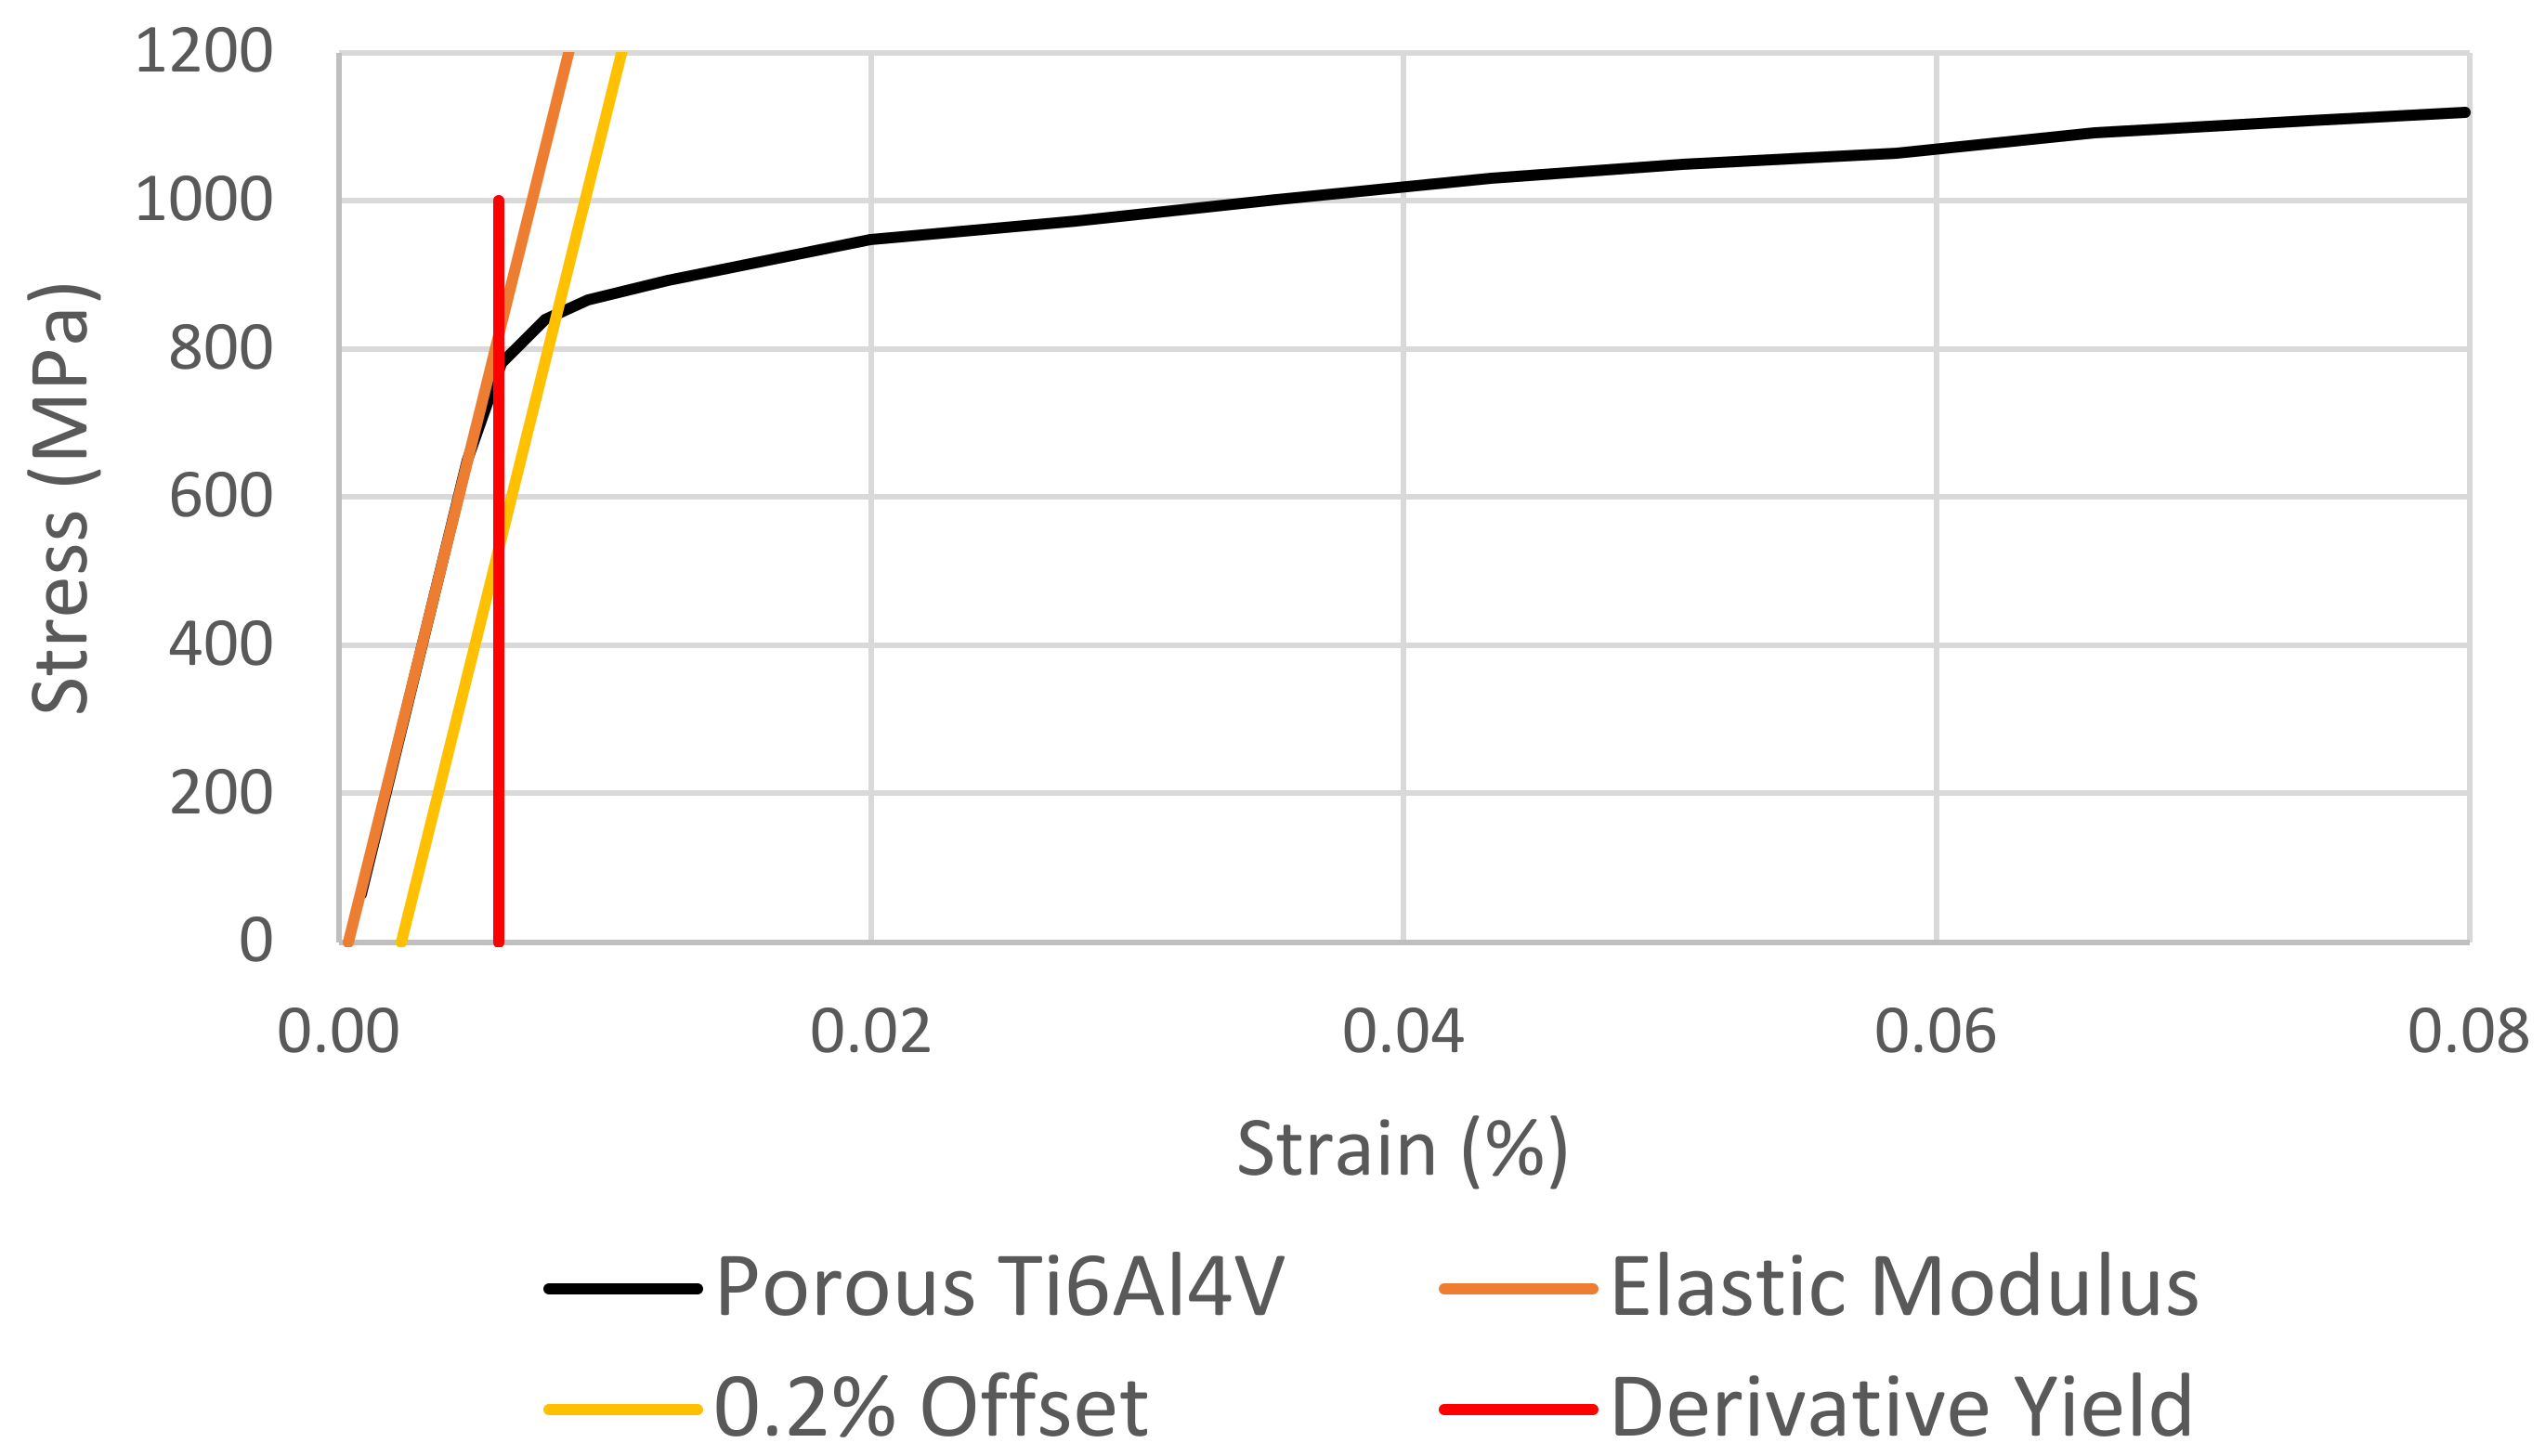
10]. This method, being based on the offset of a line representing the Elastic Modulus, implicitly assumes that this can be reliably used as an analogue to plastic strain. The upshot of this is three limitations to applicability: the stress–strain curve must exhibit a substantial linear elastic region enabling a reliable measurement of the elastic modulus; the elastic behaviour must not change appreciably over the offset range employed; and the microscopic and macroscopic yields must be similar so that the offset line crosses the stress–strain curve where the behaviour is predominantly plastic. It is evident in
Figure 4 that stainless steel lattice and porous Ti
6Al
4V (porosity 7.6%) both exhibit this type of behaviour. Therefore, the yields of these can be accurately characterised by the standard σ
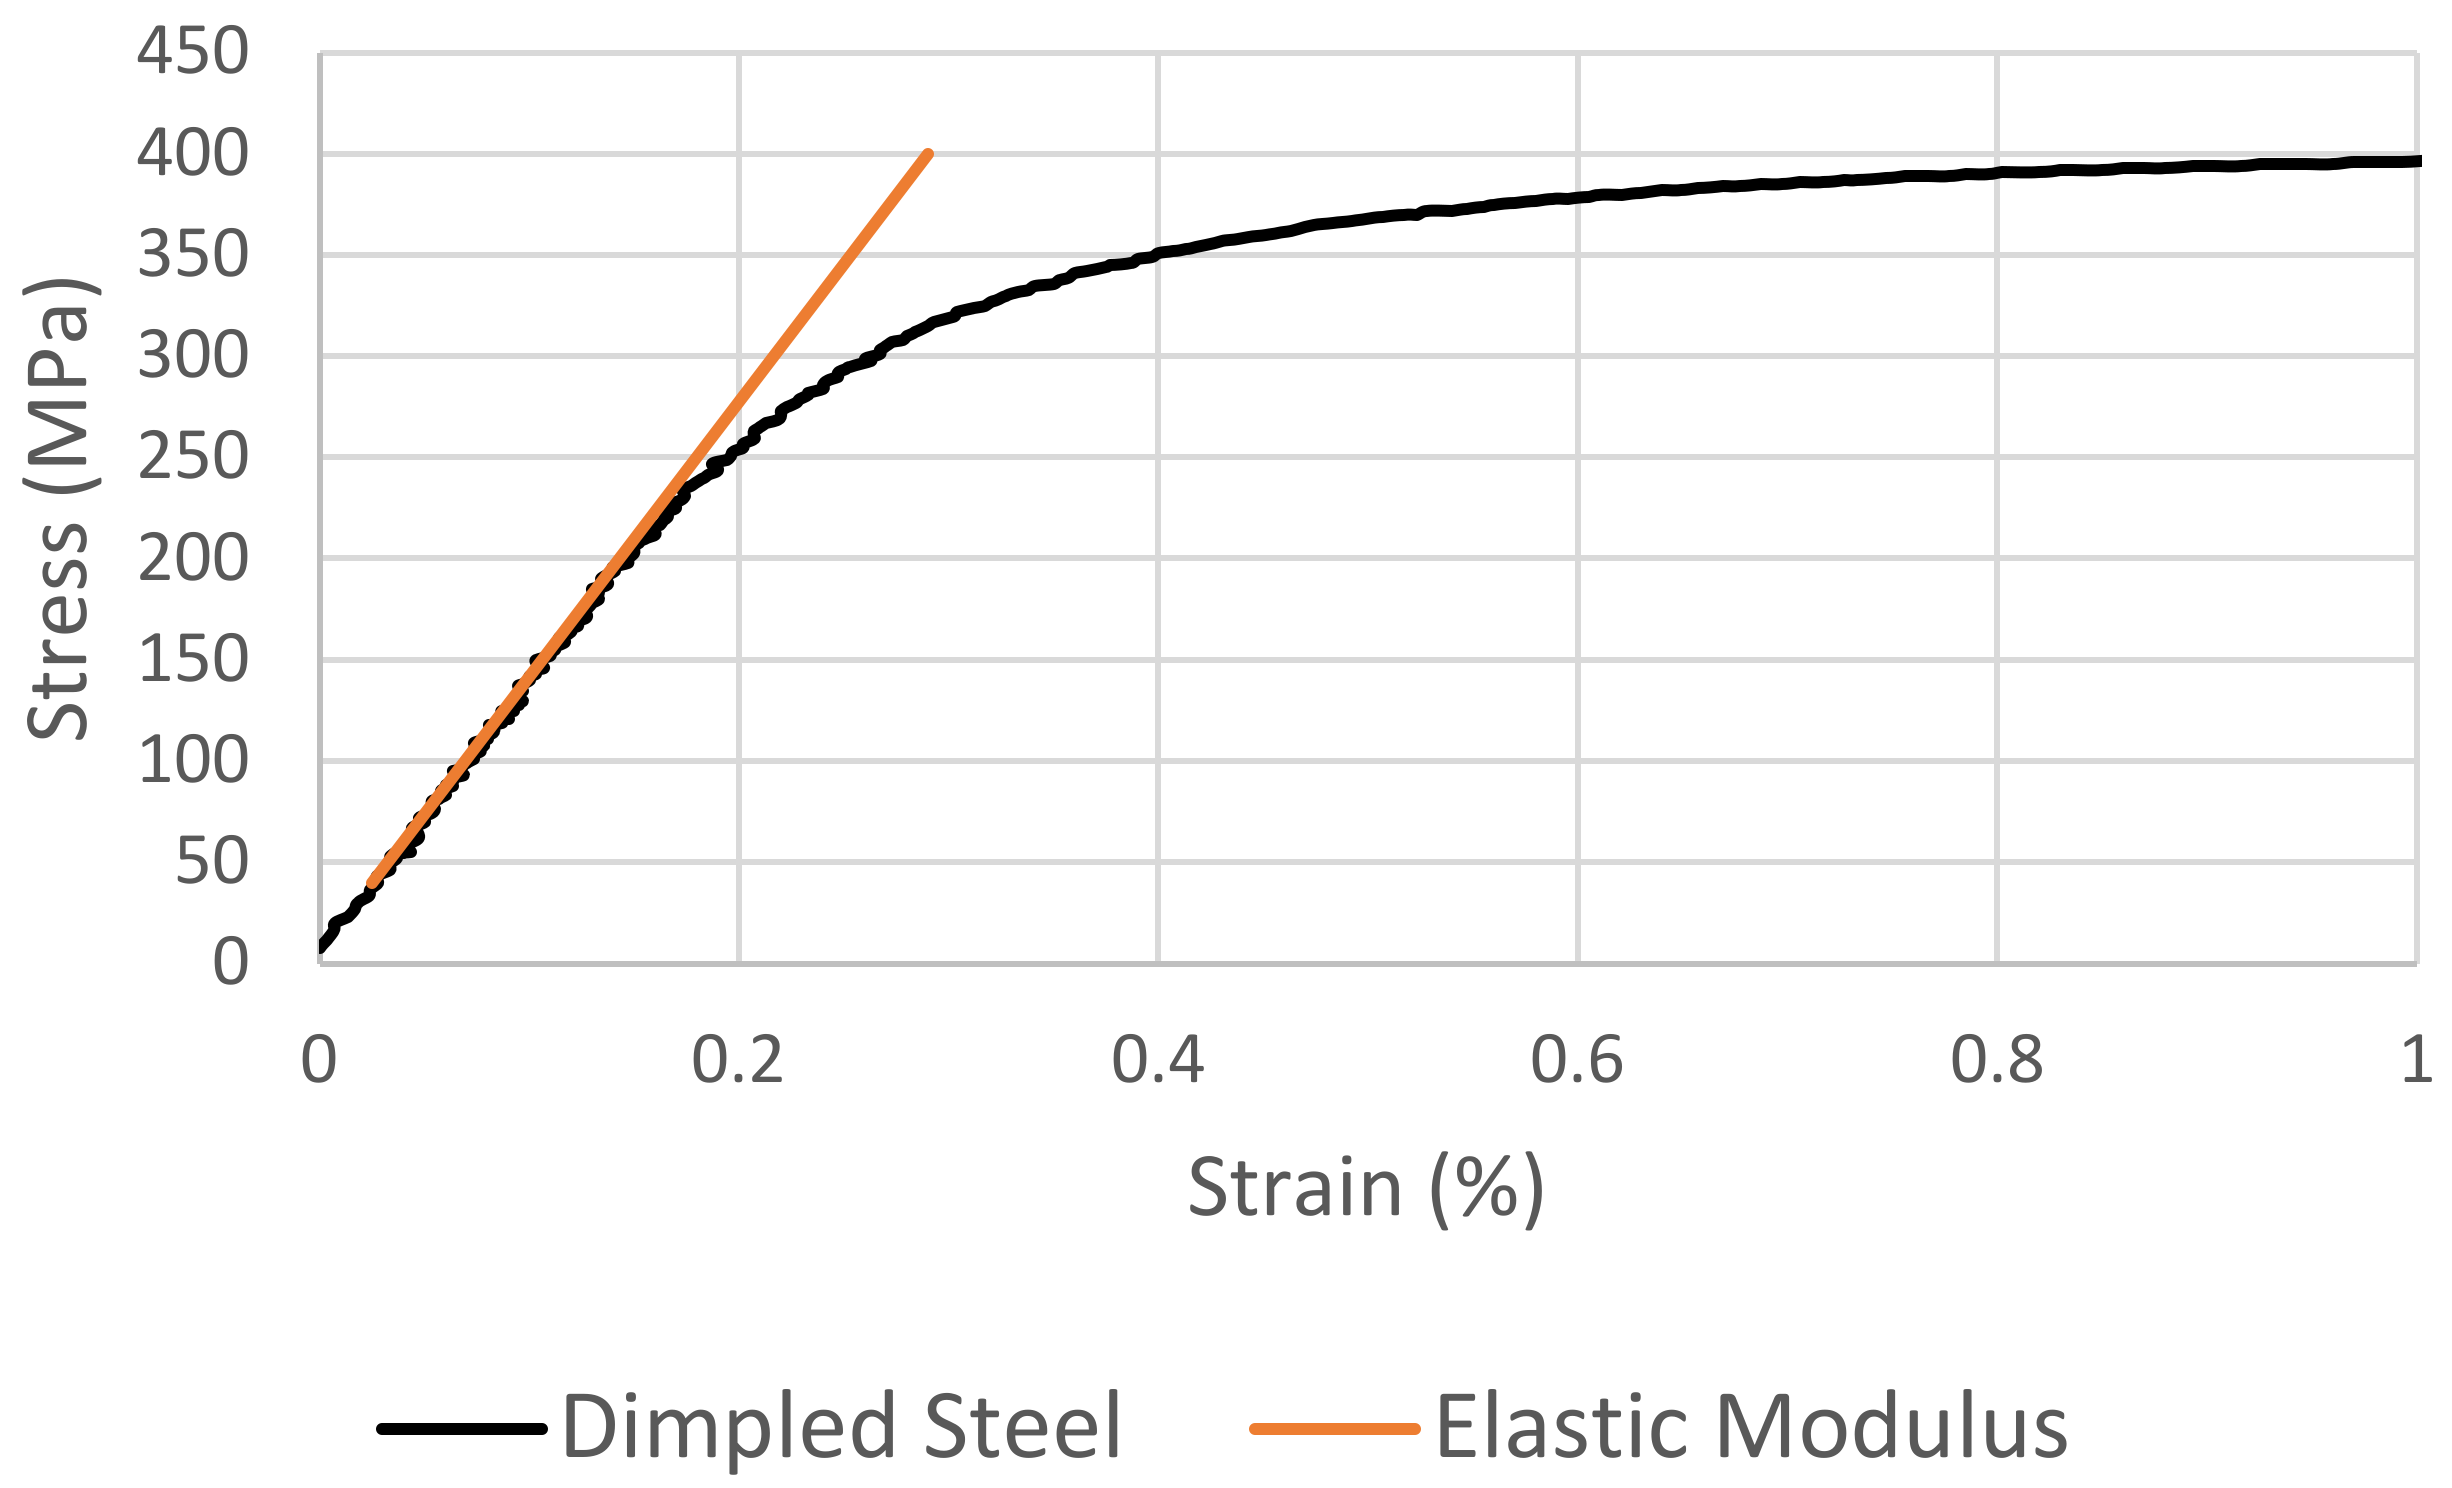
Y. Conversely,
Figure 5 illustrates the pre-macroscopic yield departure from linearity that is typical of the tensile load response of dimpled steel and makes the σ
Y inapplicable. Illustrated in
Figure 3 as line
qp, σ
EUL is, simply, the stress at a given strain. Applicable primarily in applications requiring allowable strain as opposed to yield stress, this is explored below.
1.4. Alternative Methods for the Quantification of Yield
There has been much debate around the applicability of individual yield criteria to various cases. Often citing some of the most common analytical yield criteria such as the Von Mises yield criterion [
15], the resulting investigations have given rise to numerous alternative yield criteria for use in cases where the standards do not strictly apply.
The Von Mises yield criterion is based on the assertion that yield occurs at some critical value of the distortion energy [
16,
17,
18], the portion of the total specific strain energy that contributes to isochoric shape change. Thus, an assumption of plastic incompressibility is made. In effect, this criterion suggests that rather than being dependent on any single component of normal or shear stress, yield is dependent on a function of the principal shear stresses. The Tresca yield criterion is, effectively, a less complicated version of the Von Mises criterion, considering only the maximum and minimum principal shear stresses. Use of this criterion is less common than the Von Mises criterion since it requires prior knowledge of the maximum and minimum principal shear stresses.
The 1989 study conducted by Donovan [
19] determined that the Mohr-Coulomb criterion is more representative of the behaviour of Pd
40Ni
40P
20 metallic glass than the more common Von Mises criterion.
In 1993, Karafillis and Boyce [
20] adopted a more general approach rather than tailoring their solution to a single case. They developed an expression for the yield surface of polycrystalline materials to be used as a general form yield criterion. Karafillis and Boyce also noted that the proposed expression, where appropriate, could be reduced to produce the Tresca or Von Mises criteria.
In 2003, Banabic et al. [
21] explored the criterion first proposed by Barlat and Lian [
22] in 1989. In this study, Banabic et al. determined that the introduction of three additional coefficients results in a more accurate characterisation of the behaviour of sheet metals. The modified criterion reportedly exhibits greater flexibility than its predecessor as a result of the additional coefficients and has been shown to perform well when applied to the data collected by Kuwabara et al. [
23,
24] in the late 1990s.
Cazacu and Barlat [
25] took a similar approach in 2004 to that of Karafillis and Boyce [
20] but focussed on ‘pressure insensitive metals’ rather than the more general ‘polycrystalline materials’. In this case, the proposed criterion was reported to exhibit good agreement with both experimental and theoretical yield loci. It was also noted that, like the criterion proposed by Karafillis and Boyce, when compressive and tensile stresses are equal, this criterion reduces to produce the Von Mises yield criterion. Plunkett, Cazacu, and Barlat [
26,
27] continued this work in 2006 and 2008. This resulted in the production of multiple yield functions describing the anisotropic behaviour of textured metals. These functions are based on the yield surfaces of aluminium and steel and have been reported to exhibit a high level of accuracy for different crystal structures.
1.5. Porous Materials
The 1975 and 1976 investigations by Gurson [
28,
29] appear to be among the first to explore both the microscopic and macroscopic behaviour of porous materials. This gave rise to a series of investigations producing what is now commonly referred to as ‘Gurson type’ yield criteria [
30,
31,
32,
33]. Gurson developed two different types of upper-bound yield functions based on a yield locus approach that includes consideration for rigid particle inclusions and void nucleation mechanisms. The (now common [
34,
35,
36,
37,
38,
39]) distinction between microscopic and macroscopic behaviour, where ‘macroscopic’ refers to the average quantities representing the aggregate behaviour of the material, is particularly pertinent in the present study due to the consideration of macroscopic structures.
In 1997, Liao et al. [
34] considered the case of sheet metal with through-thickness holes as an analogue to porous materials. In this way, they produced a Gurson-type closed-form upper-bound macroscopic yield criterion specific to the case of in-plane uniaxial loading. This was validated in 2004 by Wang et al. [
31], using a finite element analysis of a unit cell cube containing a spherical void.
Sevostianov and Kachanov [
14] observed in 2001 that previous Gurson-type studies were limited by, among others, the assumption of spherical pores. They noted that this precludes any consideration for mixtures of shapes and crack-like pores often present in this type of material. Addressing this limitation, a plastic yield condition was constructed that explicitly accounts for non-randomly oriented non-spherical pores. Sevostianov and Kachanov also reported that the total strain at the onset of macroscopic plasticity, the macroscopic yield point, is independent of porosity and that the only effect porosity has on the tensile load response of the material is a decrease in the yield stress.
Also focussing on porous materials, McElwain et al. [
30] sought to extend the 1984 Gurson–Tvergaard–Needleman (GTN) yield criterion [
40]. In 2006, McElwain et al. used the finite element method to explore how different arrangements of spherical voids affect the yield behaviour of porous materials. This resulted in the development of different expressions for each case and reportedly achieved greater accuracy in the representation of general stress states without introducing additional parameters.
Keralavarma and Benzerga [
32] applied a similar approach in 2008 to the work by Gurson. They presented the derivation of analytical yield loci for anisotropic porous materials. This led to the proposal of a new yield criterion that includes consideration of spheroidal voids and Hill-type orthotropy.
In the second of a two-part publication in 2012, Madou and Leblond [
33] developed the Gurson yield criterion further, including consideration for porous ductile materials with arbitrary ellipsoidal porosity. It is noted that this updated Gurson-type criterion reduces approximately according to the original Gurson criterion when applied to spherical voids.
1.6. Lattice Materials
Early studies regarding the behaviour of metallic lattices have produced somewhat mixed results regarding the applicability of previously formulated yield criteria. This is likely largely due to variations in the types of lattice considered since each of these studies considers specific lattice structures.
Deshpande et al. [
41] explored the octet-truss lattice in 2001. This study incorporated both analytical and FE methods and reported good agreement between the FE predictions of strength and experimental results. It is reported here that an extension to the anisotropic Hill yield criterion does not accurately characterise the form of the collapse surfaces. Conversely, the 2014 study by Khaderi et al. [
37], investigating the strength of gyroid lattices, reports that the anisotropic Hill criterion provides an accurate representation of the yield surface of the imperfect lattice.
In 2006, Hualin and Wei [
42] formulated a yield model for stretching-dominated lattice structures based on an equivalent continuum method. The calculated yield surfaces were reported to be in good agreement with experimental data.
Zhang et al. [
43] investigated the metal foam, metal hexagonal honeycomb, metal lattic, and lattice composite in 2008. In this study, analytical elastic relations and failure criteria for planar lattice composites were established and validated by accompanying FE simulations. These relations were based on a unit cell assessment of the static equilibrium and deformation relations. Zhang et al. reported that during loading, the out-of-plane constraint of these lattice materials significantly influences their in-plane strength and that the proposed analytical approach can identify this effect.
Noting in 2012 previous assumptions that lattice materials are stretching-dominated, Chen et al. [
44] investigated the bending resistance of the struts that compose lattice truss sandwich panels. Comparing this with experimental results, they reported that stretching-dominated models overestimate the strength of lattices while underestimating their stiffness. The model presented in this study is reported to produce predictions that are more consistent with the experimental results.
Considering the above, it is evident that neither the standard yield criteria nor the alternatives in the literature successfully achieve broad applicability while maintaining the level of simplicity required for regular application in both academic and industrial contexts. Additionally, as noted, the standardised acceptance of yield criteria based on different principles sometimes results in the necessary comparison of incompatible yield criteria. Furthermore, the use of the σY,0.2 as the default measure has been shown to be inapplicable in the case where the material in question exhibits severely continuous yielding. Consequently, a novel method for the quantification of yield that is independent of the type of yield behaviour is required. This method must also feature a simplicity in application not easily achieved by analytical means.
The distinction between microscopic and macroscopic yield has been noted previously. Considering the case of severely continuous yield, Liang et al. [
45] have shown that for dimpled steel, this is a result of geometric non-uniformity which Nguyen et al. [
46] and Wang et al. [
47] have determined plays a significant role in determining the stress–strain behaviour of the material. Specifically, stress concentrations due, in part, to geometry result in local microscopic yield that manifests as a pre-macroscopic yield departure from linearity. This is observed in this paper and is similar to the deviation from the ideal elastic response below macroscopic yield in the 2018 study by Máthis et al. [
39]. Considering this in relation to the stress–strain curve for dimpled steel in this paper, it is evident that the microscopic yield results only in relatively small deviations from the ideal linear response, while the macroscopic yield manifests as a clear localised change in the tangent to the stress–strain curve, the tangent modulus. This pronounced change in the tangent modulus marks the transfer from predominantly global to predominantly local strain that accompanies the plastic yield of a sample. We note that a similar localised change in the tangent modulus is also observed at the yield point for discontinuous and continuous yield (
Figure 2 and
Figure 4). Thus, it is proposed here that a graphical approach to the quantification of yield strength based upon this localised change in the tangent modulus may provide a means to non-arbitrarily measure the yield strength of a material independently of the type of yield behaviour exhibited.
2. Materials and Methods
Since a localised change in the tangent modulus is effectively a peak in the rate-of-change thereof, it is expected that the second derivative of stress with respect to strain exhibits a pronounced turning point at the strain level of the yield point. Referred to here as the ‘derivative yield’, σΔY, this novel method asserts that . In this way, the yield strain is identified, enabling the determination of the yield strength based on the measured stress–strain relationship. This method is applied alongside the appropriate standards for each test case considered in the following sections.
As a basis for the illustrative application of various methods for the quantification of yield strength, a series of quasi-static tensile tests were conducted. First, samples were taken from galvanised steel coils of specification DX51D+Z/ZF [
48]. The material from these same coils was then processed using type 70 UltraSTEEL
®3, Hadley Industries, UK rolls according to industry standards, allowing the collection of dimpled samples from the resulting dimpled sheet. Thirty plain steel and thirty dimpled steel samples were taken from ten different steel coils (three + three for each coil). The specification for these samples is illustrated in
Figure 6.
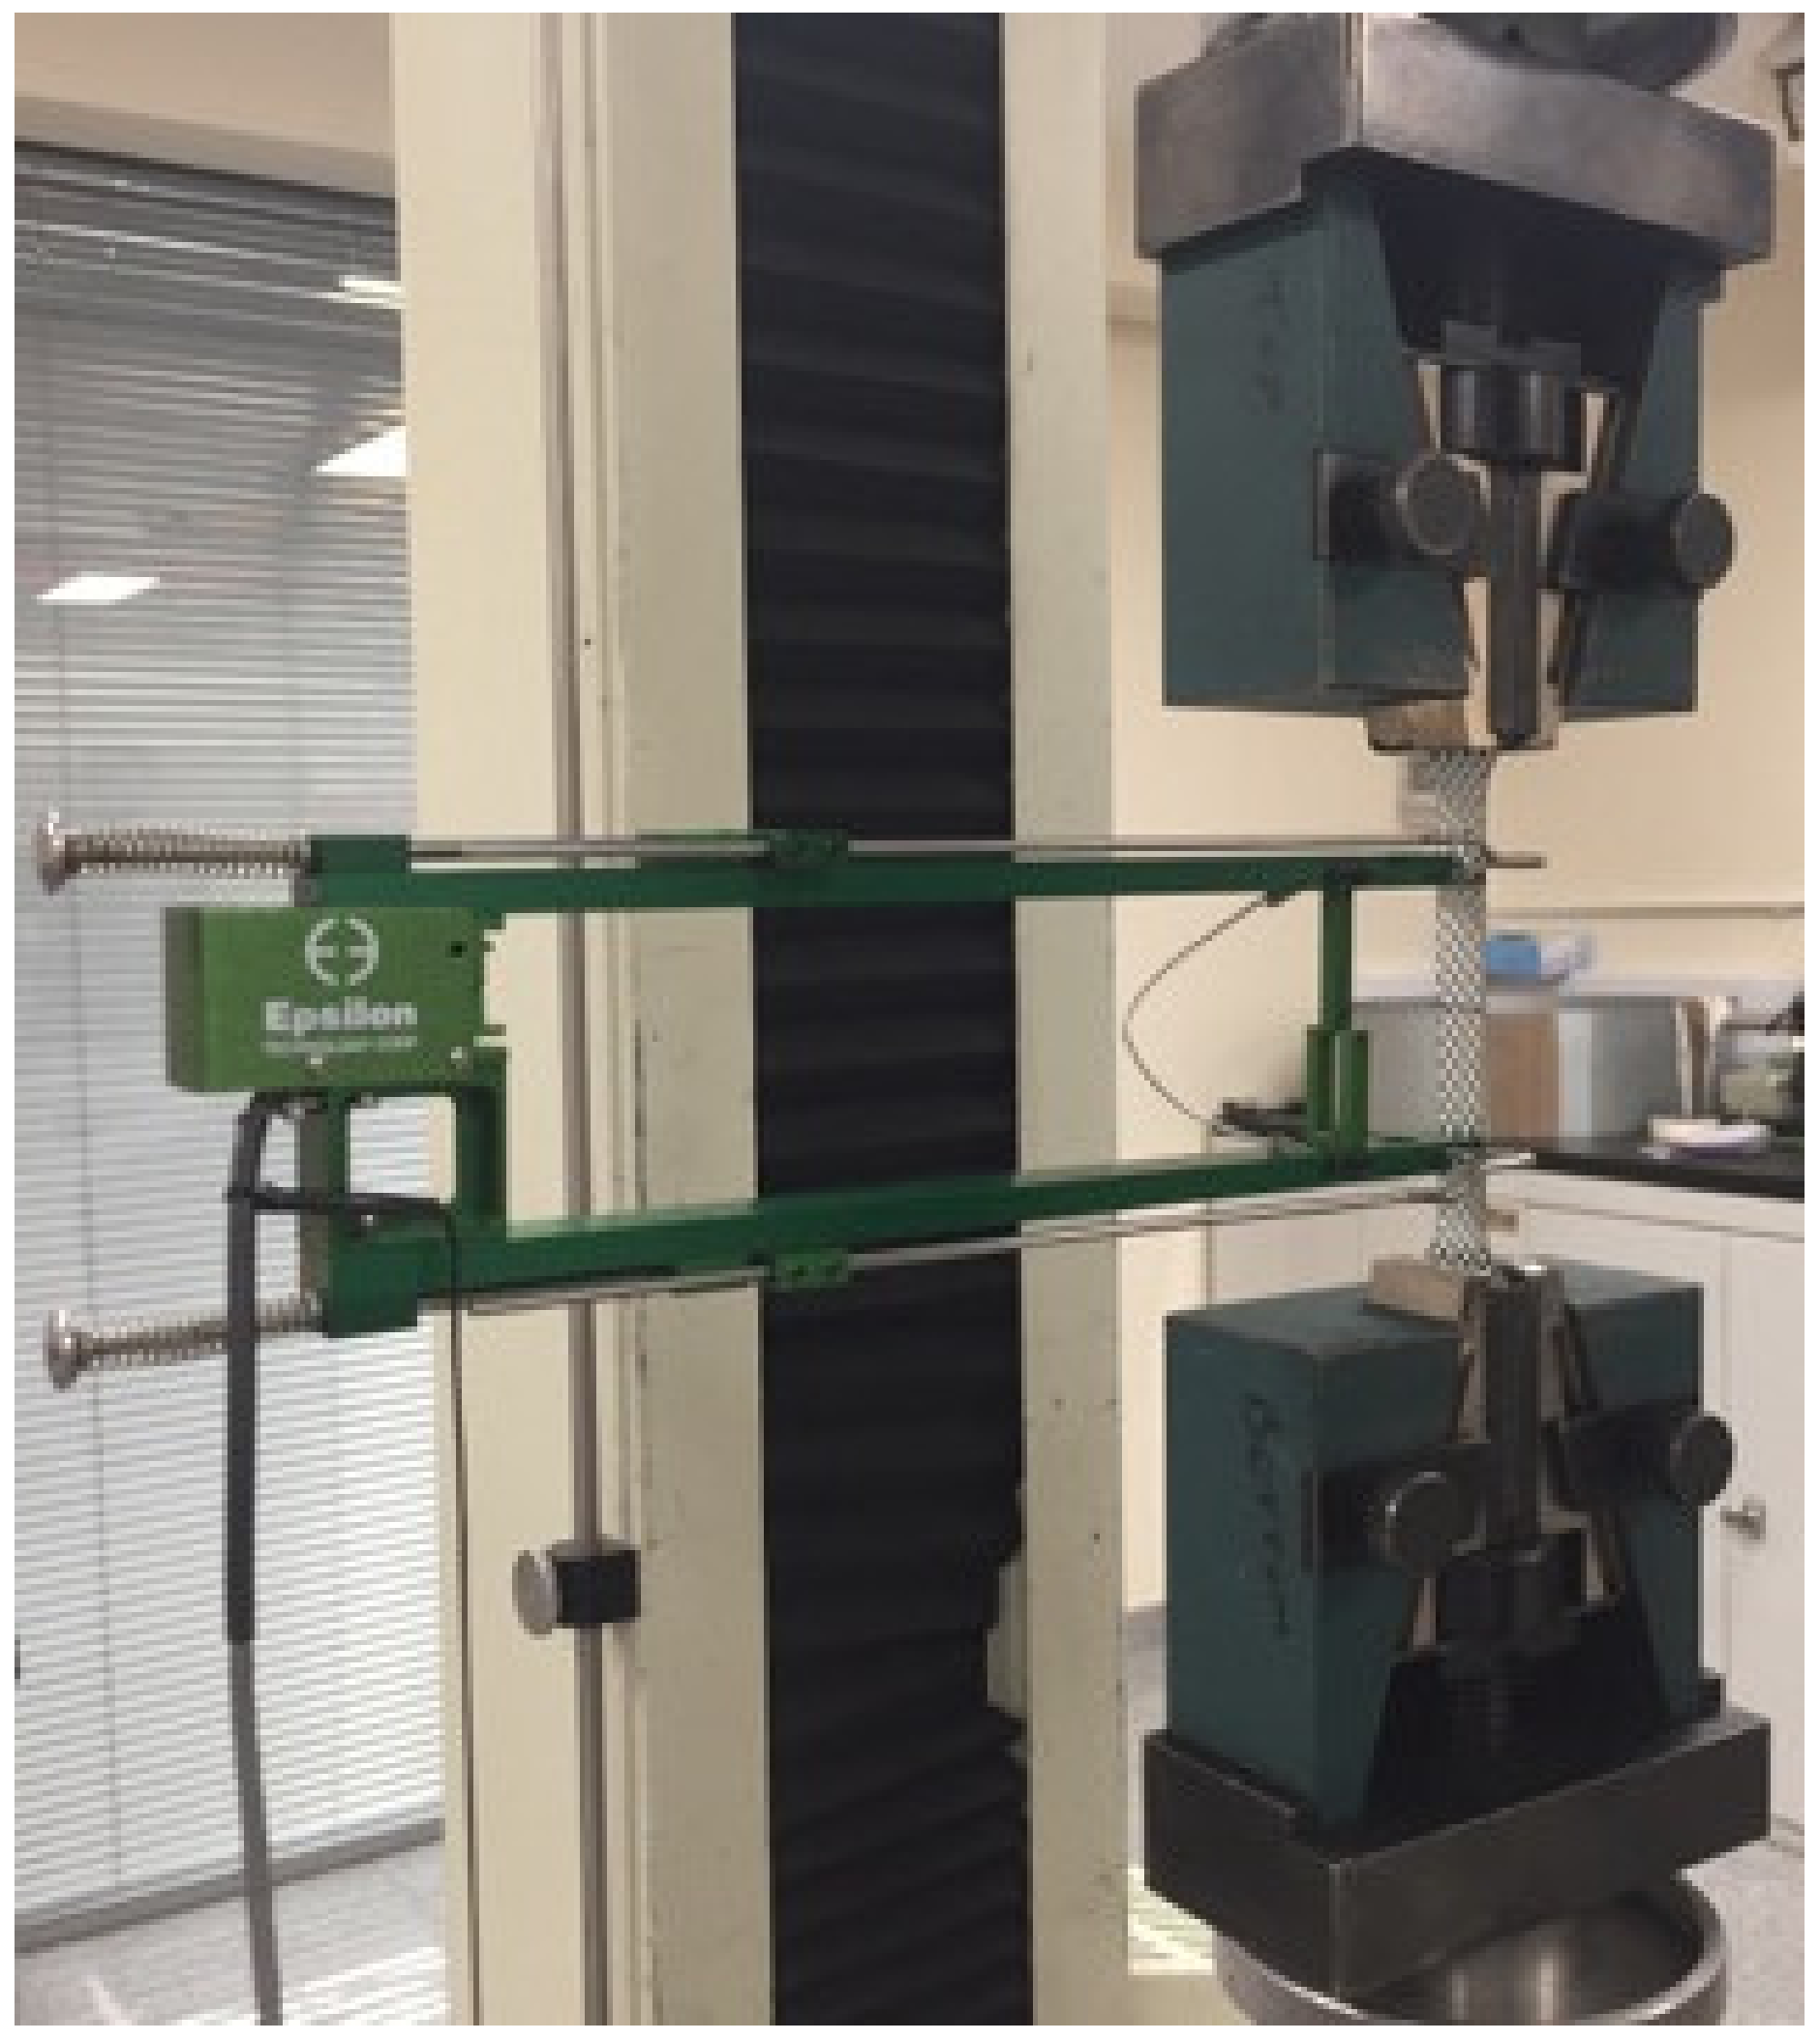
Illustrated in
Figure 7, the tests were conducted according to British Standards [
12]. Each sample was fixed in aligned grips for tensile testing on a rig with a maximum load capacity of 50 kN (H50KS Tinius Olsen Ltd., Surry, UK). An extensometer of 50 mm gauge length (Epsilon 50 mm extension) was then attached to the specimen to measure uniaxial strain in the loading direction. The plain and dimpled samples were of 0.54 ± 0.03 mm gauge and 1.22 ± 0.02 mm effective gauge, respectively, and were tested to failure at a strain rate of 2.50 mm/min. Effective gauge here refers to the overall thickness of the dimpled samples.
3. Results
Presented in the form , the results of the experimental tensile testing showed an average yield stress, σUY, of 332 MPa (332 ± 11 MPa) and an average ultimate tensile stress of 387 MPa (384 ± 15 MPa) for the plain steel samples. The dimpled samples exhibited increases to both, with an average yield stress, σY,0.2, of 354 MPa (350 ± 37 MPa) and an average ultimate tensile stress of 419 MPa (419 ± 20 MPa) for the dimpled steel. We note the necessary comparison between the σUY and σY,0.2 due to the different yield behaviours exhibited.
Regarding the discontinuous yield exhibited by plain steel in tension, illustrated in
Figure 2, the standard σ
UY and σ
LY are clearly applicable. Both more commonly used and more closely matching the as-defined macroscopic yield, σ
UY has been used here.
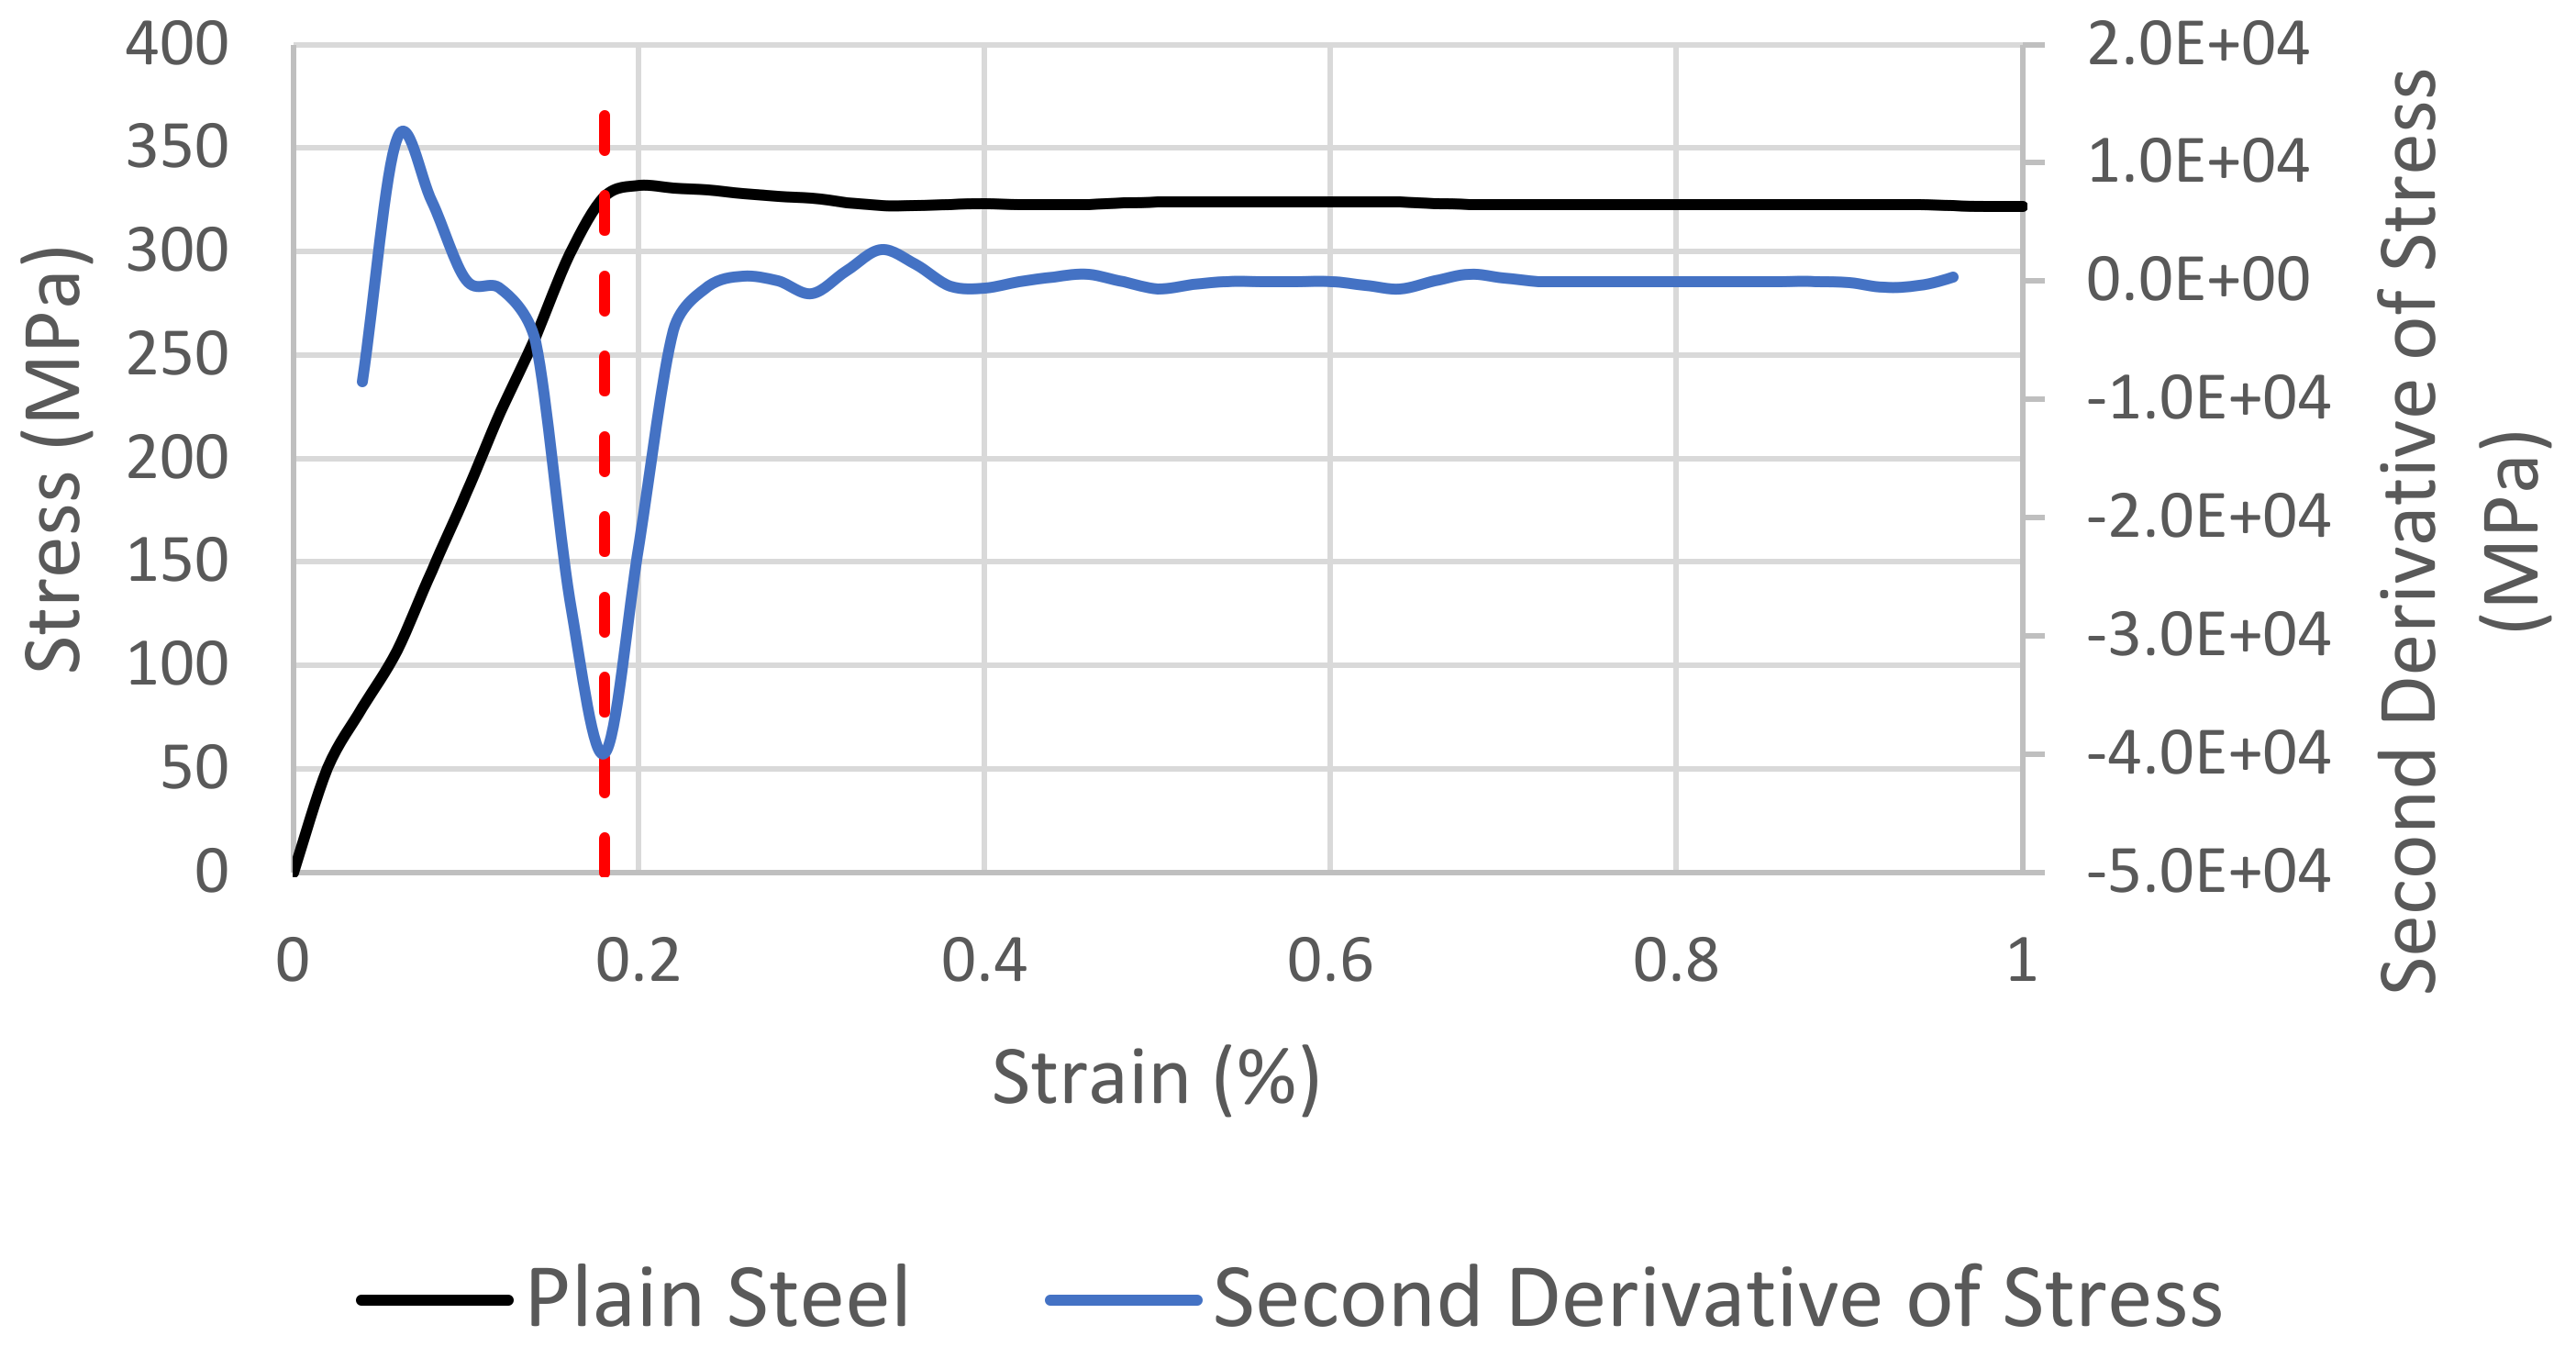
Figure 8 illustrates the application of the novel derivative yield, σ
ΔY, to the discontinuous yield of the plain steel and shows that the result is in good agreement with the standard σ
UY.
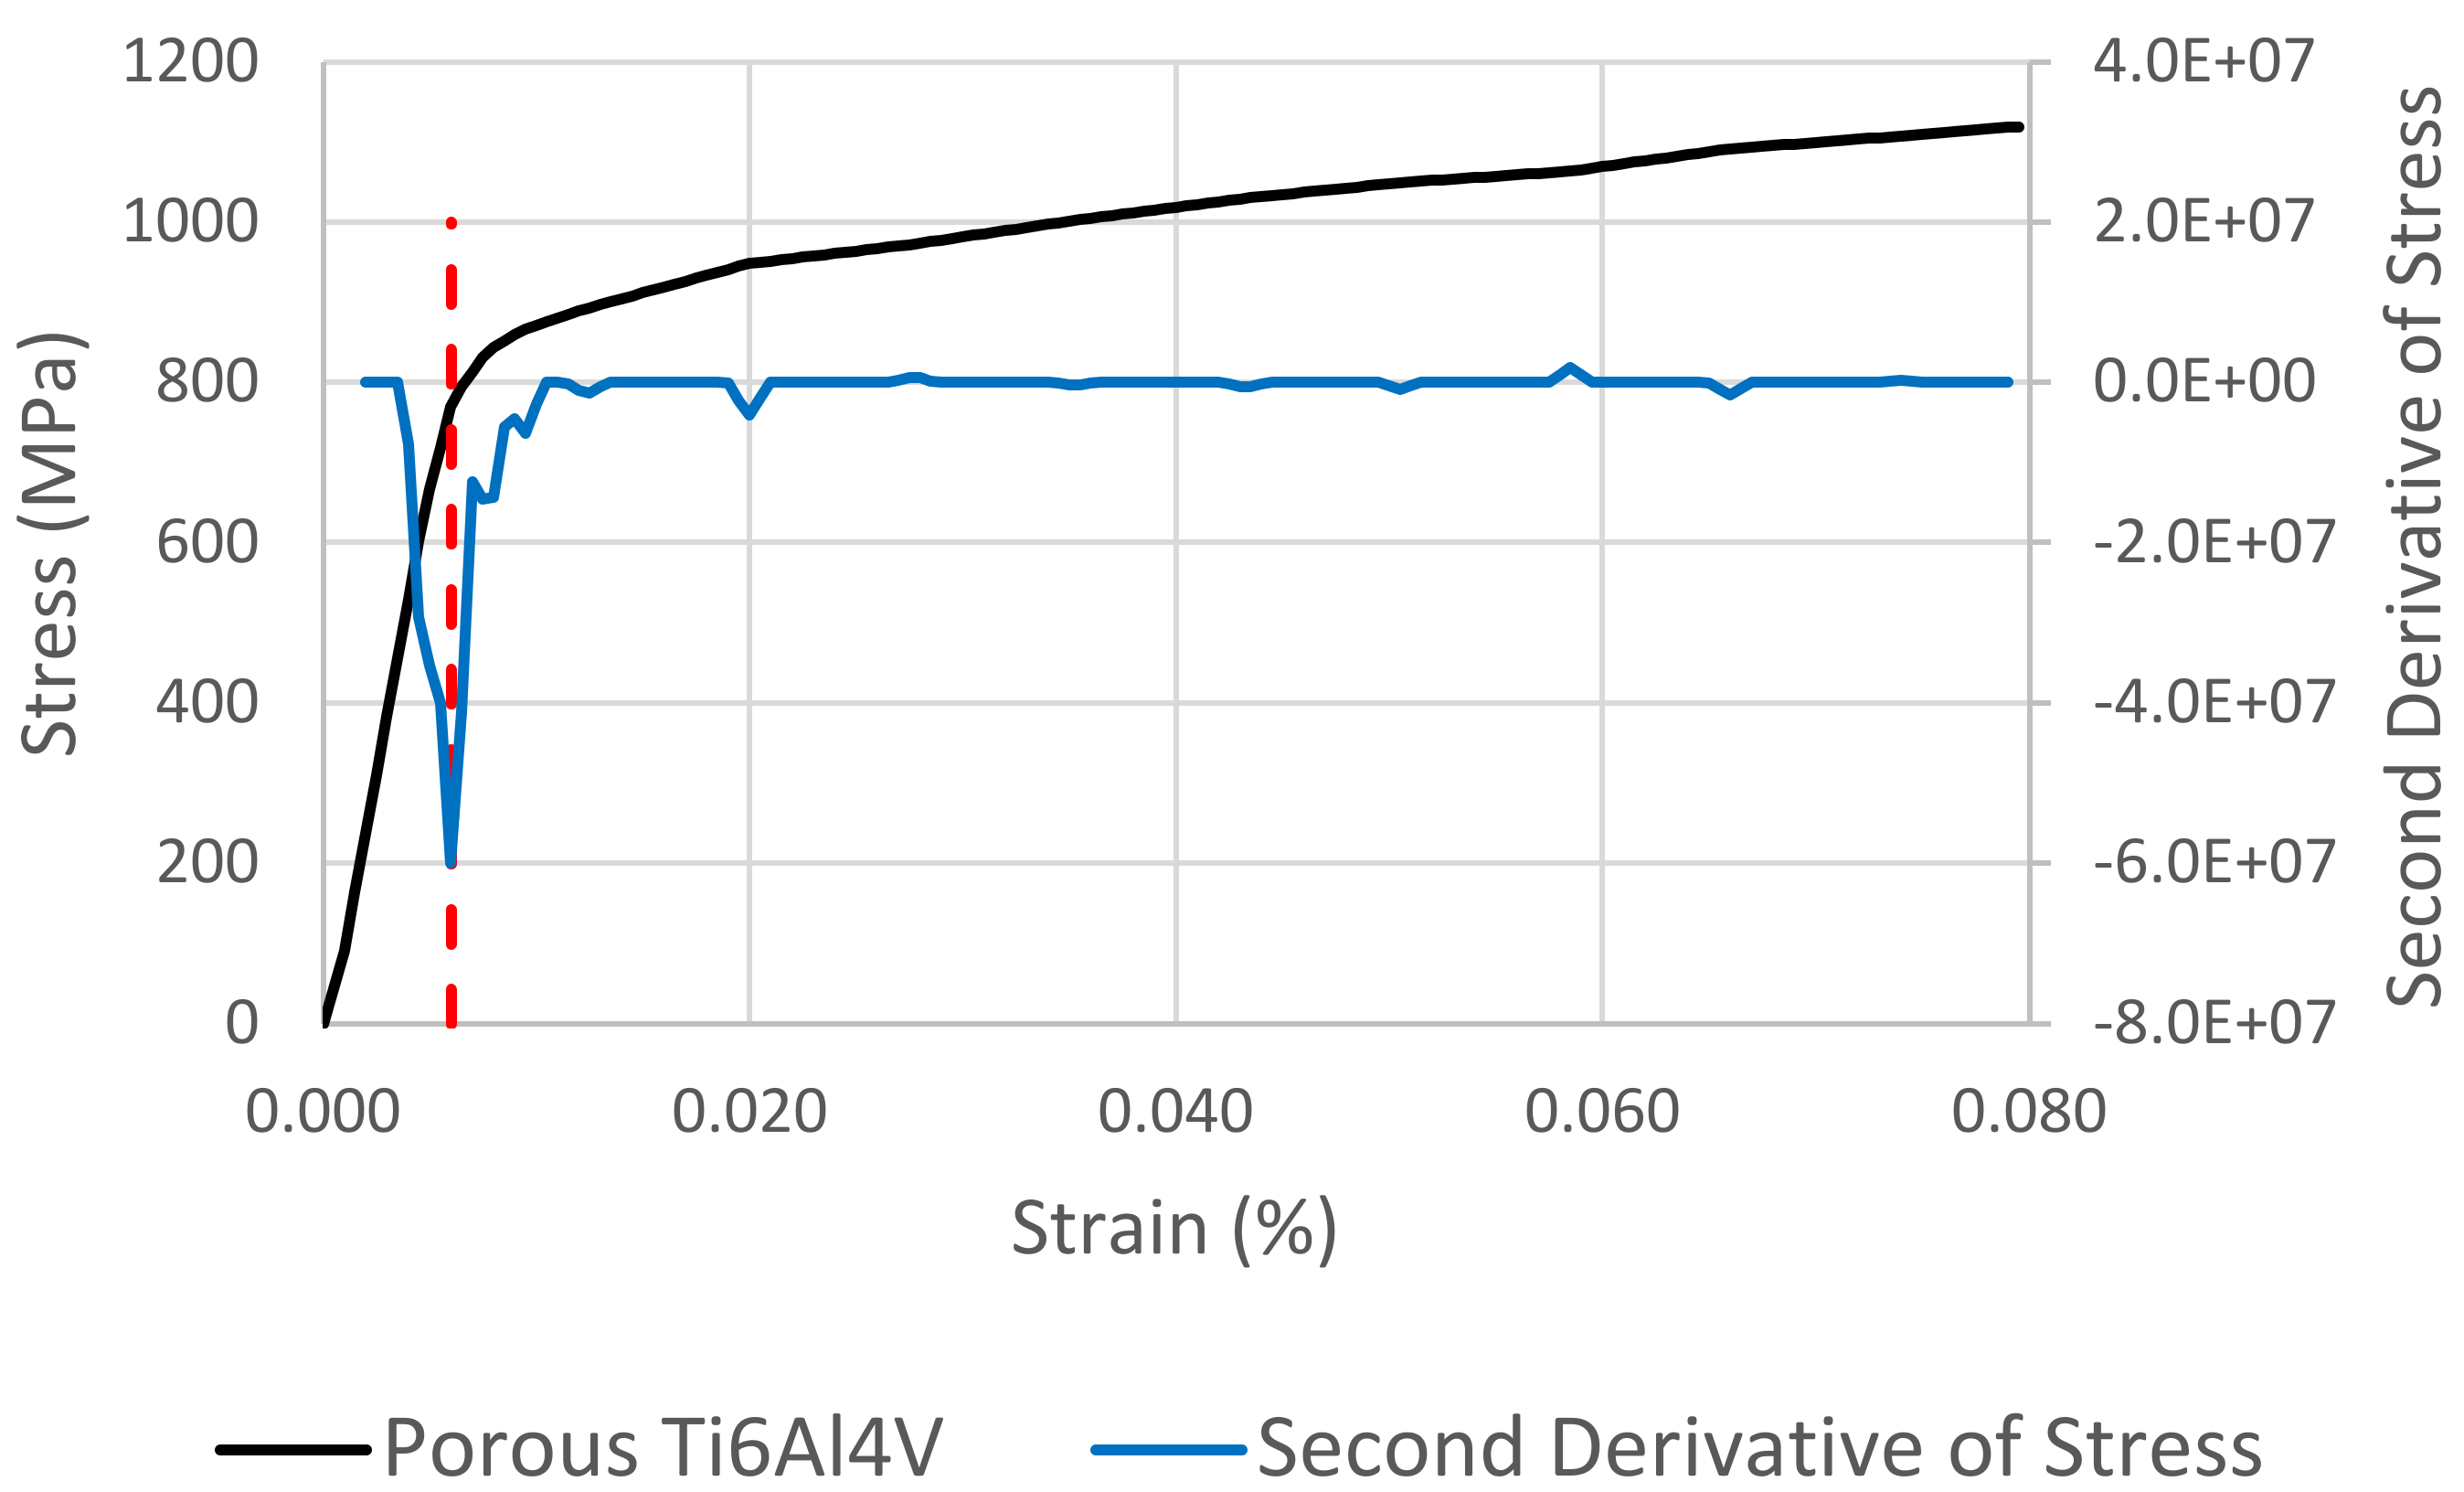
The continuous yields exhibited by the lattice and porous examples are illustrated in
Figure 4.
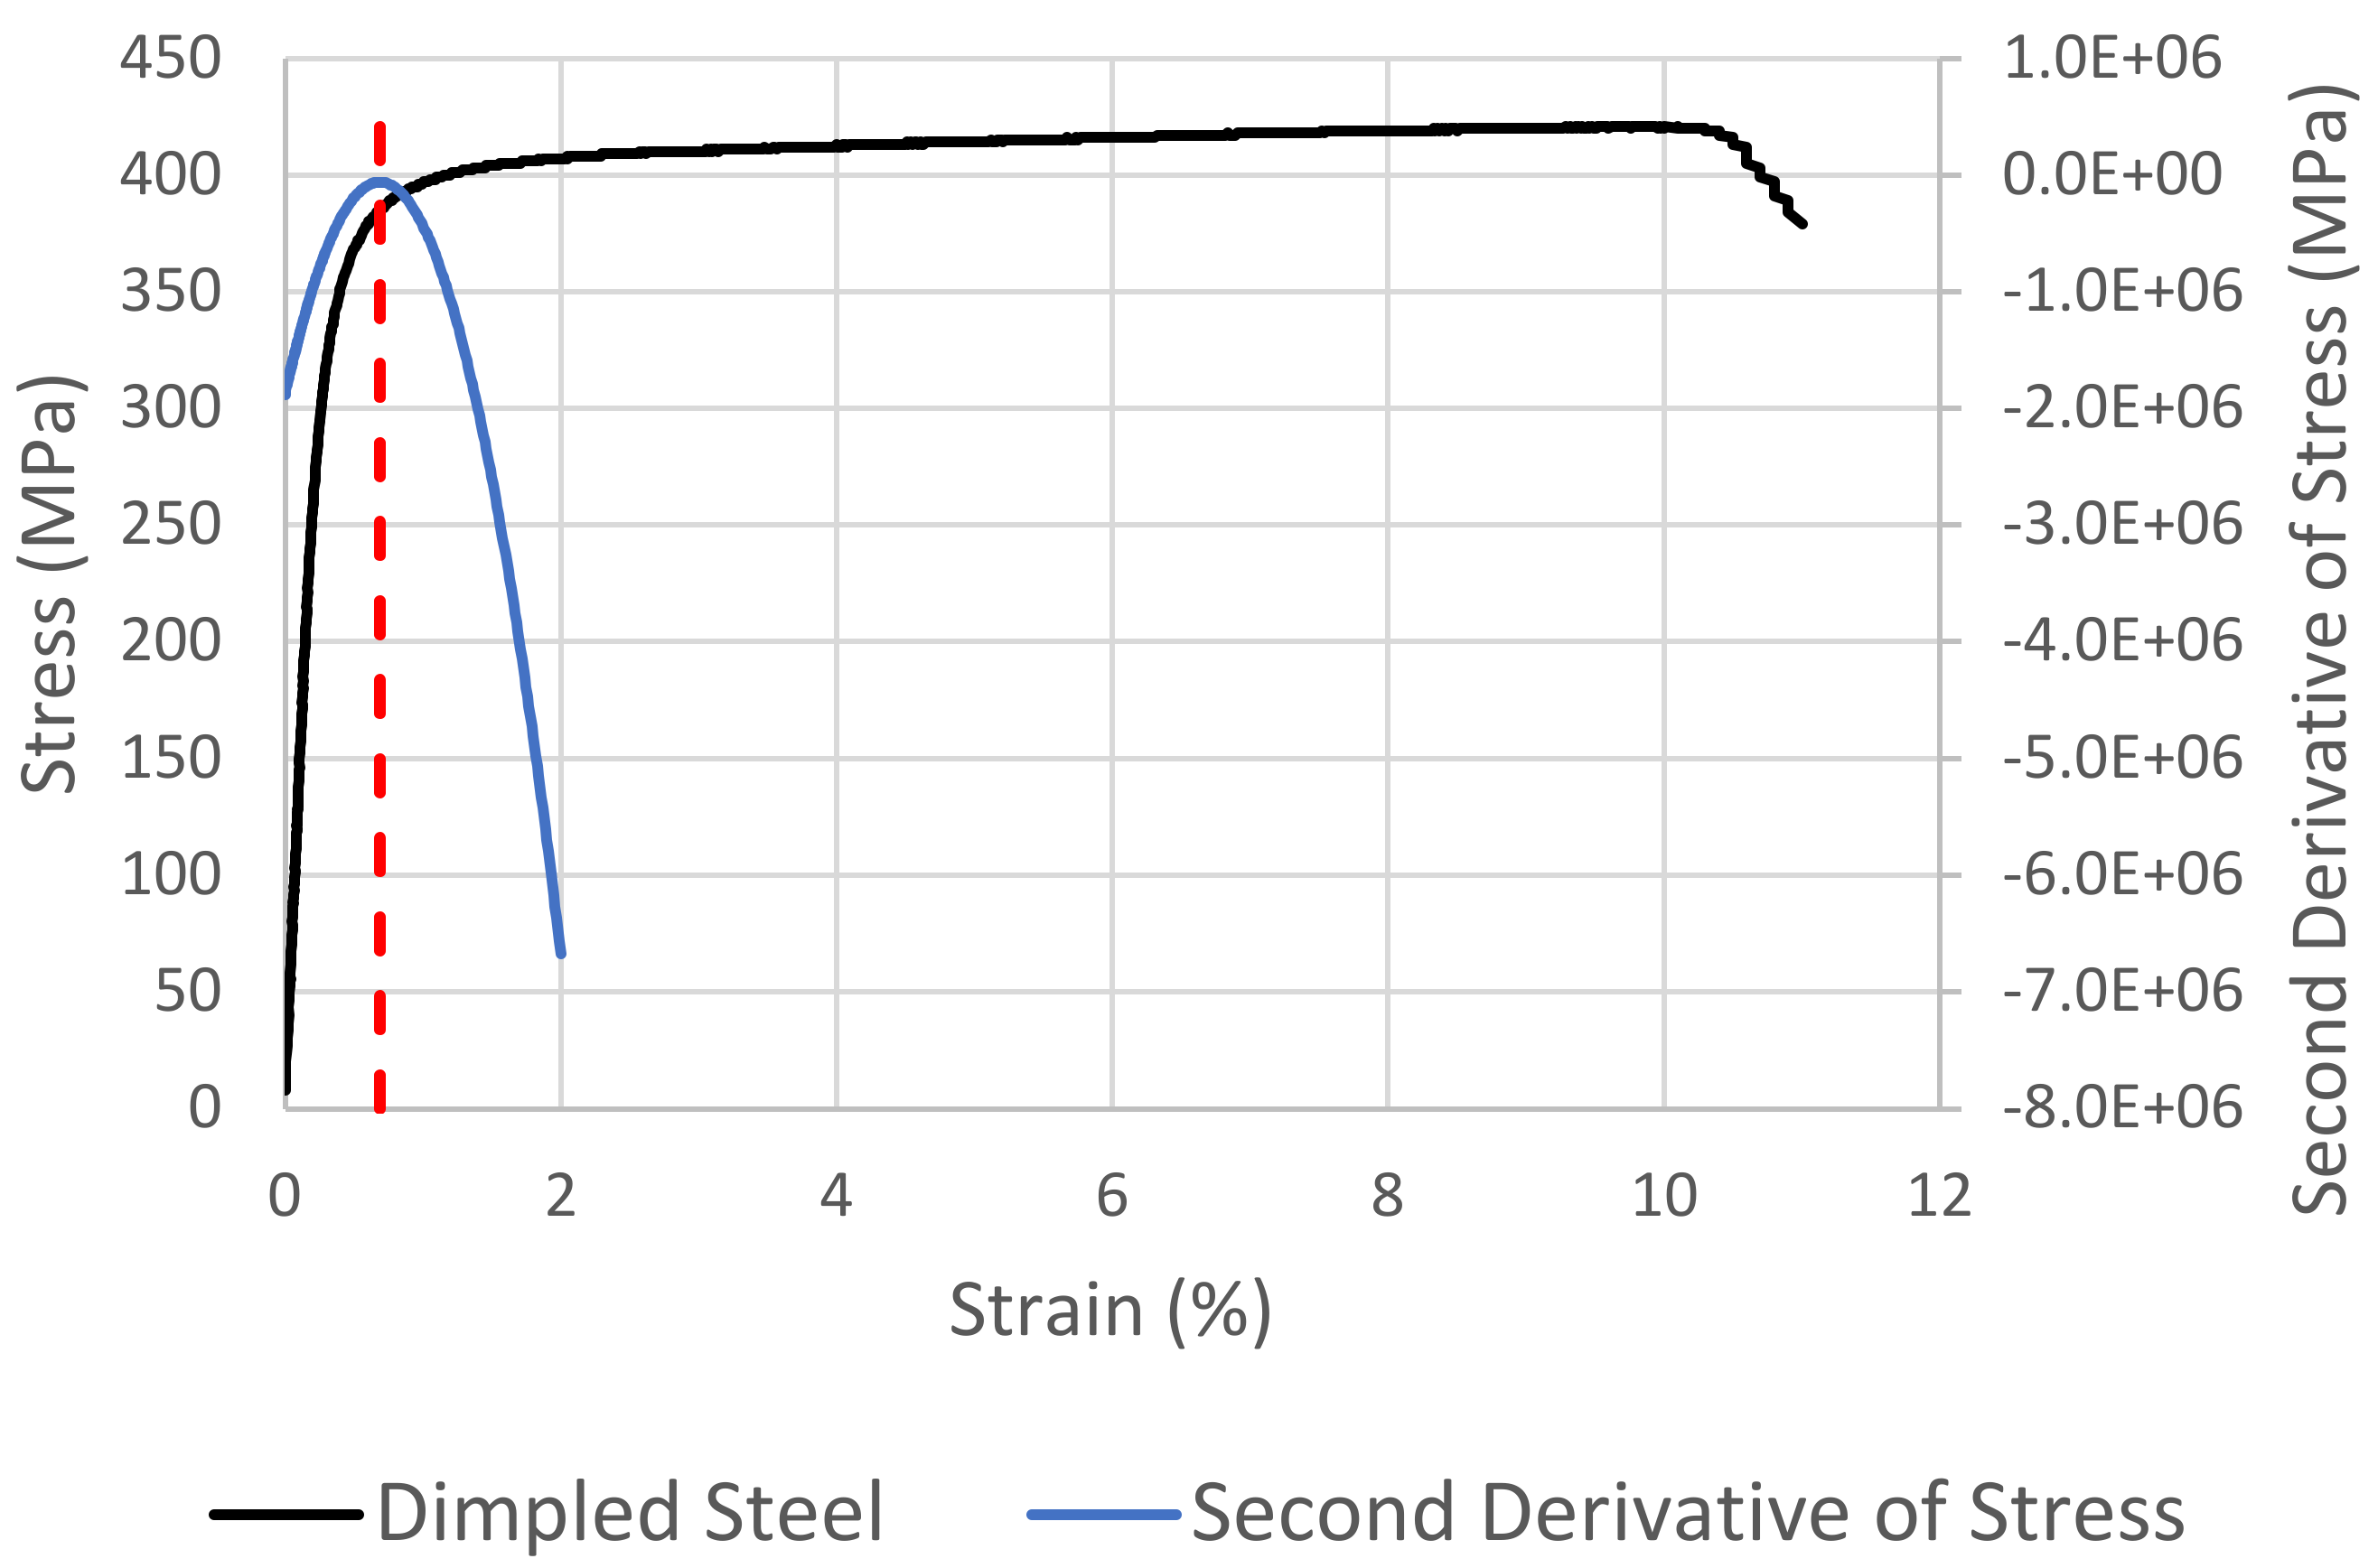
Figure 9 and
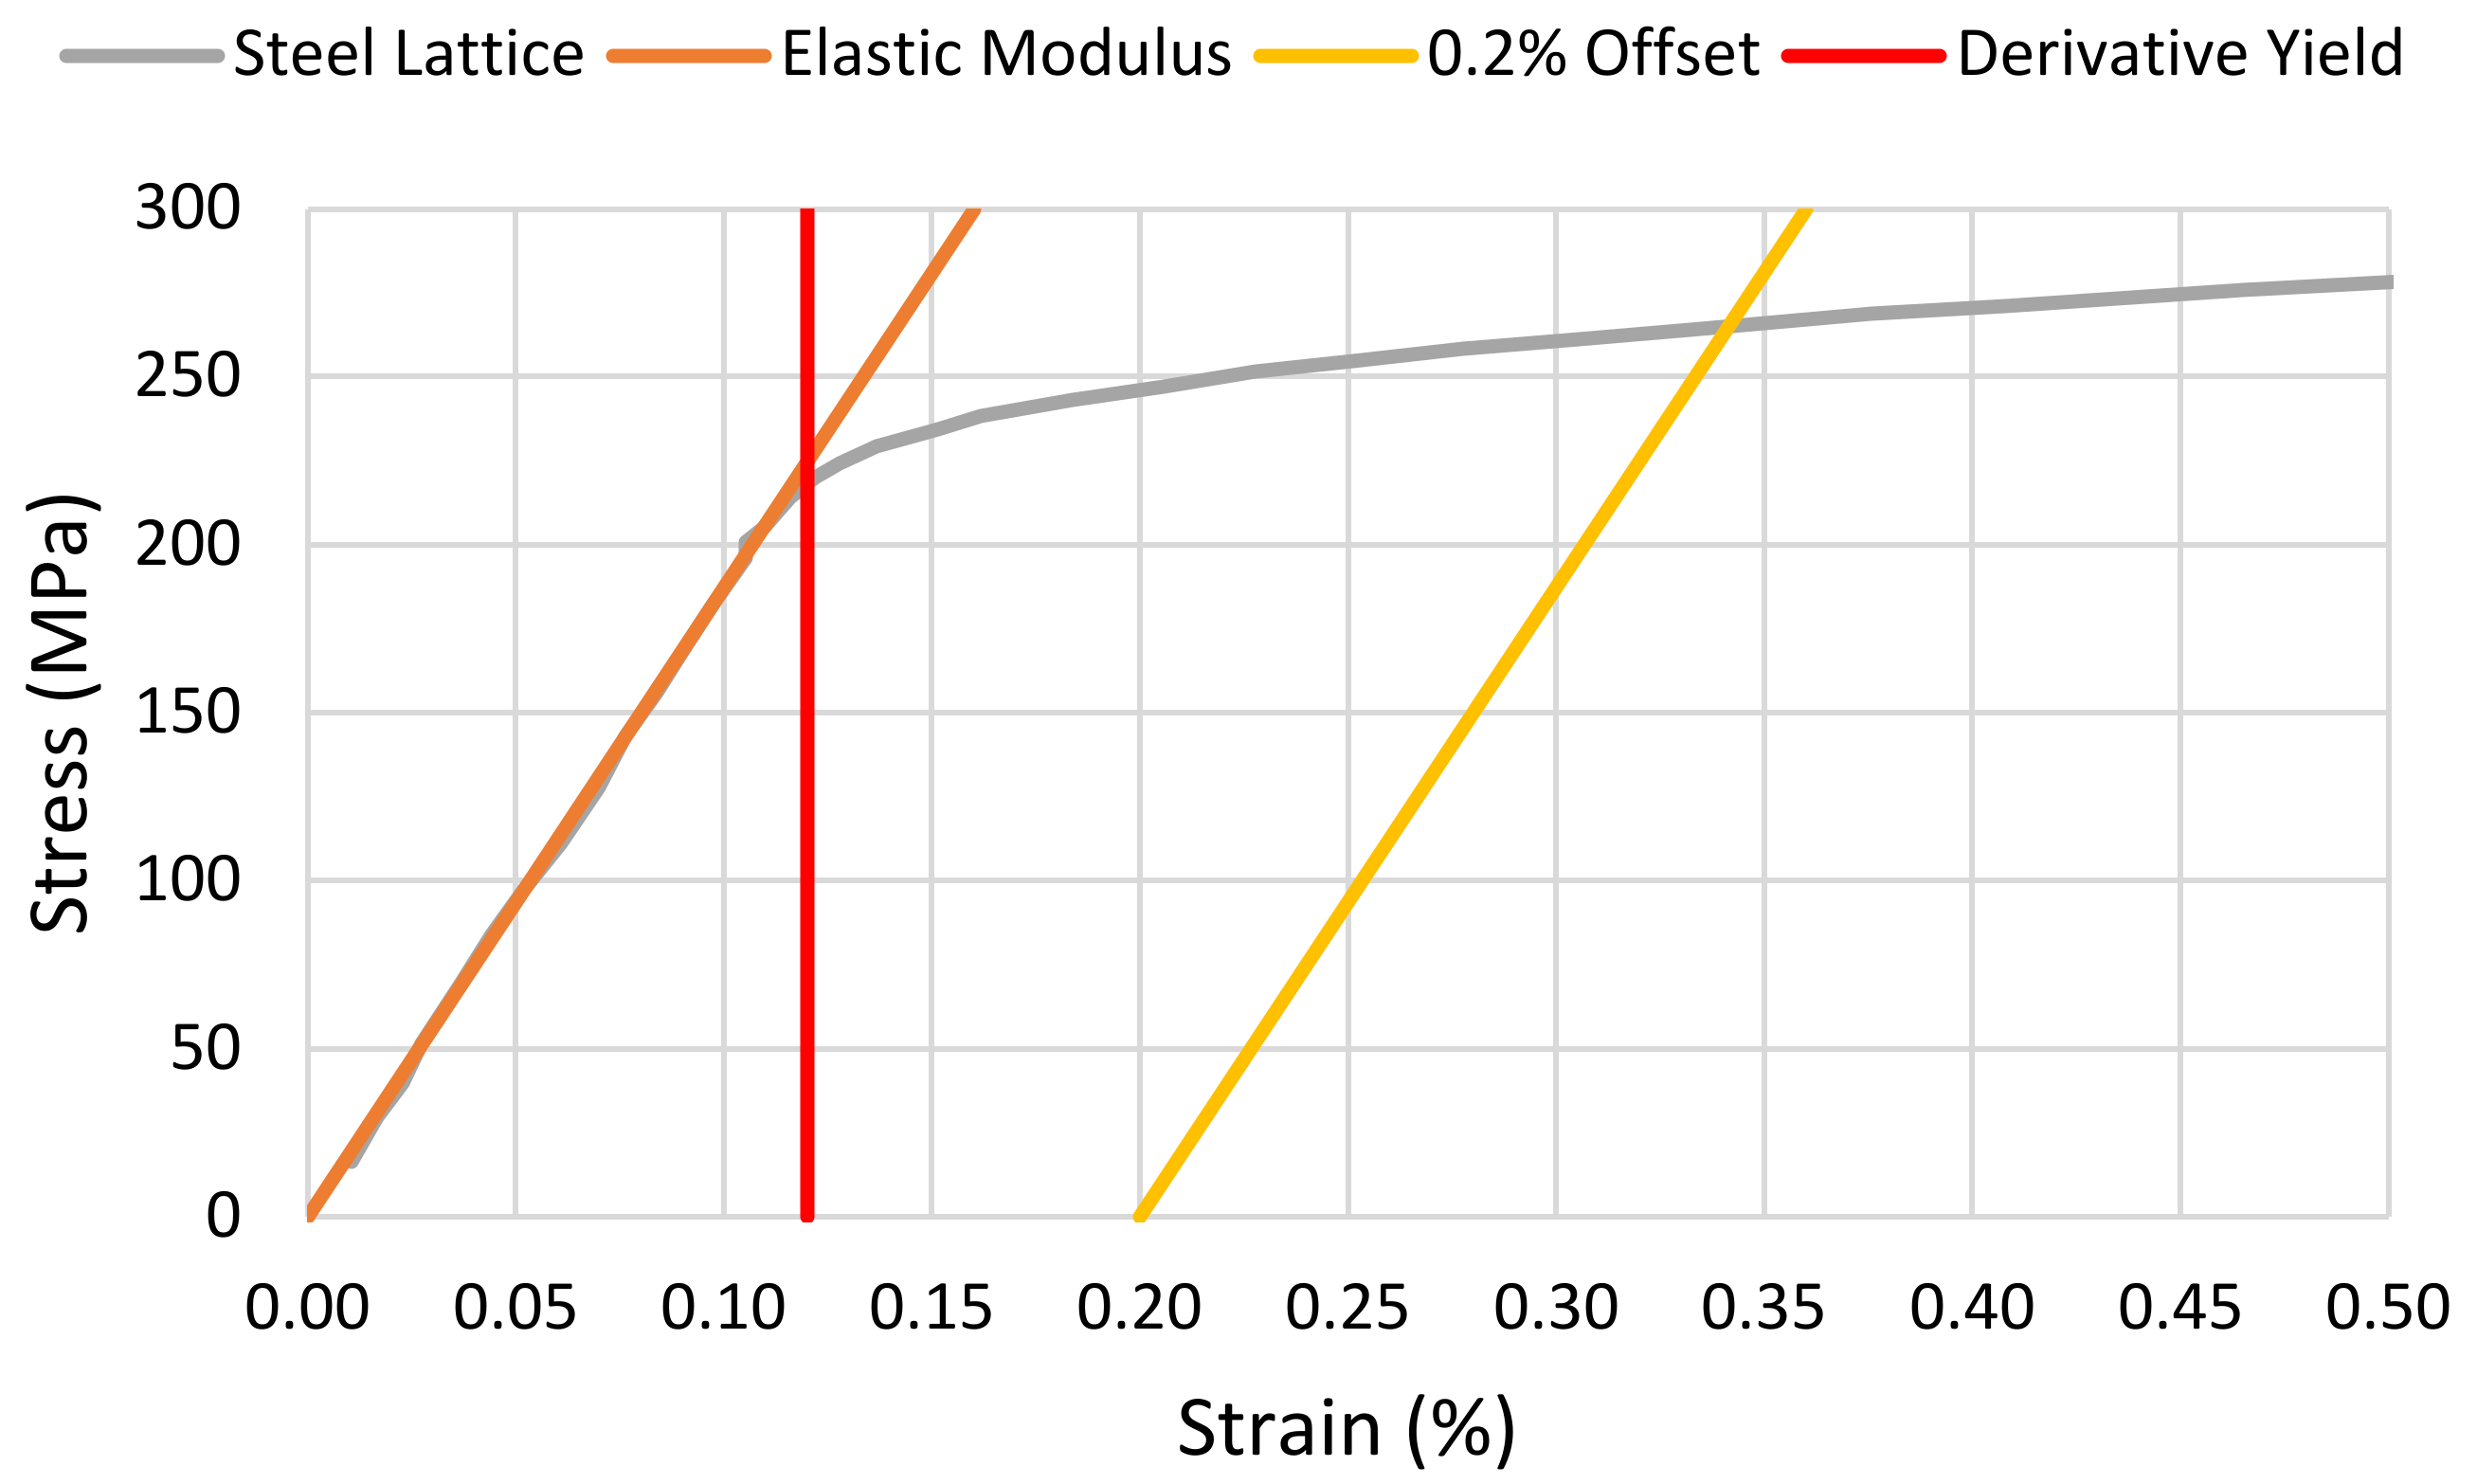
Figure 10 make evident the clear turning point present in the second derivative of stress with respect to strain. These turning points are used, as indicated by the red dashed lines in these figures, to determine the strain at yield which can then be used with respect to the original stress–strain curve to determine the yield strength of the relevant sample. We note the use of the turning point relating to the most pronounced peak as opposed to the first peak. This is to ensure the identification of the point of most pronounced yielding independent from microscopic yielding and small experimental errors. The results of this are illustrated in comparison with the σ
Y,0.2 in
Figure 11 and
Figure 12.
Due to the geometry of both the dimpled samples and the clamps on the testing rig, a small amount of additional displacement is seen in early loading for some samples as the clamps bite into the sample. In some cases, this necessitates ignoring the low-stress data when determining the Elastic Modulus to produce an accurate representation of the material behaviour. The 0.2% offset is a direct offset from the initial fit and so does not start at 0 MPa because the line representing the Elastic Modulus does not.
Figure 11 is external data, and the trend shows a clear intersection with 0.0. Therefore, the trend line was extended to 0.0 for illustrative purposes.
The severely continuous yielding exhibited by the dimpled steel is illustrated in
Figure 5. This time using a polynomial fit and differentiation methodology to identify the turning point, the application of the σ
ΔY is illustrated in
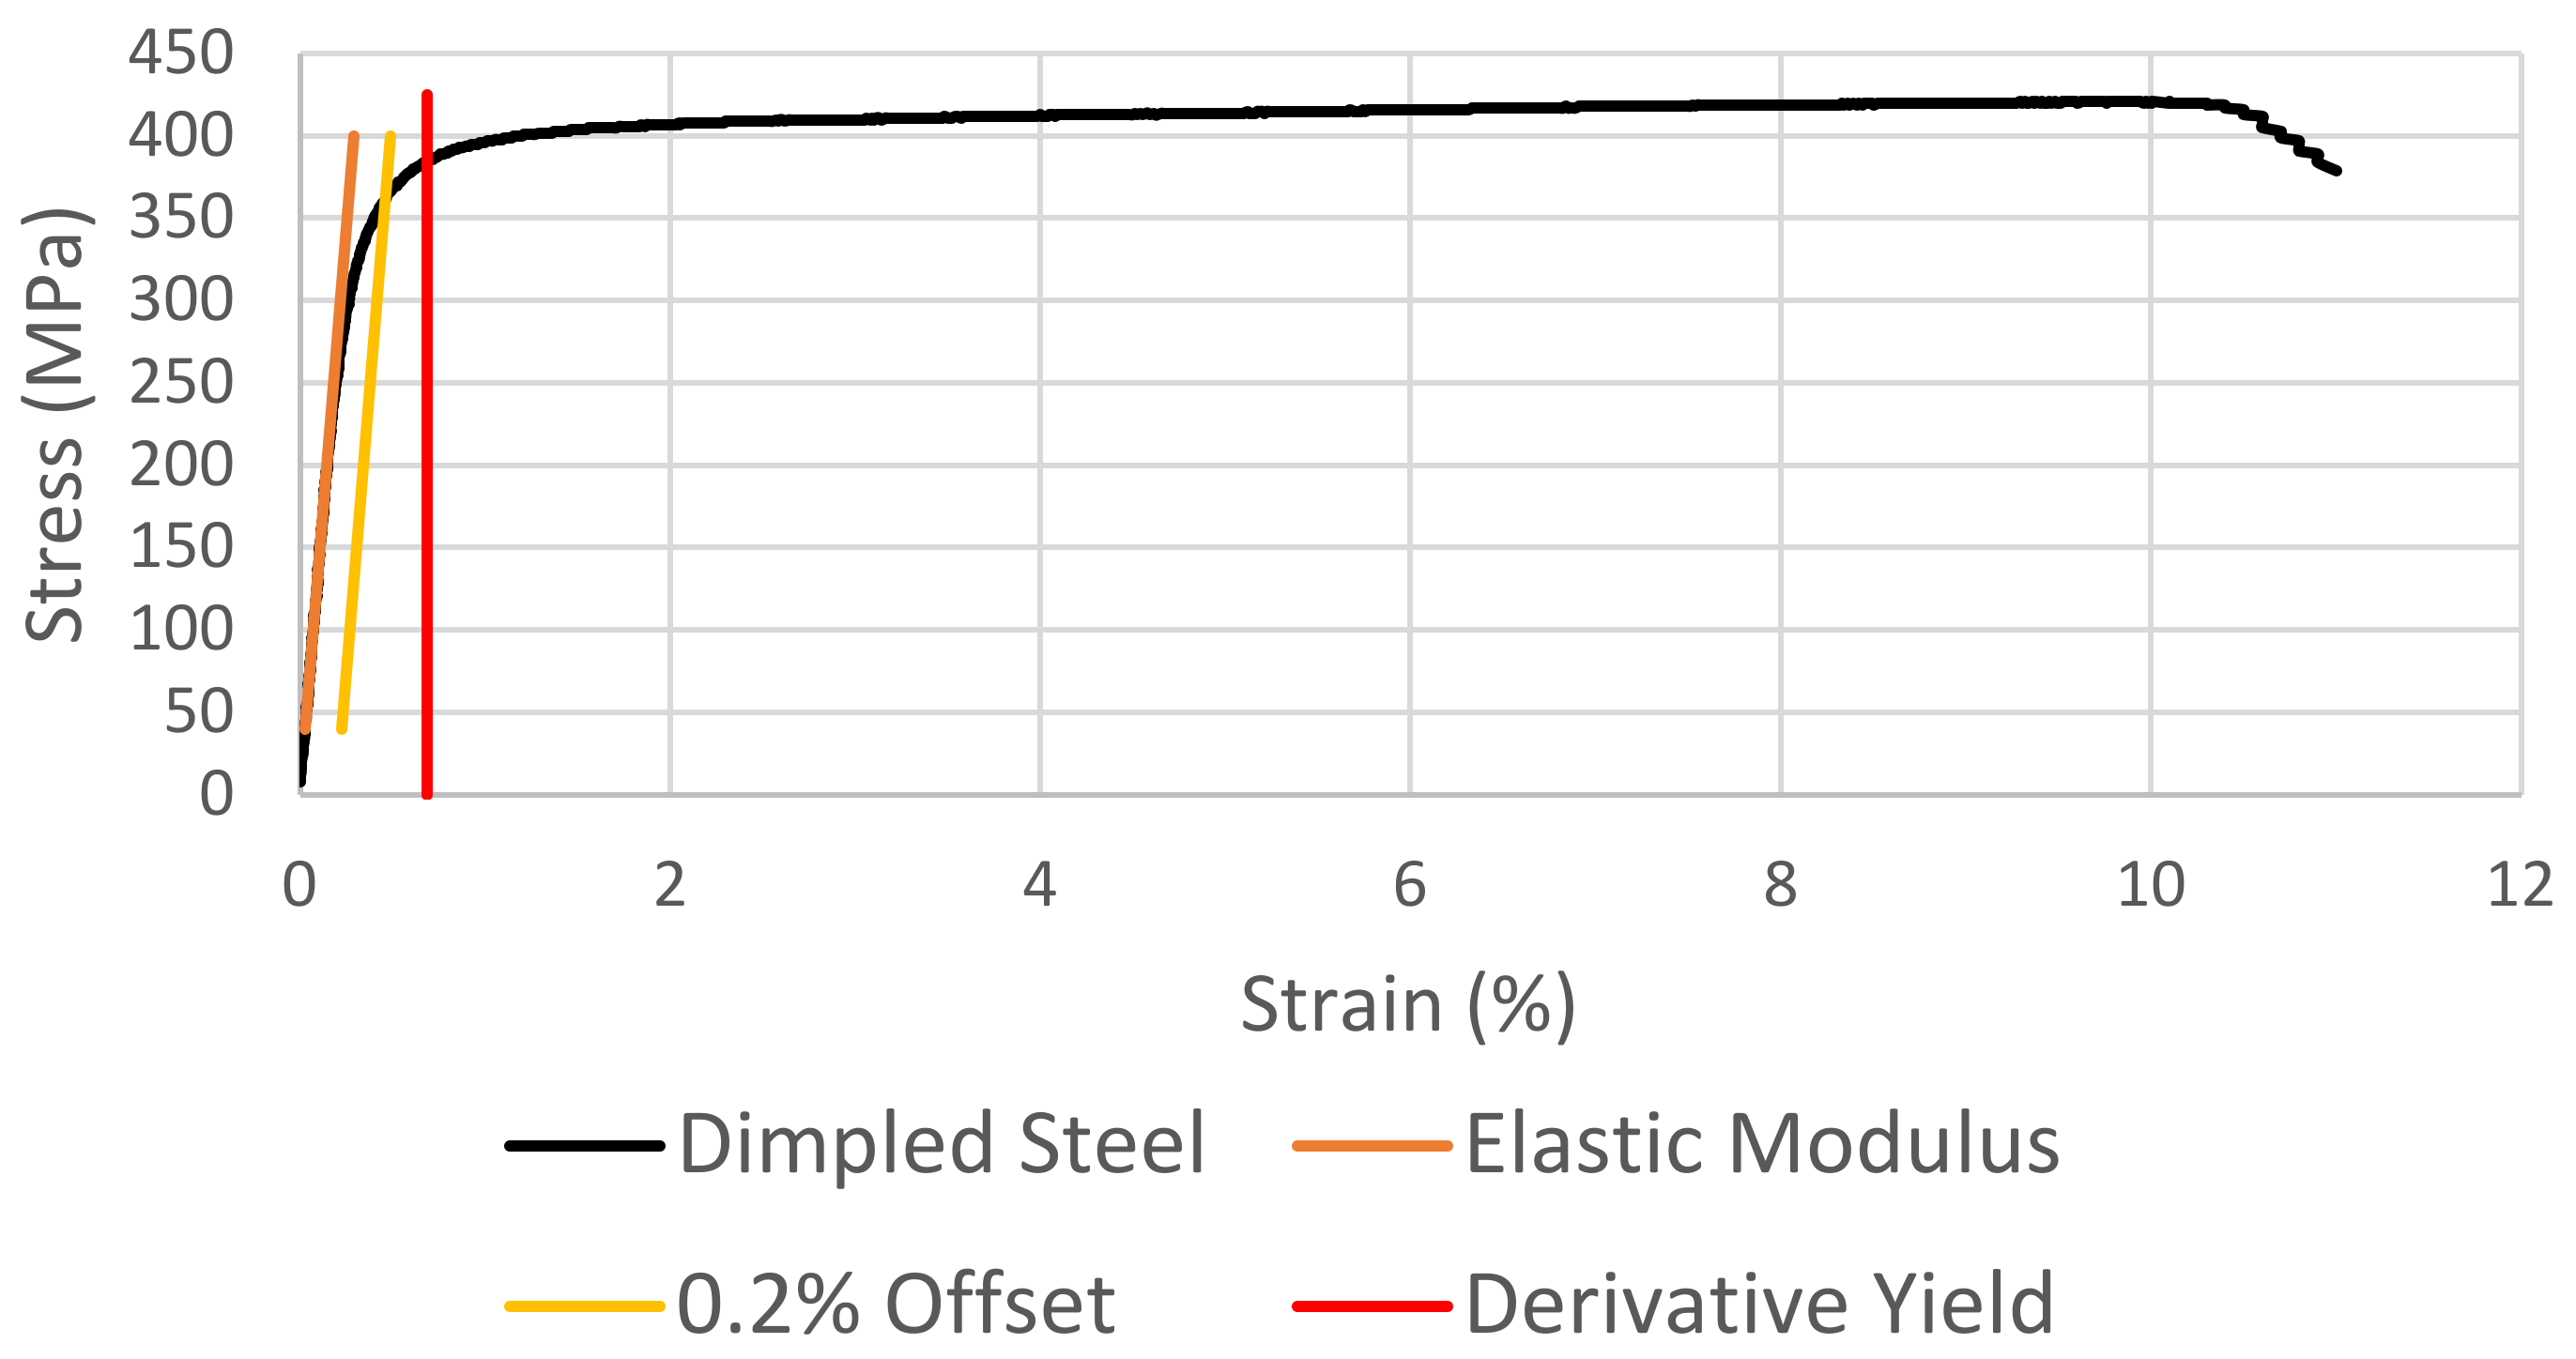
Figure 13. The result is further illustrated in comparison with the standard σ
Y,0.2 in
Figure 14 where, unlike with the cases of continuous yielding, it is evident that
.
4. Discussion
In the case of discontinuous yield (
Figure 8) it is clear that the novel derivative yield is in good agreement with both the as-defined yield point and the standard upper yield.
However, for continuous yield (
Figure 9,
Figure 10,
Figure 11 and
Figure 12), this is not the case. Based on the turning points in the second derivative of stress with respect to strain (
Figure 9 and
Figure 11), the σ
ΔY method clearly and non-arbitrarily identifies the first substantial departure from linearity. More closely matching the as-defined yield, this derivative yield point is evidently more representative of the behaviour of the tested material than the standard offset approximation.
We must consider, then, the severely continuous yielding exhibited by the dimpled steel. As has been discussed, the formulations of the standard methods for the identification of yield strength are not strictly applicable due to the lack of a substantial region of linearity in the stress–strain curve as well as the difference between the microscopic and macroscopic yield behaviours inherent to this type of structure. Firstly, the offset method is inapplicable due to the pre-macroscopic yield departure from linearity in yielding of this nature. However, since this is defined as the default method for the determination of yield strength, it is used here as an indicator of the potential applicability of the alternative standard, σ
EUL. The average strain at yield as determined by the 0.2% offset method for the present dimpled steel data is 0.4% with a variation of 0.13%. Such a large variation in this measure indicates that the σ
EUL may also be inappropriate for the quantification of the yield strength in materials exhibiting severely continuous yield, except in applications where the allowable strain under a given load is more pertinent than the yield strength. Applying the σ
ΔY as shown in
Figure 13 clearly and non-arbitrarily identifies the point of most pronounced yielding in the dimpled steel. Illustrated in comparison with the σ
Y,0.2 in
Figure 14, it is clear that the σ
ΔY method again produces a more representative characterisation of the behaviour of dimpled steel than the standard offset method.
It should be noted that the compliance of the elastic moduli of the materials used in the tests were not checked against their standard values since the material grade used, DX51D+Z/ZF, is a particularly variable grade of mild steel. The specifications provide only a minimum yield strength and, anecdotally, this is usually exceeded by a large margin.
5. Conclusions
Limitations due to the formulation of the standard methods for the identification of yield strength make these methods inapplicable to cases exhibiting severely continuous yield. Additionally, the standardised acceptance of multiple, often conflicting, methods results in the necessary comparison of mutually incompatible yield strengths, such as is the case in the production of dimpled steel. In cases such as these, the plain steel exhibits discontinuous yield while the dimpled steel does not. This results in the sometimes misleading comparison between upper yield and offset yield.
Addressing the resulting need for an industrially relevant method for the quantification of yield strength that is independent of the yield behaviour exhibited, the novel derivative yield has been proposed. Based on the second derivative of stress with respect to strain, this method has been explored alongside the standards for cases exhibiting discontinuous, continuous, and severely continuous yield. Examples include plain steel, dimpled steel, steel lattice, and porous Ti6Al4V.
It has been shown that due to the departure from linearity prior to macroscopic yield in the case of dimpled steel (severely continuous yield), the standard offset method does not produce results representative of the material behaviour: the yield strength is underestimated. By taking the second derivative of stress with respect to strain, identifying the strain at the most pronounced turning point, and using this to determine the associated stress, the yield strength of the dimpled steel has been quantified in a non-arbitrary way. This has been shown to be more representative of the material behaviour.
In the case of discontinuous yield (plain steel), the derivative yield has been shown to be in good agreement with the standard upper yield. Similarly, for continuous yield (lattice and porous examples), it has been illustrated that the derivative yield identifies the first significant departure from linearity in the stress–strain curve, characterising the yield behaviour of these materials more accurately than the standard offset approximation. In this way, the novel derivative yield method has been shown to be applicable irrespective of the type of yield and, indeed, of the presence or lack of macroscopic structures such as dimples, in many cases eliminating the need to compare incompatible yield strengths.
Author Contributions
Conceptualization, C.W., M.E. and D.M.; methodology, D.S. and C.W.; validation, D.S.; formal analysis, D.S.; investigation, D.S.; writing—original draft preparation, D.S.; writing—review and editing, C.W.; visualization, D.S.; supervision, C.W. and D.S.; and funding acquisition, C.W. All authors have read and agreed to the published version of the manuscript.
Funding
This research was funded by the EPSRC, EP/R513362/1, and the Hadley Industries plc.
Data Availability Statement
The data that support the findings of this study are available on request from the corresponding author, C.W.
Conflicts of Interest
The authors declare no conflict of interest.
References
- International Organization for Standardization. ISO n.d. Available online: http://www.iso.org/cms/render/live/en/sites/isoorg/home.html (accessed on 8 October 2019).
- European Committee for Standardization. n.d. Available online: https://www.cen.eu/Pages/default.aspx (accessed on 8 October 2019).
- British Standards Institution. BSI Group n.d. Available online: https://www.bsigroup.com/en-GB/ (accessed on 8 October 2019).
- ASTM International—Standards Worldwide. n.d. Available online: https://www.astm.org/ (accessed on 8 October 2019).
- Standards Australia—Standard Organisation in Australia. Stand Aust n.d. Available online: http://www.standards.org.au/ (accessed on 8 October 2019).
- Dieter, G.E. Introduction. In Mechanical Metallurgy, SI Metric ed.; McGraw-Hill: New York, NY, USA, 1988; pp. 3–16. [Google Scholar]
- Johnson, W. Plasticity theory and some quasi-static analyses. Impact Strength Mater. 1972, 121–211. [Google Scholar]
- Mac Donald, B.J. Practical Stress Analysis with Finite Elements, 2nd ed.; Glasnevin Publishing: Dublic, Ireland, 2011; pp. 17–46. [Google Scholar]
- Dieter, G.E. Strengthening Mechanisms. In Mechanical Metallurgy, SI Metric ed.; McGraw-Hill: New York, NY, USA, 1988; pp. 184–240. [Google Scholar]
- E8/E8M-16a; Standard Test Methods for Tension Testing of Metallic Materials. ASTM: West Conshohocken, PA, USA, 2016. [CrossRef]
- Rosenberg, H.M. Dislocations in crystals. In Solid State, 3rd ed.; Oxford University Press: New York, NY, USA, 1988; pp. 53–77. [Google Scholar]
- BS EN 10002-1:2001; Metallic Materials—Tensile Testing—Part 1. British Standards Institution (BSI): London, UK, 2001.
- Clausen, B.; Lorentzen, T.; Bourke, M.A.M.; Daymond, M.R. Lattice strain evolution during uniaxial tensile loading of stainless steel. Mater. Sci. Eng. A 1999, 259, 17–24. [Google Scholar] [CrossRef]
- Sevostianov, I.; Kachanov, M. On the yield condition for anisotropic porous materials. Mater. Sci. Eng. A 2001, 313, 1–15. [Google Scholar] [CrossRef]
- Dieter, G.E. Elements of the Theory of Plasticity. In Mechanical Metallurgy, SI Metric ed.; McGraw-Hill: New York, NY, USA, 1988; pp. 69–99. [Google Scholar]
- Dieter, G.E. Mechanical Metallurgy, SI Metric ed.; McGraw-Hill: New York, NY, USA, 1988. [Google Scholar]
- Pagano, N.J. Distortional Energy of Composite Materials. J. Compos. Mater. 1975, 9, 67–72. [Google Scholar] [CrossRef]
- Gopu, V.K.A. Validity of Distortion-Energy-Based Strength Criterion for Timber Members. J. Struct. Eng. 1987, 113, 2475–2487. [Google Scholar] [CrossRef]
- Donovan, P.E. A yield criterion for Pd40Ni40P20 metallic glass. Acta Metall. 1989, 37, 445–456. [Google Scholar] [CrossRef]
- Karafillis, A.P.; Boyce, M.C. A general anisotropic yield criterion using bounds and a transformation weighting tensor. J. Mech Phys. Solids 1993, 41, 1859–1886. [Google Scholar] [CrossRef]
- Banabic, D.; Kuwabara, T.; Balan, T.; Comsa, D.S.; Julean, D. Non-quadratic yield criterion for orthotropic sheet metals under plane-stress conditions. Int. J. Mech. Sci. 2003, 45, 797–811. [Google Scholar] [CrossRef]
- Barlat, F.; Lian, K. Plastic behavior and stretchability of sheet metals. Part I: A yield function for orthotropic sheets under plane stress conditions. Int. J. Plast. 1989, 5, 51–66. [Google Scholar] [CrossRef]
- Kuwabara, T.; Ikeda, S. Kuroda, K. Measurement and analysis of differential work hardening in cold-rolled steel sheet under biaxial tension. J. Mater. Process. Technol. 1998, 80–81, 517–523. [Google Scholar] [CrossRef]
- Kuwabara, T.; Van Bael, A. Measurement and Analysis of Yield Locus of Sheet Aluminium Alloy 6xxx. In Proceedings of the 4th International Conference and Workshop on Numerical Simulation of 3D Sheet Forming Processes, Besançon, France, 13–17 September 1999; pp. 85–90. [Google Scholar]
- Cazacu, O.; Barlat, F. A criterion for description of anisotropy and yield differential effects in pressure-insensitive metals. Int. J. Plast. 2004, 20, 2027–2045. [Google Scholar] [CrossRef]
- Cazacu, O.; Plunkett, B.; Barlat, F. Orthotropic yield criterion for hexagonal closed packed metals. Int. J. Plast. 2006, 22, 1171–1194. [Google Scholar] [CrossRef]
- Plunkett, B.; Cazacu, O.; Barlat, F. Orthotropic yield criteria for description of the anisotropy in tension and compression of sheet metals. Int. J. Plast. 2008, 24, 847–866. [Google Scholar] [CrossRef]
- Gurson, A.L. Continuum Theory of Ductile Rupture by Void Nucleation and Growth: Part I—Yield Criteria and Flow Rules for Porous Ductile Media; US Energy Research and Development Administration: Washington, DC, USA, 1975.
- Gurson, A.L. Porous Rigid-Plastic Materials Containing Rigid Inclusions—Yield Function, Plastic Potential, and Void Nucleation; US Energy Research and Development Administration: Washington, DC, USA, 1976.
- McElwain, D.L.S.; Roberts, A.P.; Wilkins, A.H. Yield criterion of porous materials subjected to complex stress states. Acta Mater. 2006, 54, 1995–2002. [Google Scholar] [CrossRef]
- Wang, D.-A.; Pan, J.; Liu, S.-D. An Anisotropic Gurson Yield Criterion for Porous Ductile Sheet Metals with Planar Anisotropy. Int. J. Damage Mech. 2004, 13, 7–33. [Google Scholar] [CrossRef]
- Keralavarma, S.M.; Benzerga, A.A. An approximate yield criterion for anisotropic porous media. C. R. Méc. 2008, 336, 685–692. [Google Scholar] [CrossRef]
- Madou, K.; Leblond, J.-B. A Gurson-type criterion for porous ductile solids containing arbitrary ellipsoidal voids—II: Determination of yield criterion parameters. J. Mech. Phys. Solids 2012, 60, 1037–1058. [Google Scholar] [CrossRef]
- Liao, K.-C.; Pan, J.; Tang, S.C. Approximate yield criteria for anisotropic porous ductile sheet metals. Mech Mater. 1997, 26, 213–226. [Google Scholar] [CrossRef]
- Ide, T.; Tane, M.; Ikeda, T.; Hyun, S.K. Nakajima, H. Compressive properties of lotus-type porous stainless steel. J. Mater. Res. 2006, 21, 185–193. [Google Scholar] [CrossRef][Green Version]
- Vigliotti, A.; Pasini, D. Stiffness and strength of tridimensional periodic lattices. Comput. Methods Appl. Mech. Eng. 2012, 229–232, 27–43. [Google Scholar] [CrossRef]
- Khaderi, S.N.; Deshpande, V.S.; Fleck, N.A. The stiffness and strength of the gyroid lattice. Int. J. Solids Struct. 2014, 51, 3866–3877. [Google Scholar] [CrossRef]
- Toribio, J. Relationship between microstructure and strength in eutectoid steels. Mater. Sci. Eng. A. 2004, 387–389, 227–230. [Google Scholar] [CrossRef]
- Máthis, K.; Horváth, K.; Farkas, G.; Choe, H.; Shin, K.; Vinogradov, A. Investigation of the Microstructure Evolution and Deformation Mechanisms of a Mg-Zn-Zr-RE Twin-Roll-Cast Magnesium Sheet by In-Situ Experimental Techniques. Materials 2018, 11, 200. [Google Scholar] [CrossRef] [PubMed]
- Tvergaard, V.; Needleman, A. Analysis of the cup-cone fracture in a round tensile bar. Acta Metall. 1984, 32, 157–169. [Google Scholar] [CrossRef]
- Deshpande, V.S.; Fleck, N.A.; Ashby, M.F. Effective properties of the octet-truss lattice material. J. Mech. Phys. Solids 2001, 23. [Google Scholar] [CrossRef]
- Hualin, F.; Wei, Y. An equivalent continuum method of lattice structures. Acta Mech. Solida Sin. 2006, 19, 103–113. [Google Scholar] [CrossRef]
- Zhang, Y.; Fan, H.; Fang, D. Constitutive relations and failure criterion of planar lattice composites. Compos. Sci. Technol. 2008, 68, 3299–3304. [Google Scholar] [CrossRef]
- Chen, H.; Zheng, Q.; Zhao, L.; Zhang, Y.; Fan, H. Mechanical property of lattice truss material in sandwich panel including strut flexural deformation. Compos. Struct. 2012, 94, 3448–3456. [Google Scholar] [CrossRef]
- Liang, C. Impact Response Analysis of Structures Incorporating Novel Design Features; University of Sussex: Brighton, UK, 2017. [Google Scholar]
- Nguyen, V.B.; English, M. Effects of cold roll dimpling process on mechanical properties of dimpled steel. Procedia Eng. 2017, 207, 1290–1295. [Google Scholar] [CrossRef]
- Wang, Y.; Guan, B.; Mu, L.; Zang, Y. Equivalent Tensile Properties Analysis of the Dimpled Sheet. J. Fail. Anal. Prev. 2018, 18, 791–798. [Google Scholar] [CrossRef]
- BS EN 10346:2015; Continuously Hot-Dip Coated Steel Flat Products for Cold Forming. British Standards Institution (BSI): London, UK, 2015.
| Disclaimer/Publisher’s Note: The statements, opinions and data contained in all publications are solely those of the individual author(s) and contributor(s) and not of MDPI and/or the editor(s). MDPI and/or the editor(s) disclaim responsibility for any injury to people or property resulting from any ideas, methods, instructions or products referred to in the content. |
© 2022 by the authors. Licensee MDPI, Basel, Switzerland. This article is an open access article distributed under the terms and conditions of the Creative Commons Attribution (CC BY) license (https://creativecommons.org/licenses/by/4.0/).

