
Zeolite NaX Mass and Propeller Agitator Speed Impact on Copper Ions Sorption


Abstract
1. Introduction
2. Materials and Methods
2.1. Material and Chemicals
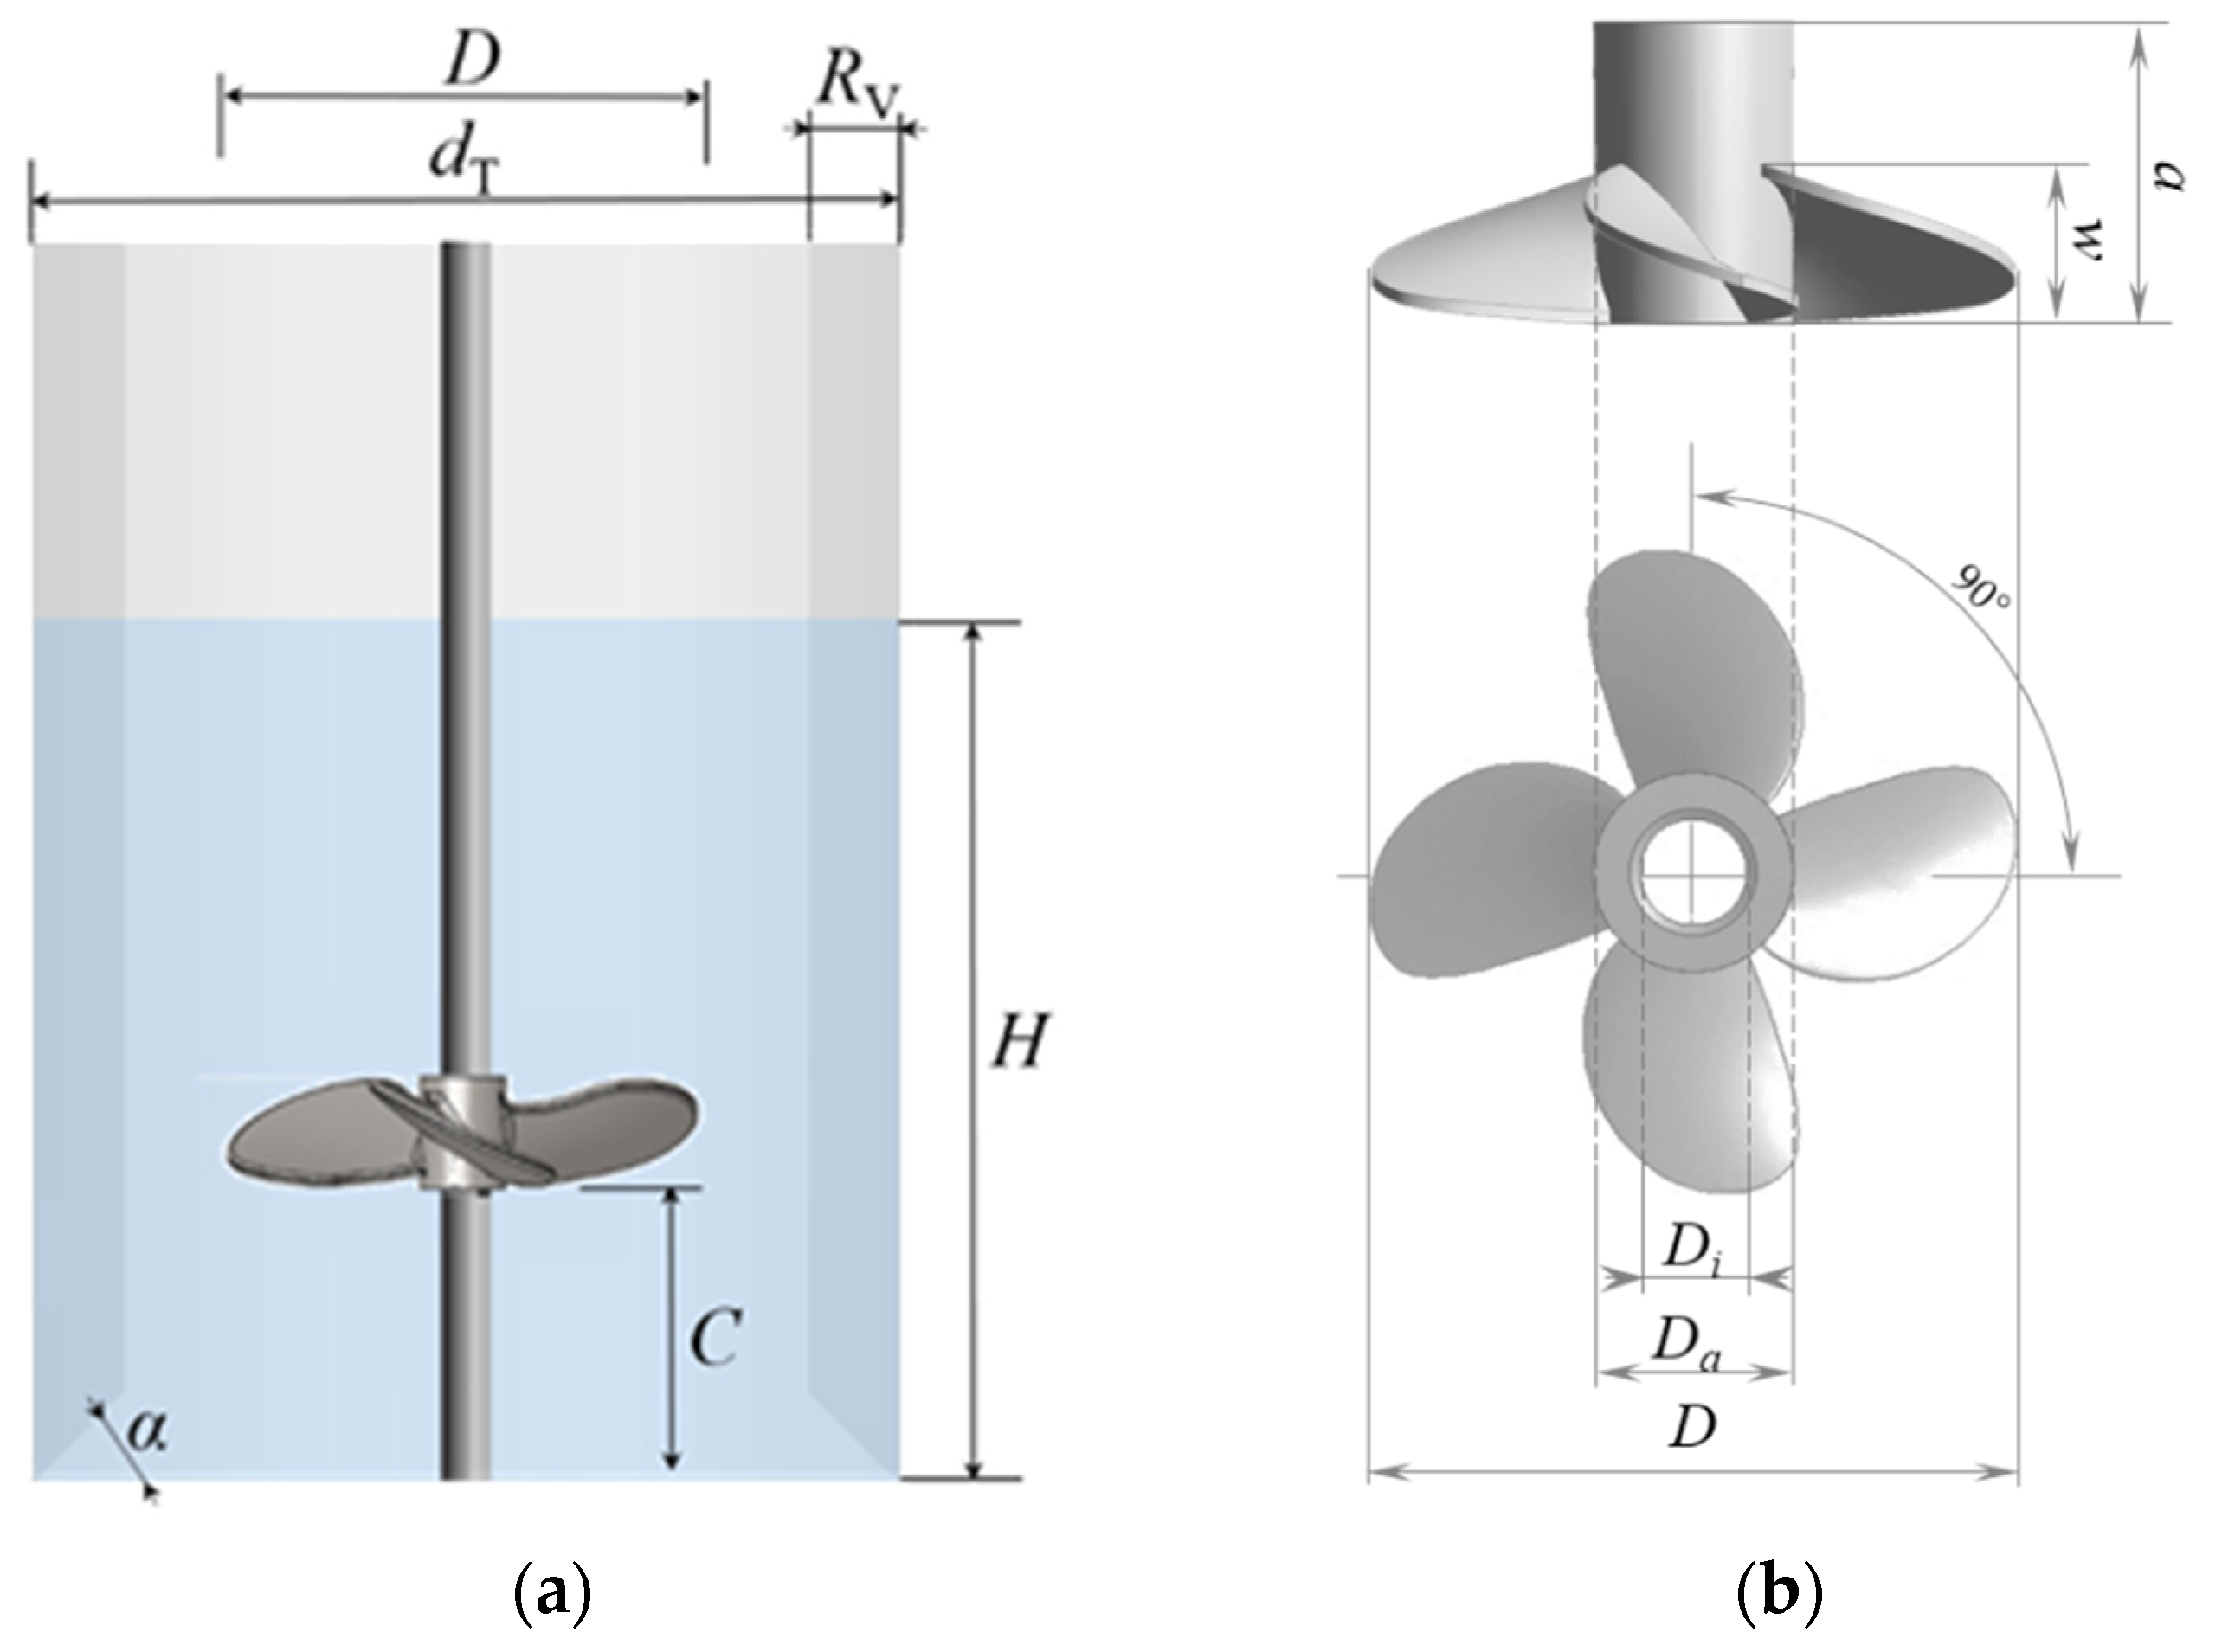
2.2. Batch Reactor
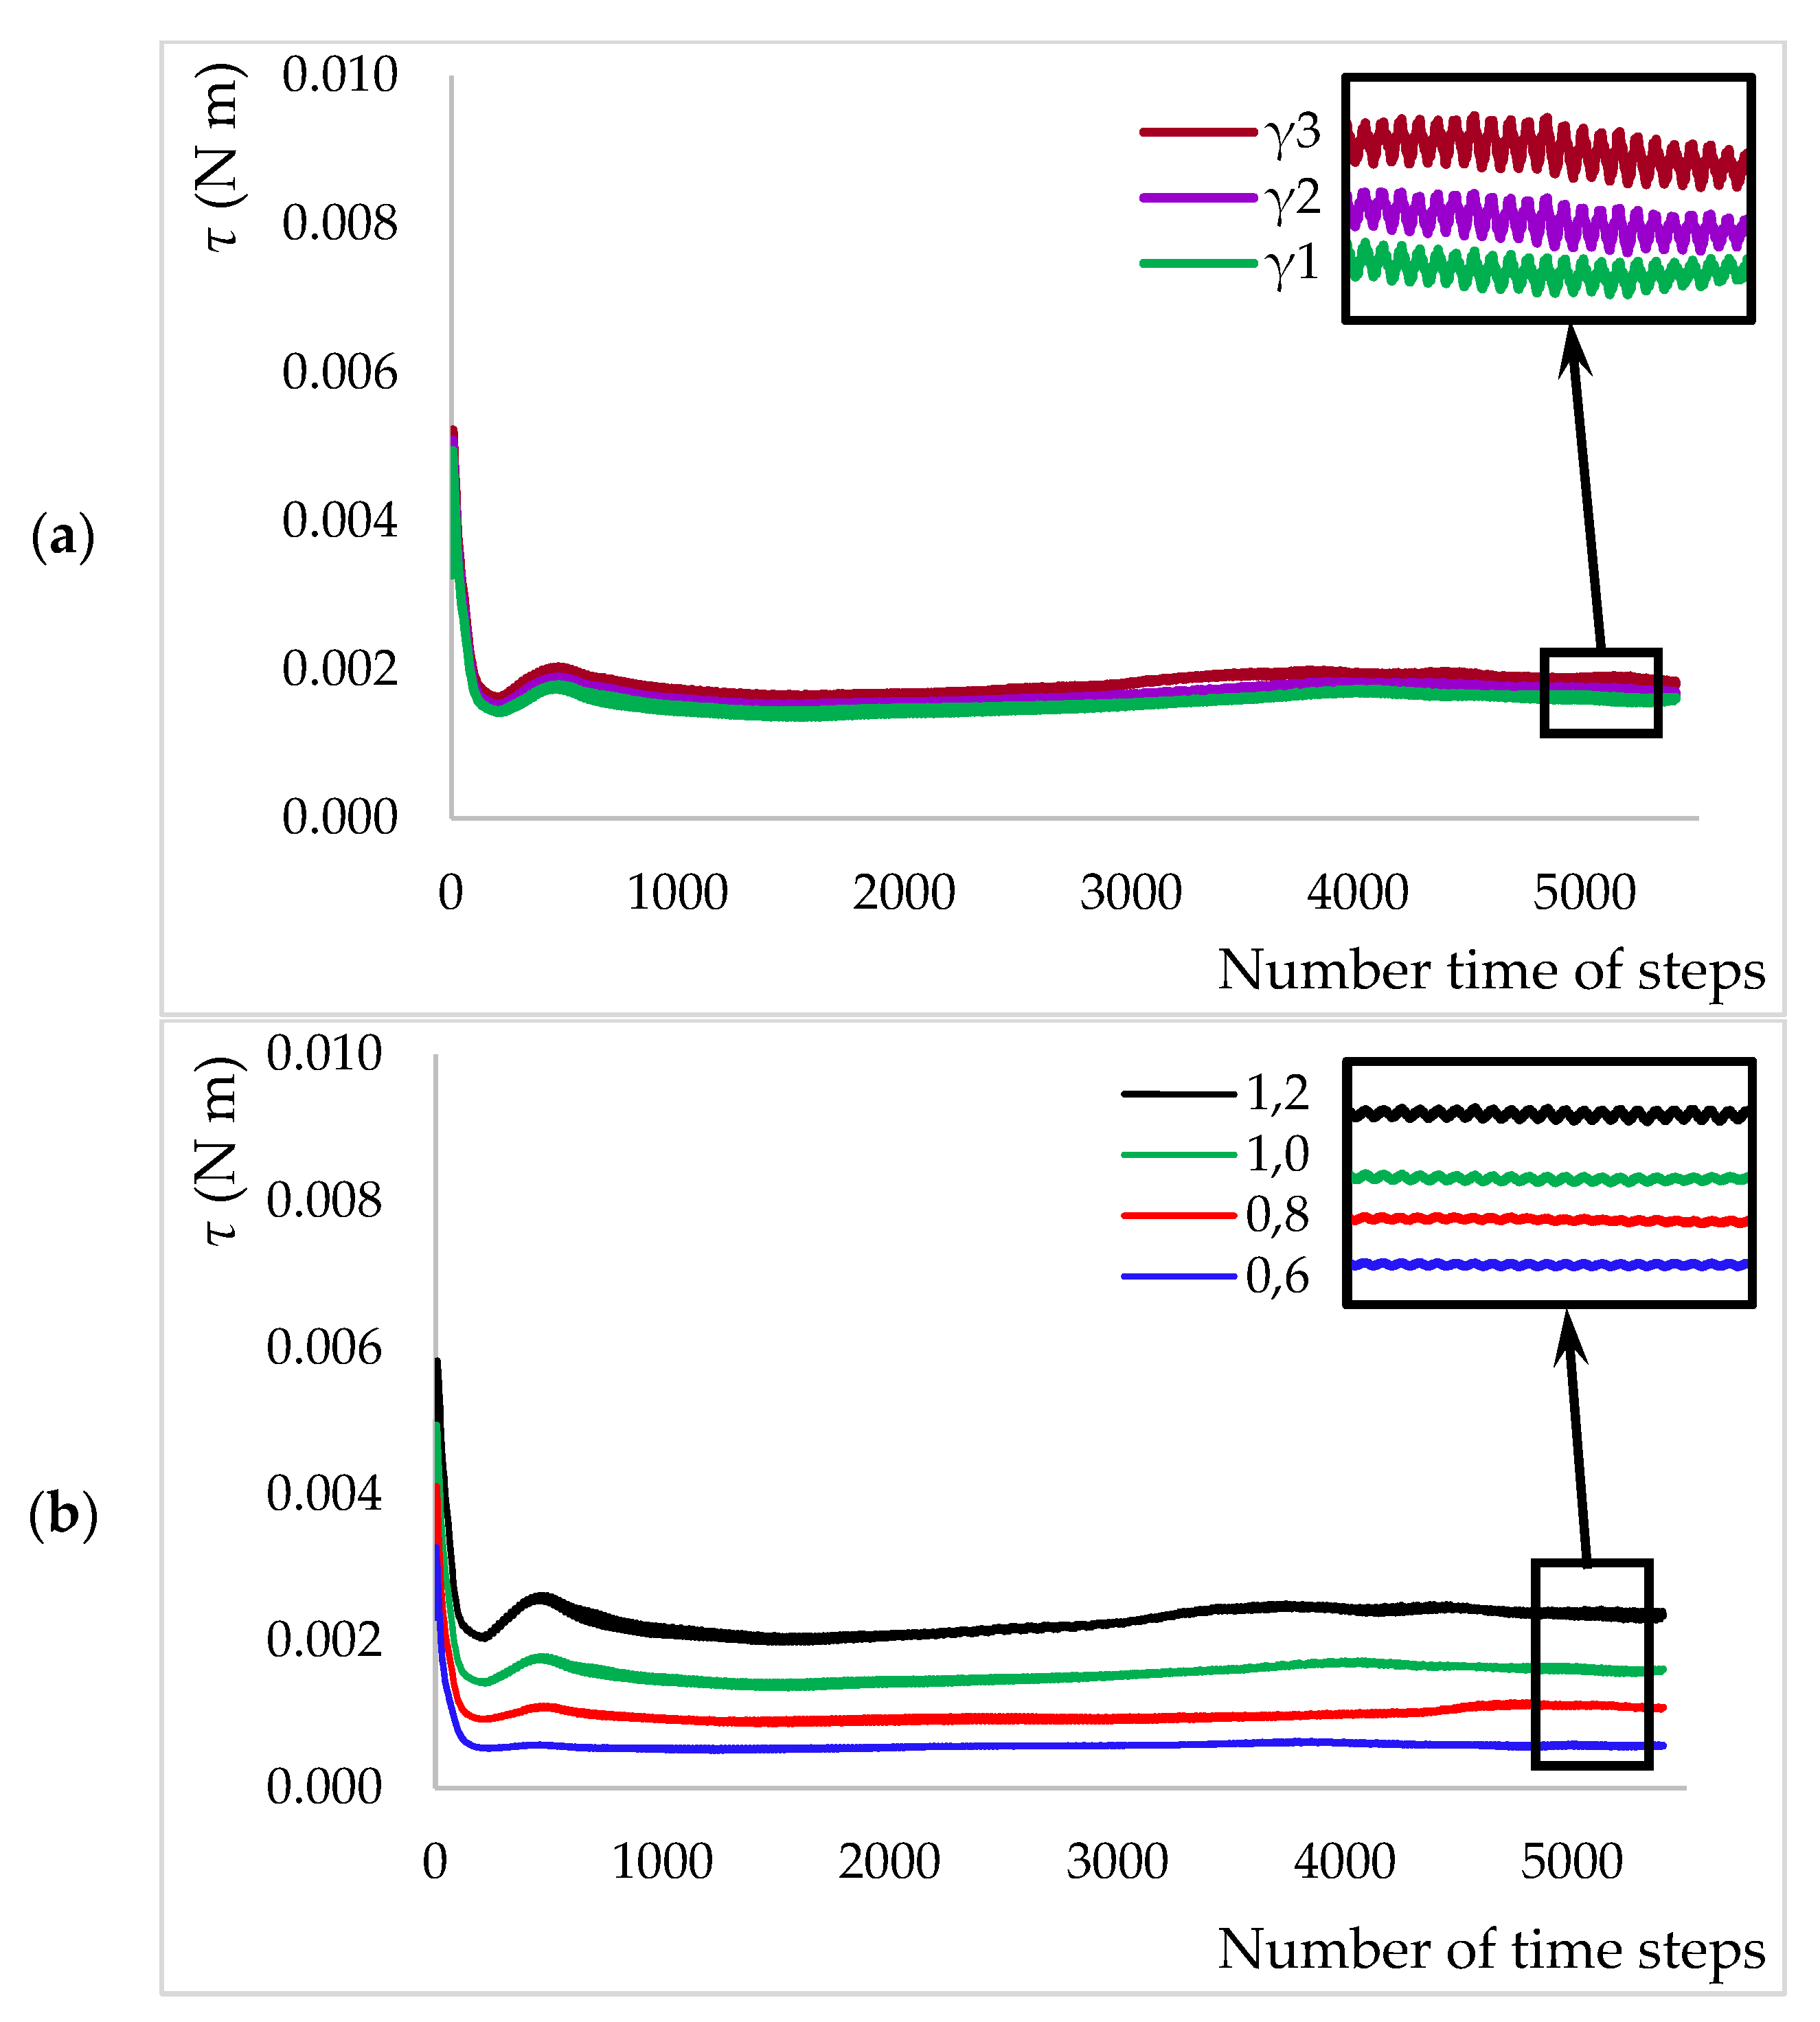
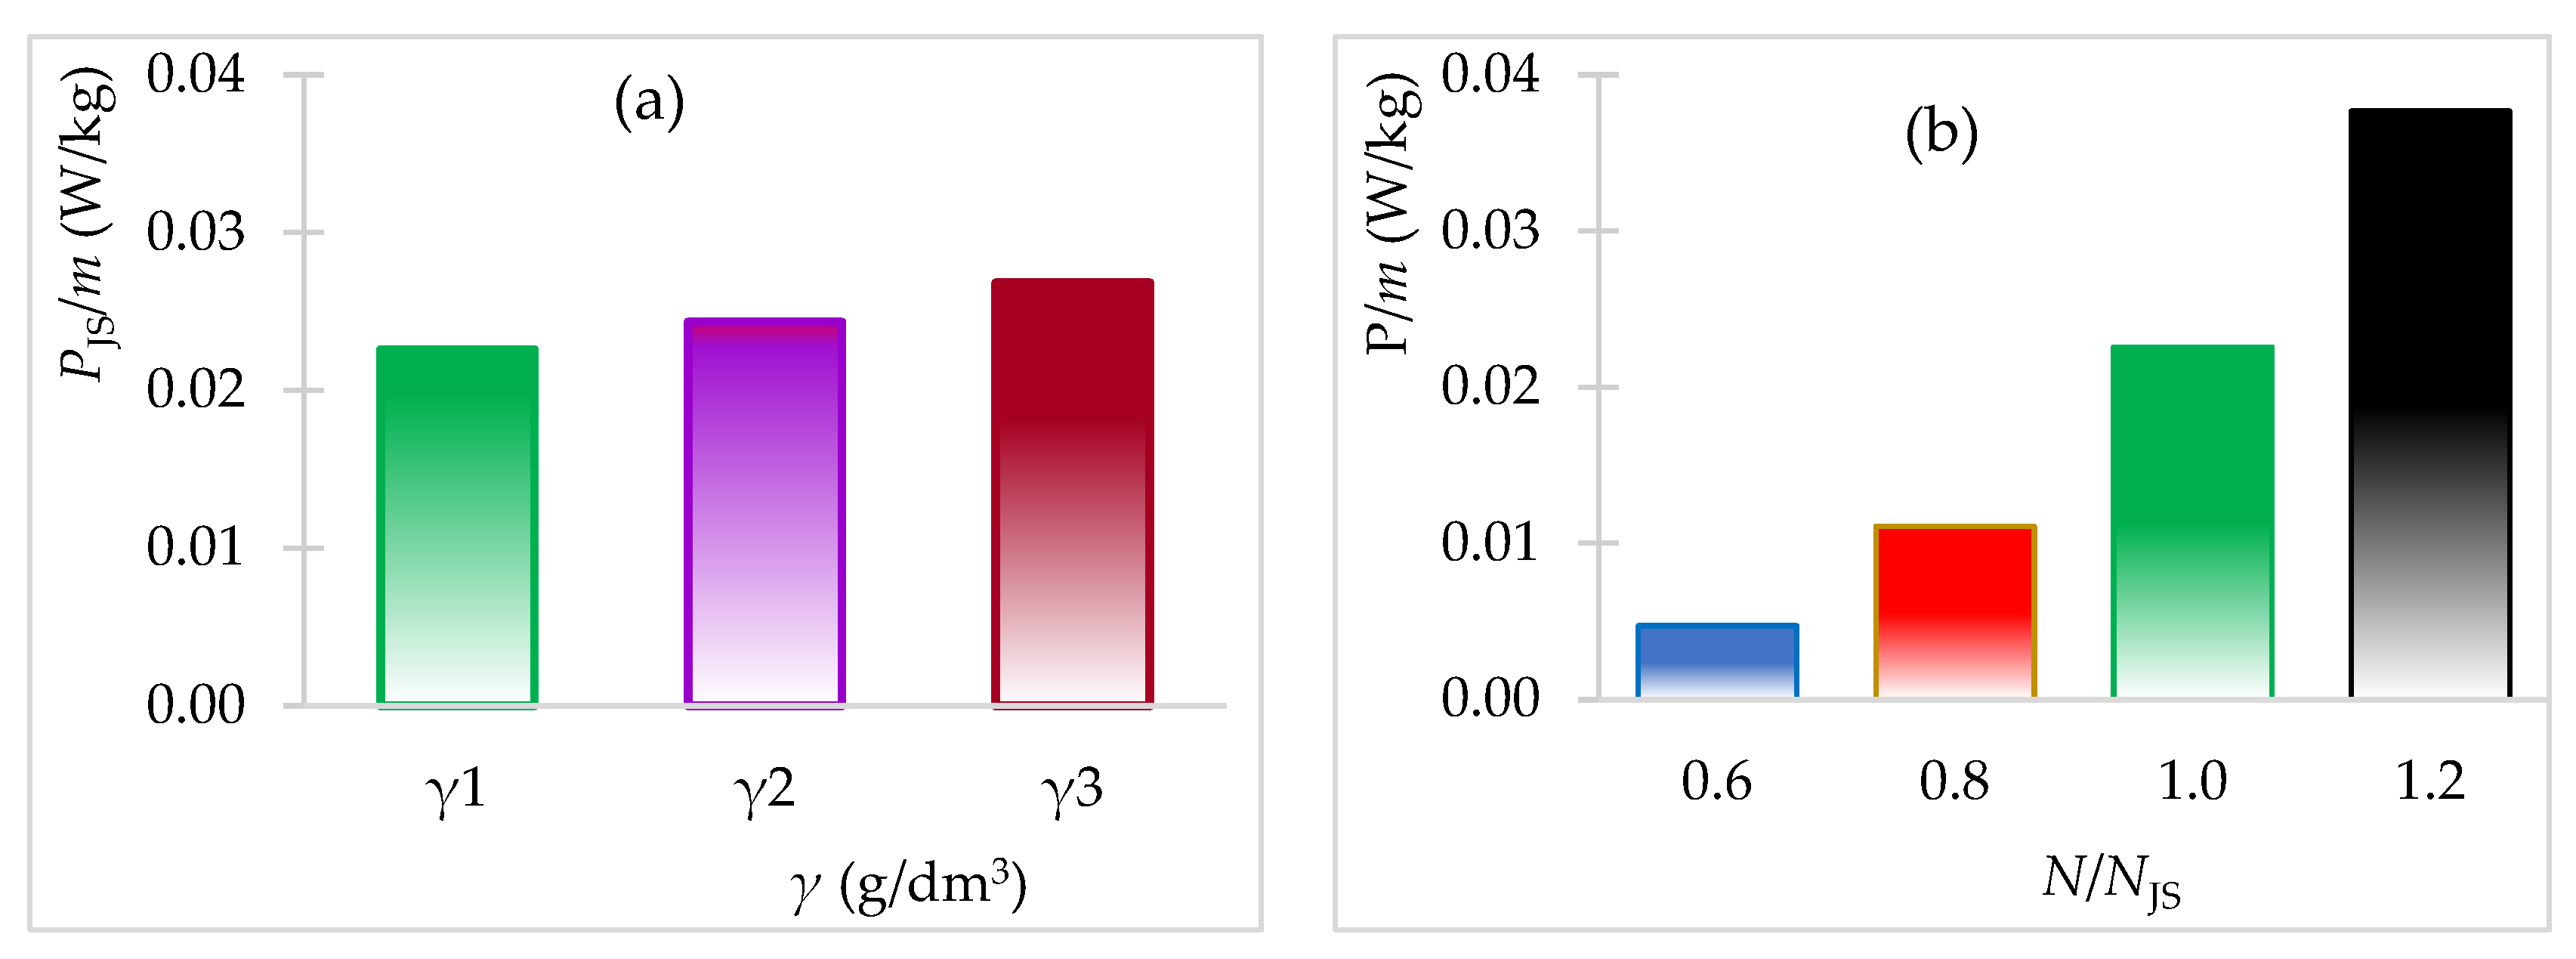
2.3. Computational Fluid Dynamics and Power Consumption
2.4. Kinetic Experiments and Models Used
3. Results and Discussion
4. Conclusions
Author Contributions
Funding
Data Availability Statement
Conflicts of Interest
References
- Mužek, M.N.; Omanović, D.; Đulović, A.; Burčul, F.; Svilović, S.; Blažević, I. The Garden Candytuft (Iberis umbellata L.): At the Crossroad of Copper Accumulation and Glucosinolates. Processes 2020, 8, 1116. [Google Scholar] [CrossRef]
- Bašić, A.; Penga, Ž.; Mužek, M.N.; Svilović, S. Impact of turbine impeller blade inclination on the batch sorption process. Results Eng. 2022, 16, 100554. [Google Scholar] [CrossRef]
- Zambrano, G.B.; De Almeida, O.N.; Duarte, D.S.; Velasco, F.G.; Luzardo, F.H.M.; Nieto-González, L. Adsorption of arsenic anions in water using modified lignocellulosic adsorbents. Results Eng. 2022, 13, 100340. [Google Scholar] [CrossRef]
- Kam, O.R.; Bakouan, C.; Zongo, I.; Guel, B. Removal of Thallium from Aqueous Solutions by Adsorption onto Aluminia Nanoparticles. Processes 2022, 10, 1826. [Google Scholar] [CrossRef]
- Mužek, M.N.; Burčul, F.; Omanović, D.; Đulović, A.; Svilović, S.; Blažević, I. Rocket (Eruca vesicaria (L.) Cav.) vs. Copper: The Dose Makes the Poison? Molecules 2022, 27, 711. [Google Scholar] [CrossRef] [PubMed]
- Buema, G.; Trifas, L.-M.; Harja, M. Removal of Toxic Copper Ion from Aqueous Media by Adsorption on Fly Ash-Derived Zeolites: Kinetic and Equilibrium Studies. Polymers 2021, 13, 3468. [Google Scholar] [CrossRef] [PubMed]
- Database of Zeolite Structures. Available online: http//www.http://europe.iza-structure.org/ (accessed on 20 August 2022).
- Bacariza, C.; Karam, L.; Hassan, N.; Lopes, J.M.; Henriques, C. Carbon Dioxide Reforming of Methane over Nickel-Supported Zeolites: A Screening Study. Processes 2022, 10, 1331. [Google Scholar] [CrossRef]
- Patterson, G.K.; Paul, E.L.; Kresta, S.M.; Etchells III, A.W. Mixing and Chemical Reactions. In Handbook of Industrial Mixing: Science and Practice; Paul, E.L., Atiemo-Obeng, V.A., Kresta, S.M., Eds.; John Wiley & Sons: Hoboken, NJ, USA, 2004; pp. 756–790. [Google Scholar] [CrossRef]
- Svilović, S.; Rušić, D.; Bašić, A. Investigations of different kinetic models of copper ions sorption on zeolite 13X. Desalination 2010, 259, 71–75. [Google Scholar] [CrossRef]
- Singh, V.; Singh, J.; Mishra, V. Development of a cost-effective, recyclable and viable metal ion doped, adsorbent for simultaneous adsorption and reduction of toxic Cr (VI) ions. J. Environ. Chem. Eng. 2021, 9, 105124. [Google Scholar] [CrossRef]
- Jafari, R.; Tanguy, P.A.; Chaouki, J. Characterization of minimum impeller speed for suspension of solids in liquid at high solid concentration using gamma-ray densitometry. Int. J. Chem. Eng. 2012, 2012, 945314. [Google Scholar] [CrossRef]
- Zwietering, T.N. Suspending of solid particles in liquid by agitators. Chem. Eng. Sci. 1958, 8, 244–253. [Google Scholar] [CrossRef]
- Nienow, A.W. Suspension of solid particles in turbine agitated baffled vessels. Chem. Eng. Sci. 1968, 23, 1453–1459. [Google Scholar] [CrossRef]
- Baldi, G.; Conti, R.; Alaria, E. Complete suspension of particles in mechanically agitated vessels. Chem. Eng. Sci. 1978, 33, 21–25. [Google Scholar] [CrossRef]
- Bašić, A.; Svilović, S. Effect of geometrical and operating mixing parameters on copper adsorption on zeolite NaX. Desalin. Water Treat. 2021, 209, 197–203. [Google Scholar] [CrossRef]
- Svilović, S.; Ćosić, M.; Bašić, A. Effect of radial impeller size in the presence and absence of baffles on the copper exchange on zeolite NaX. Eng. Rev. 2021, 41, 125–135. [Google Scholar] [CrossRef]
- Inglezakis, V.J.; Diamandis, N.A.; Loizidou, M.D.; Grigoropoulou, H.P. Effect of pore clogging on kinetics of lead uptake by clinoptilolite. J. Colloid Interface Sci. 1999, 215, 54–57. [Google Scholar] [CrossRef]
- Chitra, D.; Muruganandan, Z. Effect of Solid Concentration and impeller type on Mixing Operation in an Agitated Vessel. Int. J. ChemTech. Res. 2014, 6, 3655–3671. [Google Scholar]
- Findon, A.; McKay, G.; Blair, H.S. Transport studies for the sorption of copper ions by, chitosan. J. Environ. Sci. Health Toxic Hazard. Subst. Environ. Eng. 1993, 28, 173–185. [Google Scholar] [CrossRef]
- Tamburini, A.; Brucato, A.; Cipollina, A.; Micale, G.; Ciofalo, M. CFD predictions of sufficient suspension conditions in solid-liquid agitated tank. Int. J. Nonlinear Sci. Numer. Simul. 2012, 13, 247–443. [Google Scholar] [CrossRef]
- Hemrajani, R.R.; Tatterson, G.B. Mechanically stirred vessels. In Handbook of Industrial Mixing: Science and Practice; Paul, E.L., Atiemo-Obeng, V.A., Kresta, S.M., Eds.; John Wiley & Sons: Hoboken, NJ, USA, 2004; pp. 345–366. [Google Scholar] [CrossRef]
- Jaszczur, M.; Mlynarczykowska, A. A General Review of the Current Development of Mechanically Agitated Vessels. Processes 2020, 8, 982. [Google Scholar] [CrossRef]
- Tsui, Y.-Y.; Lin, S.-C.; Shen, S.-J.; Hu, Y.-C. Analysis of the Flow Agitated by Disc Impellers with Pitched Blades. Numer. Heat Transf. A Appl. 2008, 53, 1091–1108. [Google Scholar] [CrossRef]
- Oosterveld, M.W.C.; Van Oosanen, P. Further Computer-Analyzed Data of the Wageningen, B.-Screw Series. Int. Shipbuild. Prog. 1975, 22, 251–262. [Google Scholar] [CrossRef]
- Weber, W.J.; Morris, J.C. Kinetics of Adsorption on carbon from solution. J. Sanit. Eng. Div. Proc. Am. Soc. Civ. Eng. 1963, 2, 31–60. [Google Scholar] [CrossRef]
- Ritchie, G. Alternative to Elovich equation for the kinetics of adsorption of gasses on solids. J. Chem. Soc. Faraday Trans. 1 1977, 73, 1650–1653. [Google Scholar] [CrossRef]
- Haerifar, M.; Azizian, S. Mixed surface reaction and diffusion—Controlled kinetic model for adsorption at the solid/solution interface. J. Phys. Chem. C. 2013, 117, 8310–8317. [Google Scholar] [CrossRef]
- Taghavi, M.; Ebrahim, S.; Moghaddas, J.; Pouresmail, S. Effects of impeller system on the solids distribution in a stirred tank. In Proceedings of the 7th International Chemical Engineering Congress & Exihibition, Kish, Iran, 21–24 November 2011. [Google Scholar]
- Zhang, Z.; Gao, P.; Xiao, Q.; Liu, B. Experimental investigation on solid particle distribution in dense solid-liquid stirred tank. Chem. Pap. 2021, 75, 1457–1468. [Google Scholar] [CrossRef]
- Nineow, W.; Edwards, M.F.; Harnby, N. Mixing in the Process Industries, 2nd ed.; Butterworth-Heinemann: Oxford, UK, 1992; p. 366. [Google Scholar]
- Bakhtiari, N.; Azizian, S. Adsorption of copper ion from aqueous solution by nanoporous MOF-5: A kinetic and equilibrium study. J. Mol. Liq. 2015, 206, 114–118. [Google Scholar] [CrossRef]


| Batch Reactor | Propeller Agitator |
|---|---|
| Internal batch reactor diameter: dT = 0.14 m | Impeller pumping, downwards |
| 4 blades | |
| Suspension height, H = dT | Propeller diameter, D = 0.065 m |
| Off-bottom clearance, C/H = 0.33 | Outer impeller hub diameter, Da = 0.14 dT |
| Baffles width, Rv = 0.1 dT | Inner impeller hub diameter, Di = 0.07 dT |
| Angle, α = 45° | Hub height, a = 0.21 dT |
| Blade height, w = 0.11 dT | |
| Nominal pitch = 0.085 m | |
| Expanded blade area ratio = 0.518 | |
| Skew angle = 12.3° |
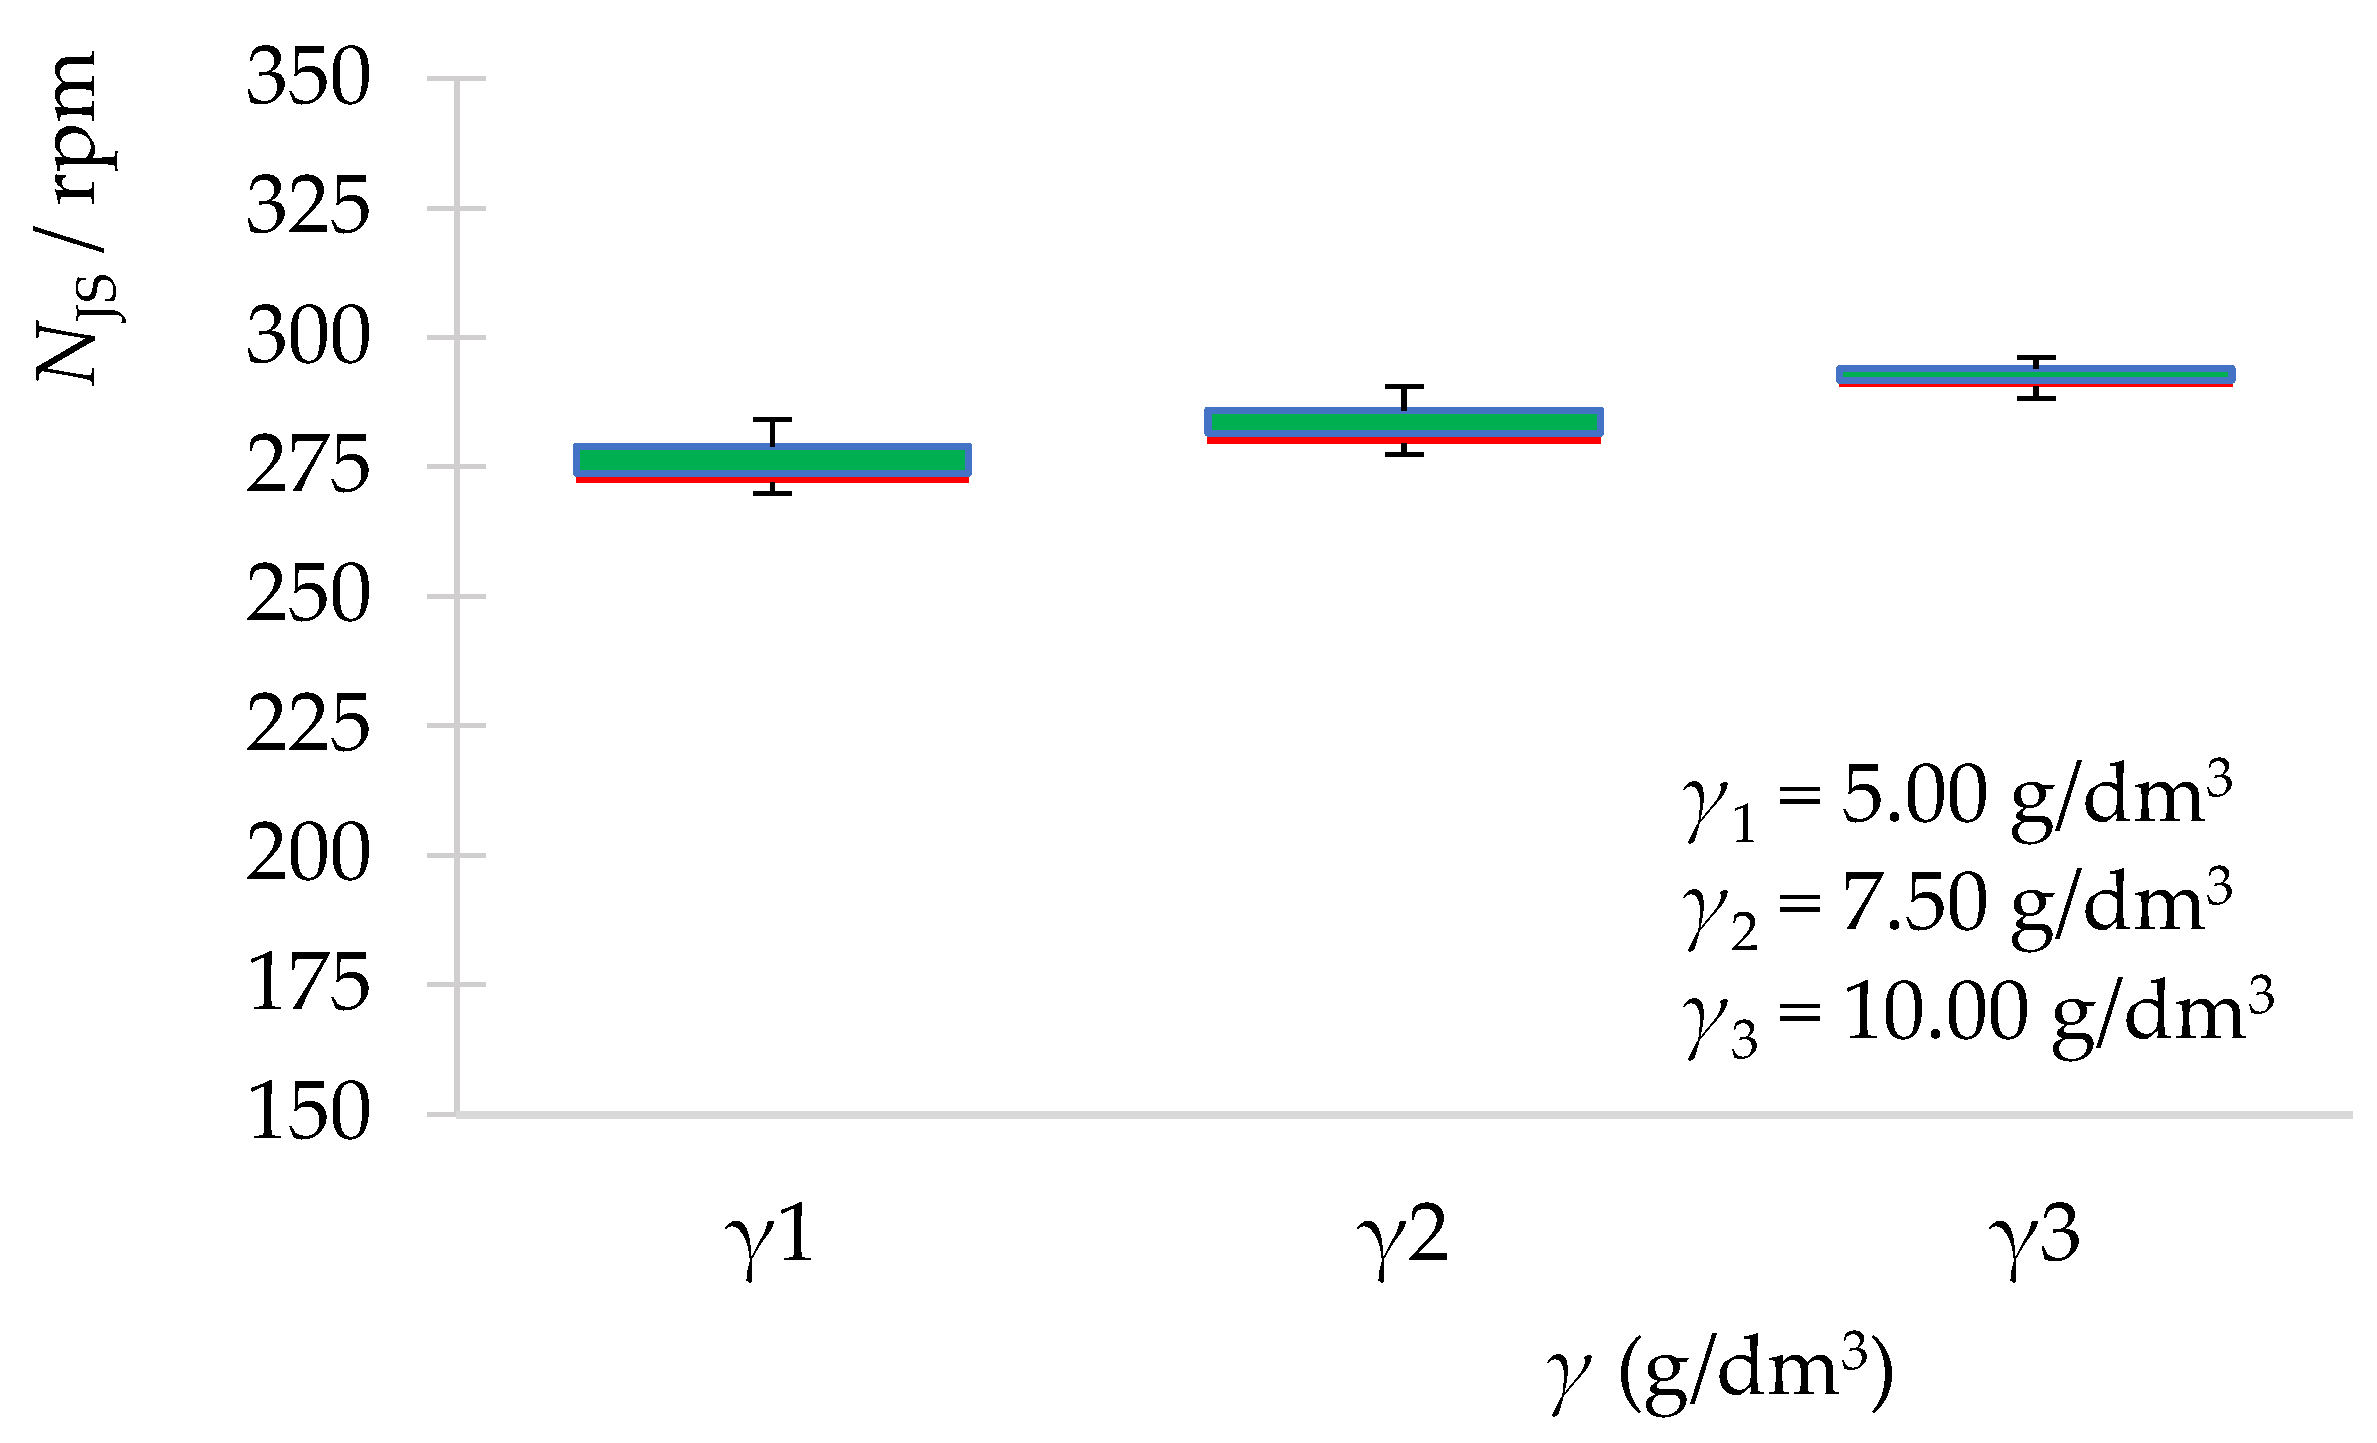
| Zeolite Mass (g) | 10.50 | 15.75 | 21.00 | |
|---|---|---|---|---|
| Experimental data | NJS (rpm) | 272 | 280 | 290 |
| qe,exp (mmol/g) | 1.417 | 1.321 | 1.144 | |
| R (%) | 59.377 | 82.931 | 95.797 | |
| ue,exp | 0.594 | 0.829 | 0.958 | |
| Ritchie model | qe (mmol/g) | 1.423 | 1.334 | 1.161 |
| k (g/mmol min) | 2.098 | 2.104 | 2.693 | |
| RMSE | 0.009 | 0.005 | 0.005 | |
| Mixed model | qe (mmol/g) | 1.399 | 1.310 | 1.148 |
| k (L/mmol min) | 0.028 | 0.070 | 0.220 | |
| ψ (min) | 3.501 | 0.359 | 1.4 × 10⁻⁴ | |
| ue | 0.609 | 0.800 | 0.970 | |
| RMSE | 0.015 | 0.007 | 0.005 | |
| Weber–Morris model | kd (mmol/g min1/2) | 0.196 | 0.183 | 0.153 |
| I (mmol/g) | 0.599 | 0.565 | 0.528 | |
| RMSE | 0.269 | 0.254 | 0.235 |
| N/NJS | 0.6 | 0.8 | 1.2 | |
|---|---|---|---|---|
| Experimental data | NJS (rpm) | 163 | 218 | 326 |
| qe,exp (mmol/g) | 1.125 | 1.327 | 1.479 | |
| R (%) | 46.372 | 54.486 | 61.256 | |
| ue,exp | 0.464 | 0.545 | 0.613 | |
| Ritchie model | qe (mmol/g) | 1.078 | 1.293 | 1.489 |
| k (g/mmol min) | 2.067 | 2.140 | 2.073 | |
| RMSE | 0.031 | 0.035 | 0.006 | |
| Mixed model | qe (mmol/g) | 1.091 | 1.308 | 1.458 |
| k (L/mmol min) | 0.001 | 0.003 | 0.032 | |
| ψ (min) | 5819.870 | 489.943 | 2.183 | |
| ue | 0.491 | 0.560 | 0.600 | |
| RMSE | 0.023 | 0.024 | 0.014 | |
| Weber–Morris model | kd (mmol/g min1/2) | 0.154 | 0.184 | 0.205 |
| I (mmol/g) | 0.437 | 0.532 | 0.626 | |
| RMSE | 0.192 | 0.234 | 0.282 |
Disclaimer/Publisher’s Note: The statements, opinions and data contained in all publications are solely those of the individual author(s) and contributor(s) and not of MDPI and/or the editor(s). MDPI and/or the editor(s) disclaim responsibility for any injury to people or property resulting from any ideas, methods, instructions or products referred to in the content. |
© 2023 by the authors. Licensee MDPI, Basel, Switzerland. This article is an open access article distributed under the terms and conditions of the Creative Commons Attribution (CC BY) license (https://creativecommons.org/licenses/by/4.0/).
Share and Cite
Bašić, A.; Penga, Ž.; Penga, J.; Kuzmanić, N.; Svilović, S. Zeolite NaX Mass and Propeller Agitator Speed Impact on Copper Ions Sorption. Processes 2023, 11, 264. https://doi.org/10.3390/pr11010264
Bašić A, Penga Ž, Penga J, Kuzmanić N, Svilović S. Zeolite NaX Mass and Propeller Agitator Speed Impact on Copper Ions Sorption. Processes. 2023; 11(1):264. https://doi.org/10.3390/pr11010264
Chicago/Turabian StyleBašić, Anita, Željko Penga, Jure Penga, Nenad Kuzmanić, and Sandra Svilović. 2023. "Zeolite NaX Mass and Propeller Agitator Speed Impact on Copper Ions Sorption" Processes 11, no. 1: 264. https://doi.org/10.3390/pr11010264
APA StyleBašić, A., Penga, Ž., Penga, J., Kuzmanić, N., & Svilović, S. (2023). Zeolite NaX Mass and Propeller Agitator Speed Impact on Copper Ions Sorption. Processes, 11(1), 264. https://doi.org/10.3390/pr11010264