1. Introduction
Mass customization and personalization demand trends drive production operations towards high product variability, smaller batch sizes, reduced inventory, and shorter lead times [
1,
2]. As a consequence, an increasing number of industries need to assemble a large number of similar products in small quantities each, which is called high-mix low-volume demand [
1]. To succeed under such circumstances, productivity and flexibility are required at the same time, contrary to the existing dichotomy [
3]. Reconfigurable assembly systems, first, followed by the cyberphysical or smart assembly systems of Industry 4.0 and the future adaptive cognitive assembly systems, aim to address it [
4,
5,
6].
Current manual or semiautomatic serial assembly lines (ALs) present productivity limitations due to the inherent losses of frequent changeovers and the difficulties of balancing a large mix of different products on top of the constraints imposed by automated stations. Moreover, these conventional fixed-worker assembly lines (FWALs) are not highly responsive to demand volume changes since the number of operators cannot be modified without compromising line balance. Unbalanced assembly lines are an open issue [
7], and mass personalization demand trends only aggravate the situation [
8,
9]. To address these problems, walking-worker assembly lines (WWALs) present benefits compared to FWALs. WWALs are line configurations in which operators move along the line, moving the products with them, so that each worker performs all assembly tasks on each station until the product is complete, and then starts over again. The benefits of WWALs versus FWALs are [
10,
11]: increased flexibility in production level by an easy modification of the number of workers, reduction of WIP inventory, and—most importantly—avoiding the negative effects of workstations imbalance, as long as the number of assembly stations exceeds the number of workers involved. However, WWALs may suffer from productivity losses when in-process waiting times occur because of the stations ahead of an operator being blocked by the other workers [
12]. The inclusion of machines within the WWAL can cause additional bottlenecks [
13], which can counter the benefits of process automation.
Another take on this problem is parallel assembly lines [
14,
15], which increase the reliability and flexibility of the lines, allow better balancing due to superior cycle times and lower number of operators and, therefore, increased productivity at the expense of larger equipment investments and space required. Combining both approaches—WWALs and parallel assembly lines—can provide important benefits in contexts of high-mix low-volume demand.
This article presents a multiproduct parallel walking-worker assembly line (PWWAL) with shared automated stations and evaluates its expected operational performance compared to semiautomated fixed-worker serial assembly lines when dealing with high-mix low-volume demand. The WWAL working logic was chosen due to its advantages over FWAL when dealing with stations balancing under high-mix demand conditions, despite the WWAL’s intrinsic inefficiencies due to worker displacements. Additionally, parallel line configurations could prove useful when product changeovers are frequent due to smaller batch sizes, since the number of stations could be reduced, decreasing the changeover losses, which depend heavily on the number of stations when there are large cycle time differences between the models produced by the line.
Discrete events simulation (DES) models were used to perform this study due to their ease of implementation and the possibility to incorporate stochastic parameters [
16,
17,
18,
19]. FlexSim® was employed to develop the simulation models. An industrial study case from a global white-goods manufacturer was used to build the simulation models, provide input data, and allow validation using historical data. In this industrial case, which is common across many industries, the company goal is to improve the productivity of several manual assembly lines that had been optimized over the years. To achieve this goal, the lines could be merged and upgraded by introducing some automated stations to reduce the manual work content. However, productivity would increase at the expense of flexibility, since line balance deteriorates when increasing product variety. Thus, the motivation for this work is to gain insights into the productivity vs. flexibility trade-off of parallel walking-worker assembly lines in comparison to traditional fixed-worker lines.
The article is structured as follows:
Section 1.1 offers a literature review on walking-worker assembly lines.
Section 2 includes a description of the line configurations modeled, the models’ inputs and outputs, and the simulation scenarios employed.
Section 3 and
Section 4 present the results and discussion of the simulation scenarios, respectively.
1.1. Literature Review
Over the last 25 years, WWALs have been studied using analytical and simulation models, focusing on different aspects of this line configuration performance, and considering different combinations of factors.
Table 1 summarizes the key aspects of the articles selected for this section. It is worth mentioning that none of the articles consider sequence-dependent setup times or automated stations in their WWAL models. Walking times are often considered negligible when the processing times are significantly larger.
Little had been written on walking (moving) worker assembly lines before D.P. Bischak’s article in 1996 [
10], which points out several advantages of unbuffered WW modules: flexibility in the production level; reduction in work-in-process inventories; avoiding the negative effects of AL imbalances produced by the frequent introduction of new products; and improving reported worker morale. On the other hand, the importance of operator cross-training increases as it becomes an enabler of this AL configuration. It was established that WWALs can improve system responsiveness in terms of throughput, and that they work well for unbalanced processing times. The simulation results show a reduced importance of WIP buffers for WWALs versus FWALs, that low variability systems require no WIP buffers, and that buffers would only increase lead time.
Wang and Owen [
11] presented a comparison between WWALs and FWALs in terms of line efficiency. Their DES model considered processing times variation and fixed walking times between stations in a linear single-model AL. It was concluded that the WWALs could provide higher output and efficiency than FWALs, and that it has greater tolerance to variations in processing time.
In a later article, Lassalle [
12] looked into the details of the in-process operator waiting times of linear WWALs. Simulation was employed, considering negligible walking times and product changeovers. It was found that the productivity loss caused by in-process waiting times is predictable and adjustable, with the workers-to-workstations ratio being its main driver.
In their 2009 article, Wang et al. [
13] studied linear WWALs using both simulation and mathematical modeling. They considered a mixed-model AL where workers may have unequal performance, leading to dynamic worker blockages due to the operational rule of not allowing faster operators to overtake slower ones.
Al-Zuheri et al. [
20] looked into WWALs to understand their worker productivity and ergonomics performance. Mathematical modeling was used on a U-cell layout, considering process time variability, worker skill level, and walking speed, among other variables. It was found that increasing the workers’ walking speed did not improve the productivity of the AL.
Cevikcan [
21] presented a line balancing optimization methodology for multimodel WWALs based on a mathematical model. Bortolini [
22] proposed a mixed-model sequencing algorithm for unpaced unbuffered WWALs on U-cell layouts, aiming to optimize line productivity.
In addition, a recent article from Hashemi-Petroodi et al. [
23] presented a literature review of different assembly and manufacturing workforce reconfiguration strategies, including walking-worker assembly lines. The authors found that (1) little has been published on multimodel walking-worker assembly lines, and (2) that an open field of research is the consideration of different workforce reconfiguration strategies, including walking-worker assembly lines, in a human–robot interaction environment.
Our article aims to help close this gap by looking into multimodel WWALs, which include manual and automated workstations.
2. Materials and Methods
In this article, the performance of the proposed parallel walking-worker assembly line configurations is compared to two fixed-worker assembly line configurations. DES models were used to understand the behavior of the line configuration alternatives by simulating different scenarios. DES was chosen because it presents important advantages over mathematical modeling when stochastic elements are the main drivers of the system under study [
19]. In the AL configurations considered here, the random nature of processing times is combined with random product arrival times to the automated stations. The simulation tool employed was FlexSim® (2022.0, FlexSim Software Products, Inc., Orem, UT, USA). The scenarios are defined by a subset of the input parameters, design parameters. Fixed parameters are common to all models for all scenarios, as well as the disturbances, which govern stochastic features of the models. The performance of the AL configurations is evaluated using several key performance indicators (KPIs), as shown in
Figure 1.
2.1. Assumptions
Figure 1 depicts the models employed in this study. All models feature the following general assumptions, following Boysen’s classification [
24]:
The production systems are unpaced, buffered assembly lines.
The number of workstations is constant, and they can only process one unit at a time. For the parallel line configuration, the number of stations refers to the number on each of the two lines.
The model mix is known, and demand continues for the whole simulation horizon.
They are multimodel assembly lines: they produce different models of products in batches. Setup is necessary before a batch of different products can be assembled, and it is performed by the operators as soon as possible, i.e., when the last unit of the previous batch has been processed. Setup time depends on the sequence of products, and it is lower when subsequent models are of the same product family.
No component shortages: components being assembled onto the product are always available at the stations.
The product sequence is governed by the parameter , which indicates the number of batches of the same family that are produced until a product family changeover occurs (which takes longer than a same-family model changeover).
Processing and setup times are modeled stochastically using a lognormal distribution, which is governed by the average process/setup times and by a variability coefficient.
Processing and setup times consist of smaller tasks, which are sufficiently small so that the line balance is not affected by a change in the number of stations.
When converting manual work content () into automated (), can be reduced equally from all stations.
transformed into becomes 20% larger due to the inferior assembly speed of the automated stations compared to well-trained human operators.
Two automated stations perform in-line quality control (QC) in the middle and at the end of the assembly process. Defective units are reworked out of line, which may cause idle time to downstream operators.
Figure 1(1),(2) depict manual and semiautomated FWALs, which feature the following specific assumptions:
Fixed workers: the operators are assigned to workstations and they do not leave them.
Serial layout: the stations form a line, and the work-in-process products travel along them sequentially.
The line balance depends on the number of operators.
The manual FWAL features manual stations only, while the semiautomated FWAL includes manual and automated stations.
Workstation buffers have a maximum capacity of one product.
Figure 1(3) shows the semiautomated walking-worker single assembly line, and
Figure 1(4) shows the proposed parallel walking-worker assembly line. In these line configurations presented here, operators walk along the line and pick the components to assemble for the in-process product on a mobile trolley, while automated stations process units (
Figure 2a). When arriving at the automated stations, the operators leave their current product in the in buffer and take a processed product from the out buffer of the automated station (
Figure 2b). The operators then resume their path (
Figure 2c). When a product is finished, it is placed in the finished products buffer, and then the operator walks back to the starting point to resume production.
Thus, both WWAL configurations were modeled under the following specific assumptions:
The production system includes manual ‘stations’, which conform to one or two lines, and automated stations, some of which are shared by both lines for PWWAL.
Despite the assembly being made on mobile trollies, it is the spaces by the picking shelves that are modeled as stations.
There is a certain number (W) of operators working on the line, with a maximum equal to the number of stations.
Operators move downstream, cannot overtake other operators, and can wait by a station in case it is not available when they arrive.
The traveling time of the operators from one station to the next one is simulated considering a constant speed of 1 m/s.
Automation stations in and out buffers’ maximum capacity is one unit.
Shared automated stations process products following an FIFO rule (first in, first out), and can only place processed units in the out buffer corresponding to the line of origin of the product.
The main objective of the analysis is to maximize line productivity, defined as the number of conforming units produced per operator-hour. In particular, the industry study case sets a line productivity target increase of +25% compared to the initial situation (manual FWAL). Minimizing production lead time is also considered important, but less so than line productivity maximization. The ability to modify throughput with ease is desirable as well. Consequently, a set of three ‘main KPIs’ (key performance indicators) was composed of line productivity, batch lead time, and throughput. A secondary set of three KPIs was used to understand what drives the main performance measures as well as find potential drawbacks. The ‘secondary KPIs’ are labor productivity, unit lead time, and surface productivity. Increasing labor productivity and surface productivity and minimizing unit lead time is also desirable if possible.
2.2. Notation
The following notations are introduced:
Design parameters:
- W
Number of workers (index w).
- Q
Number of units in a batch.
Number of batches of the same product family before changeover.
Fixed parameters:
- M
Number of models (index m).
- K
Number of manual workstations (index k).
- J
Number of automated workstations (index j).
Processing time.
Setup time.
Work content (i.e., total process time).
Disturbances:
First time yield.
Process time coefficient of variation: .
Setup time coefficient of variation: .
Key performance indicators:
Line productivity (units/operator-h): production rate of conforming units per operator.
Batch lead time (min): average time for a batch of units to be finished from the moment the last unit of the previous batch is finished.
Throughput (units/h): production rate of conforming units.
Labor productivity (%): percentage of time that operators spend processing units. Setup and walking times are not considered productive.
Unit lead time (min): average time for a unit to be finished from the moment it starts being assembled.
Surface productivity (units/operator-h-m2): production rate of conforming units per operator and surface unit.
2.3. Input Data
The DES models employed data corresponding to the industrial case study. The parameter values are based on the industrial case data, as indicated in
Table 2. The assembly operations considered in this article deal with three families of similar products. Although all product families share technological principles, core functionalities, and are subjected to the same QC tests, their dimensions, materials, and other secondary features are not the same. Batch sequencing is performed by grouping products of the same family together, which leads to the
design parameter.
Table 2 includes the current state values for the design parameters, which define what are considered standard demand conditions. It also shows the fixed parameters and disturbances included in the models. They remain unchanged for all assembly line configurations on all demand scenarios.
Table 2.
Design parameters, fixed parameters, and disturbances considered in the models.
Table 2.
Design parameters, fixed parameters, and disturbances considered in the models.
| Parameter | Units | Min | Max | Current State |
|---|
| W | Workers | 2 | 10 | 8 |
| Q | Units | 12 | 48 | 48 |
| Batches | 1 | 3 | 3 |
| M | Models | | | 3 |
| K | Stations | | | 8 (FWAL), 16 (PWWAL) |
| J | Stations | | | 4 |
| s | | | See Table 3 and Table 4 |
| s | | | See Table 5 |
| s | | | See Table 3 |
| % | | | 99 |
| % | | | 15 |
| % | | | 15 |
Table 3.
Manual processing times and work content input data.
Table 3.
Manual processing times and work content input data.
| Model, m | (s) | (s) | (s) | (s) | (s) | (s) |
|---|
| Manual FWAL |
| 1 | 158 | 146 | 1179 | 0 | 0 | 1179 |
| 2 | 129 | 119 | 962 | 0 | 0 | 962 |
| 3 | 100 | 92 | 745 | 0 | 0 | 745 |
| Semiauto FWAL |
| 1 | 122 | 112 | 908 | 325 | 0 | 1233 |
| 2 | 99 | 92 | 740 | 266 | 0 | 1006 |
| 3 | 77 | 71 | 572 | 207 | 0 | 779 |
| Semiauto PWWAL |
| 1 | 122 | 112 | 908 | 325 | 33 | 1266 |
| 2 | 99 | 92 | 740 | 266 | 33 | 1039 |
| 3 | 77 | 71 | 572 | 207 | 33 | 812 |
Table 4.
Automated processing times input data.
Table 4.
Automated processing times input data.
| | (s) |
|---|
| Model, m | | | | |
|---|
| 1 | 31 | 89 | 105 | 100 |
| 2 | 28 | 76 | 85 | 77 |
| 3 | 25 | 53 | 65 | 54 |
Table 5.
Setup time input data.
Table 5.
Setup time input data.
| | (s) |
|---|
| Station | Product Family Change | Same Product Family |
|---|
| 480 | 360 |
| 48 | 36 |
Processing times depend on the model (index
m). The average values of manual processing times—for stations
, along with the manual, automated, and walking work contents—are found in
Table 3.
Note that, based on
for manual FWAL, the automation of ca. 23% of the
means to increase that WC by 20%, under the assumption that well-trained manual operators can assemble faster than a collaborative robot. It was deemed realistic to assume that both FWAL and WWAL process and setup times would have a similar distribution in terms of mean and variability values. It was also assumed that process times can be atomized because the individual (indivisible) tasks considered in the industrial case take, on average, between 7 and 20 s, which is significantly lower than the assembly stations process times (cf.
Table 3).
The average values of automated processing times for stations
are found in
Table 5. In theory, none of the automated stations is the AL bottleneck. However, the processing times variability and the incoming units simultaneity calls for additional capacity. In the industrial study case presented here, automated stations
and
are duplicated (cf.
Figure 1(3),(4)) because they are not QC stations, which reduces the investment requirements.
The first and second manual stations include tooling and fixtures that require lengthier changeovers than the rest, which consist of picking stations only. Moreover, the
base value is also altered depending on the preceding and subsequent model being produced.
Table 5 shows the setup time average values. Automated stations do not require any setup time as it has been estimated to be of similar magnitude to same-product setup, therefore being included in the processing time.
The production sequence depends on the
design parameter, as shown in
Table 6. The sequence is repeated until the end of the simulation time. For semiauto PWWAL, model 1 (
) and model 3 (
) batches are assigned to one of the parallel lines, and model 2 (
) batches are assigned to the other one. In consequence, PWWALs benefit from performing fewer product family changeovers.
The DES models consider the inherent variability of manual assembly processes by using a lognormal distribution for process and setup times, based on the recommendations by Banks and Chwif [
25]. The mean (
) for this distribution is the process standard assembly time for each—different for each product family—and the standard deviation (
) is found as a percentage of the mean given by the parameters
and
. The values for these parameters were estimated from historical data from the industrial partner existing manual assembly lines, and found to be in the range of 15–20% for the assembly lines considered in this study case. To minimize the uncertainty of the results due to the stochastic nature of processing and setup times, each simulation scenario was run 20 times.
To calculate
, the surface requirements for each assembly line configuration were measured—manual AL configuration—or estimated from the study case preliminary line designs, resulting in the surface requirements shown in
Table 7. Note that the greater WWAL lengths, compared to semiautomated FWAL, are due to the increased WIP and operator buffers.
The simulation time is 60 h, with a 1 h warmup time. At the start, buffers between manual stations are empty (FWAL models), and automated stations are full.
2.4. Validation
The manual fixed-worker assembly line configuration (
Figure 1(1)) was simulated using input parameter values from the industrial study case from a global white-goods manufacturer site located in the north of Spain. The simulation output was compared against the company’s operational KPIs collected in January 2021. The average relative error of the KPI estimations was 1.8%, and the maximum error was 4.9%. This error magnitude was deemed satisfactory for the scope of this work. Thus, the DES model was validated, and the same simulation methodology was used to build the semiautomated FW and the parallel walking-worker assembly line configurations (
Figure 1(2)–(4)).
2.5. Performance Comparison for Different Demand Scenarios
The performance of the different line configurations was assessed under different demand conditions. The standard demand conditions,
scenario i, were created by setting the design parameters to 8 operators, a batch size of 48 units, and a product family changeover frequency of 3 batches, as shown in
Table 8. This scenario represents the performance of the line configurations if the demand remains stable and does not change towards mass customization. The results from this
scenario i set the baseline performance of each line configuration.
To adapt to increasingly challenging demand conditions, assembly operations flexibility in terms of reduced lead times, smaller batch sizes, and more frequent rotation of product families are critical. To understand the performance of the different assembly line configurations under such conditions, simulation
scenarios ii–v were set up, as shown in
Table 8.
Scenarios ii–iv look into how the performance of each line configuration is affected by the change of the three design parameters individually.
Scenario v considers the most severe demand conditions at the same time and compares the performance against the base scenario. Finally,
scenario vi analyzes the effect of automation in terms of percentage of work content automated, under either standard or high-mix low-volume demand conditions, and for a varying number of manual operators. On the other hand, the effect of the automation layout structure (i.e., the number of shared automated stations) would be hardly observed and analyzed using the industrial study case presented here because none of the automated stations are the AL bottleneck. Therefore, in this particular case, the number of automated stations would not significantly impact the AL operational KPIs. The following section,
Section 3, includes the outcome of the simulations.
3. Results
This section includes the models’ outputs (KPIs) for each
scenario i–vi shown in
Table 8. The results shown in this section are the average KPI values of 20 simulation runs. The maximum standard deviation of the results, as a percentage of the average value, is 1.1%. This indicates that the results are relatively stable with respect to the models’ disturbances. For each scenario, the simulation results are shown in tables including the three AL configurations. The main KPIs (
,
,
) improvements for the semiautomated FWAL and PWWAL configurations are then evaluated compared to the manual FWAL configuration. Note that
(units/h) and
(units/oper-h) variations with respect to manual FWAL are the same because the number of operators remains constant.
3.1. Base Scenario: Current-State Demand
The results of simulating the base scenario demand on the four assembly line configurations are shown in
Table 9. Firstly,
increases as a result of automation for semiautomated FWAL and WWAL configurations. It is important to note that the manual work content reduction obtained by introducing automation was ca. −23%.
The eight workers semiautomated single WWAL improves the performance compared to the manual FWAL. However, it presents worse performance than semiauto FWAL in terms of each and every one of the KPIs considered because there are not more stations than workers. This means that the single WWAL suffers from both line unbalancing and walking inefficiencies. Progressively reducing the number of workers in this configuration increases
,
, and
, at the cost of a sharp reduction in
. Adding a second walking-worker line and sharing some of the existing automated stations leads to increased productivity and throughput, transforming the semiautomated single WWAL into the parallel WWAL shown in
Figure 1(4). It is very significant that the walking-worker way of working allows duplicating the throughput—from 17.1 to 33.8 units/h—by duplicating the number of workers while maintaining very high labor productivity (85.6%). Since the single WWAL presents no critical productivity advantages over the PWWAL, the following subsections omit the results of the single WWAL and focus on the semiauto FWAL vs. PWWAL comparison.
The semiautomated FWAL configuration achieves a +25% increase in PLine (see
Figure 3). On the other hand, the PWWAL
rises by +33% despite the walking time losses since there are no line balancing losses in this configuration. This is particularly remarkable when considering that WWAL configurations present an additional walking
of 33 s per unit and 33 s return time to the first station (see
Table 3 and
Table 7).
On the other hand, batch lead time follows different trends: it improves for semiautomated FWAL (−16%
reduction) but it worsens significantly for PWWAL (+54%
increase) compared to manual FWAL. Semiauto FWAL
improves despite the increased line length—eight manual stations plus four automated stations—due to the increased
(+25%). Contrarily, PWWAL
increases greatly despite its total
increase (1) due to the walking-worker logic; (2) because each one of the parallel lines consists of only four operators—cf.
for single WWAL with
and
for PWWAL on
Table 9; and (3) because the total work content increases by ca. 7–9% when taking into account manual, automated, and walking
(see
Table 3).
Unit lead time increases as a result of introducing automated stations, but less so for semiauto FWAL (+14% increase) than for PWWAL (+36% increase vs. manual FWAL). Once again, note that the of single WWAL with four operators is approximately the same as the of PWWAL.
Finally, the surface needed for the PWWAL is much greater than for manual or semiautomated FW lines (see
Table 7), resulting in a significant
decrease.
As shown in
Figure 3, the main KPI improvements (
increase) meet the industrial case study target under standard demand conditions. The next section,
Section 3.2, analyzes how the AL configurations deal with more challenging demand conditions.
3.2. High-Mix and Low-Volume Demand Scenarios
Simulation scenarios ii to iv test the line configurations under tougher demand conditions than scenario i. The performance of the assembly systems is expected to deteriorate for all AL configurations, but the focus here is the performance of semiautomated FWAL and PWWAL compared to manual FWAL.
Scenario ii: High-mix presents the necessity of reducing batch sizes due to increasingly atomized demand trends.
Table 10 shows the KPIs resulting from simulating the different line configurations under a gradually smaller batch size (
Q). The PWWAL configuration is best in terms of
,
, and
at all levels of
Q, and is the worst in terms of
,
, and
. For the three line configurations, all KPIs deteriorate as a result of reducing
Q.
Note that line productivity for semiautomated FWAL with units is still greater than for manual FWAL with units, and that the line productivity for PWWAL with units is still significantly superior to manual FWAL with a Q of 48 units. A key driver for this is that setup time losses are smaller for PWWAL than for FWAL because PWWAL employs fewer operators per AL branch.
Figure 4 shows that manual FWAL deals with reduced batch sizes worse than semiautomated AL since the
of semiauto FWAL and PWWAL shows improvements for all levels of batch size. It can be seen that PWWAL maintains an improvement of ca. +30 to +33%
compared to manual FWAL for all
Q levels. On the other hand, semiautomated FWAL improvements vs. manual FWAL decrease as
Q decreases. This leads to the conclusion that PWWAL deals with reduced batch sizes better than semiautomated FWAL. This is a key finding since maintaining high line productivity, even when significantly reducing the batch size, is the main goal of the PWWAL.
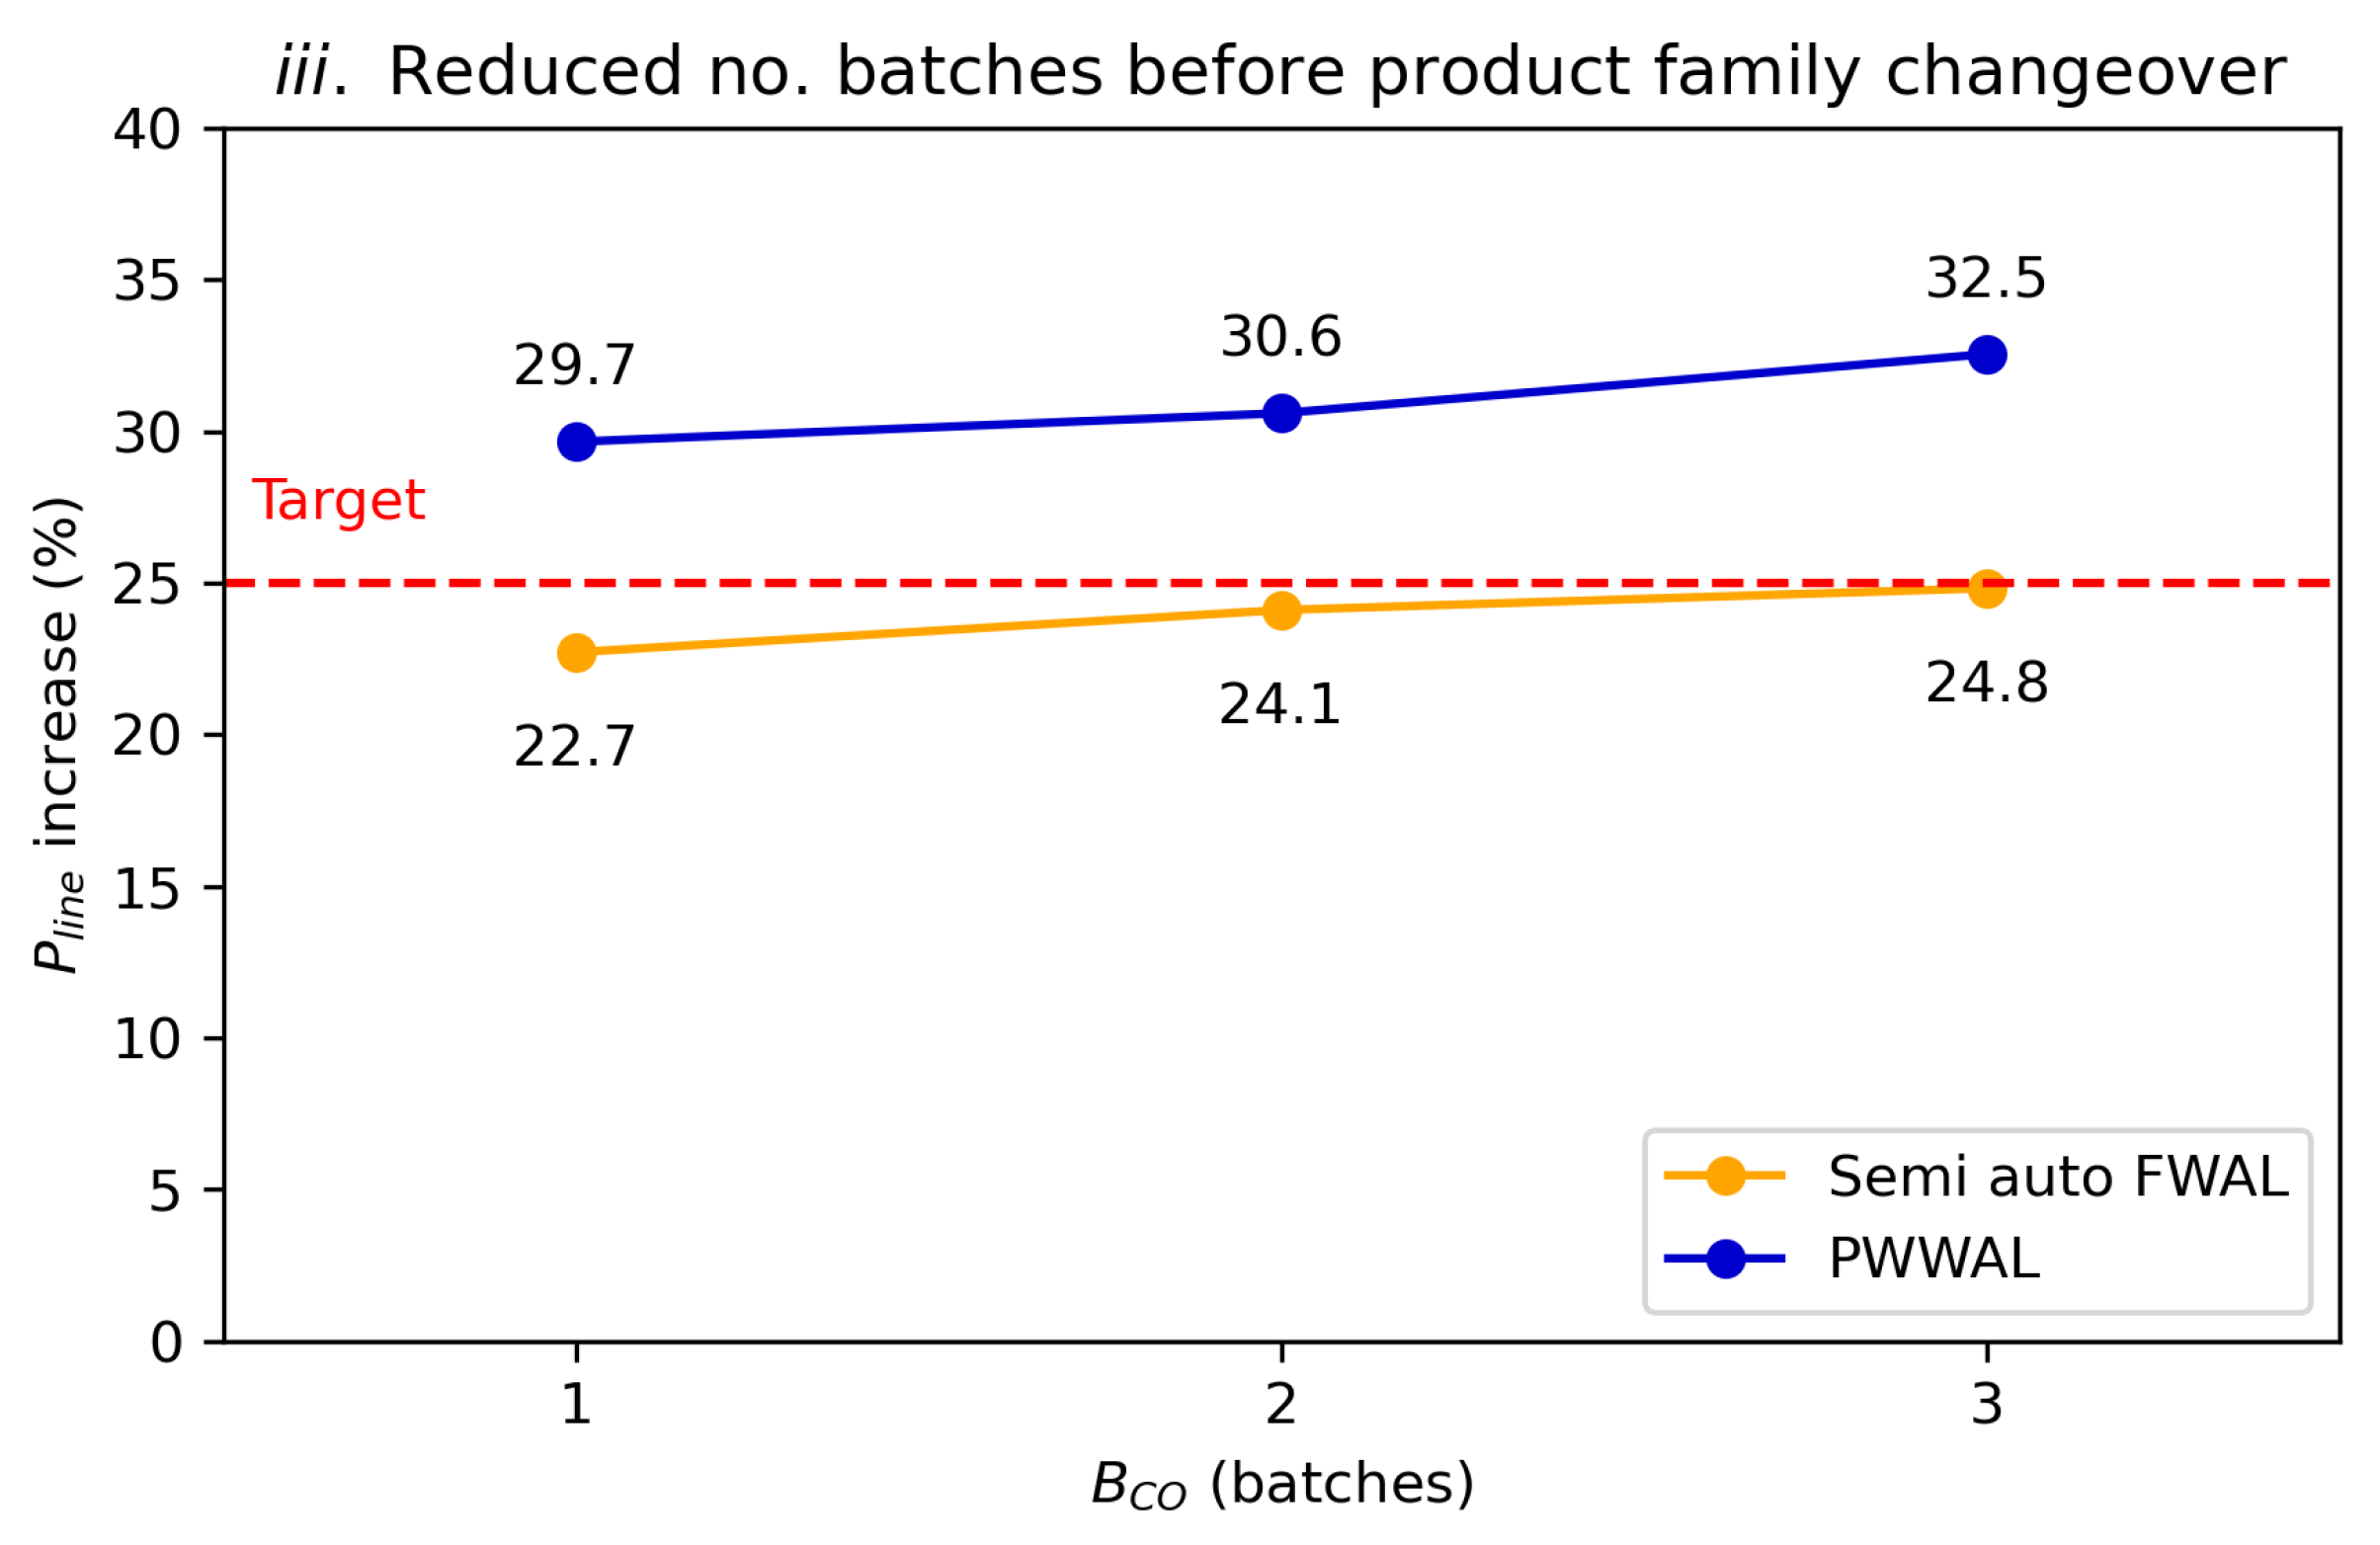
Scenario iii also considers a high-mix demand situation, in this case by requiring more frequent changeovers, i.e., the number of batches before product family changeover,
, decreases. The KPI results of
scenario iii are shown in
Table 10. The only performance indicator that is significantly affected is
, which decreases for semiautomated FWAL by ca. 2 percent points. However, this decrease in
is not large enough to drag down
significantly, as shown in
Figure 5.
Simulation
scenario iv considers a situation where the demand levels drop, and the throughput of the AL must be adjusted accordingly. To achieve this, the number of workers,
W, is reduced. Note that the semiautomated FWAL is not able to modify this parameter under the constraints presented in
Section 2. In reality, the production level of the semiautomated line could be adjusted by modifying other factors, such as the number of shifts, which are outside the scope of this work.
Table 10 shows the simulation results for each line configuration when changing the parameter
W.
Firstly,
decreases as
W decreases for manual FWAL and PWWAL configurations, but it does not decrease equally, due to line and labor productivity.
increases significantly for manual FWAL (from 87 to 96.2%) but not so much for PWWAL (from 85.6% to 90.9%) when
W is reduced from eight to two workers. The
increase is due to the better line balance in the case of manual FWAL; and due to the reduction in in-process operator idle time for PWWAL—consistent with the conclusions by Lassalle et al. [
12]—and the reduction in automated station saturation caused by the lower
. Consequently,
increases when
W decreases.
Lead times, however, behave quite differently. decreases slightly for manual FWAL but increases sharply for PWWAL because of its production logic, by which operators leave units in the automation queues upon arrival, and then take a unit already processed by the automated stations. Since the number of WIP buffers before automations remains constant regardless of W, when , the lead time increases. On the other hand, increases as W is reduced since its main contributor is the cycle time, which is inversely proportional to W. This trend affects both manual and PWW line configurations.
Finally, increases very slightly when W is reduced, as a consequence of the increased . It is important to note that the PWW line configuration is the only one that allows introducing more operators if needed—until the automations are saturated—which allows increased throughput even further at the cost of reducing productivity.
Figure 6 shows that PWWAL performs better than manual FWAL in terms of
at all levels of
W. However, with
operators it is no longer possible for PWWAL to achieve the target +25% increase in
compared to manual FWAL.
3.3. High-Mix Low-Volume Demand Scenario
Simulation
scenario v considers a combination of
scenarios ii and
iii demand conditions: small batch size (
units) and frequent product family changeovers (
batch).
Table 11 shows the KPIs resulting from
scenario v.
and
for semiautomatic FW and PWW lines are greater than those of manual AL configuration. However, only the PWWAL configuration allows a similar
under high-mix low-volume conditions.
decreases sharply under high-mix low-volume demand compared to standard conditions (cf. results of
scenario i on
Table 9), which affects semiautomated FWAL more intensely than PWWAL. This explains why PLine improves only by +7% for semiautomated FWAL, compared to +30% for PWWAL, as shown in
Figure 7.
On the other hand, is worse for semiautomated than for manual lines. for PWWAL is significantly greater than for FWAL. This is deduced from the fact that almost doubles for PWWAL compared to manual FWAL (34.5 min vs. 18.6 min). This also indicates that the WIP levels of PWWAL must be superior to those of FWAL lines. Finally, shrinks slightly under high-mix low-volume demand conditions compared to scenario i.
In summary, under both standard (scenario i) and high-mix low-volume demand conditions (scenario v), the parallel walking-worker line configuration achieves greater line productivity, which is the main goal of the industrial case presented. However, parallel walking-worker lines suffer from a higher batch lead time than fixed-worker line configurations. The parallel walking-worker configuration allows meeting the target line productivity improvement of 25% even under the most challenging conditions simulated. In contrast, the semiautomated FWAL presents perform better on secondary KPIs, such as lead time and surface productivity.
3.4. Degree of Automation
Simulation
scenario vi tests the performance of semiautomated AL configurations for varying degrees of automation, in terms of the percentage of manual work content that has been assigned to automated stations.
Scenario vi also considers the influence of demand conditions (
Q,
) and number of manual operators (
W). The results of
scenario vi simulations are shown in
Table 12, with the behavior of the most significant KPIs depicted in
Figure 8.
Figure 8a shows the assembly line productivity as the degree of automation increases. Note that the
base scenario corresponds to 23% automated WC. The simulation results show that the productivity is at a maximum for the base scenario with eight manual operators (
). This is coherent with the number of manual and automated stations being chosen, aiming for line balance. From this point, decreasing the degree of automation reduces the line productivity, since the manual labor becomes the bottleneck. Increasing the degree of automation while keeping
W constant also reduces the line productivity, due to the automated stations becoming the bottleneck. Note that this trend is maintained for both standard demand conditions (solid line series) and high-mix low-volume conditions (dashed line series). Productivity falls because the workers are increasingly idle and the output does not increase. The assumption that manual WC can be automated, increasing the processing time by 20%, plays an important role here. The study case assumes that this is reasonable since a well-trained operator assembles faster than a regular collaborative robot (see
Section 2.3). Therefore, reducing
W should increase the line productivity when the degree of automation is high. Unfortunately, for traditional FWAL lines (yellow), this change cannot be carried out without degrading the line balance. On the other hand, walking-worker lines can reduce the number of manual operators without incurring any penalty. This situation was simulated for
and
total manual operators (medium and light blue series, respectively, in
Figure 8a. By decreasing
W, PWWALs allow to achieve an even greater line productivity with a higher degree of automation. This is due to the fact that the manual and automated process times are being balanced.
However, this productivity increase comes at the expense of reducing the throughput of the assembly line, since
W has been reduced, as shown in
Figure 8b. Note how a smaller
W results in gradually lower
for all levels of automation and for all demand conditions. The
of both line configurations (PWWAL and semiauto FWAL) for all levels of
W tends towards a common point as the degree of automation increases, because
is governed by the process time of the bottleneck.
In conclusion, PWWALs offer greater flexibility than fixed-worker lines in terms of benefiting from an increased degree of automation because they allow to easily rebalance the manual/automated workload by seamlessly removing operators, thus achieving greater line productivity. On the other hand, this comes at the expense of reducing the throughput and significantly increasing the batch lead time.
4. Discussion
Simulation results indicate that PWWALs have better operational performance than semiautomated or manual FWALs in terms of line productivity, throughput, and labor productivity, especially when facing high-mix low-volume demand, which makes it necessary to perform frequent family product changeovers, use small batch sizes, or use a reduced number of assembly operators. On the other hand, PWWALs present longer batch and unit lead times and require additional WIP stock and shopfloor space.
Automation-driven reduction of the products’ manual work content by −23% leads to a productivity increase of +33% for PWWAL (vs. +25% increase for semiautomated FWAL) compared to manual AL configuration under standard demand conditions. Under high-mix demand conditions, PWWAL achieves a +30% productivity increase, significantly superior to the +7% productivity increase for semiautomatic FWAL—compared to manual FWAL, as shown in scenario v. In conclusion, the main goal of a +25% line productivity increase when producing small batches of highly mixed products can be achieved by the PWWAL, and not by the FWAL.
The PWWAL configuration suffers less from line unbalance caused by automated stations and product variety, provided that the workers-to-stations ratio remains low and that each worker moves through all the assembly stations. The WWAL cells within a line [
21] reintroduce the problems of line balancing, but they reduce the need for operator training. Note that although total
increases for WWAL compared to FWAL due to operator walking times, these losses are offset by superior labor productivity. PWWAL configuration also suffers less from setup time losses because each AL branch has fewer workers, which minimizes the waiting/blocking time losses caused by cycle time differences between the products involved in the changeover.
Introducing automated stations does not improve the average batch lead time, since the increased throughput is offset by the increased total work content and the superior number of workstations. PWWAL configurations present significantly worse batch lead times than semiauto or manual FWALs under any demand situations. It is also important to note that the average unit lead time to complete a unit increases for semiautomated FWAL, and especially for PWWAL configurations, compared to manual FWAL, which means that the WIP stock held at the line at any given moment would be greater. This is caused by the capacity buffers placed before and after the automations, which are required to hold twice as many WIP units in the PWW line since each automated QC station is served by two (slower) assembly lines which could have different cycle times.
Labor productivity decreases due to the introduction of automation and the reduction of batch sizes—which increases the percentage of time dedicated to setups. The PWWAL configuration is less affected than semiautomated FWAL by frequent changeovers since shorter ALs suffer less from operator idle times generated by cycle time differences between incoming and outgoing products. These idle times increase as the number of operators increases. Nonetheless, labor productivity losses are offset by the reduction in work content caused by automation.
Lastly, PWWAL presents high requirements in terms of shopfloor space compared to the fixed-worker assembly lines. PWWAL surface productivity is, under high-mix low-volume conditions, 0.010 units/operator-h-m2, which is considerably lower than that of manual (0.041) or semiautomated configurations (0.031). The higher surface needs derive from the additional WIP and operator space buffers that the PWWAL needs to operate efficiently.
Increasing the degree of automation creates an imbalance between manual and automated work content that requires adjusting the number of workers. PWWALs offer greater flexibility than fixed-worker lines because they can seamlessly adjust the number of manual operators. However, the increased line productivity resulting from simultaneously increasing the degree of automation and decreasing the number of operators reduces the line throughput and increases significantly the batch lead time.
Besides the KPIs already exposed, PWWAL presents other advantages in terms of flexibility and reconfigurability. Production level changes are made simple by modifying the number of operators working on each AL branch independently—within the limits imposed by the capacity of the automated stations—without changes in the operators work organization. In fact, the number of workers could be temporarily increased beyond the designatedfour operators per AL branch at the expense of productivity. A parallel line configuration also brings additional sequencing possibilities, for example, being able to assemble a batch of products in both lines simultaneously to reduce the batch lead time—effectively working with half the batch size—at the cost of line productivity. Finally, the introduction of products to the PWWAL would present fewer drawbacks due to the reduced sensitivity of this line configuration to work content differences and poor line balance.
In conclusion, PWWAL configurations would be particularly beneficial in assembly operation situations where line productivity needs to be maximized under high-mix low-volume demand conditions, and when batch lead times are not a critical factor.
5. Conclusions
To address the need for more flexible and more productive assembly operations brought about by mass customization demand trends, this article presented a concept of a multimodel parallel walking-worker assembly line with shared automations. Based on an industry real-study case, discrete events simulation was utilized to model this assembly line concept, along with manual linear and semiautomated fixed-worker assembly lines. The models were used to compare the performance of the different line configurations under standard demand as well as different scenarios of increasingly challenging conditions in terms of reduced batch sizes and more frequent product changeovers. To evaluate efficiency, a set of six key performance indicators (KPIs) were employed: line productivity, batch lead time, throughput, labor productivity, unit lead time, and surface productivity.
It was found that under high-mix low-volume demand conditions requiring small batch sizes and frequent product family changeovers, the parallel walking-worker line configuration achieves greater line productivity and throughput than the semiautomated or manual fixed-worker line configuration. On the other hand, semiautomated fixed-worker assembly lines present better batch lead time, unit lead time, and surface productivity. Manual fixed-worker configuration productivity is inferior to the semiautomated alternatives according to all KPIs except for surface productivity. Increasing the degree of automation allows to increase the line productivity under all demand conditions, only if the number of workers can be reduced smoothly—which is the case for walking-worker configurations but not for fixed-worker lines. However, this comes at the expense of reducing the line throughput and increasing the lead time.
A key current research limitation lies in considering multiple layouts and shared automation configurations in order to find optimal line configurations or the performance of reconfigurable systems over long periods of time.
Areas for future work include (1) optimizing the actual layout of the parallel walking-worker configuration, to minimize the surface footprint; (2) the actual implementation of the parallel walking-worker concept in an industrial setting, which would enable validating the parallel walking-worker assembly line model; (3) expanding the simulation models to include machine breakdowns and quality problems, in terms of rework times and scrap products; and (4) a supply chain simulation layer feeding parts to the assembly lines. Future developments based on current research limitations would include assessing the operational performance of different line configurations in terms of both automation and layout.
Author Contributions
Conceptualization, A.M., J.A.Y.-F., M.T. and M.-J.O.; methodology, A.M., J.A.Y.-F., M.T. and M.-J.O.; software, A.M.; validation, A.M. and M.-J.O.; formal analysis, A.M.; investigation, A.M.; resources, A.M.; data curation, A.M.; writing—original draft preparation, A.M.; writing—review and editing, A.M., J.A.Y.-F., M.T., M.-J.O. and G.T.; visualization, A.M. and M.T.; supervision, J.A.Y.-F. and M.T.; funding acquisition, J.A.Y.-F. and G.T. All authors have read and agreed to the published version of the manuscript.
Funding
This research work was undertaken in the context of DIGIMAN4.0 project (“DIGItal MANufacturing Technologies for Zero-defect Industry 4.0 Production”,
http://www.digiman4-0.mek.dtu.dk/). DIGIMAN4.0 is a European Training Network supported by Horizon 2020, the EU Framework Programme for Research and Innovation (Project ID: 814225).
Data Availability Statement
The data presented in this study are available on request from the corresponding author. The data are not publicly available due to the industrial company confidentiality agreement.
Acknowledgments
The authors would like to thank B/S/H/ Electrodomesticos España SA for its collaboration in this study.
Conflicts of Interest
The authors declare no conflict of interest.
Abbreviations
The following abbreviations are used in this manuscript:
| AL | Assembly line |
| DES | Discrete events simulation |
| FWAL | Fixed-worker assembly line |
| PWWAL | Parallel walking-worker assembly line |
| QC | Quality control |
| WIP | Work in process |
| WWAL | Walking-worker assembly line |
References
- Hu, S.J. Evolving paradigms of manufacturing: From mass production to mass customization and personalization. Procedia Cirp 2013, 7, 3–8. [Google Scholar] [CrossRef]
- Yin, Y.; Stecke, K.E.; Li, D. The evolution of production systems from Industry 2.0 through Industry 4.0. Int. J. Prod. Res. 2018, 56, 848–861. [Google Scholar] [CrossRef]
- Koren, Y. The Global Manufacturing Revolution, 2nd ed.; John Wiley & Sons Ltd.: Hoboken, NJ, USA, 2010. [Google Scholar]
- ElMaraghy, H.; Monostori, L.; Schuh, G.; ElMaraghy, W. Evolution and future of manufacturing systems. CIRP Ann. 2021, 70, 635–658. [Google Scholar] [CrossRef]
- Mourtzis, D.; Doukas, M. Design and Planning of Manufacturing Networks for Mass Customisation and Personalisation: Challenges and Outlook. Procedia CIRP 2014, 19, 1–13. [Google Scholar] [CrossRef]
- Wang, Y.; Ma, H.S.; Yang, J.H.; Wang, K.S. Industry 4.0: A way from mass customization to mass personalization production. Adv. Manuf. 2017, 5, 311–320. [Google Scholar] [CrossRef]
- Hudson, S.; McNamara, T.; Shaaban, S. Unbalanced lines: Where are we now? Int. J. Prod. Res. 2015, 53, 1895–1911. [Google Scholar] [CrossRef]
- Hu, S.; Ko, J.; Weyand, L.; Elmaraghy, H.; Lien, T.; Koren, Y.; Bley, H.; Chryssolouris, G.; Nasr, N.; Shpitalni, M. Assembly system design and operations for product variety. CIRP Ann. Manuf. Technol. 2011, 60, 715–733. [Google Scholar] [CrossRef]
- Modrak, V.; Marton, D.; Bednar, S. The Influence of Mass Customization Strategy on Configuration Complexity of Assembly Systems. Procedia CIRP 2015, 33, 538–543. [Google Scholar] [CrossRef]
- Bischak, D.P. Performance of a manufacturing module with moving workers. IIE Trans. Inst. Ind. Eng. 1996, 28, 723–733. [Google Scholar] [CrossRef]
- Wang, Q.; Owen, G.W.; Mileham, A.R. Comparison between fixed- and walking-worker assembly lines. Proc. Inst. Mech. Eng. Part B J. Eng. Manuf. 2005, 219, 845–848. [Google Scholar] [CrossRef]
- Lassalle, S.; Wang, Q.; Owen, G.W.; Mileham, A.R. A study of in-process waiting time on a linear walking worker assembly line. Proc. Inst. Mech. Eng. Part B J. Eng. Manuf. 2007, 221, 1763–1770. [Google Scholar] [CrossRef]
- Wang, Q.; Lassalle, S.; Mileham, A.R.; Owen, G.W. Analysis of a linear walking worker line using a combination of computer simulation and mathematical modeling approaches. J. Manuf. Syst. 2009, 28, 64–70. [Google Scholar] [CrossRef]
- Lusa, A. A survey of the literature on the multiple or parallel assembly line balancing problem. Eur. J. Ind. Eng. 2008, 2, 50–72. [Google Scholar] [CrossRef]
- Tiacci, L. Simultaneous balancing and buffer allocation decisions for the design of mixed-model assembly lines with parallel workstations and stochastic task times. Int. J. Prod. Econ. 2015, 162, 201–215. [Google Scholar] [CrossRef]
- Seleim, A.; Azab, A.; AlGeddawy, T. Simulation methods for changeable manufacturing. Procedia CIRP 2012, 3, 179–184. [Google Scholar] [CrossRef]
- Suri, R. An overview of evaluative models for flexible manufacturing systems. Ann. Oper. Res. 1985, 3, 13–21. [Google Scholar] [CrossRef]
- Yadav, A.; Jayswal, S.C. Modelling of flexible manufacturing system: A review. Int. J. Prod. Res. 2018, 56, 2464–2487. [Google Scholar] [CrossRef]
- Wang, Q.; Chatwin, C. Key issues and developments in modelling and simulation-based methodologies for manufacturing systems analysis, design and performance evaluation. Int. J. Adv. Manuf. Technol. 2005, 25, 1254–1265. [Google Scholar] [CrossRef]
- Al-Zuheri, A.; Luong, L.; Xing, K. Prediction and analysis impact of operational design of a manual assembly system with walking workers on performance. Int. J. Comput. Integr. Manuf. 2013, 26, 540–560. [Google Scholar] [CrossRef]
- Cevikcan, E. An optimization methodology for multi model walking-worker assembly systems: An application from busbar energy distribution systems. Assem. Autom. 2016, 36, 439–459. [Google Scholar] [CrossRef]
- Bortolini, M.; Faccio, M.; Galizia, F.; Gamberi, M.; Pilati, F. Walking Workers systems: A sequence analysis for flexible mixed model lines. IFAC-PapersOnLine 2021, 54, 601–606. [Google Scholar] [CrossRef]
- Hashemi-Petroodi, S.E.; Dolgui, A.; Kovalev, S.; Kovalyov, M.Y.; Thevenin, S. Workforce reconfiguration strategies in manufacturing systems: A state of the art. Int. J. Prod. Res. 2020, 59, 6721–6744. [Google Scholar] [CrossRef]
- Boysen, N.; Fliedner, M.; Scholl, A. A classification of assembly line balancing problems. Eur. J. Oper. Res. 2007, 183, 674–693. [Google Scholar] [CrossRef]
- Banks, J.; Chwif, L. Warnings about simulation. J. Simul. 2011, 5, 279–291. [Google Scholar] [CrossRef]
Figure 1.
DES models for flexible assembly line configurations: (1) manual fixed-worker line (manual FWAL); (2) semiautomatic fixed-worker line (semiauto FWAL); (3) semiautomatic single walking worker line (semiauto singleWWAL); (4) parallel walking-worker assembly line (PWWAL). Design parameters are changed when analyzing the performance of assembly line configurations. Fixed parameters are based on industrial study case data. Variability of quality, manual assembly, and setup times are considered disturbances. Model output includes relevant KPIs for evaluation.
Figure 2.
Operator–automated station interaction in semiautomated walking-worker assembly line. (a) Operator processes unit in a manual station. (b) Operator leaves unit on the automated station in buffer. (c) Operator takes ready unit from the automated station out buffer and moves to the next manual station to continue assembly.
Figure 3.
Line productivity increase of semiautomated FW and parallel walking-worker with respect to manual FW line configuration under standard demand conditions (scenario i).
Figure 3.
Line productivity increase of semiautomated FW and parallel walking-worker with respect to manual FW line configuration under standard demand conditions (scenario i).
Figure 4.
Line productivity improvement of semiautomated FW and parallel walking-worker with respect to manual FW line configuration for reduced batch size (Q, scenario ii).
Figure 4.
Line productivity improvement of semiautomated FW and parallel walking-worker with respect to manual FW line configuration for reduced batch size (Q, scenario ii).
Figure 5.
Line productivity improvement of semiautomated FW and parallel walking-worker with respect to manual FW line configuration for reduced no. of batches until product family changeovers (, scenario iii).
Figure 5.
Line productivity improvement of semiautomated FW and parallel walking-worker with respect to manual FW line configuration for reduced no. of batches until product family changeovers (, scenario iii).
Figure 6.
Line productivity improvement of semiautomated FW and parallel walking-worker with respect to manual FW line configuration for reduced no. of workers (W, scenario iv).
Figure 6.
Line productivity improvement of semiautomated FW and parallel walking-worker with respect to manual FW line configuration for reduced no. of workers (W, scenario iv).
Figure 7.
Line productivity improvement of semiautomated FW and parallel walking-worker with respect to manual FW line configuration under high-mix low-volume demand conditions (scenario v).
Figure 7.
Line productivity improvement of semiautomated FW and parallel walking-worker with respect to manual FW line configuration under high-mix low-volume demand conditions (scenario v).
Figure 8.
Performance of semiautomated FW and parallel walking-worker line configurations, for different number of manual workers, under standard and high-mix low-volume demand conditions (scenario v): (a) line productivity (), (b) throughput ().
Figure 8.
Performance of semiautomated FW and parallel walking-worker line configurations, for different number of manual workers, under standard and high-mix low-volume demand conditions (scenario v): (a) line productivity (), (b) throughput ().
Table 1.
Key aspects of selected research articles on walking-worker assembly lines (WWALs).
Table 1.
Key aspects of selected research articles on walking-worker assembly lines (WWALs).
| Author | Layout | Target | Method | Product | Setup | Walking Time | Automated Stations | Variability |
|---|
| Bischak [10] | U-cell | Max throughput | Simulation | Single-model | No | Negligible | No | Yes |
| Wang [11] | Linear | Max throughput & line productivity | Simulation | Single-model | No | Yes | | |
| Lassalle [12] | Linear | In-process waiting time | Simulation | Mixed-model | No | Negligible | No | Yes |
| Wang [13] | Linear | In-process waiting time | Simulation & mathematical modeling | Single-model | No | Negligible | No | Simulation only |
| Al-Zuheri [20] | U-cell | Line productivity & ergonomic perf. | Mathematical modeling | Single-model | No | Yes | No | Yes |
| Cevikcan [21] | Segmented rabbit-chase | Line balancing | Mathematical modeling | Mixed-model | No | Yes | No | No |
| Bortolini [22] | U-cell | Max line productivity | Simulation | Mixed-model | No | Negligible | No | Yes |
Table 6.
Production sequence input data.
Table 6.
Production sequence input data.
| Sequence (Batches of Q Units) |
|---|
| 1 | | | | ⥀ | | | | | | |
| 2 | | | | | | | ⥀ | | | |
| 3 | | | | | | | | | | ⥀ |
Table 7.
Shopfloor surface requirements for different assembly line configurations.
Table 7.
Shopfloor surface requirements for different assembly line configurations.
| Configuration | Depth (m) | Length (m) | Shopfloor Surface (m2) |
|---|
| Manual FWAL | 4 | 16 | 64 |
| Semiautomated FWAL | 4 | 23 | 92 |
| Single WWAL | 5 | 33 | 165 |
| Parallel WWAL | 10 | 33 | 330 |
Table 8.
Simulation scenarios and design parameters analyzed.
Table 8.
Simulation scenarios and design parameters analyzed.
| Scenario | W (Operators) | Q (Units) | (Batches) |
|---|
| i. Standard demand | 8 | 48 | 3 |
| ii. High-mix (1) | 8 | | 3 |
| iii. High-mix (2) | 8 | 48 | |
| iv. Low-volume | | 48 | 3 |
| v. High-mix low-volume | 8 | 12 | 1 |
| vi. Degree of automation | | | |
Table 9.
Operational KPIs for manual FWAL, semiautomated FWAL, semiautomated single WWAL, and parallel walking-worker assembly line configurations under standard demand conditions (scenario i).
Table 9.
Operational KPIs for manual FWAL, semiautomated FWAL, semiautomated single WWAL, and parallel walking-worker assembly line configurations under standard demand conditions (scenario i).
| | | | Manual | Semiauto | Semiauto Single WWAL | |
|---|
| KPI | Units | Goal | FWAL | FWAL | | | | | | PWWAL |
|---|
| u/oper-h | ↗ | 3.19 | 3.98 | 3.48 | 3.70 | 3.93 | 4.03 | 4.28 | 4.23 |
| min | ↘ | 132 | 111 | 138 | 145 | 156 | 176 | 200 | 203 |
| u/h | ↗ | 25.5 | 31.9 | 27.9 | 25.9 | 23.6 | 20.1 | 17.1 | 33.8 |
| % | ↗ | 87.0 | 83.3 | 71.6 | 75.7 | 79.3 | 82.9 | 85.6 | 85.6 |
| min | ↘ | 20.5 | 23.4 | 25.4 | 25.0 | 26.3 | 20.1 | 27.5 | 27.9 |
| u/oper-h-m2 | ↗ | 0.050 | 0.043 | 0.021 | 0.022 | 0.024 | 0.024 | 0.026 | 0.013 |
Table 10.
Operational KPIs of manual FWAL, semiautomatic FWAL, and PWWAL for reduced batch size (Q, scenario ii), reduced no. of batches until product family changeovers (, scenario iii), and reduced no. of workers (W, scenario iv).
Table 10.
Operational KPIs of manual FWAL, semiautomatic FWAL, and PWWAL for reduced batch size (Q, scenario ii), reduced no. of batches until product family changeovers (, scenario iii), and reduced no. of workers (W, scenario iv).
| | | Batch Size, Q (Units) | (Batches) | W (Operators) |
|---|
| KPI | AL Configuration | 12 | 24 | 48 | 1 | 2 | 3 | 2 | 4 | 8 |
|---|
| (u/oper-h) | Manual FW | 2.73 | 3.04 | 3.19 | 3.19 | 3.20 | 3.19 | 3.60 | 3.45 | 3.19 |
| | Semiauto. FW | 3.07 | 3.64 | 3.98 | 3.91 | 3.97 | 3.98 | - | - | 3.98 |
| | PWW | 3.56 | 3.97 | 4.23 | 4.14 | 4.18 | 4.23 | 4.45 | 4.42 | 4.23 |
| (min) | Manual FW | 50 | 77 | 132 | 131 | 131 | 132 | 416 | 225 | 132 |
| | Semiauto. FW | 51 | 70 | 111 | 112 | 111 | 111 | - | - | 111 |
| | PWW | 73 | 124 | 203 | 209 | 206 | 203 | 704 | 366 | 203 |
| (u/h) | Manual FW | 21.9 | 24.4 | 25.5 | 25.5 | 25.6 | 25.5 | 7.2 | 13.8 | 25.5 |
| | Semiauto. FW | 24.5 | 29.1 | 31.9 | 31.3 | 31.8 | 31.9 | - | - | 31.9 |
| | PWW | 28.5 | 31.7 | 33.8 | 33.1 | 33.4 | 33.8 | 8.9 | 17.7 | 33.8 |
| (%) | Manual FW | 73.2 | 82.0 | 87.0 | 85.8 | 86.6 | 87.0 | 96.2 | 93.0 | 87.0 |
| | Semiauto. FW | 63.4 | 75.0 | 83.3 | 80.5 | 82.6 | 83.3 | - | - | 83.3 |
| | PWW | 72.9 | 80.9 | 85.6 | 85.0 | 85.6 | 85.6 | 90.9 | 90.2 | 85.6 |
| (min) | Manual FW | 18.5 | 19.4 | 20.5 | 20.1 | 20.3 | 20.5 | 18.8 | 19.7 | 20.5 |
| | semiauto. FW | 24.0 | 23.5 | 23.4 | 23.4 | 23.3 | 23.4 | - | - | 23.4 |
| | PWW | 33.2 | 29.7 | 27.9 | 28.5 | 28.2 | 27.9 | 66.6 | 40.1 | 27.9 |
| (u/oper-h-m2) | Manual FW | 0.043 | 0.048 | 0.050 | 0.050 | 0.050 | 0.050 | 0.056 | 0.054 | 0.050 |
| | Semiauto. FW | 0.033 | 0.040 | 0.043 | 0.043 | 0.043 | 0.043 | - | - | 0.043 |
| | PWW | 0.011 | 0.012 | 0.013 | 0.013 | 0.013 | 0.013 | 0.013 | 0.013 | 0.013 |
Table 11.
Operational KPIs for manual FWAL, semiautomated FWAL, and parallel walking-worker assembly line configurations under high-mix low-demand demand conditions (scenario v).
Table 11.
Operational KPIs for manual FWAL, semiautomated FWAL, and parallel walking-worker assembly line configurations under high-mix low-demand demand conditions (scenario v).
| KPI | Units | Manual FWAL | Semiauto FWAL | PWWAL |
|---|
| u/oper-h | 2.63 | 2.82 | 3.42 |
| min | 51 | 53 | 88 |
| u/h | 21.0 | 22.6 | 27.4 |
| % | 70.3 | 58.0 | 70.4 |
| min | 18.6 | 24.8 | 34.5 |
| u/oper-h-m2 | 0.041 | 0.031 | 0.010 |
Table 12.
Operational KPIs of semiautomated FWAL and PWWAL for varying degrees of automation and number of workers (W), under base or high-mix low-volume demand conditions (Q, ).
Table 12.
Operational KPIs of semiautomated FWAL and PWWAL for varying degrees of automation and number of workers (W), under base or high-mix low-volume demand conditions (Q, ).
| | | | Degree of Automation (%) |
|---|
| KPI | AL Configuration | W (Oper) | 10 | 20 | 23 | 30 | 40 | 50 |
|---|
| Standard Demand ( Units, Batches) |
| PWWAL | 4 | 3.89 | 4.29 | 4.42 | 4.78 | 5.55 | 5.04 |
| (u/oper-h) | | 6 | 3.81 | 4.21 | 4.34 | 4.64 | 4.23 | 3.38 |
| | | 8 | 3.66 | 4.10 | 4.23 | 4.12 | 3.19 | 2.54 |
| | Semiauto FWAL | 8 | 3.52 | 3.86 | 3.98 | 3.89 | 2.96 | 2.35 |
| PWWAL | 4 | 411 | 375 | 366 | 338 | 298 | 320 |
| (min) | | 6 | 290 | 261 | 254 | 239 | 258 | 321 |
| | | 8 | 232 | 209 | 203 | 208 | 260 | 327 |
| | Semiauto FWAL | 8 | 122 | 113 | 112 | 121 | 157 | 196 |
| PWWAL | 4 | 15.6 | 17.2 | 17.7 | 19.1 | 22.0 | 20.2 |
| (u/h) | | 6 | 22.8 | 25.3 | 26.0 | 27.8 | 25.4 | 20.3 |
| | | 8 | 29.3 | 32.8 | 33.8 | 33.0 | 25.6 | 20.3 |
| | Semiauto FWAL | 8 | 28.2 | 30.9 | 31.9 | 31.1 | 23.6 | 18.8 |
| PWWAL | 4 | 84.9 | 83.1 | 82.5 | 80.7 | 77.0 | 64.6 |
| (%) | | 6 | 80.9 | 78.6 | 77.8 | 74.6 | 62.3 | 44.6 |
| | | 8 | 74.8 | 71.7 | 70.4 | 64.6 | 49.3 | 33.7 |
| | Semiauto FWAL | 8 | 63.2 | 59.3 | 58.0 | 54.9 | 44.4 | 32.1 |
| PWWAL | 4 | 45.7 | 41.4 | 40.1 | 37.1 | 32.2 | 35.2 |
| (min) | | 6 | 36.2 | 32.7 | 31.7 | 29.7 | 32.6 | 40.9 |
| | | 8 | 32.2 | 28.7 | 27.9 | 28.6 | 37.0 | 46.8 |
| | Semiauto FWAL | 8 | 23.5 | 23.4 | 23.4 | 29.9 | 38.4 | 46.8 |
| PWWAL | 4 | 0.012 | 0.013 | 0.013 | 0.014 | 0.017 | 0.015 |
| (u/oper-h-m2) | | 6 | 0.012 | 0.013 | 0.013 | 0.014 | 0.013 | 0.010 |
| | | 8 | 0.011 | 0.012 | 0.013 | 0.012 | 0.010 | 0.008 |
| | Semiauto FWAL | 8 | 0.038 | 0.042 | 0.043 | 0.042 | 0.032 | 0.026 |
| High-Mix Low-Volume Demand ( Units, Batch) |
| PWWAL | 4 | 3.53 | 3.88 | 4.02 | 4.31 | 4.80 | 4.83 |
| (u/oper-h) | | 6 | 3.36 | 3.68 | 3.78 | 3.99 | 3.88 | 3.34 |
| | | 8 | 3.11 | 3.36 | 3.42 | 3.45 | 3.04 | 2.53 |
| | Semiauto FWAL | 8 | 2.63 | 2.77 | 2.82 | 2.94 | 2.76 | 2.41 |
| PWWAL | 4 | 151 | 137 | 133 | 124 | 112 | 110 |
| (min) | | 6 | 111 | 102 | 99 | 95 | 96 | 110 |
| | | 8 | 96 | 89 | 88 | 87 | 96 | 115 |
| | Semiauto FWAL | 8 | 56 | 54 | 54 | 55 | 63 | 75 |
| PWWAL | 4 | 14.1 | 15.5 | 16.1 | 17.3 | 19.2 | 19.3 |
| (u/h) | | 6 | 20.2 | 22.1 | 22.7 | 23.9 | 23.3 | 20.0 |
| | | 8 | 24.9 | 26.9 | 27.4 | 27.6 | 24.6 | 20.2 |
| | Semiauto FWAL | 8 | 21.0 | 22.2 | 22.6 | 23.5 | 22.1 | 19.2 |
| PWWAL | 4 | 84.9 | 83.1 | 82.5 | 80.7 | 77.0 | 64.6 |
| (%) | | 6 | 80.9 | 78.6 | 77.8 | 74.6 | 62.3 | 44.6 |
| | | 8 | 74.8 | 71.7 | 70.4 | 64.6 | 49.3 | 33.7 |
| | Semiauto FWAL | 8 | 63.2 | 59.3 | 58.0 | 54.9 | 44.4 | 32.1 |
| PWWAL | 4 | 50.5 | 45.8 | 44.3 | 41.2 | 37.0 | 36.8 |
| (min) | | 6 | 41.1 | 37.5 | 36.5 | 34.6 | 35.5 | 41.4 |
| | | 8 | 38.1 | 35.2 | 34.5 | 34.2 | 38.5 | 47.0 |
| | Semiauto FWAL | 8 | 25.1 | 24.9 | 24.8 | 25.7 | 30.7 | 38.7 |
| PWWAL | 4 | 0.011 | 0.012 | 0.012 | 0.013 | 0.015 | 0.015 |
| (u/oper-h-m2) | | 6 | 0.010 | 0.011 | 0.011 | 0.012 | 0.012 | 0.010 |
| | | 8 | 0.009 | 0.010 | 0.010 | 0.010 | 0.009 | 0.008 |
| | Semiauto FWAL | 8 | 0.029 | 0.030 | 0.031 | 0.032 | 0.030 | 0.026 |
| Disclaimer/Publisher’s Note: The statements, opinions and data contained in all publications are solely those of the individual author(s) and contributor(s) and not of MDPI and/or the editor(s). MDPI and/or the editor(s) disclaim responsibility for any injury to people or property resulting from any ideas, methods, instructions or products referred to in the content. |
© 2023 by the authors. Licensee MDPI, Basel, Switzerland. This article is an open access article distributed under the terms and conditions of the Creative Commons Attribution (CC BY) license (https://creativecommons.org/licenses/by/4.0/).


 ,
, 


