
TLC–Densitometric Analysis of Selected 5-Nitroimidazoles


Abstract
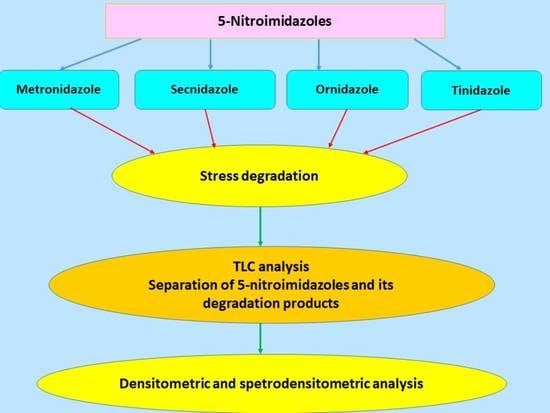
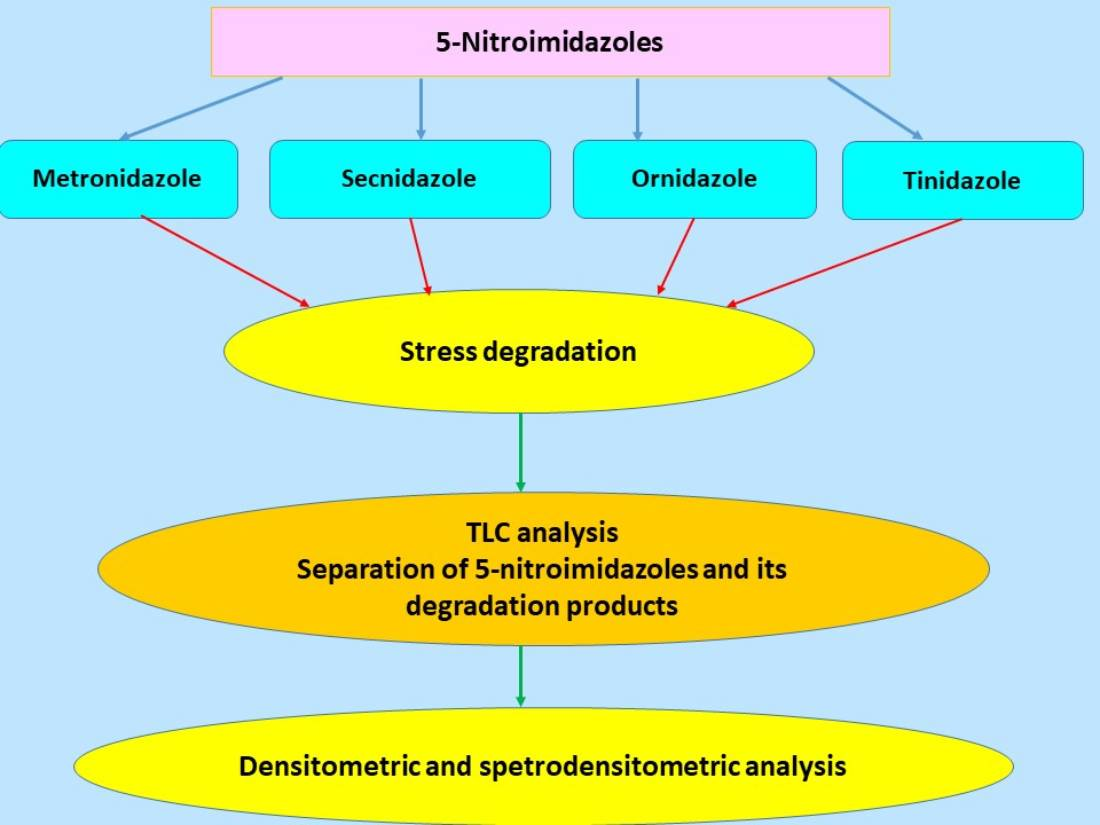
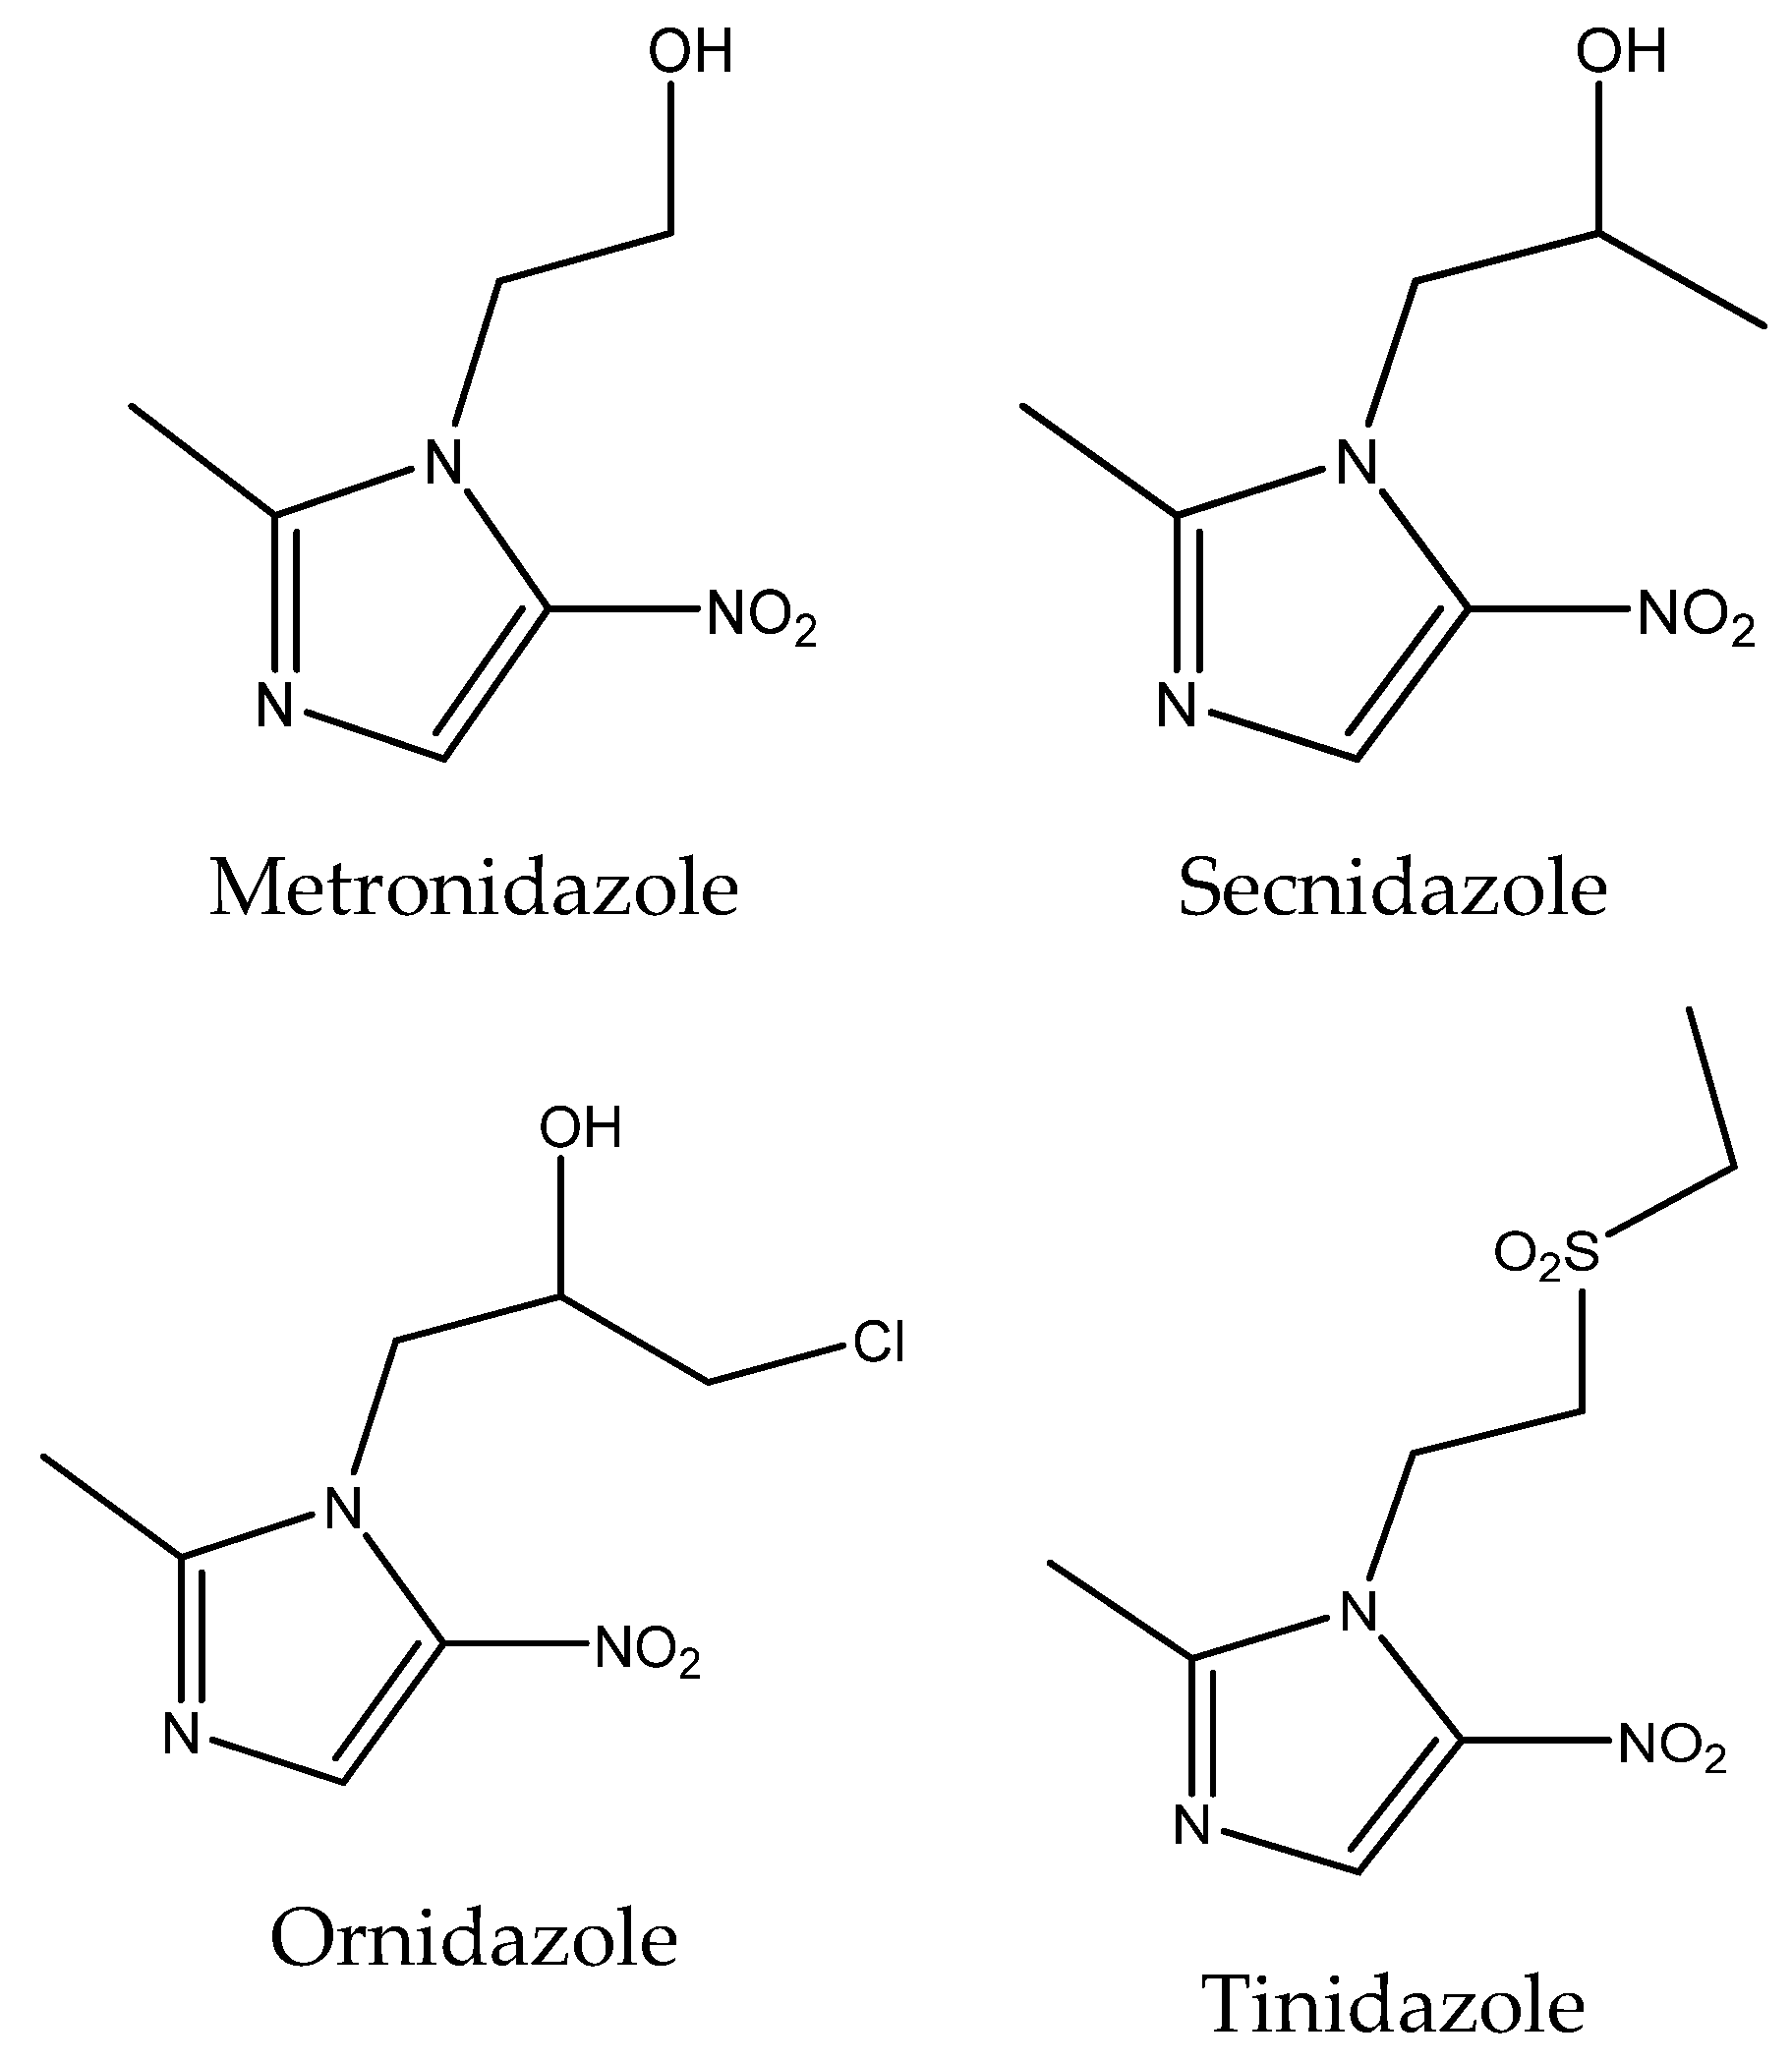
1. Introduction
2. Materials and Methods
2.1. Chemicals and Reagents
2.2. Preparation of Stock and Working Standard Solution
2.3. Chromatographic Conditions
2.4. Stability of Metronidazole, Secnidazole, Ornidazole, and Tinidazole
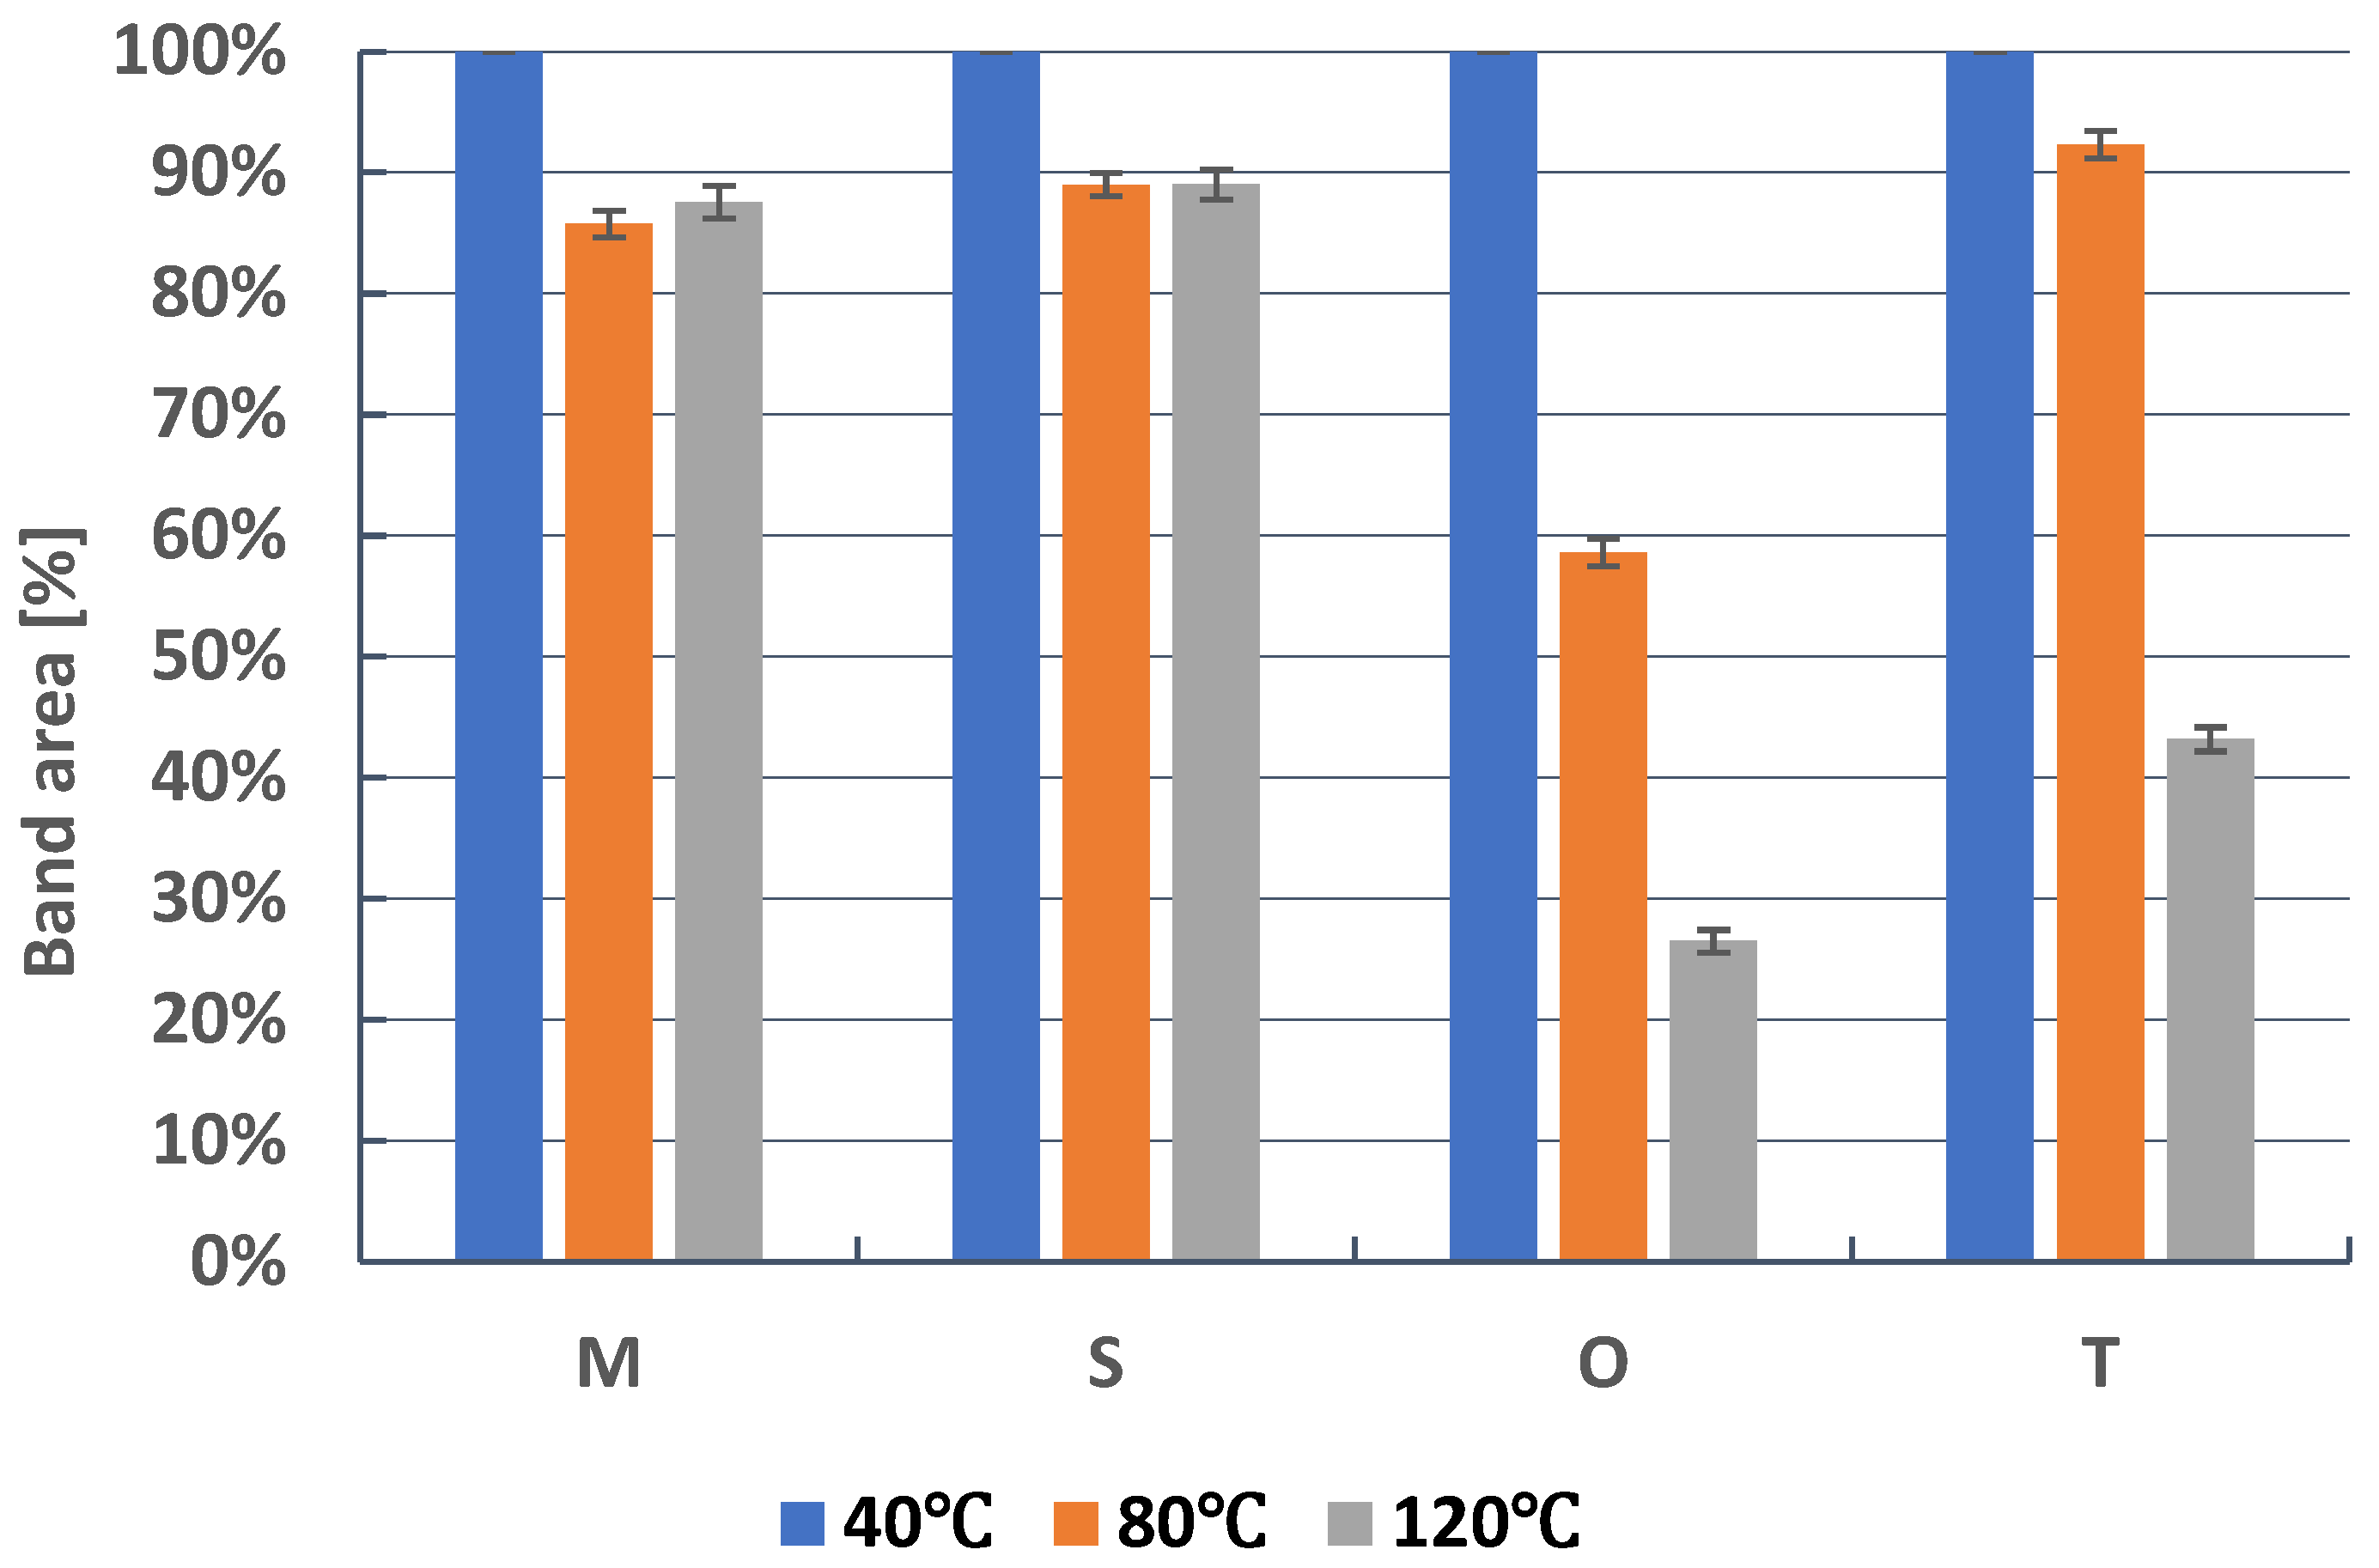
2.4.1. Effect of Temperature on the Chemical Stability of Metronidazole, Secnidazole, Ornidazole, and Tinidazole on Silica Gel
2.4.2. Effect of Temperature on the Chemical Stability of Metronidazole, Secnidazole, Ornidazole, and Tinidazole in Form of Various Solutions
2.5. Validation of Method
2.5.1. Linearity of Detector Response and Range
2.5.2. Accuracy
2.5.3. Precision
2.5.4. Limit of Detection (LOD) and Limit of Quantification (LOQ) Based on the Special Calibration Curve
2.6. Densitometric and Spectrodensitometric Analysis
2.7. Statistical Analysis
3. Results and Discussion
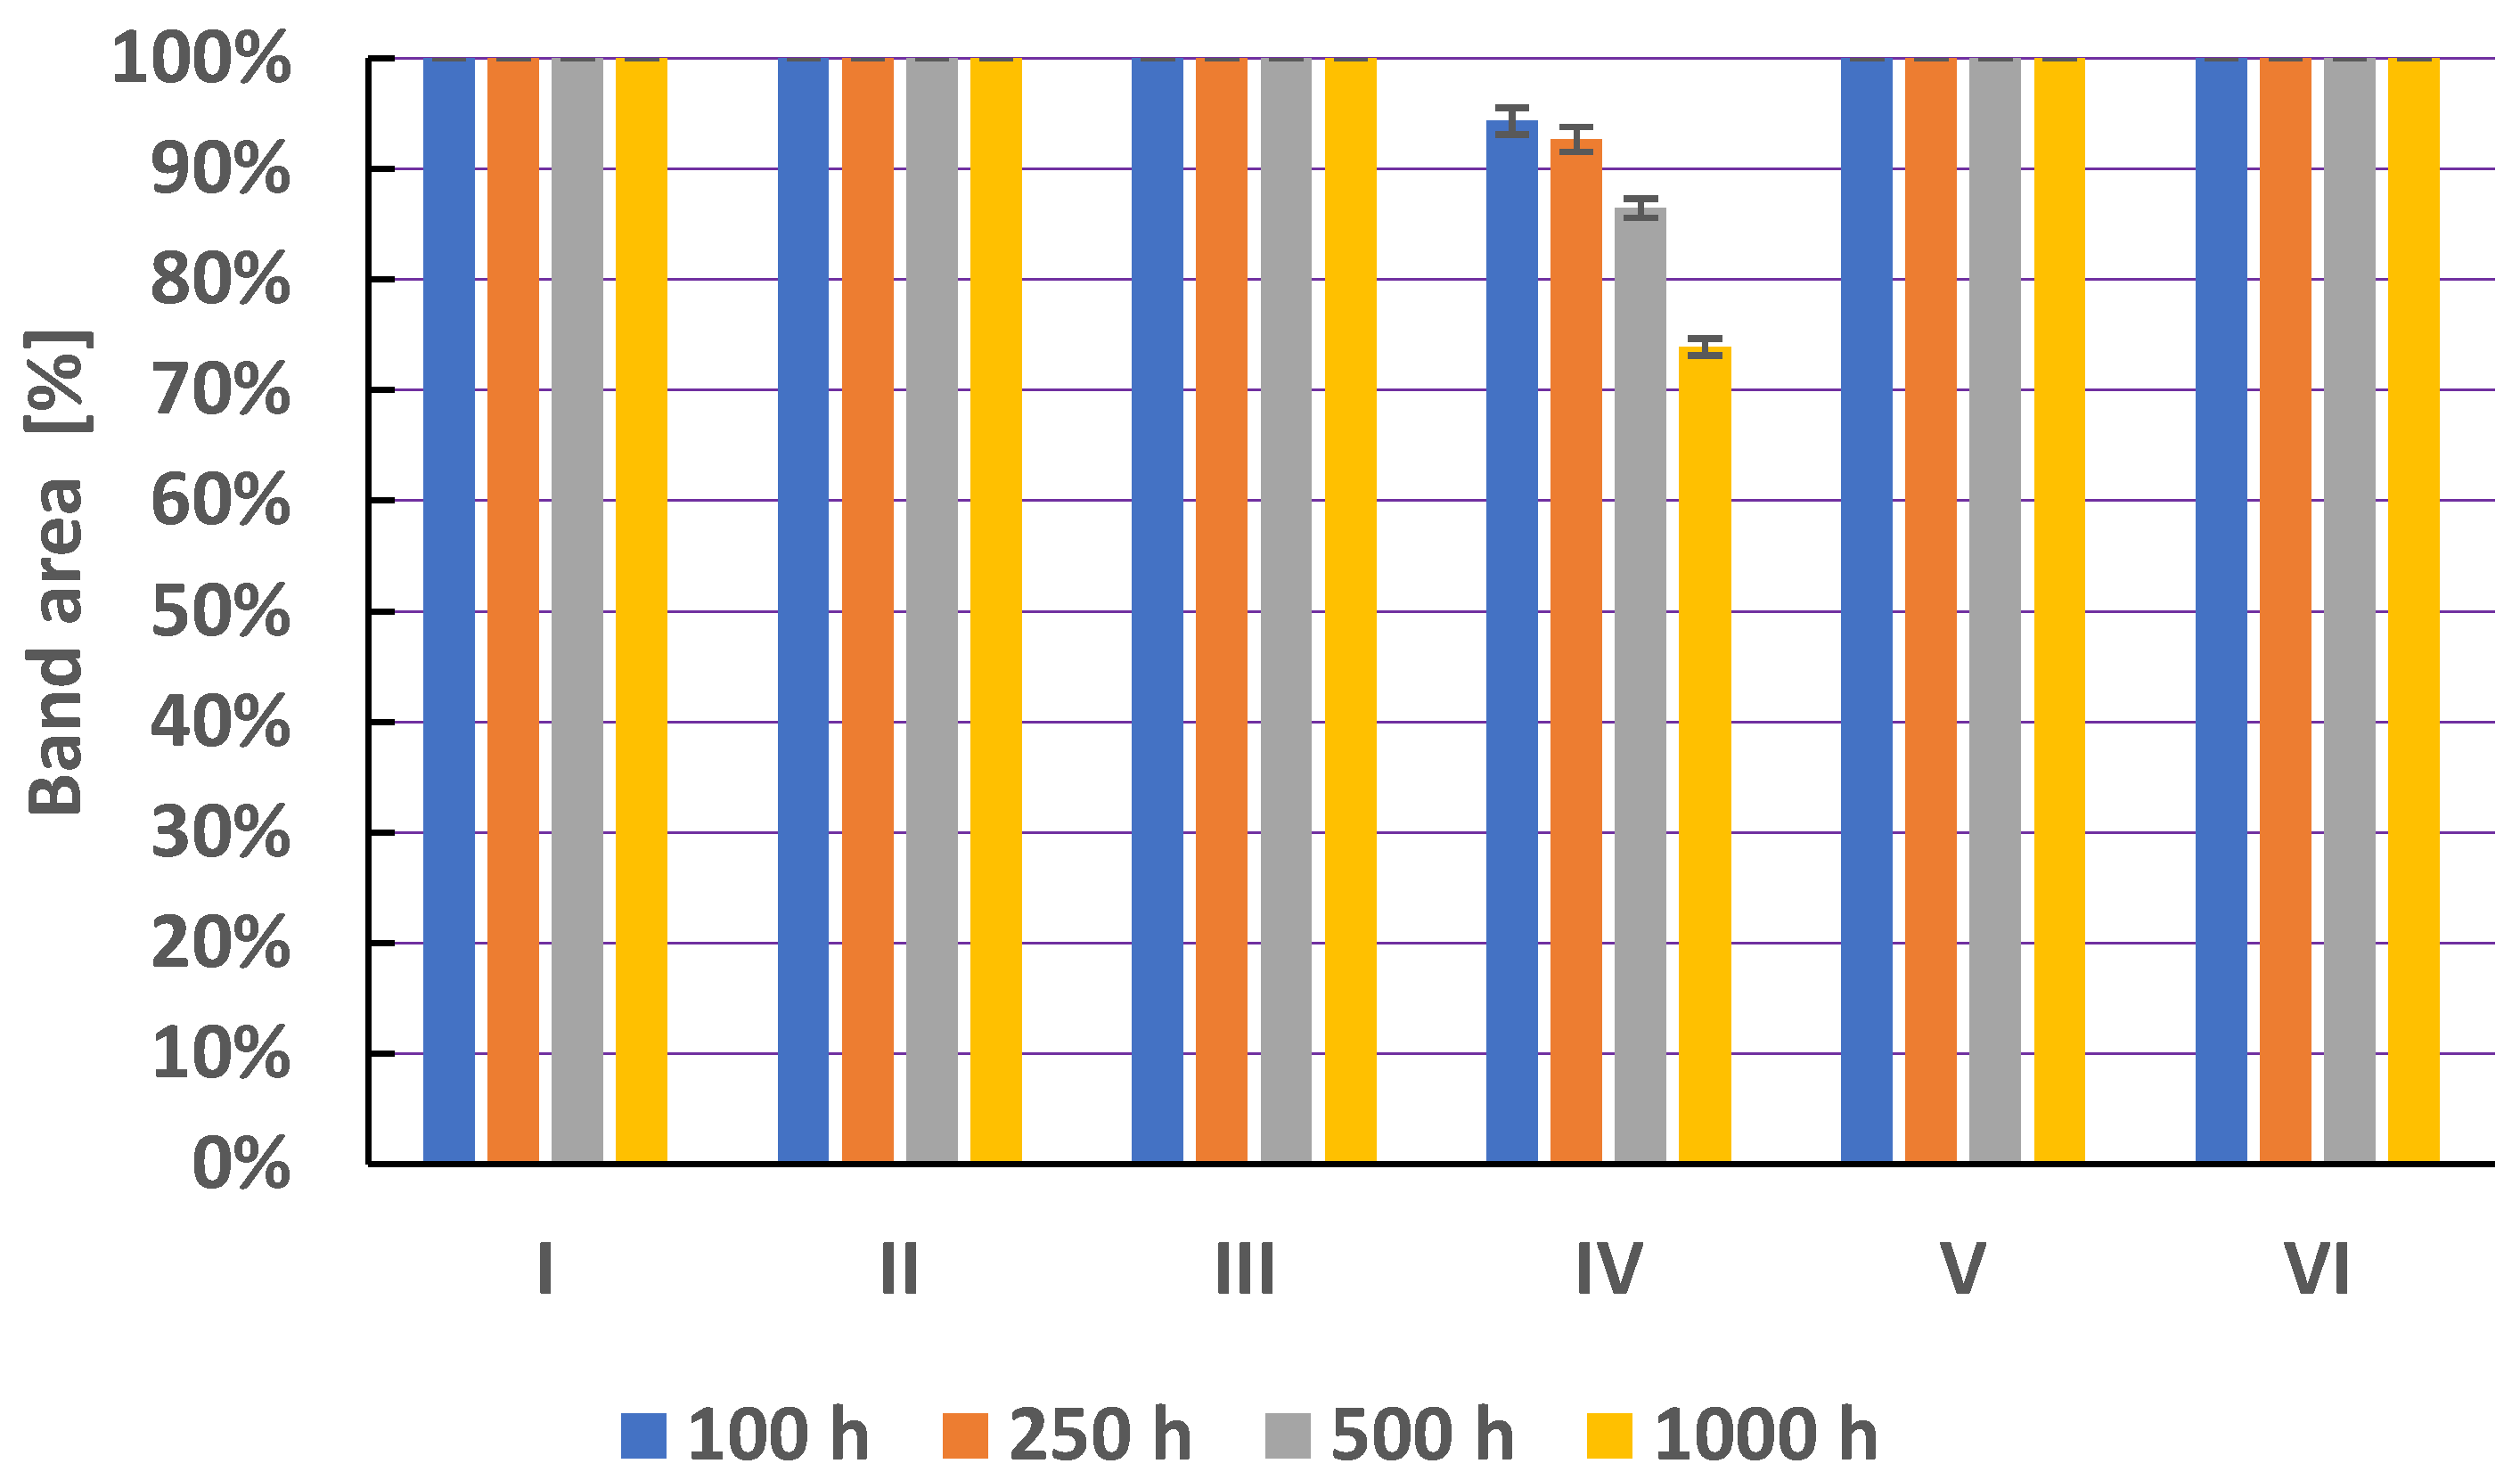
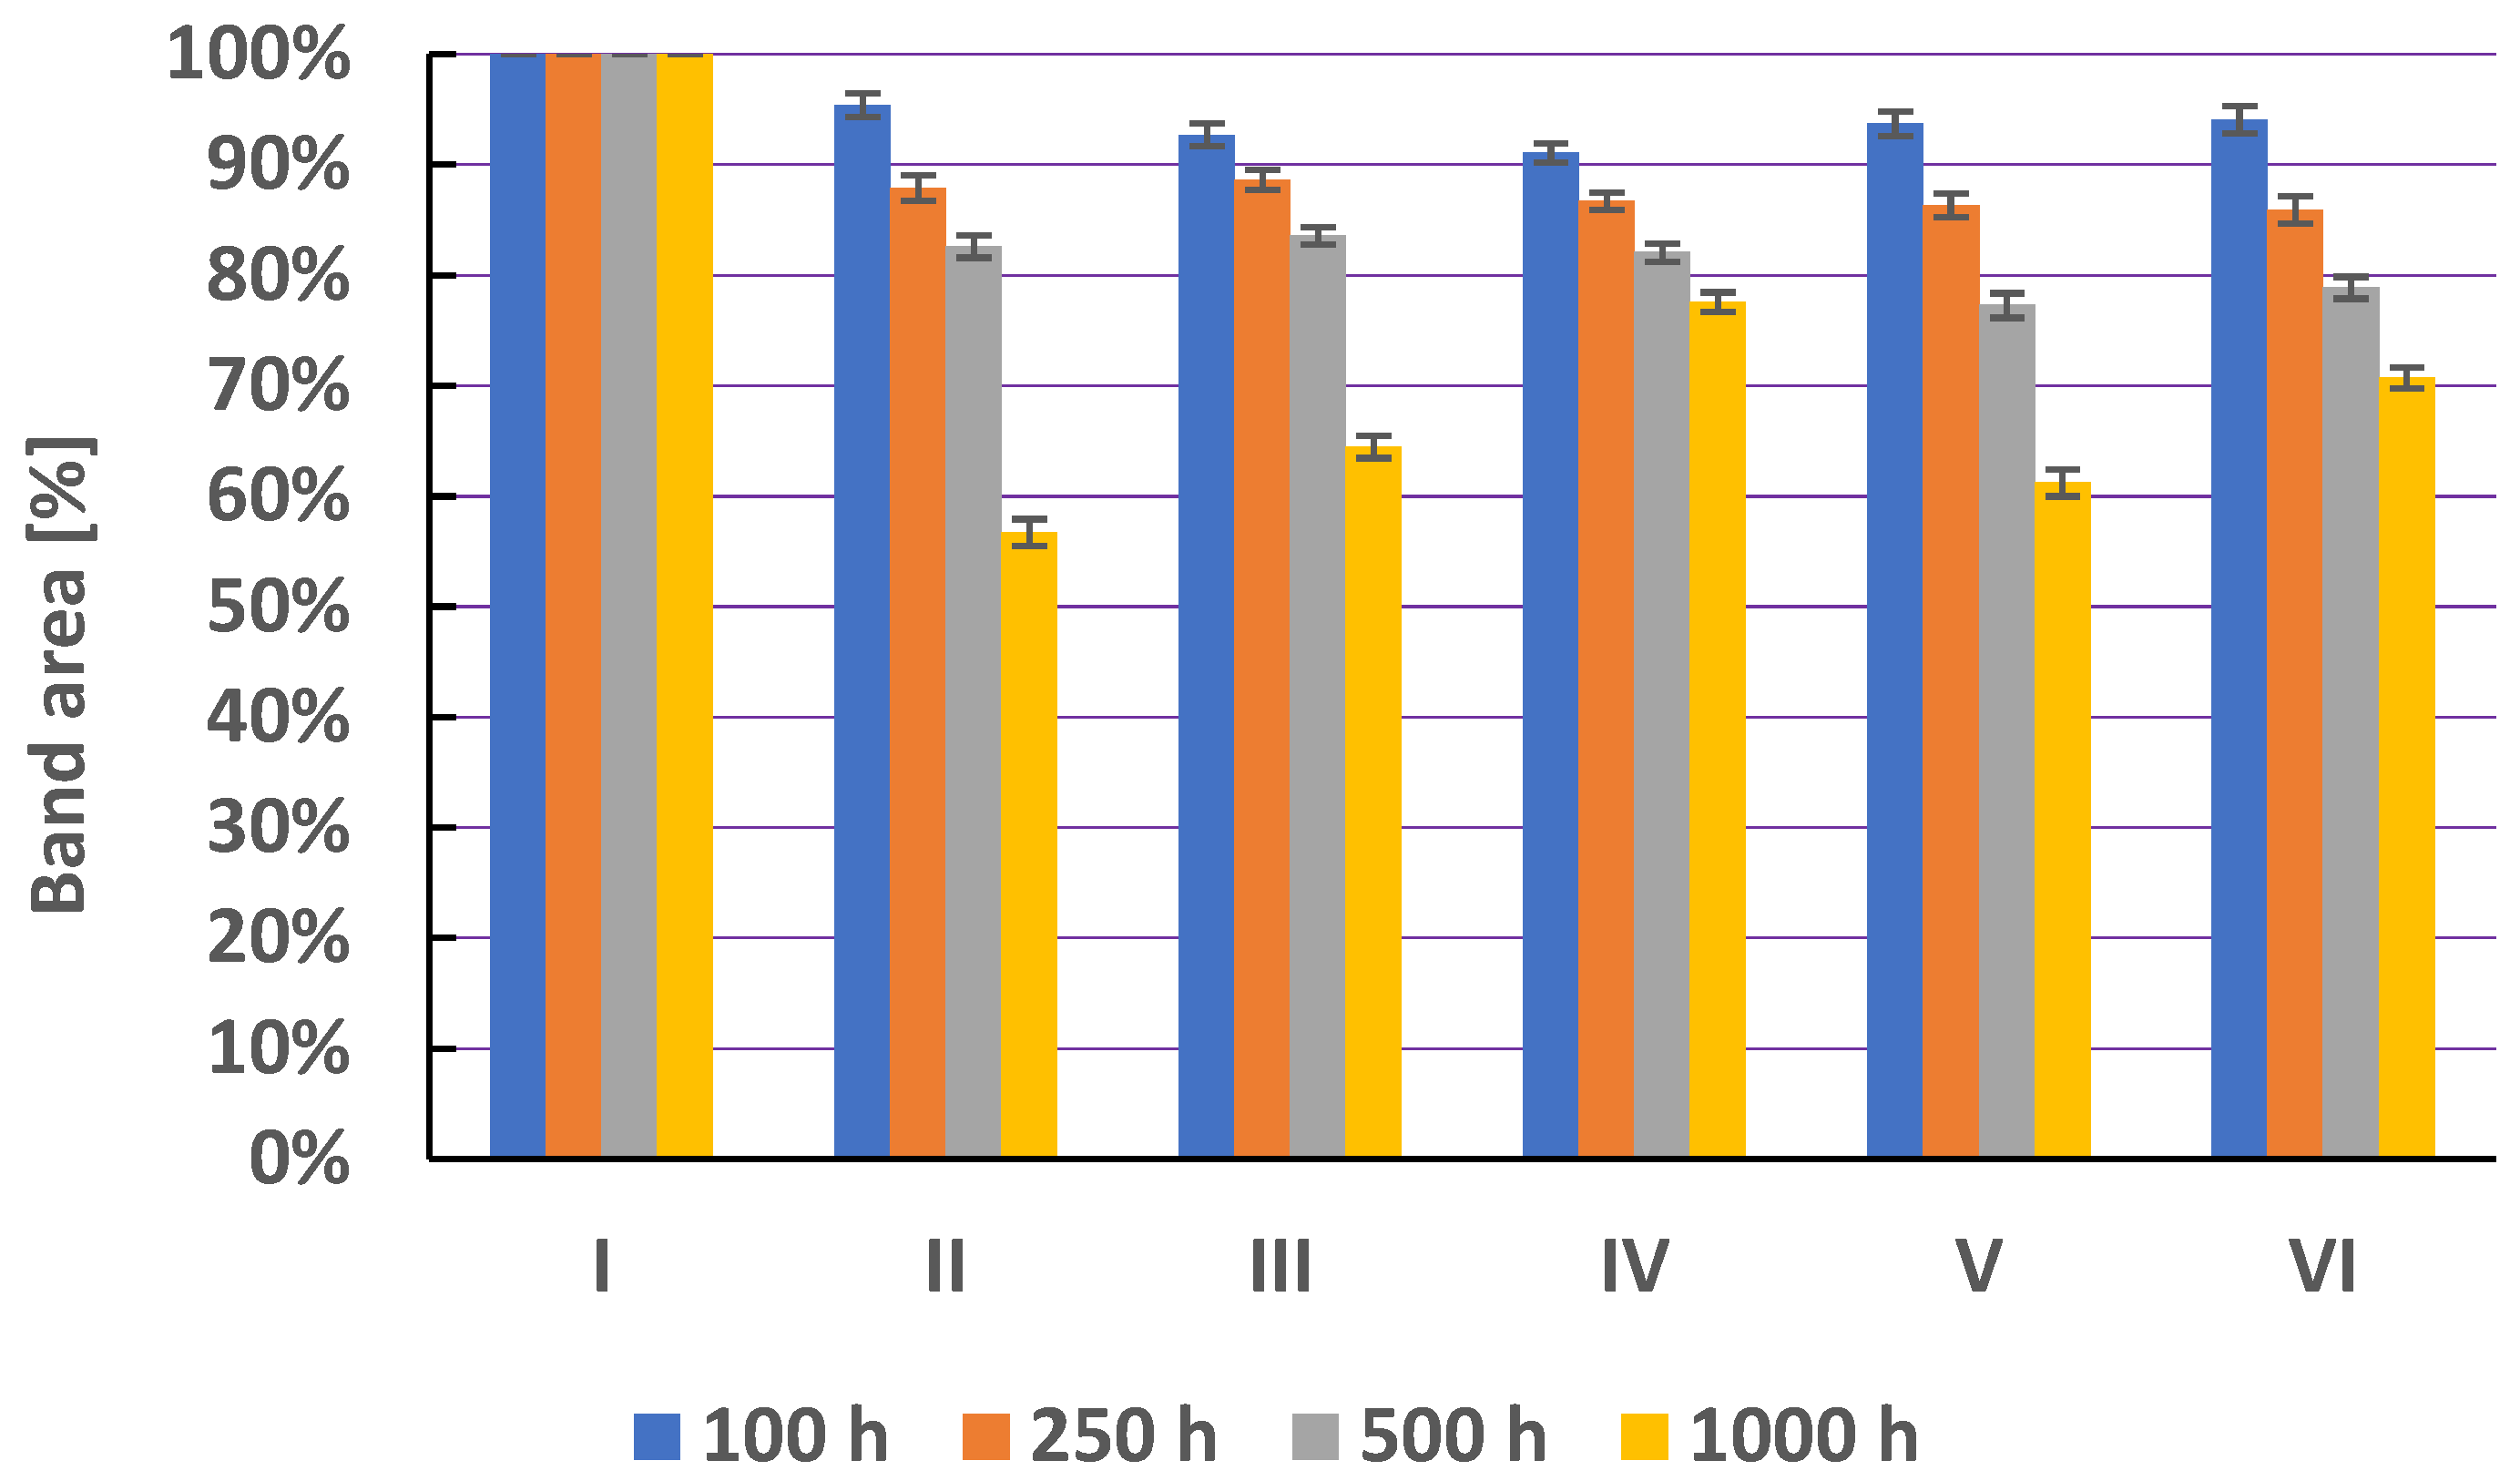
3.1. Effect of Temperature on the Chemical Stability of Metronidazole, Secnidazole, Ornidazole, and Tinidazole on Silica Gel
3.2. Effect of Temperature on the Chemical Stability of Metronidazole, Secnidazole, Ornidazole, and Tinidazole in Form of Various Solutions
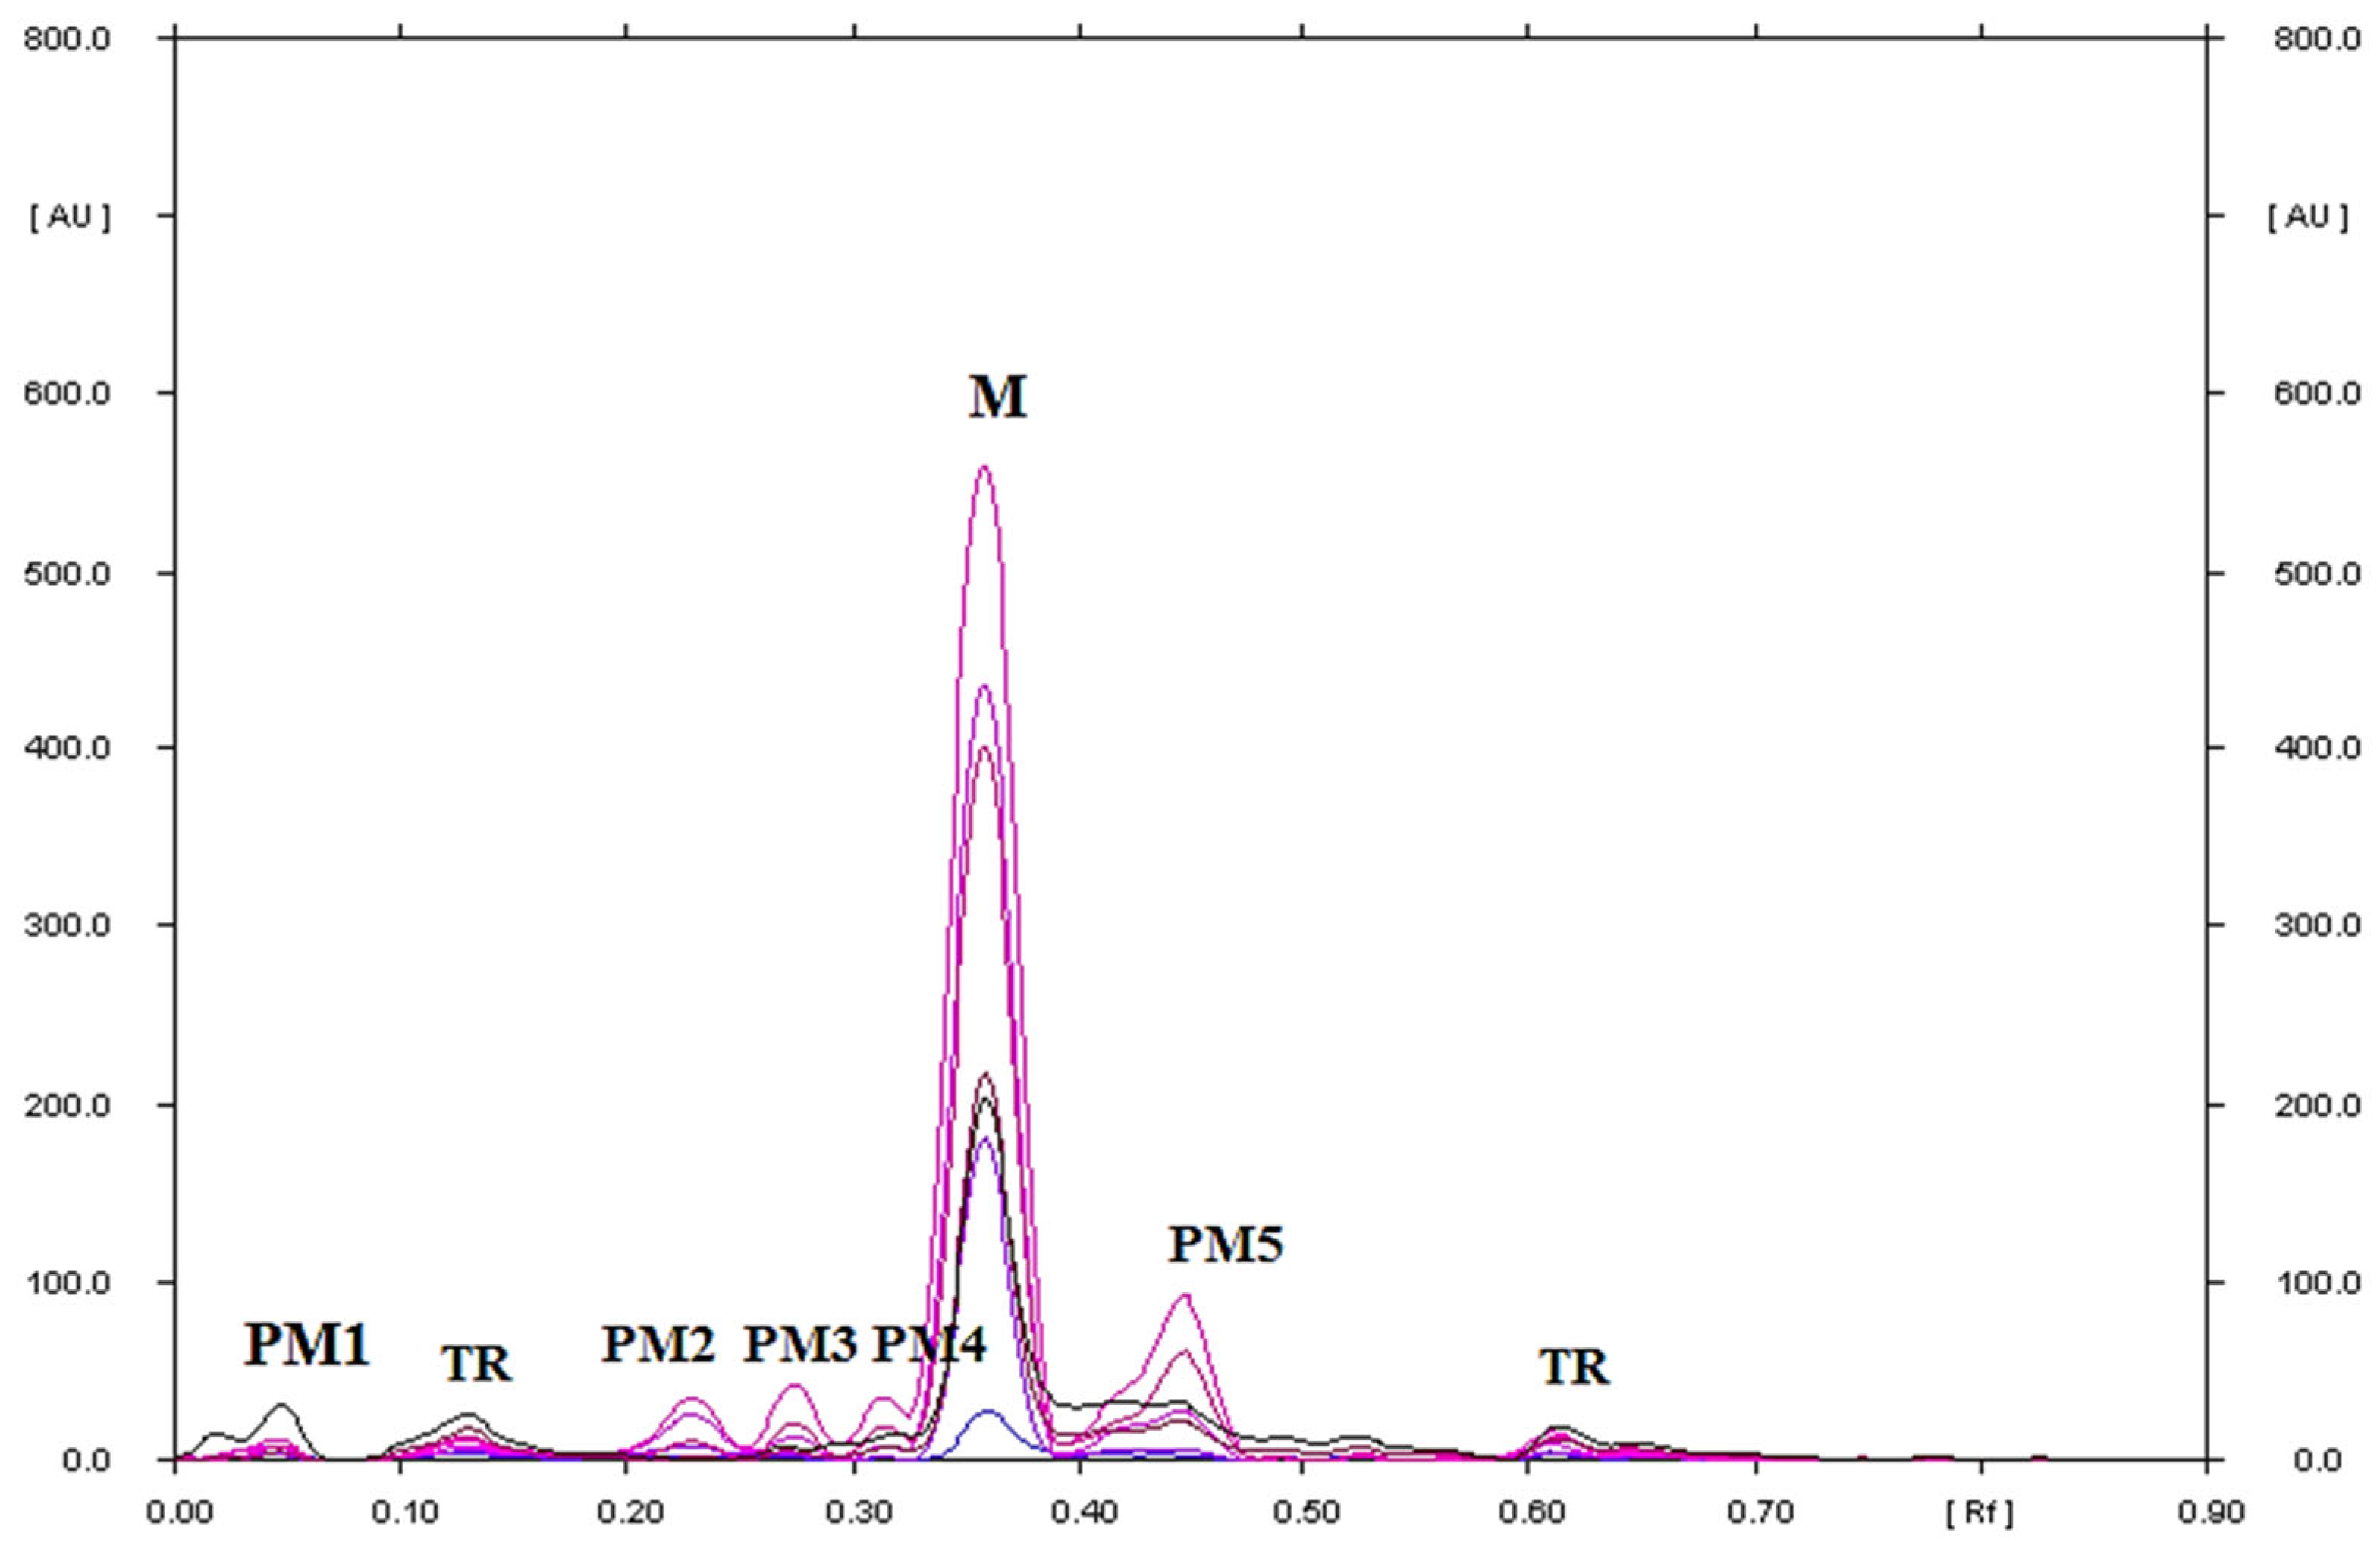
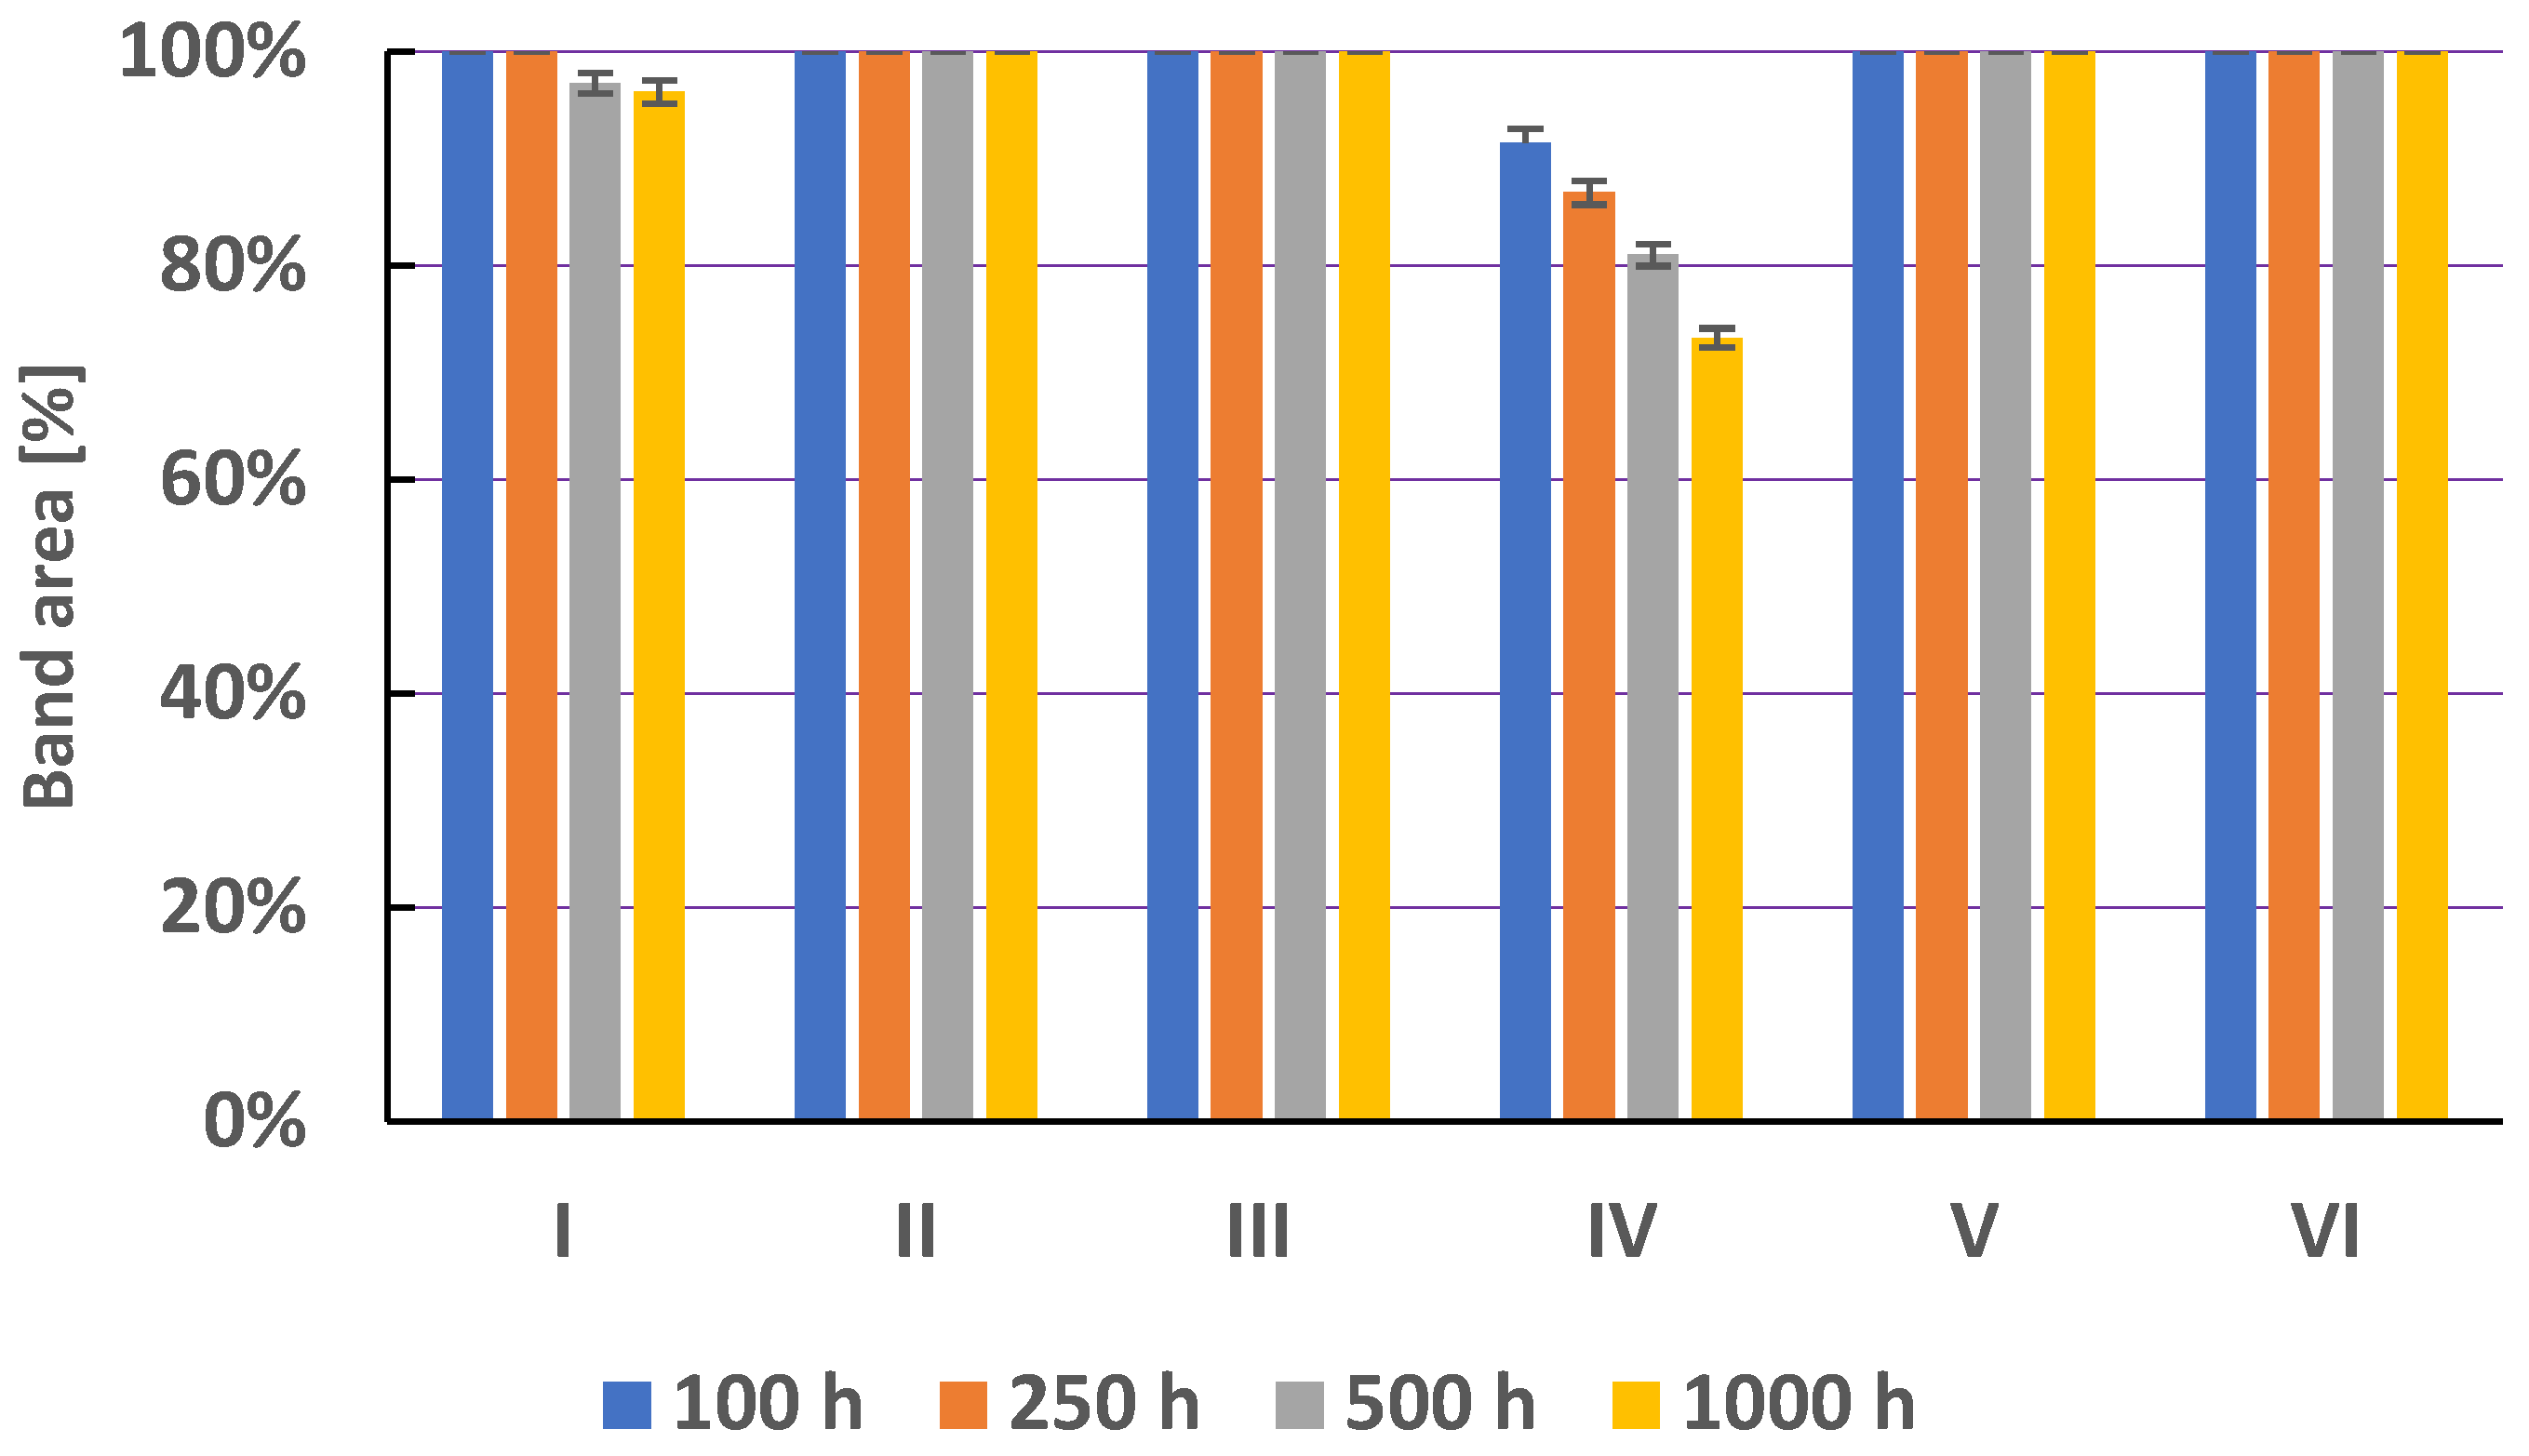
3.2.1. Stability of Metronidazole in Solutions
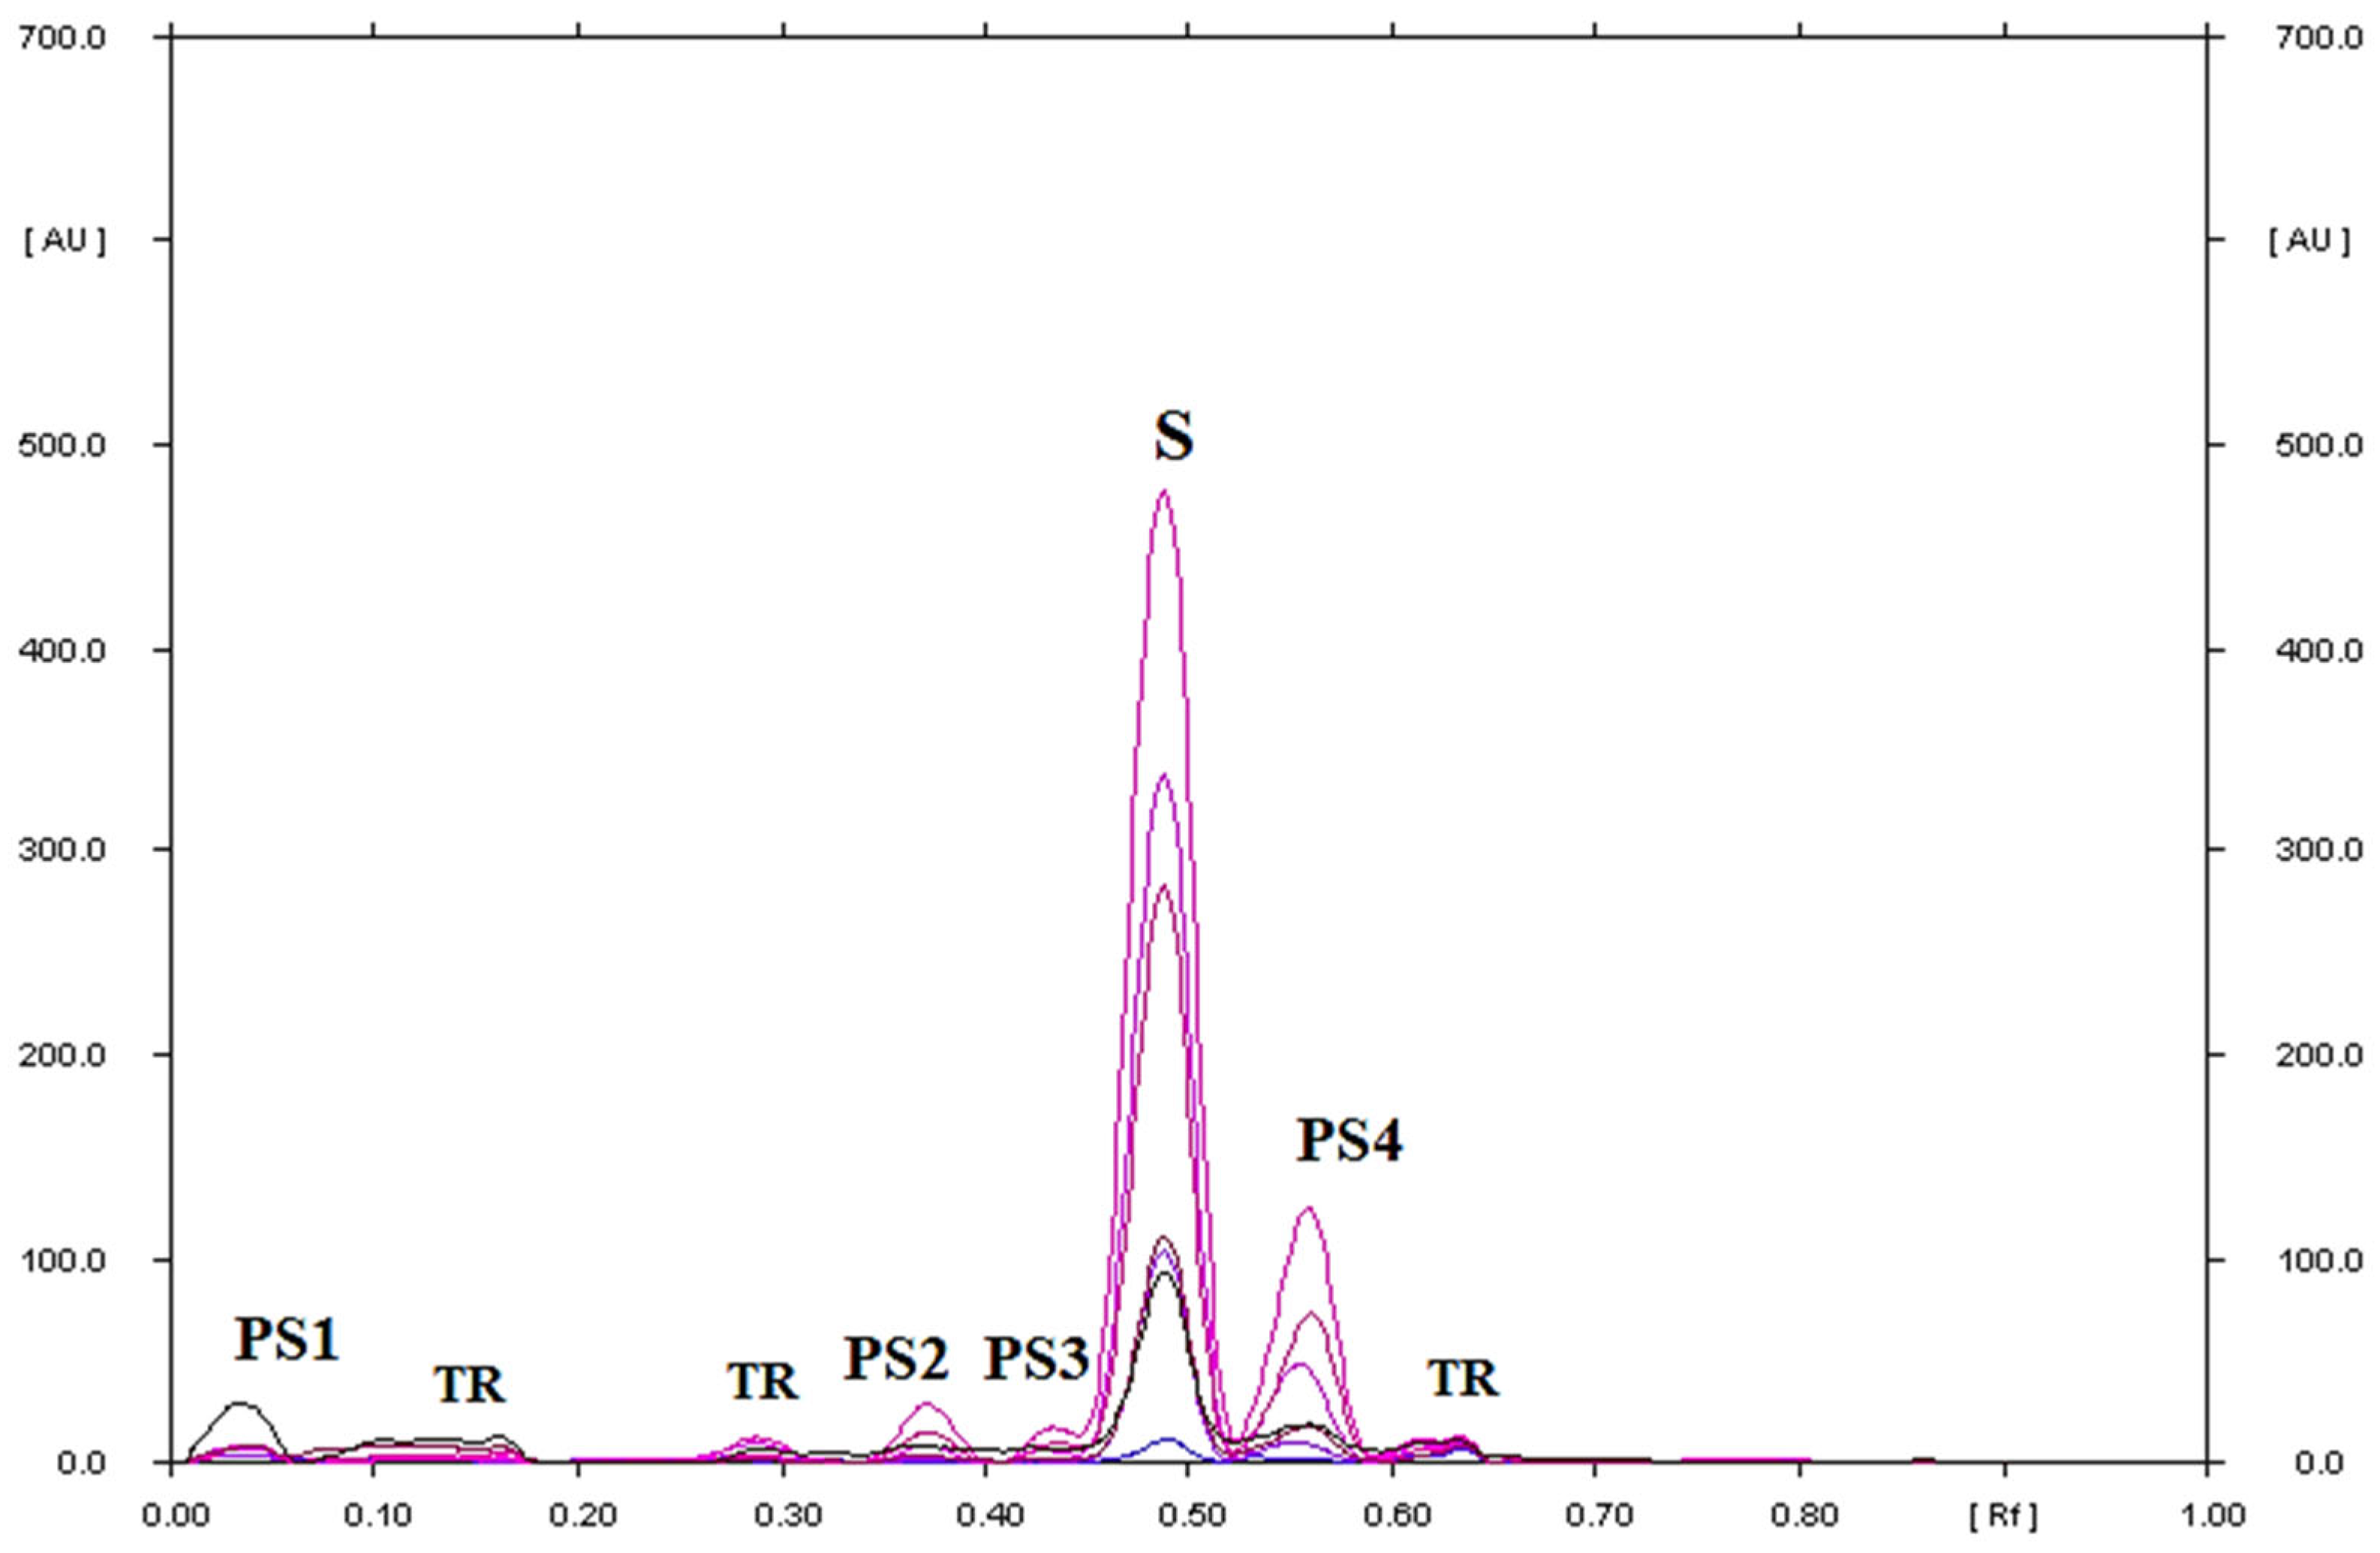
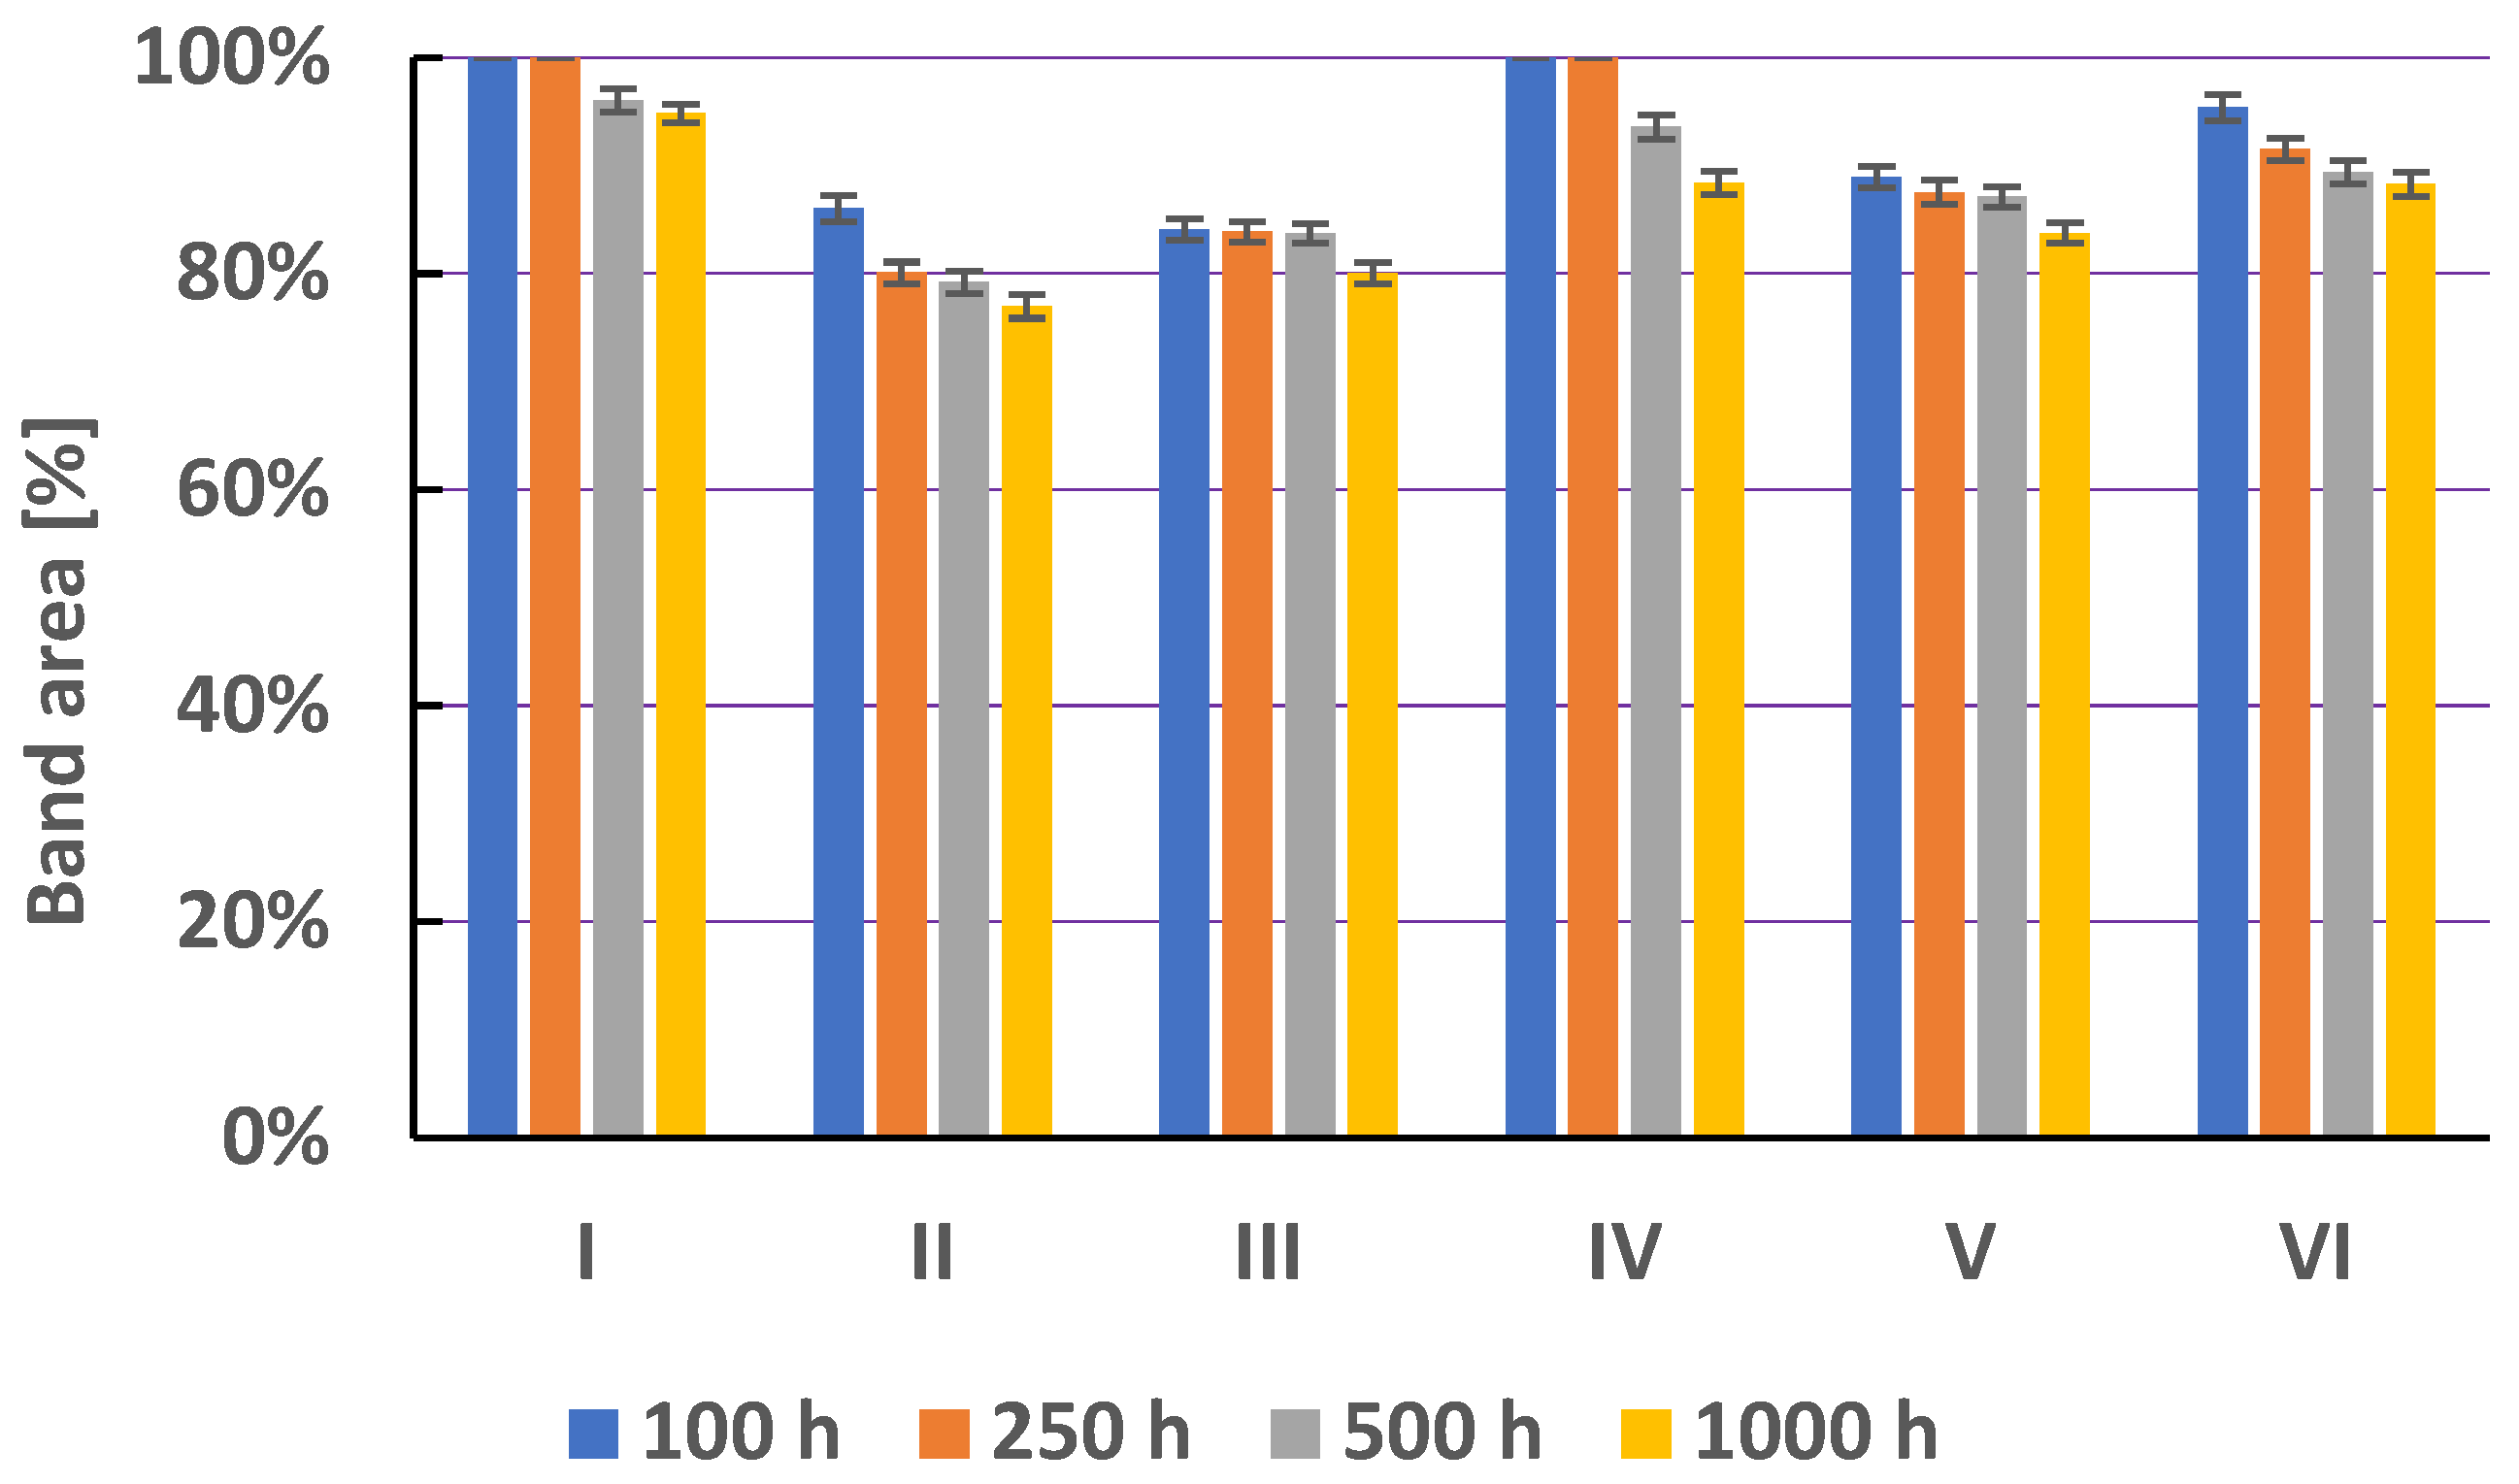
3.2.2. Stability of Secnidazole in Solutions
3.2.3. Stability of Ornidazole in Solutions
3.2.4. Stability of Tinidazole in Solutions
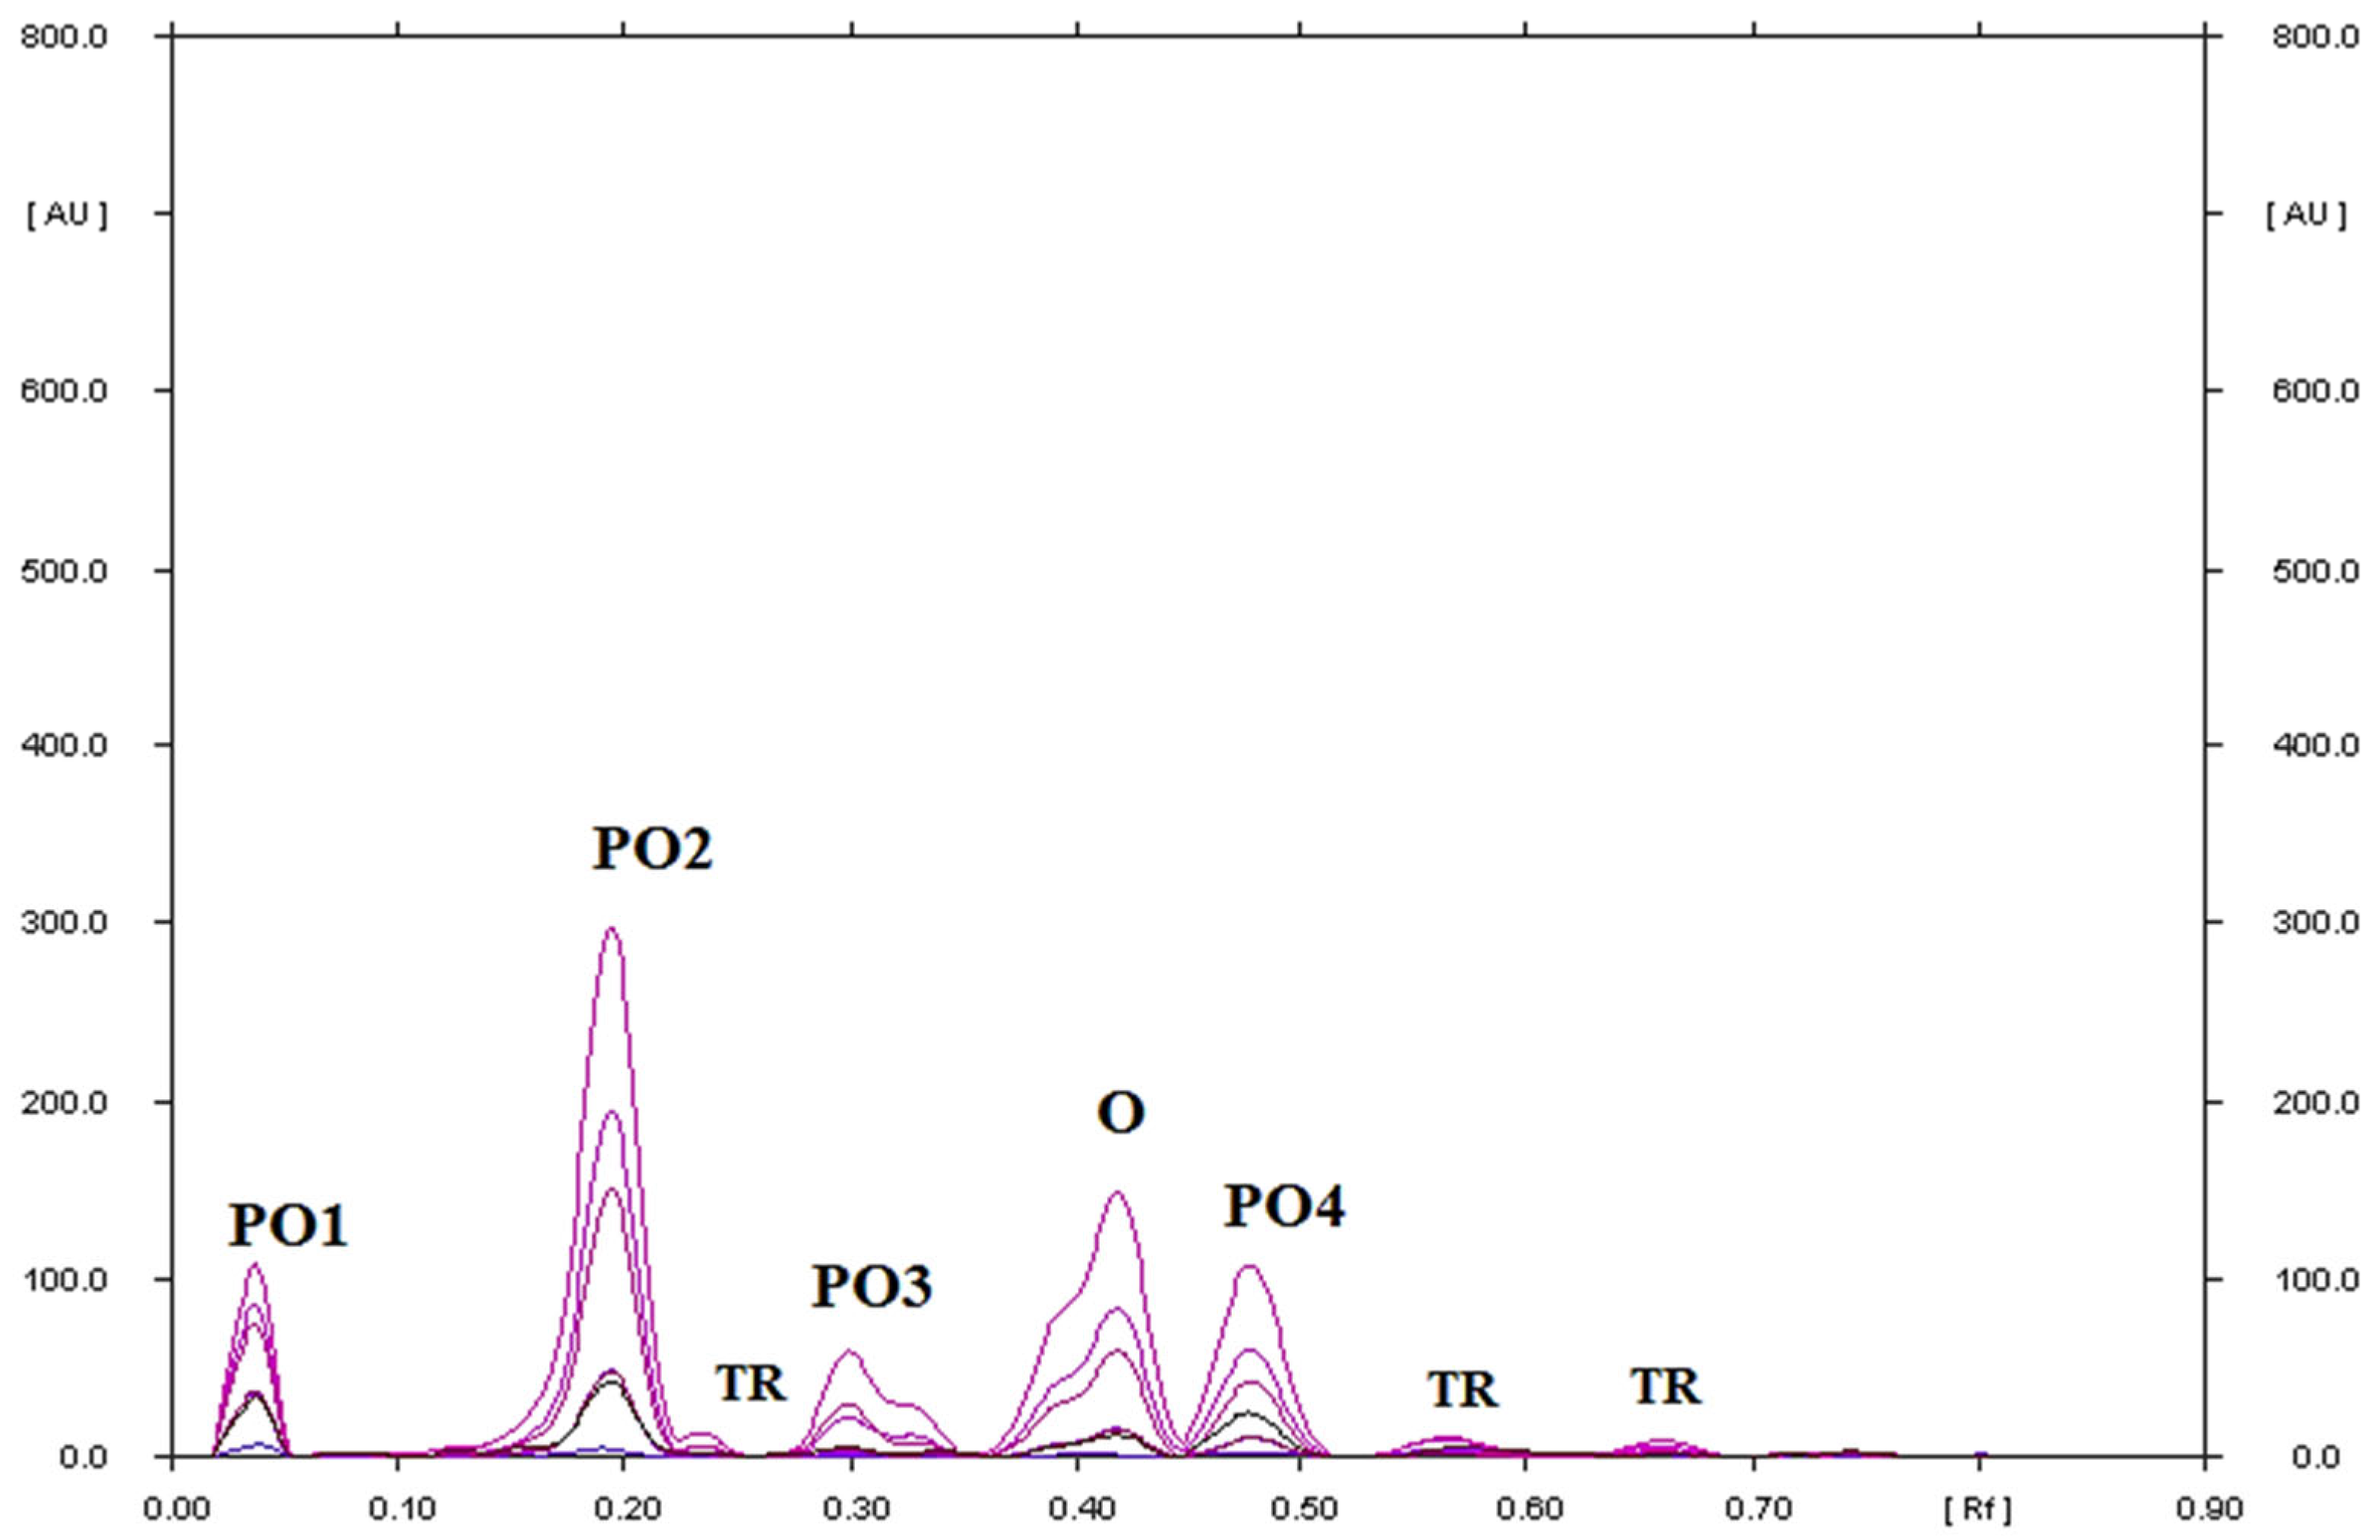
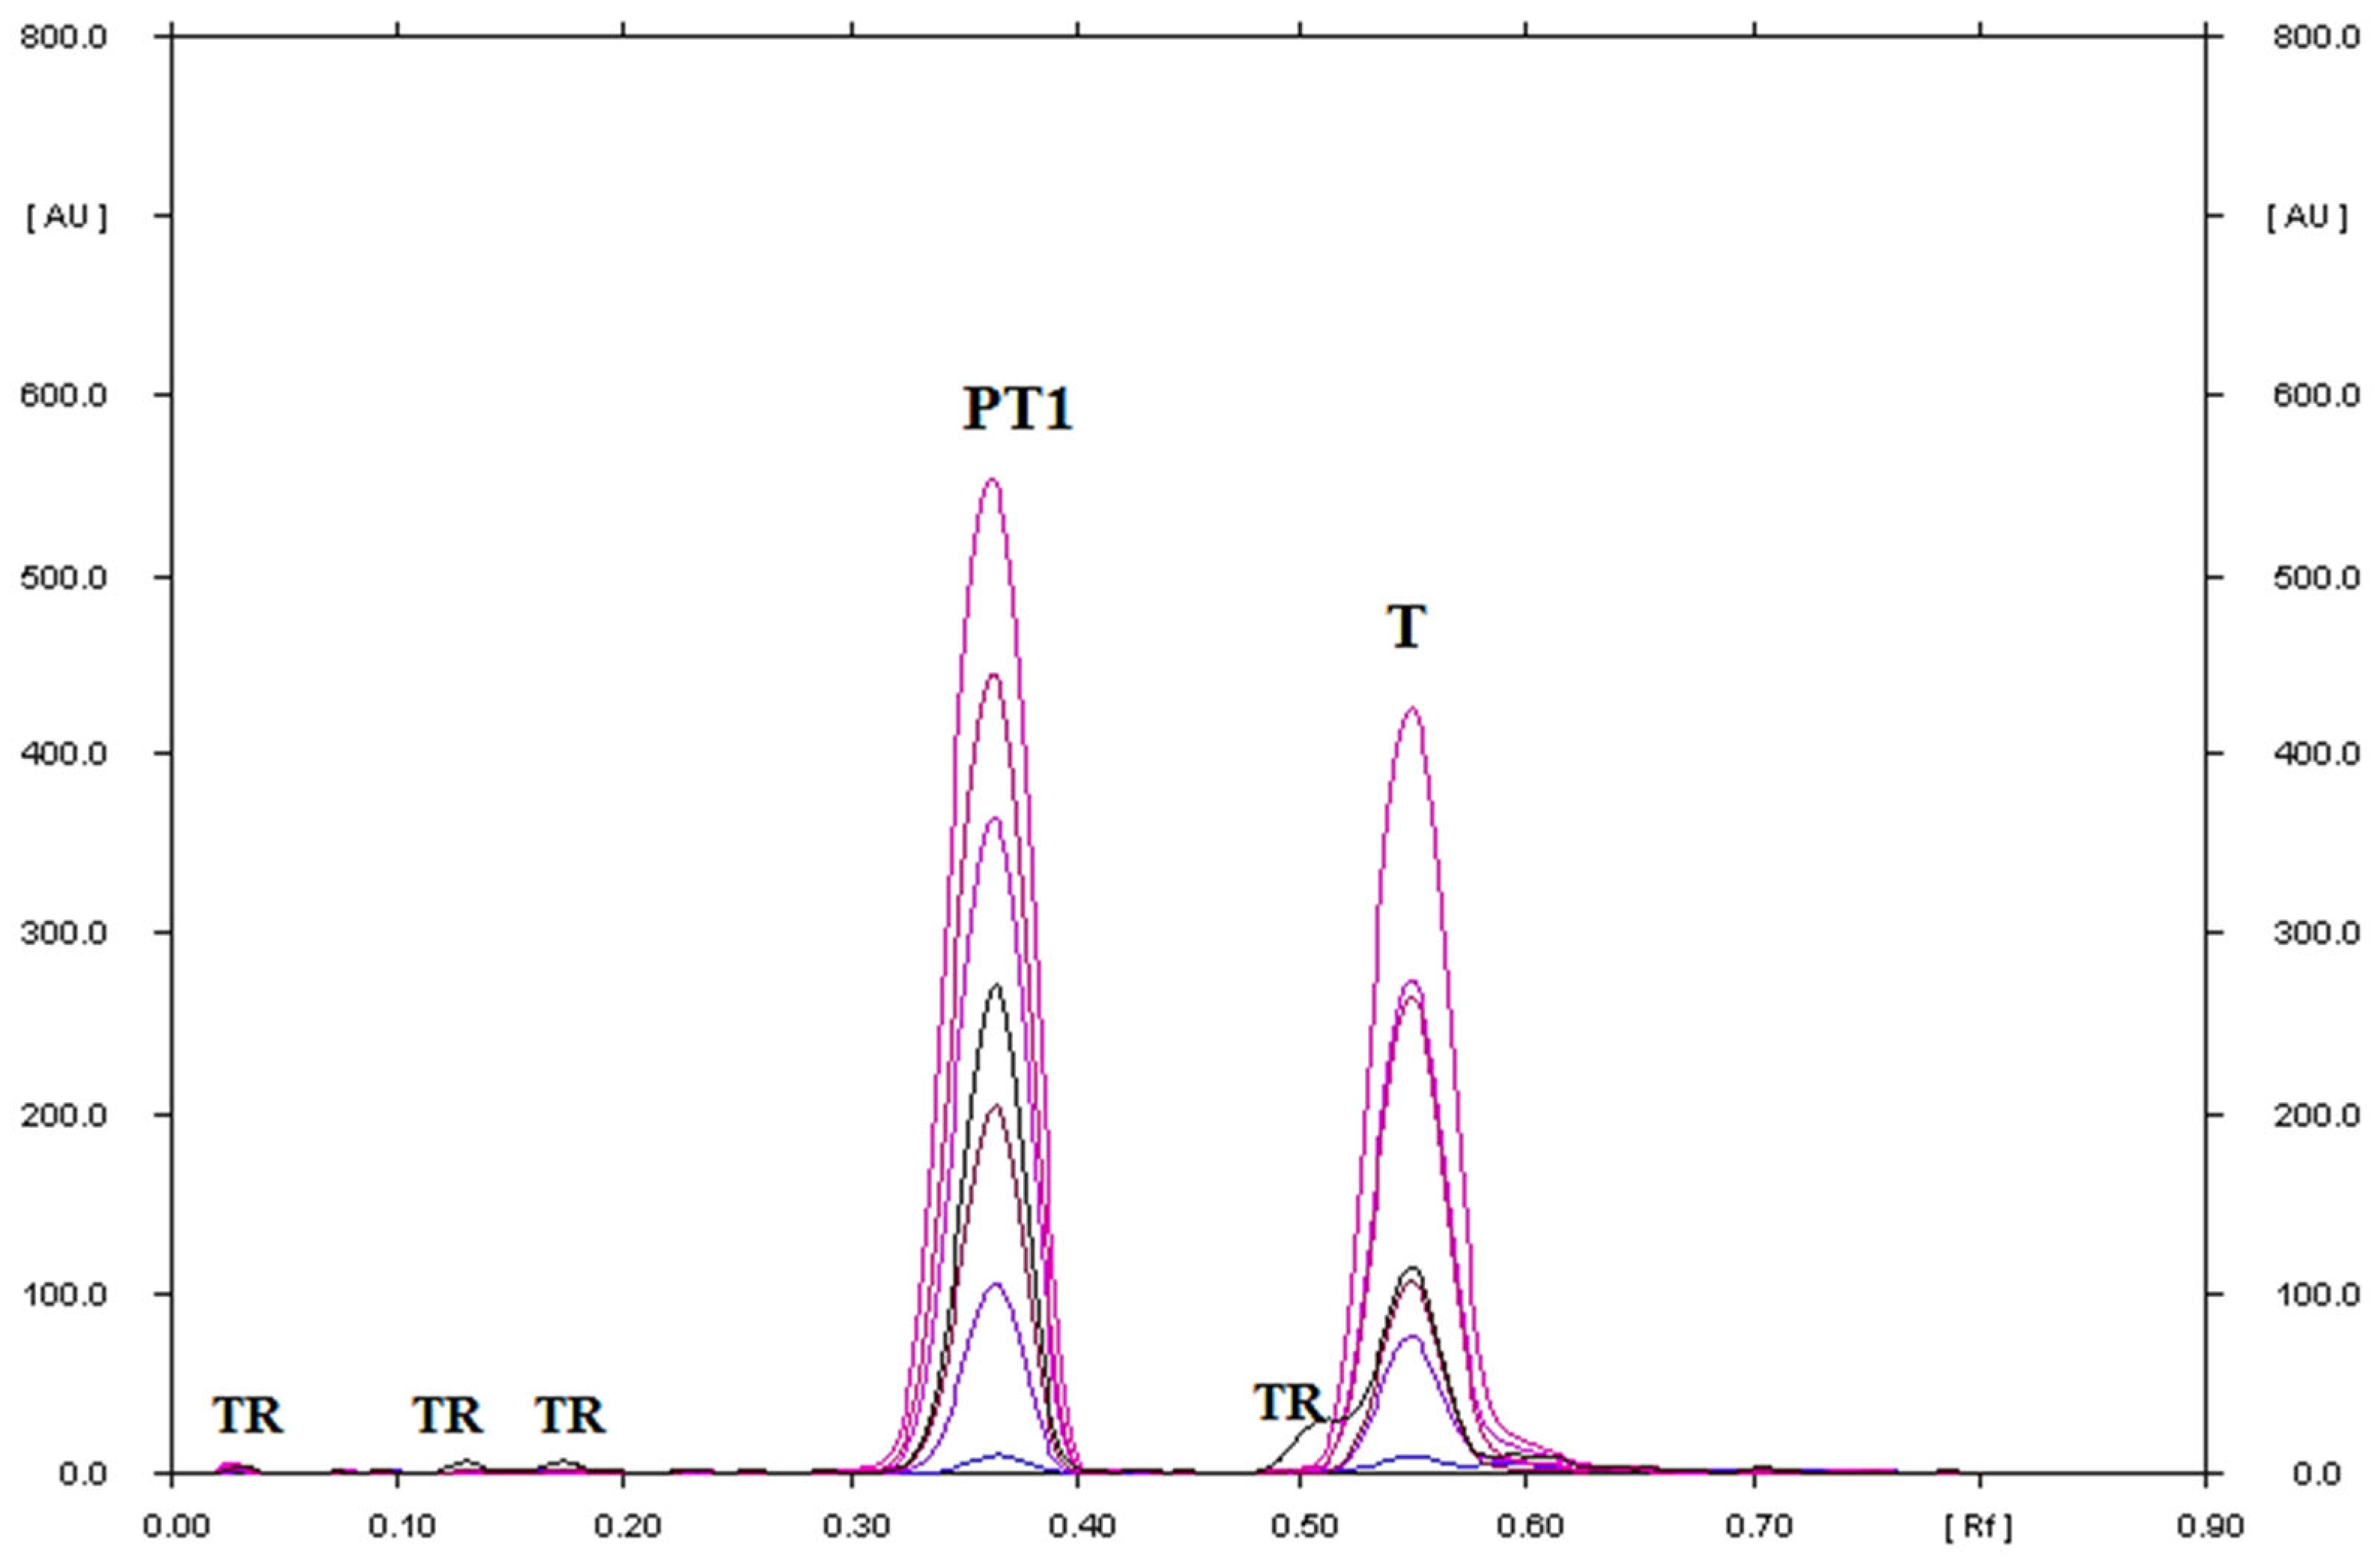
3.3. Comparison of the Obtained Degradation Products of Metronidazole, Secnidazole, Ornidazole and Tinidazole with Literature Data
3.4. Validation of Method
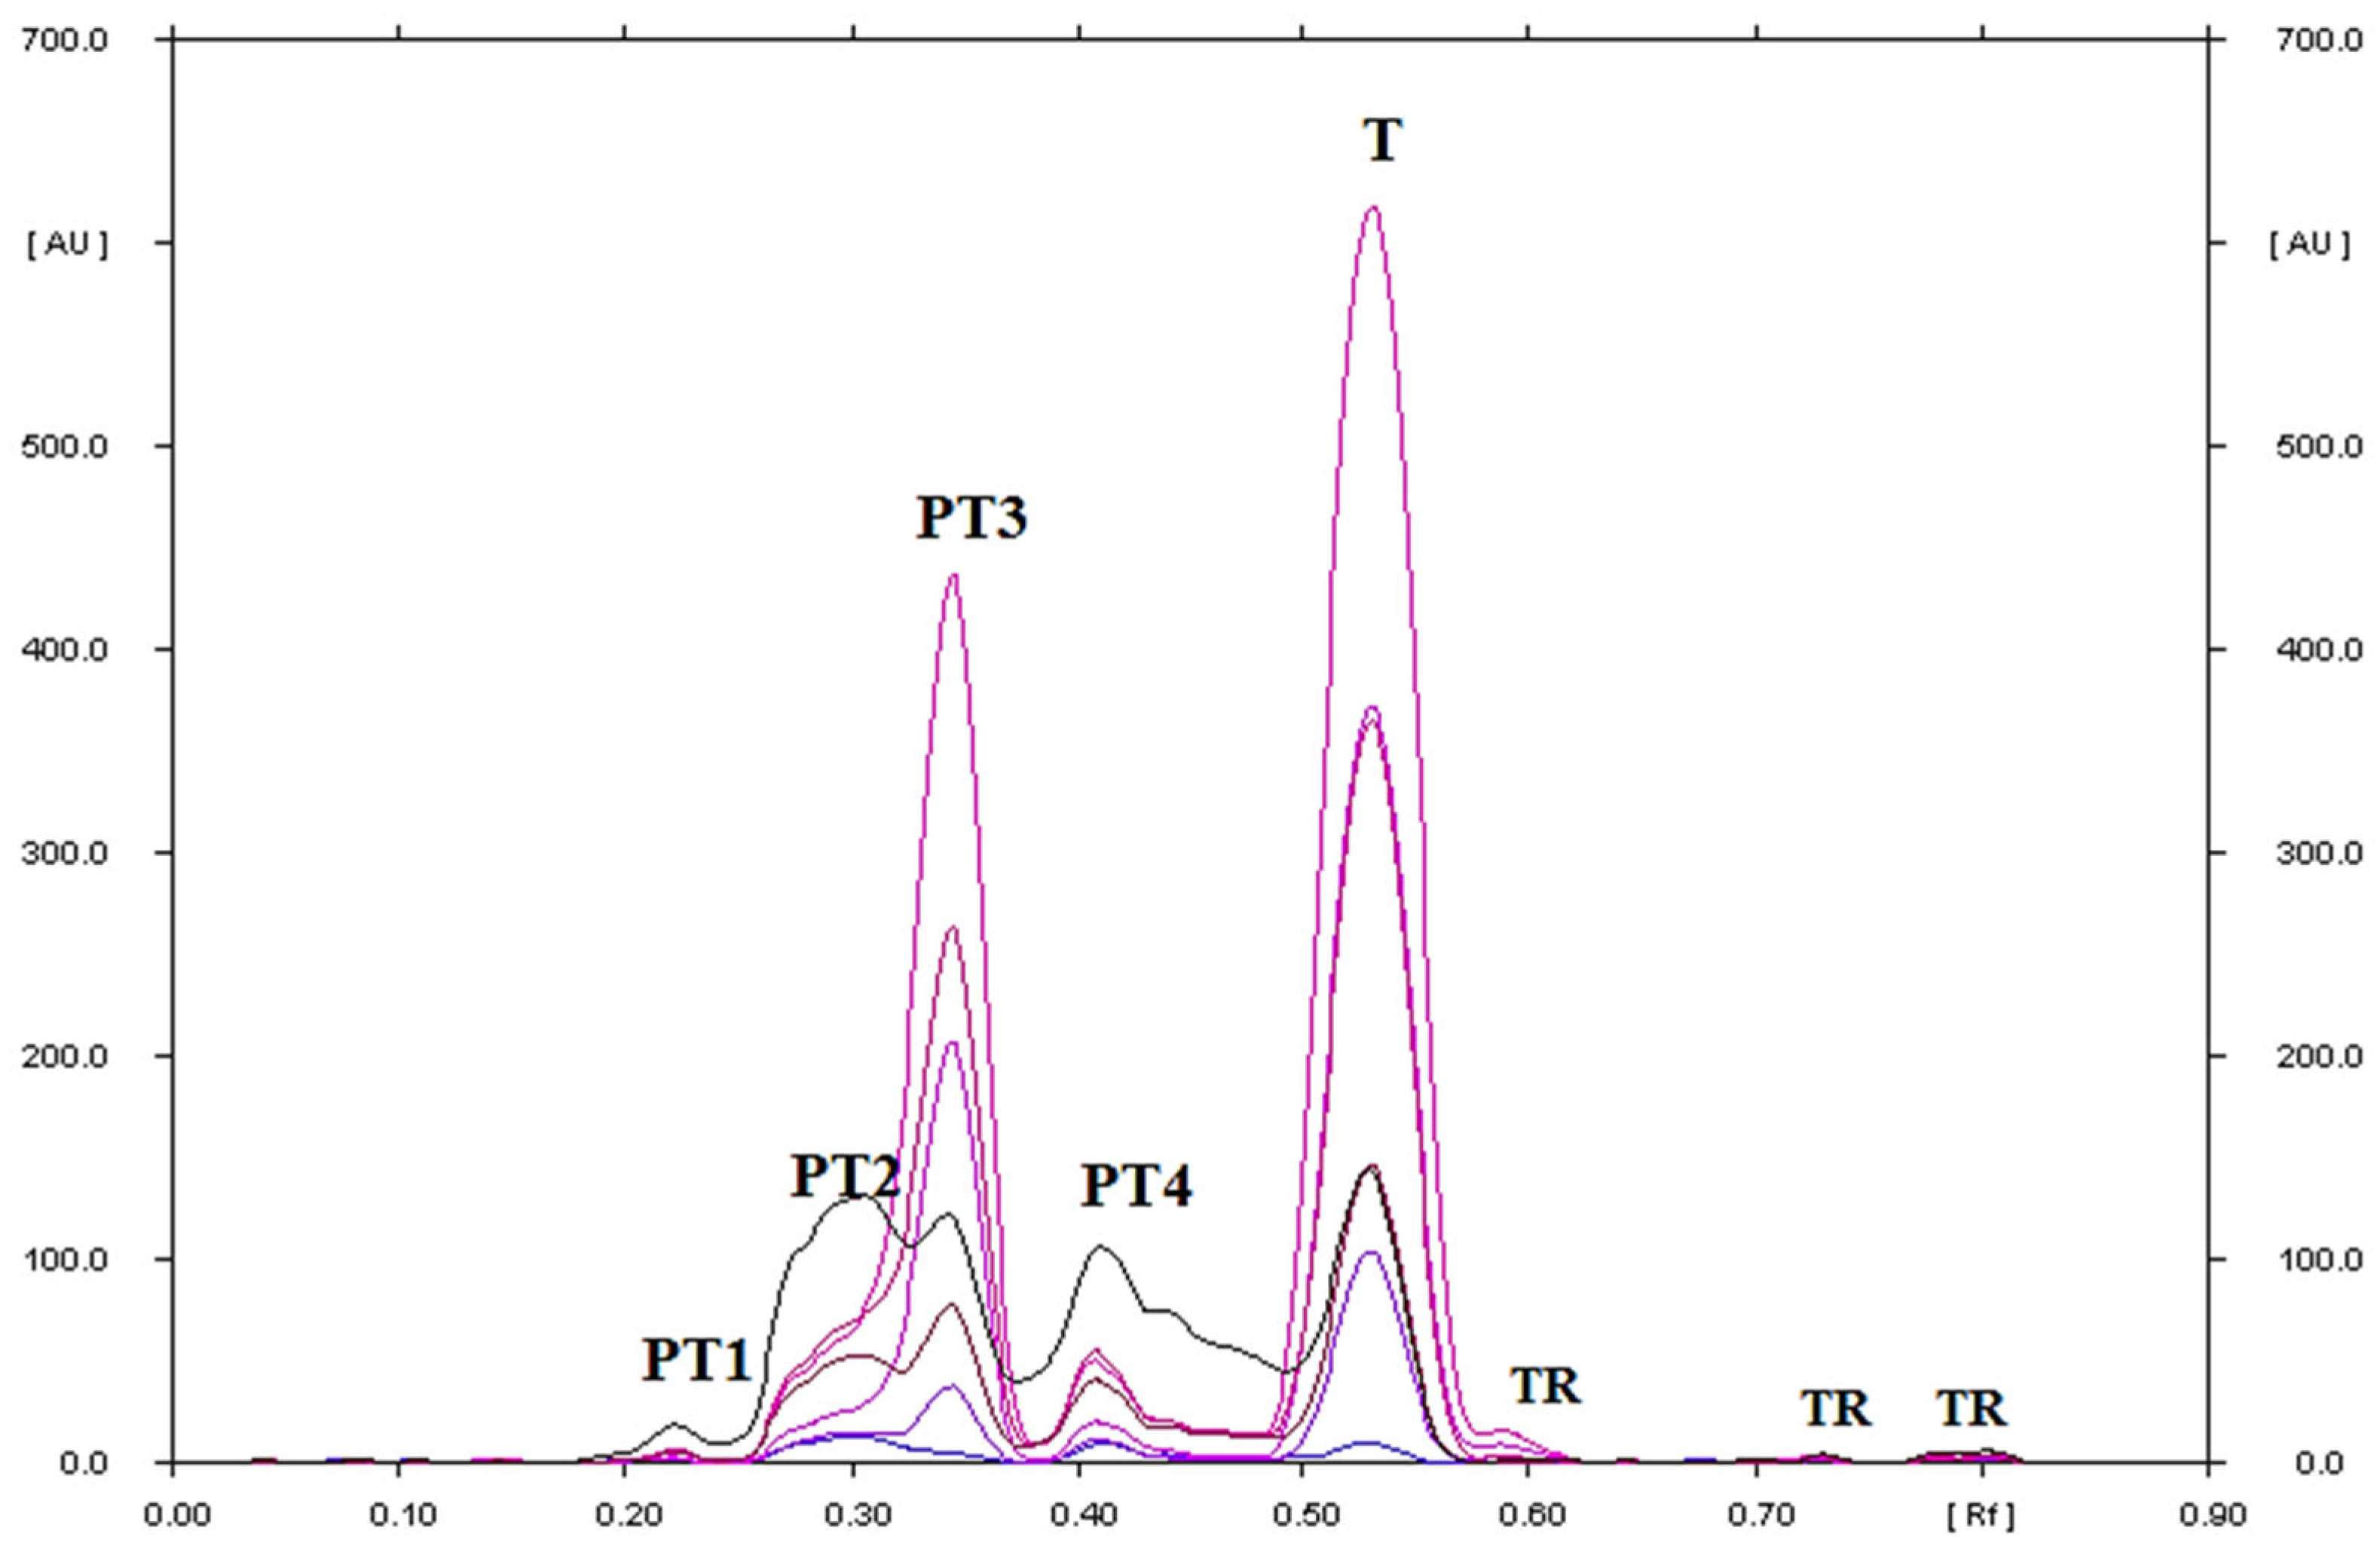
3.4.1. Specificity
3.4.2. Accuracy
3.4.3. Range
3.4.4. Precision
3.4.5. Limit of Detection (LOD) and Limit of Quantification (LOQ) Based on the Calibration Curve
4. Conclusions
Supplementary Materials
Funding
Data Availability Statement
Conflicts of Interest
References
- Dingsdag, S.A.; Hunter, N. Metronidazole: An update on metabolism, structure-cytotoxicity and resistance mechanisms. J. Antimicrob. Chemother. 2018, 73, 265–279. [Google Scholar] [CrossRef] [PubMed]
- Drugbank. Available online: https://go.drugbank.com/drugs (accessed on 24 October 2022).
- PubChem. Available online: https://pubchem.ncbi.nlm.nih.gov (accessed on 24 October 2022).
- Virtual Computational Chemistry Laboratory. Available online: http://www.vcclab.org/lab/alogps (accessed on 24 October 2022).
- Pyka, A.; Babuśka, M.; Zachariasz, M. A comparison of theoretical methods of calculation of partition coefficients for selected drugs. Acta Pol. Pharm. Drug Res. 2006, 63, 159–167. [Google Scholar]
- Schwartz, D.E.; Jeunet, F. Pharmacokinetic and metabolic studies with ornidazole in man. Comparison with metronidazole. In Chemotherapy. Parasites, Fungi, and Viruses; Williams, J.D., Geddes, A.M., Eds.; Springer: New York, NY, USA, 1976; Volume 6, pp. 49–59. [Google Scholar]
- Hansch, C.; Leo, A.; Hoekman, D. Exploring QSAR: Hydrophobic, Electronic and Steric Constants, 1st ed.; American Chemical Society: Washington, DC, USA, 1995. [Google Scholar]
- Wu, Z. Drug stability testing and formulation strategies. Pharm. Dev. Technol. 2018, 23, 941. [Google Scholar] [CrossRef] [PubMed]
- Briscoe, C.J.; Hage, D.S. Factors affecting the stability of drugs and drug metabolites in biological matrices. Bioanalysis 2009, 1, 205–220. [Google Scholar] [CrossRef]
- Yoshioka, S.; Stella, V.J. Stability of Drugs and Dosage Forms; Kluwer Academic Publishers: New York, NY, USA, 2002; pp. 4–138. [Google Scholar]
- Singh, S.; Junwal, M.; Modhe, G.; Tiwari, H.; Kurmi, M.; Parashar, N.S.P. Forced degradation studies to assess the stability of drugs and products. TrAC Trends Anal. Chem. 2013, 49, 71–88. [Google Scholar] [CrossRef]
- Ambhore, J.P.; Adhao, V.S.; Cheke, R.S.; Popat, R.R.; Gandhi, S.J. Futuristic review on progress in force degradation studies and stability indicating assay method for some antiviral drugs. GSC Biol. Pharm. Sci. 2021, 16, 133–149. [Google Scholar] [CrossRef]
- Chew, Y.L.; Hon-Kent, K.; Mei-Ann, L.; Kai-Bin, B.; Lokesh, A.G. Forced degradation of flibanserin bulk drug: Development and validation of stability indicating RP-HPLC method. Indian J. Pharm. Educ. Res. 2022, 56, 32–42. [Google Scholar] [CrossRef]
- Barnes, A.R.; Makohon, D.J. Correlation of degradation in metronidazole infusion with F0 appied during steam sterilization at 122 °C. Int. J. Pharm. 1993, 92, 233–236. [Google Scholar] [CrossRef]
- Wang, D.P.; Yeh, M.K. Degradation kinetics of metronidazole in solution. J. Pharm. Sci. 1993, 82, 95–98. [Google Scholar] [CrossRef]
- Verma, P.; Nambooding, V.; Mishra, S.; Bhagwat, A.; Bhoir, S. A stability indicating HPLC method for the determination of metronidazole using ecofriendly solvent as mobile phase component. Int. J. Pharm. Pharm. Sci. 2013, 5, 496–501. [Google Scholar]
- Nayak, S.; Goupale, D.C.; Dubey, A.; Shukla, V. Comparative stability study of metronidazole in aqueous and non aqueous vehicle. J. Appl. Pharm. 2011, 3, 295–300. [Google Scholar] [CrossRef]
- Wu, Y.; Fassihi, R. Stability of metronidazole, tetracycline HCl and famotidine alone and in combination. Int. J. Pharm. 2005, 290, 1–13. [Google Scholar] [CrossRef] [PubMed]
- Attimarad, M.; Venugopala, K.N.; Chohan, M.S.; Shinu, P.; David, M.; Molina, E.I.P.; Nair, A.B.; Sreeharsha, N.; Altaysan, A.I.; Balgoname, A.A. Multivariate optimization of chromatographic conditions for rapid simultaneous quantification of antidiarrheal drugs in formulation using surface response methodology. Separations 2022, 9, 103. [Google Scholar] [CrossRef]
- Jain, P.S.; Lohar, T.R.; Kale, N.N.; Suran, S.J. Development and validation of stability-indicating HPTLC method for estimation of secnidazole in bulk drug and pharmaceutical doasage form. J. Adv. Drug Deliv. 2014, 1, 144–156. [Google Scholar]
- Bakshi, M.; Singh, S. ICH guidance in practice: Establishment of inherent stability of secnidazole and development of a validated stability-indicating high-performance liquid chromatographic assay method. J. Pharm. Biomed. Anal. 2004, 36, 769–775. [Google Scholar] [CrossRef] [PubMed]
- Goncalves de Souza Lima, J.; Kogawa, A.C.; Salgado, H.R.N. Green analytical method for quantification of secnidazole in tablets by HPLC-UV. Drug Anal. Res. 2018, 2, 20–26. [Google Scholar] [CrossRef]
- Moustafa, A.A.; Bibawy, L.I. Stability-indicating assay of secnidazole in the presence of Its degradation products. Spectrosc. Lett. 1999, 32, 1073–1098. [Google Scholar] [CrossRef]
- Vaghela, B.K.; Rao, S.S. A novel validated stability indicating high performance liquid chromatographic method for estimation of degradation behavior of ciprofloxacin and tinidazole in solid oral dosage. J. Pharm. Bioallied Sci. 2013, 5, 298–308. [Google Scholar] [CrossRef]
- Bakshi, M.; Singh, S. HPLC and LC–MS studies on stress degradation behaviour of tinidazole and development of a validated specific stability-indicating HPLC assay method. J. Pharm. Biomed. Anal. 2004, 34, 11–18. [Google Scholar] [CrossRef]
- Ahmed, R.; Abdelaziz, M.; Saeed, A. Development and validation of stability indicating HPLC method for quantification of tinidazole. Eur. J. Chem. 2019, 10, 102–107. [Google Scholar] [CrossRef]
- Salomies, H.; Salo, J.P. An HPLC study of tinidazole hydrolysis. Chromatographia 1993, 36, 79–82. [Google Scholar] [CrossRef]
- Murali Krishna, M.; Venkateswarlu, R.; Harsha Vardhan, A.; Mahesh Reddy, A.; Geetha, C.; Suseela, P.; Rajeswari, Y.V.S. Validated RP-HPLC method for simultaneous estimation of tinidazole and diloxanide furoate in pharmaceutical formulations. World J. Pharm. Res. 2021, 7, 169–175. [Google Scholar]
- Bakshi, M.; Singh, B.; Singh, A.; Singh, S. The ICH guidance in practice: Stress degradation studies on ornidazole and development of a validated stability-indicating assay. J. Pharm. Biomed. Anal. 2001, 26, 891–897. [Google Scholar] [CrossRef]
- Prasad Babu, N.; Ramachandran, D. Development and validation of stability Indicating RP-HPLC method for quantitative estimation of ornidazole and its impurities in ornidazole injection. Res. J. Pharm. Technol. 2022, 15, 82–88. [Google Scholar] [CrossRef]
- D’Souza, K.; Syeda, A.; Khatal, P.; Sathyanarayana, M.B.; Vasantharayu, S.G. Stability indicating assay method development ana validation for simultaneous wstimation of ofloxacin and ornidazole by RP-HPLC in bulk: An application to tablet formulation and dissolution studies. Indian J. Pharm. Educ. Res. 2021, 55, 607–613. [Google Scholar] [CrossRef]
- Santurio, J.V.; Perez, J.; Pelaez, B.L.; Manchado, C. Influence of pH on the degradation of ornidazol isolation and identification of its degradation products. STP Pharma Sci. 1995, 5, 391–395. [Google Scholar]
- Pramar, Y.V.; Mandal, T.K.; Bostanian, L.A.; Le, G.; Morris, T.C.; Graves, R.A. Physicochemical and microbiological stability of compounded metronidazole suspensions in PCCA SuspendIt. Int. J. Pharm. Compd. 2021, 25, 169–175. [Google Scholar]
- Sneha, J.K.; Nirav, P.B.; Parag, P.R.; Nikita, P.N.; Hemant, D.T. Development and validation of stability indicating method for simultaneous estimation of ciprofloxacin hcl and tinidazole using rp-uplc method. IOSR J. Pharm. (IOSRPHR) 2012, 2, 12–19. [Google Scholar] [CrossRef]
- Chen, M.L.; Xu, H.X.; Yuan, W.F.; Zhao, S.H.; Li, X.; Zhu, L.X.; Shen, Z.Y.; Liu, Y.J.; Wang, M.J.; Ma, A.; et al. Identification of the major photodegradant in metronidazole by LC-PDA-MS and its reveal in compendial methods. Sci. Rep. 2022, 12, 11665. [Google Scholar] [CrossRef]
- Naveed, S.; Waheed, N.; Nazeer, S. Degradation study of metronidazole in active and different formulation by UV spectroscopy. J. Bioequiv. Bioavailab. 2014, 6, 124–127. [Google Scholar] [CrossRef]
- Aleanizy, F.S.; Al-Eid, H.A.; Tahir, E.E.; Alqahtani, F.Y.; Al-Gohary, O.M. Stability and in vitro dissolution studies of metronidazole tablets and infusions. Dissolution Technol. 2017, 24, 22–27. [Google Scholar] [CrossRef]
- Hassan, S.; Arsalan, A.; Tasawer Baig, M.; Syed, N.; Ibrahim, S.; Ali, S.I.; Huma, A.; Jabeen, A.; Naeem, M.; Arif, J. Factors affecting the formulation for the stabilization of secnidazole in gel preparations. Pharmacophore 2021, 11, 15–23. [Google Scholar]
- Khan, S.; Haseeb, M.; Baig, M.H.; Bagga, P.S.; Siddiqui, H.H.; Kamal, M.A.; Khan, M.S. Improved efficiency and stability of secnidazole—An ideal delivery system. Saudi J. Biol. Sci. 2015, 22, 42–49. [Google Scholar] [CrossRef] [PubMed]
- Rencber, S.; Şenyigit, Z.; Özyazici, M. Stability studies of compression coated ornidazole tablets for colon specific drug delivery. J. Res. Pharm. 2019, 23, 34–43. [Google Scholar] [CrossRef]
- Trivedi, M.K. Spectroscopic characterization of biofield treated metronidazole and tinidazole. Med. Chem. 2015, 5, 340–344. [Google Scholar] [CrossRef]
- Sanyal, S.N.; Datta, A.K.; Chakrabarti, A. Stability indicating TLC method for the quantification of tinidazole in pharmaceutical dosage form—I.V. Fluid. Drug Dev. Ind. Pharm. 1992, 18, 2095–2100. [Google Scholar] [CrossRef]
- Starek, M.; Dąbrowska, M.; Chebda, J.; Żyro, D.; Ochocki, J. Stability of Metronidazole and Its Complexes with Silver(I) Salts under Various Stress Conditions. Molecules 2021, 26, 3582. [Google Scholar] [CrossRef]
- Meshram, D.; Patel, D.; Rohit, M.; Desai, S.; Tajne, M.R. Simultaneous determination of clotrimazole and tinidazole in tablet and cream by HPTLC. Int. J. Adv. Res. 2014, 2, 855–863. [Google Scholar]
- Mohammad, M.A.; Zawilla, N.H.; El-Anwar, F.M.; El-Moghazy Aly, S.M. Stability indicating methods for the determination of norfloxacin in mixture with tinidazole. Chem. Pharm. Bull. 2007, 55, 1–6. [Google Scholar] [CrossRef]
- Chandra, R.; Aggarwal, A.; Jain, D.V.S.; Kapoor, V.K.; Thakur, D.; Sharma, A. Degradation kinetics of metronidazole and its mutual prodrug with ciprofloxacin: A calorimetric analysis. Int. J. Biol. Chem. Sci. 2007, 1, 197–210. [Google Scholar]
- Hizarcioglu, S.Y.; Ay, Z.; Ozyazici, M. Bioavailability file: Ornidazole. FABAD J. Pharm. Sci. 2004, 29, 133–144. [Google Scholar]
- Bakshi, M.; Singh, S. Development of validated stability-indicating assay methods—Critical review. J. Pharm. Biomed. Anal. 2002, 28, 1011–1040. [Google Scholar] [CrossRef] [PubMed]


| Physicochemical Property | Metronidazole | Secnidazole | Ornidazole | Tinidazole |
|---|---|---|---|---|
| Empirical formula | C6H9N3O3 | C7H11N3O3 | C7H10ClN3O3 | C8H13N3O4S |
| Molecular mass | 171.154 g/mol | 185.183 g/mol | 219.63 g/mol | 247.272 g/mol |
| Melting point | 160 °C | 76.0 °C | 77.5 °C | 127–128 °C |
| Solubility in water | 5.92 mg/mL | 4.88 mg/mL | 3.34 mg/mL | 3.03 mg/mL |
| pKa (strongest acidic) | 15.41 | 15.16 | 13.89 | - |
| pKa (strongest basic) | 3.03 | 3.08 | 3.08 | 3.28 |
| logPexp | −0.02 | 0.22 | 0.59 | −0.35 |
| AlogPs | −0.15 | 0.25 | 0.37 | −0.41 |
| AC logP | −0.19 | 0.21 | 0.39 | −0.20 |
| milogP | −0.47 | −0.10 | 0.12 | −0.06 |
| AlogP | −0.34 | 0.04 | 0.36 | 0.15 |
| MlogP | 0.44 | 0.80 | 1.13 | 1.00 |
| XlogP2 | −0.14 | 0.32 | 0.66 | 0.74 |
| XlogP3 | −0.02 | 0.22 | 0.60 | −0.36 |
| 5-Nitroimidazole | Analytical Technique 1/ Conditions | Maximum Number of Degradation Products | Identification of Degradation Products | Ref |
|---|---|---|---|---|
| Metronidazole | HPLC Phenyl column Propylene carbonate + methanol, 90:10, v/v | 5 | 1 product was identified as 4-nitroimidazole | [16] |
| LC-PDA-MS LC-2030C plus column oven Solvent A: 0.05 mol/L KH2PO4 in water Solvent B: methanol | 5 | 1 product was identified as 2-(2-hydroxy ethyl)-5-methyl-1,2,4-oxadiazole-3-carboxamide | [35] | |
| TLC–densitometric silica gel 60F254 ethyl acetate + methanol + ammonia 25%, 15:5:0.5, v/v/v | 2 | No | [43] | |
| TLC–densitometric silica gel 60F254 chloroform + methanol, 9:1, v/v | 5 | No | In this work | |
| Secnidazole | HPLC C-18 column Water + methanol, 85:15, v/v | 2 (acidic sample heated) 3 (acidic sample photodegradated) | No | [21] |
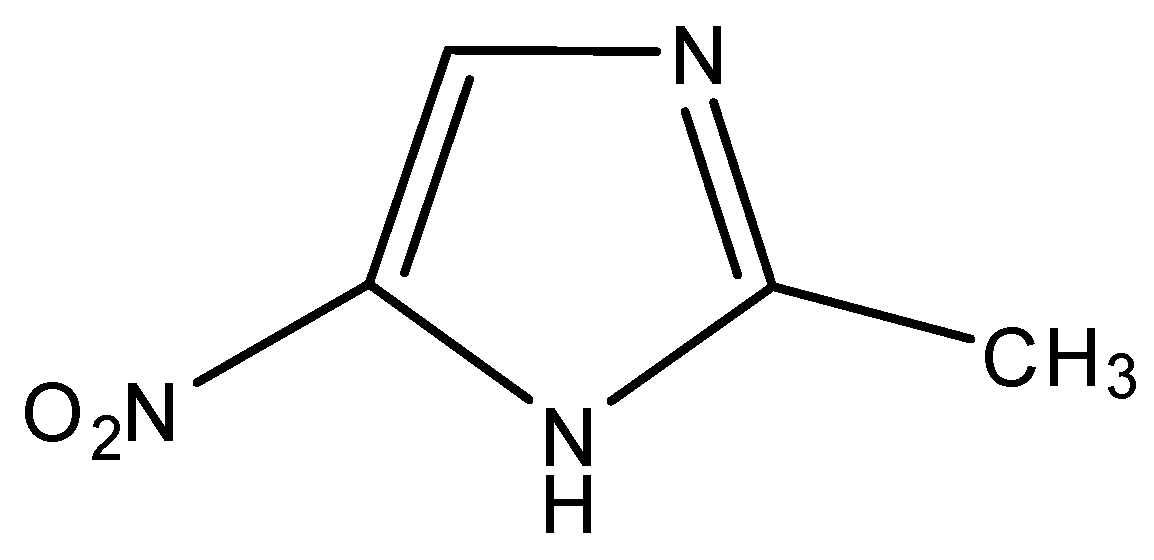
| First derivative spectrophotometric | 2 | 2-methyl-5-nitroimidazole, hydroxyl propanol | [23] | |
| HPLC C-18 column Water + methanol, 70:30, v/v | 2 | |||
| TLC silica gel 60F254 ethyl acetate | 2 | |||
| TLC–densitometric silica gel 60F254 chloroform + methanol, 9:1, v/v | 4 | 1 product was identified as 2-methyl-5-nitroimidazole | In this work | |
| Ornidazole | HPLC C-18 column Water + acetonitrile, 86:14, v/v | 3 | 2 products were identified as epoxide and diol | [29] |
| HPLC RP18 column Phosphate buffer + methanol, 70:30, v/v | 3 | 2 products were identified as 2-methyl-5-nitroimidazole and diol | [30] | |
| TLC–densitometric silica gel 60F254 chloroform + methanol, 9:1, v/v | 4 | No | In this work | |
| Tinidazole | HPLC RP18 column Solvent A: buffer pH = 3.0 Solvent B: buffer pH = 3.0 + acetonitrile, 20:80, v/v | 3 | 1 product was identified as 2-methyl-5-nitroimidazole | [24] |
| HPLC and LC-MS C18 column Water + acetonitrile, 86:14, v/v | 4 | 2 products were identified as 2-methyl-5-nitroimidazole, 4-nitro isomer of tinidazole | [25] | |
| HPTLC–densitometric silica gel 60GF254 toluene + ethyl acetate+ methanol + triethyl amine, 5.5:1.0:1:0:0.1, v/v | 1 | No | [44] | |
| TLC–densitometric silica gel 60F254 chloroform + methanol, 9:1, v/v | 4 | 1 product was identified as 2-methyl-5-nitroimidazole | In this work |
| Parameter | Metronidazole | Secnidazole | Ornidazole | Tinidazole |
|---|---|---|---|---|
| Linearity range (μg/spot) | 0.20 ÷ 0.90 | 0.20 ÷ 1.00 | 0.20 ÷ 1.00 | 0.20 ÷ 1.00 |
| Slope (a ± Sa) | 6604.1 (±52.8) | 5895 (±88.9) | 7325.1 (±118.9) | 8351.2 (±21.3) |
| Intercept (b± Sb) | 134.8 (±38.9) | 112.4 (±56.9) | 188.1 (±61.1) | 121.3 (±38.3) |
| Correlation coefficent, R | 0.993 | 0.996 | 0.997 | 0.999 |
| LOD (μg/spot) | 0.052 | 0.063 | 0.055 | 0.058 |
| LOQ (μg/spot) | 0.159 | 0.190 | 0.165 | 0.174 |
| Precision, CV [%] | ||||
| Repeatability | 1.17% ÷ 1.87% | 1.97% ÷ 2.33% | 1.88% ÷ 2.18% | 1.45% ÷ 2.05% |
| Intermediate | 1.35% ÷ 1.99% | 2.11% ÷ 2.73% | 2.08% ÷ 2.71% | 1.69% ÷ 2.26% |
| Recovery levels (%) | ||||
| 80% | R = 98.2%, CV = 1.3% | R = 101.8%, CV = 0.8% | R = 99.1%, CV = 1.8% | R = 97.6%, CV = 0.7% |
| 100% | R = 99.2%, CV = 0.9% | R = 98.8%, CV = 1.7% | R = 98.9%, CV = 1.2% | R = 102.3%, CV = 1.4% |
| 120% | R = 99.4%, CV = 1.4% | R = 99.1%, CV = 1.9% | R = 101.3%, CV = 2.2% | R = 98.7%, CV = 1.9% |
Disclaimer/Publisher’s Note: The statements, opinions and data contained in all publications are solely those of the individual author(s) and contributor(s) and not of MDPI and/or the editor(s). MDPI and/or the editor(s) disclaim responsibility for any injury to people or property resulting from any ideas, methods, instructions or products referred to in the content. |
© 2023 by the author. Licensee MDPI, Basel, Switzerland. This article is an open access article distributed under the terms and conditions of the Creative Commons Attribution (CC BY) license (https://creativecommons.org/licenses/by/4.0/).
Share and Cite
Pyka-Pająk, A. TLC–Densitometric Analysis of Selected 5-Nitroimidazoles. Processes 2023, 11, 170. https://doi.org/10.3390/pr11010170
Pyka-Pająk A. TLC–Densitometric Analysis of Selected 5-Nitroimidazoles. Processes. 2023; 11(1):170. https://doi.org/10.3390/pr11010170
Chicago/Turabian StylePyka-Pająk, Alina. 2023. "TLC–Densitometric Analysis of Selected 5-Nitroimidazoles" Processes 11, no. 1: 170. https://doi.org/10.3390/pr11010170
APA StylePyka-Pająk, A. (2023). TLC–Densitometric Analysis of Selected 5-Nitroimidazoles. Processes, 11(1), 170. https://doi.org/10.3390/pr11010170