Article

Benzene Reduction Process Simulation and Optimization in Catalytic Cracking Gasoline Distillation

School of Science, China University of Petroleum (Beijing), Beijing 102249, China
*
Author to whom correspondence should be addressed.
Processes 2023, 11(1), 151; https://doi.org/10.3390/pr11010151
Submission received: 30 November 2022 / Revised: 29 December 2022 / Accepted: 1 January 2023 / Published: 4 January 2023

Abstract

:
For countries where catalytic cracking gasoline is the primary source, the proposed technology consists in separating a benzene-rich fraction from catalytic cracking gasoline in order to be processed further together with reforming gasoline in a unit dedicated to aromatics extraction. In this way, two benefits are obtained: a benzene-rich fraction as raw material for extraction and the leftover fraction that satisfies the benzene content standards as a qualified product. It is established to use the divided wall distillation model, single-column distillation model, and double-column distillation model. Sensitivity analysis and SQP optimization are used to identify the ideal operating conditions and gasoline yield. Economic research shows that the divided wall and single-column distillation models have more potential for growth. It offers theoretical direction for businesses to design and optimize the pertinent process.

1. Introduction

Benzene was one of the high-octane ingredients in gasoline and an essential chemical. However, it is strictly prohibited in various countries due to its carcinogenicity, high vapor pressure, and other drawbacks. The United States MSAT II specification, in particular, stipulates that the benzene content of gasoline shall not be greater than 0.62 vol% [1]. According to the European Union’s European VI standard, there must be no more than 1.0 vol% benzene in gasoline [2]. China VI vehicle emission standard [3], which is stricter than China V vehicle emission standards [4], was released in 2016 in response to the call for global green environmental protection. It stipulates that the amount of benzene in gasoline shall not surpass 0.8 vol%.
Catalytic cracking gasoline, reforming gasoline, and hydrocracking gasoline are the three significant gasoline sources. Most benzene derives from reforming gasoline. Hence, removing benzene and benzene precursors from reforming feedstock as well as benzene from gasoline reforming, along with choosing the suitable reforming feedstock and reforming operation plan [5], is the primary way to reduce benzene in gasoline.
Alkylating [6,7,8,9,10], hydrogenating [11,12,13], and etherificating [14] procedures are the principal processes used in gasoline benzene reduction technologies. Nevertheless, the three processes indirectly affect the octane number and yield of gasoline. At present, it is a challenge to balance energy, yield, and octane number during the benzene reduction process. We have to resolve this issue in a more elegant way. Catalytic cracking gasoline accounts for 80% of Chinese gasoline production [15]. As a result, we suggested a novel benzene reduction procedure, as depicted in Figure 1.
To be specific, distillation is used in this procedure to separate the catalytic cracking gasoline into a benzine-rich fraction and a benzine-low fraction. The aromatics extraction unit [16] combines the reforming fraction with the benzene-rich fraction. The same procedure can be repeated by adding non-aromatic components to naphtha before going into the reformer. This method is consistent with most national circumstances accounted for by catalytic cracking gasoline, which can recover benzene, a substance vital to the catalytic breaking of gasoline. In addition, we can make ethanol gasoline by adding some ethanol to gasoline, which satisfies national standards for benzene content.
Ethanol gasoline can significantly lower emissions of carbon monoxide, hydrocarbons, and other key pollutants [17] while also enhancing the performance and quality of oil products. The initial generation of bioethanol is mostly made from cane, corn, wheat, and other raw materials in an effort to find renewable energy, the second and third generations of which are primarily made from plants, trees, marine plants, and other raw materials. In recent years, biomass, which can be further broken down into lignocellulosic and vegetable types, has also been regarded as a significant source of bioethanol [18]. The methods of ethanol refining mainly include pressure swing adsorption [19,20,21] and extractive distillation [18,22].
In chemical industrial applications, most optimization problems are nonlinear. One of the best ways to resolve constrained nonlinear optimization issues is to use the SQP algorithm, which can be used to solve any objective function optimization problem with nonlinear equality and inequality constraints. The fundamental concept is to transform the SQP optimization model into a QP issue while minimising the constraints. Rotating shaft operation produces the positive constraint set, which converts the nonlinear issue into a collection of linear equations [23]. The advanced correction direction is generated by using the positive constraint set, which is then iteratively updated in accordance with the correction direction. When the convergence requirements of the algorithm, the optimization model, and the chemical process constraint requirements are satisfied, the calculation is complete [24].
Herein, we simulate the stringent rectification of catalytic cracking gasoline with minimal benzene by using Aspen Plus V9.0 process simulation software. First, the sensitivity analysis of key parameters of the model is carried out to ensure the continuity of values within the optimization range. Then, on the basis of sensitivity analysis, the SQP algorithm is used to optimize the key parameters to ensure the maximum yield of gasoline with benzene content less than or equal to 0.8%. The yield of qualified gasoline and energy consumption of the unit under different benzene content are analyzed. Finally, the economic analysis of the three processes and processes with different benzene content is carried out, and a direction for future development is identified.

2. Simulation Strategy

2.1. Material Composition

Gasoline is a complex manufactured mixture made up of hydrocarbons, additives, and blends [25]. According to estimations in the literature, gasoline could include more than 170 hydrocarbons [26]. As a result, the majority of refineries use TBP and ASTM-D86 distillation data for analysis [27]. The refinery’s D86 distillation data is utilized in this work to simulate the characteristics of gasoline. The measured value in Table 1 stands for the input value for the assay, and the simulated value represents the distillation value in the simulation, which is how the measured data from a refinery are used in this research. Then, add a particular percentage of benzene to the gasoline dummy component to imitate benzene-rich gasoline.

2.2. Simulation Module

Aspen Methods Assistant provides CHAO-SEA, GRAYSON, BK-10, SPK, and PR thermodynamic methods for hydrocarbon composition in real and mixed non-vacuum conditions. Then, select the PR equation with Boston Mathia’s alpha function as the thermodynamic equation to more precisely compute the properties of benzene. Equations (1) and (2) to Equation (5) display the standard PR equation and the Boston Mathia modified alpha function equation. Abbreviations are used to clarify the precise meaning of variables [28]. In addition, the PR-BM equation also performs better in calculations under stress circumstances and is better suited for nonpolar systems [29].
P = R T V m b a V m ( V m + b ) + b ( V m b )
α ( T ) = ( exp ( c ( 1 T r d ) ) ) 2
d = 1 + k 2
c = 1 1 d
k = 0.3746 + 1.54226 w + 0.26992 w 2

3. Optimization Analysis

In this work, we select three models to simulate the distillation process under three different operating circumstances. Specifically, they are the divided wall distillation model, which considers both energy saving and separation efficiency [30], the single-column distillation model, and the double-column distillation model.

3.1. Divided Wall Distillation Model

3.1.1. Technological Process

Aspen Plus V9.0’s PETLYUK thermal coupling module can simulate the divided wall distillation column [31]. The feedstock flow rate of synthetic gasoline is 10,000 kg per hour. The main and auxiliary columns have 70 and 40 theoretical stages, respectively. The outlet position establishes the 40th theoretical stage of the main column, and the inlet position chooses the 20th theoretical stage of the auxiliary column. The initial values selected for the condenser pressure and single-stage pressure drop are 100 kPa and 2 kPa, separately. The feedstock temperature and the final heat transfer temperature at the bottom of the column are 70 °C and 90 °C, separately. Figure 2 depicts the precise procedure. In order to fully utilize low temperature heat resources when the sideline recovery is high, heat exchanger II can be added using the procedure shown on the dotted line.

3.1.2. Sensitivity Analysis

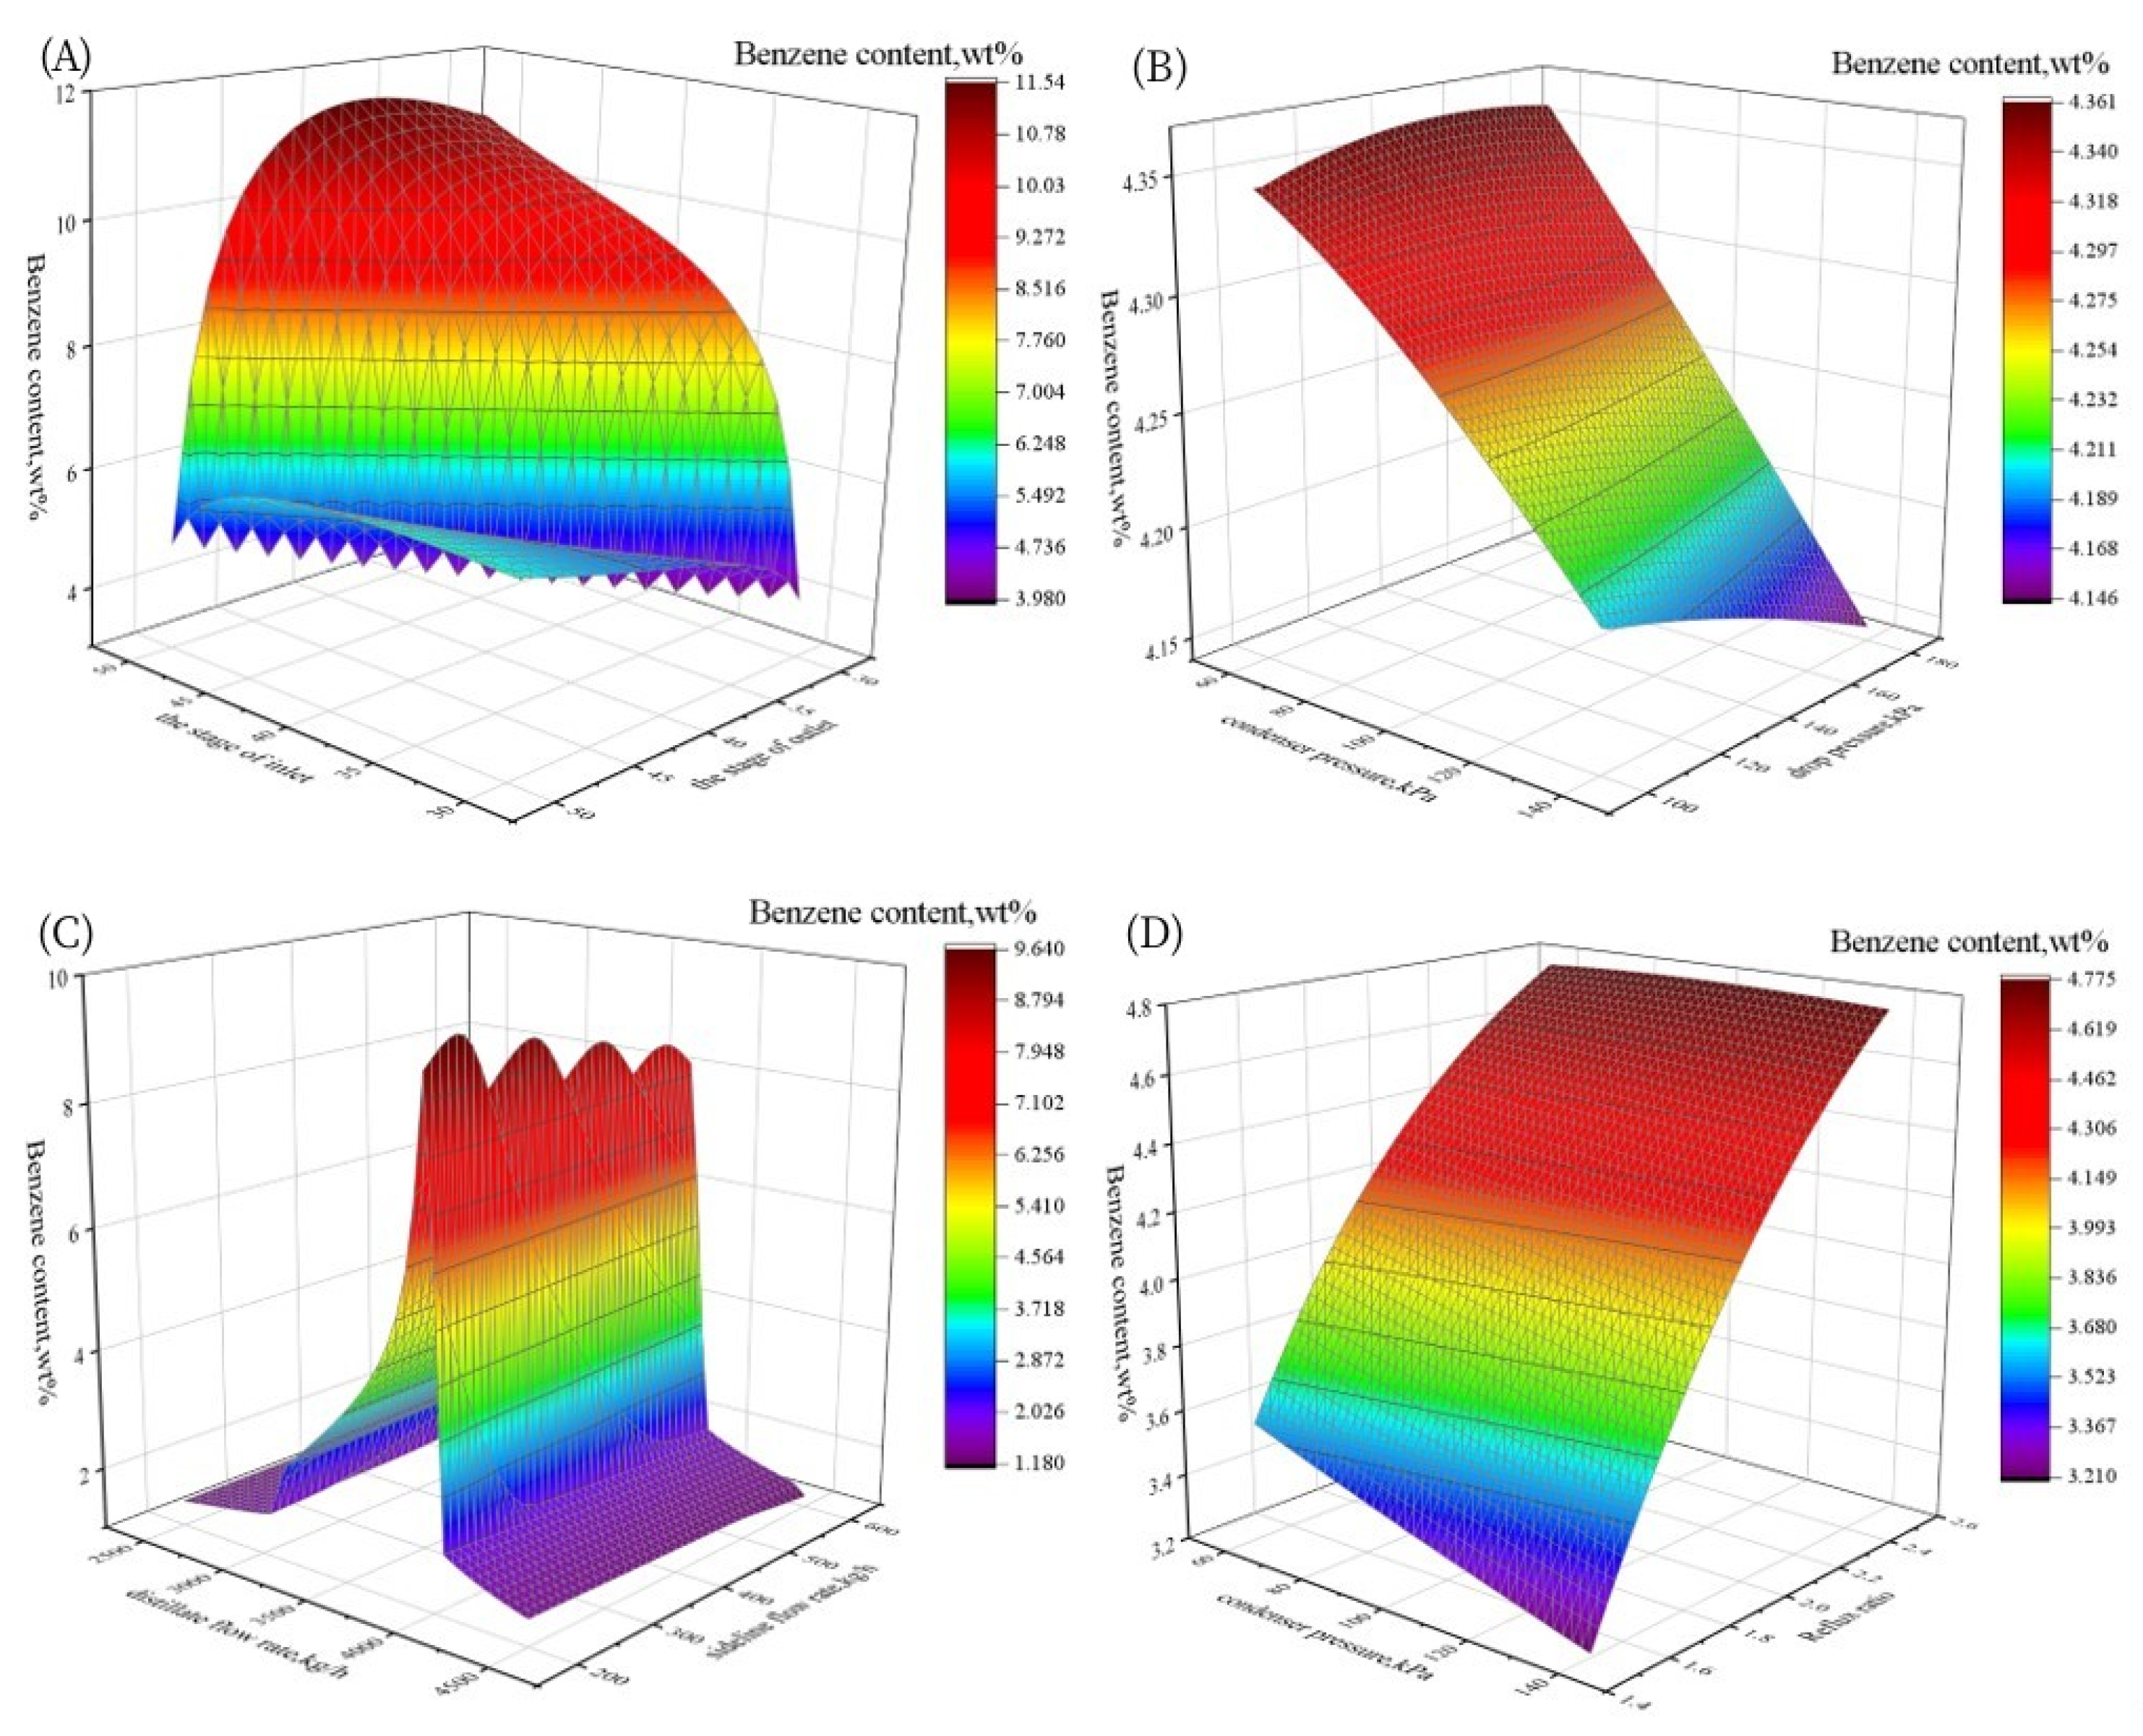
As opposed to the traditional distillation column, the divided wall distillation column adopts the coupling structure of the auxiliary column and main column, increasing the decision variables such as the liquid separation ratio, gas separation ratio, and the number of trays in multiple distillation column sections [32]. As a result, the optimization design and operation control become more complex and challenging [33,34,35]. Choose the proper settings to keep the system stable when constructing the process. The PETLYUK model performs sensitivity analysis for the number of inlet and outlet stages, gas–liquid interaction flow rate between the auxiliary and main columns, main column pressure and pressure drop, auxiliary column pressure and pressure drop, distillate flow rate and sideline flow rate, condenser pressure and reflux ratio in accordance with the design parameters, as shown in Figure 3.
According to Figure 3, we can draw the following conclusions within a specific range. The enrichment rate of sideline benzene has a low correlation with the number of the inlet stage and rises initially before falling as the number of the outlet stage rises. It rises as the gas phase interaction rate rises and the liquid phase interaction rate declines. It grows when the condenser pressure and drop of the main column decrease. It rises as the top pressure of the auxiliary column and the drop pressure of the auxiliary column increase. It rises as the distillate flow rate grows but has little effect on the sideline flow rate. Moreover, there is a maximum value with the change of reflux ratio.

3.1.3. Multi-Objective Optimization Analysis

The sideline flow rate is then used as the objective function, with the benzene content of the product serving as the constraint condition and the nine variables—all but the number of inlet and outlet stages—as the optimization conditions. Table 2 displays the outcomes of the SQP algorithm used for nonlinear multi-objective optimization in Aspen Plus.
Moreover, continue to change the benzene content in feedstock while searching for the best value within the same adjustment range. The yield of qualified gasoline gradually declines as the benzene content in feedstock grows. Fantastically, with a 1.5 wt% benzene level, the regular gasoline yield can still be 98.72 wt%. Because the SQP optimization module changes condenser pressure, column pressure drop, column top recovery, and other parameters, Figure 4 shows that even if the benzene content in feedstock rises, the energy consumption of the device will not be changed obviously. (The absolute percentage of the difference between the actual and theoretical benzene reductions is annotated on the x-axis).

3.2. Single-Column Distillation Model

It is suitable to opt for the RedFrac module to simulate the single-column distillation process. All other parameters of the model are the same as the divided wall distillation process, except for the column apparatus.

3.2.1. Sensitivity Analysis

The main factors in the single-column distillation column are the number of inlet and output stages, condenser pressure, drop pressure, distillate flow rate, sideline flow rate, and reflux ratio. According to the design specifications in the RedFrac module, sensitivity analysis is implemented in the seven variables, as shown in Figure 5.
Within a specific range, we can infer the following conclusions from Figure 5. The sideline benzene enrichment rate rises with the increase in the number of the inlet stage and the drop in the number of the outlet stage. It is inversely correlated with the condenser pressure but barely associated with the column pressure drop. It increases initially and subsequently decreases with the distillate flow rate, but with a modest correlation to the sideline flow rate. It is closely linked to the reflux ratio.

3.2.2. Multi-Objective Optimization Analysis

According to the result of the sensitivity analysis, we may change the number of the inlet and outlet stages to 50 and 40, respectively, due to their improper primary values. The sideline flow rate is then used as the objective function, with the benzene content of the product serving as the constraint condition and the five variables—aside from the number of the inlet and outlet stages—as the optimization conditions. Table 3 displays the outcomes of the SQP algorithm used for nonlinear multi-objective optimization in Aspen Plus.
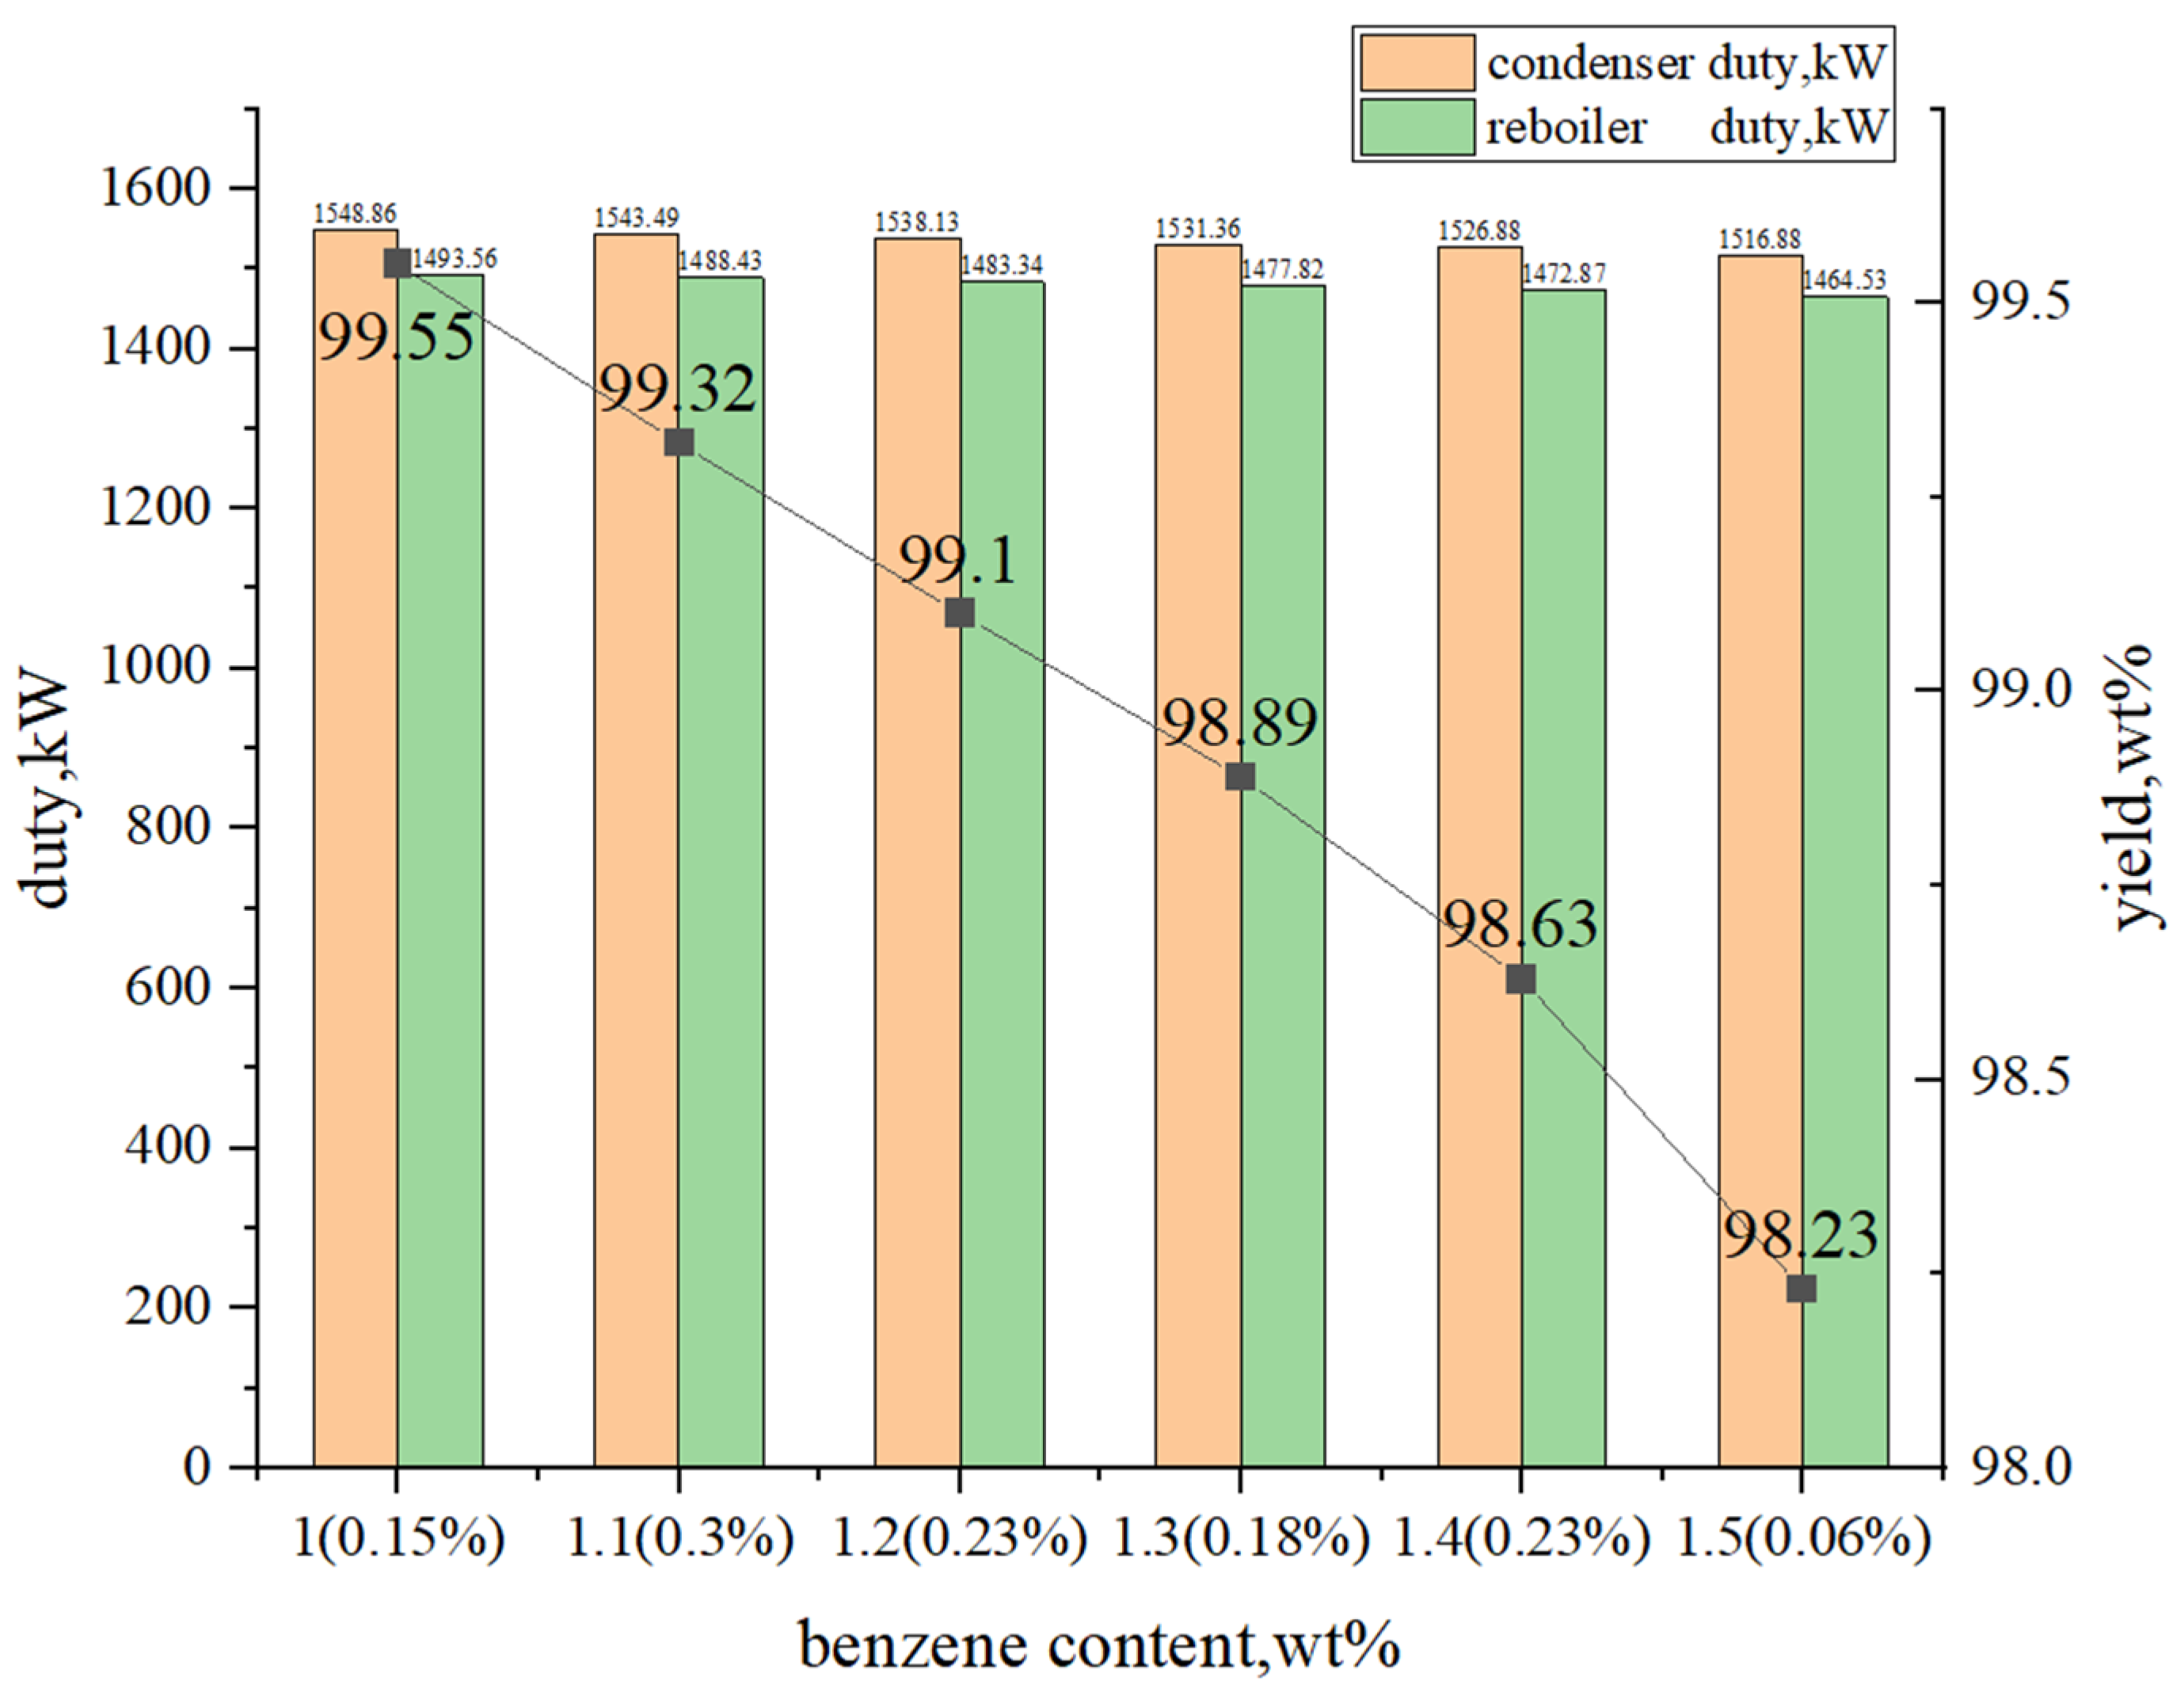
The benzene content in the feedstock is further varied, and the ideal value is determined within the same adjustment range. The yield of qualified gasoline gradually declines as the benzene content in feedstock rises. The gasoline yield can similarly reach 98.23 wt% even if the benzene level is only 1.5 wt%. According to Figure 6, the energy consumption of the device will not significantly increase even if the benzene content of the feedstock grows. This is also due to the SQP optimization module altering condenser pressure, column pressure drop, distillate flow rate, and other parameters when the benzene content rises.

3.3. Double-Column Distillation Model

In order to simulate the double-column distillation process, the RedFrac model can be properly used. Thirty-five theoretical stages are offered for columns I and II. The initial choice for the single-stage pressure drop is 2 kPa. Condenser pressures of columns I and II are initially adjusted at 170 kPa and 100 kPa, respectively. The number of the inlet stage chooses both the 20th theoretical stage of columns I and II. The final heat transfer temperatures of the two heat resources are set at 90 °C and 70 °C, respectively. Figure 7 depicts the precise procedure.

3.3.1. Sensitivity Analysis

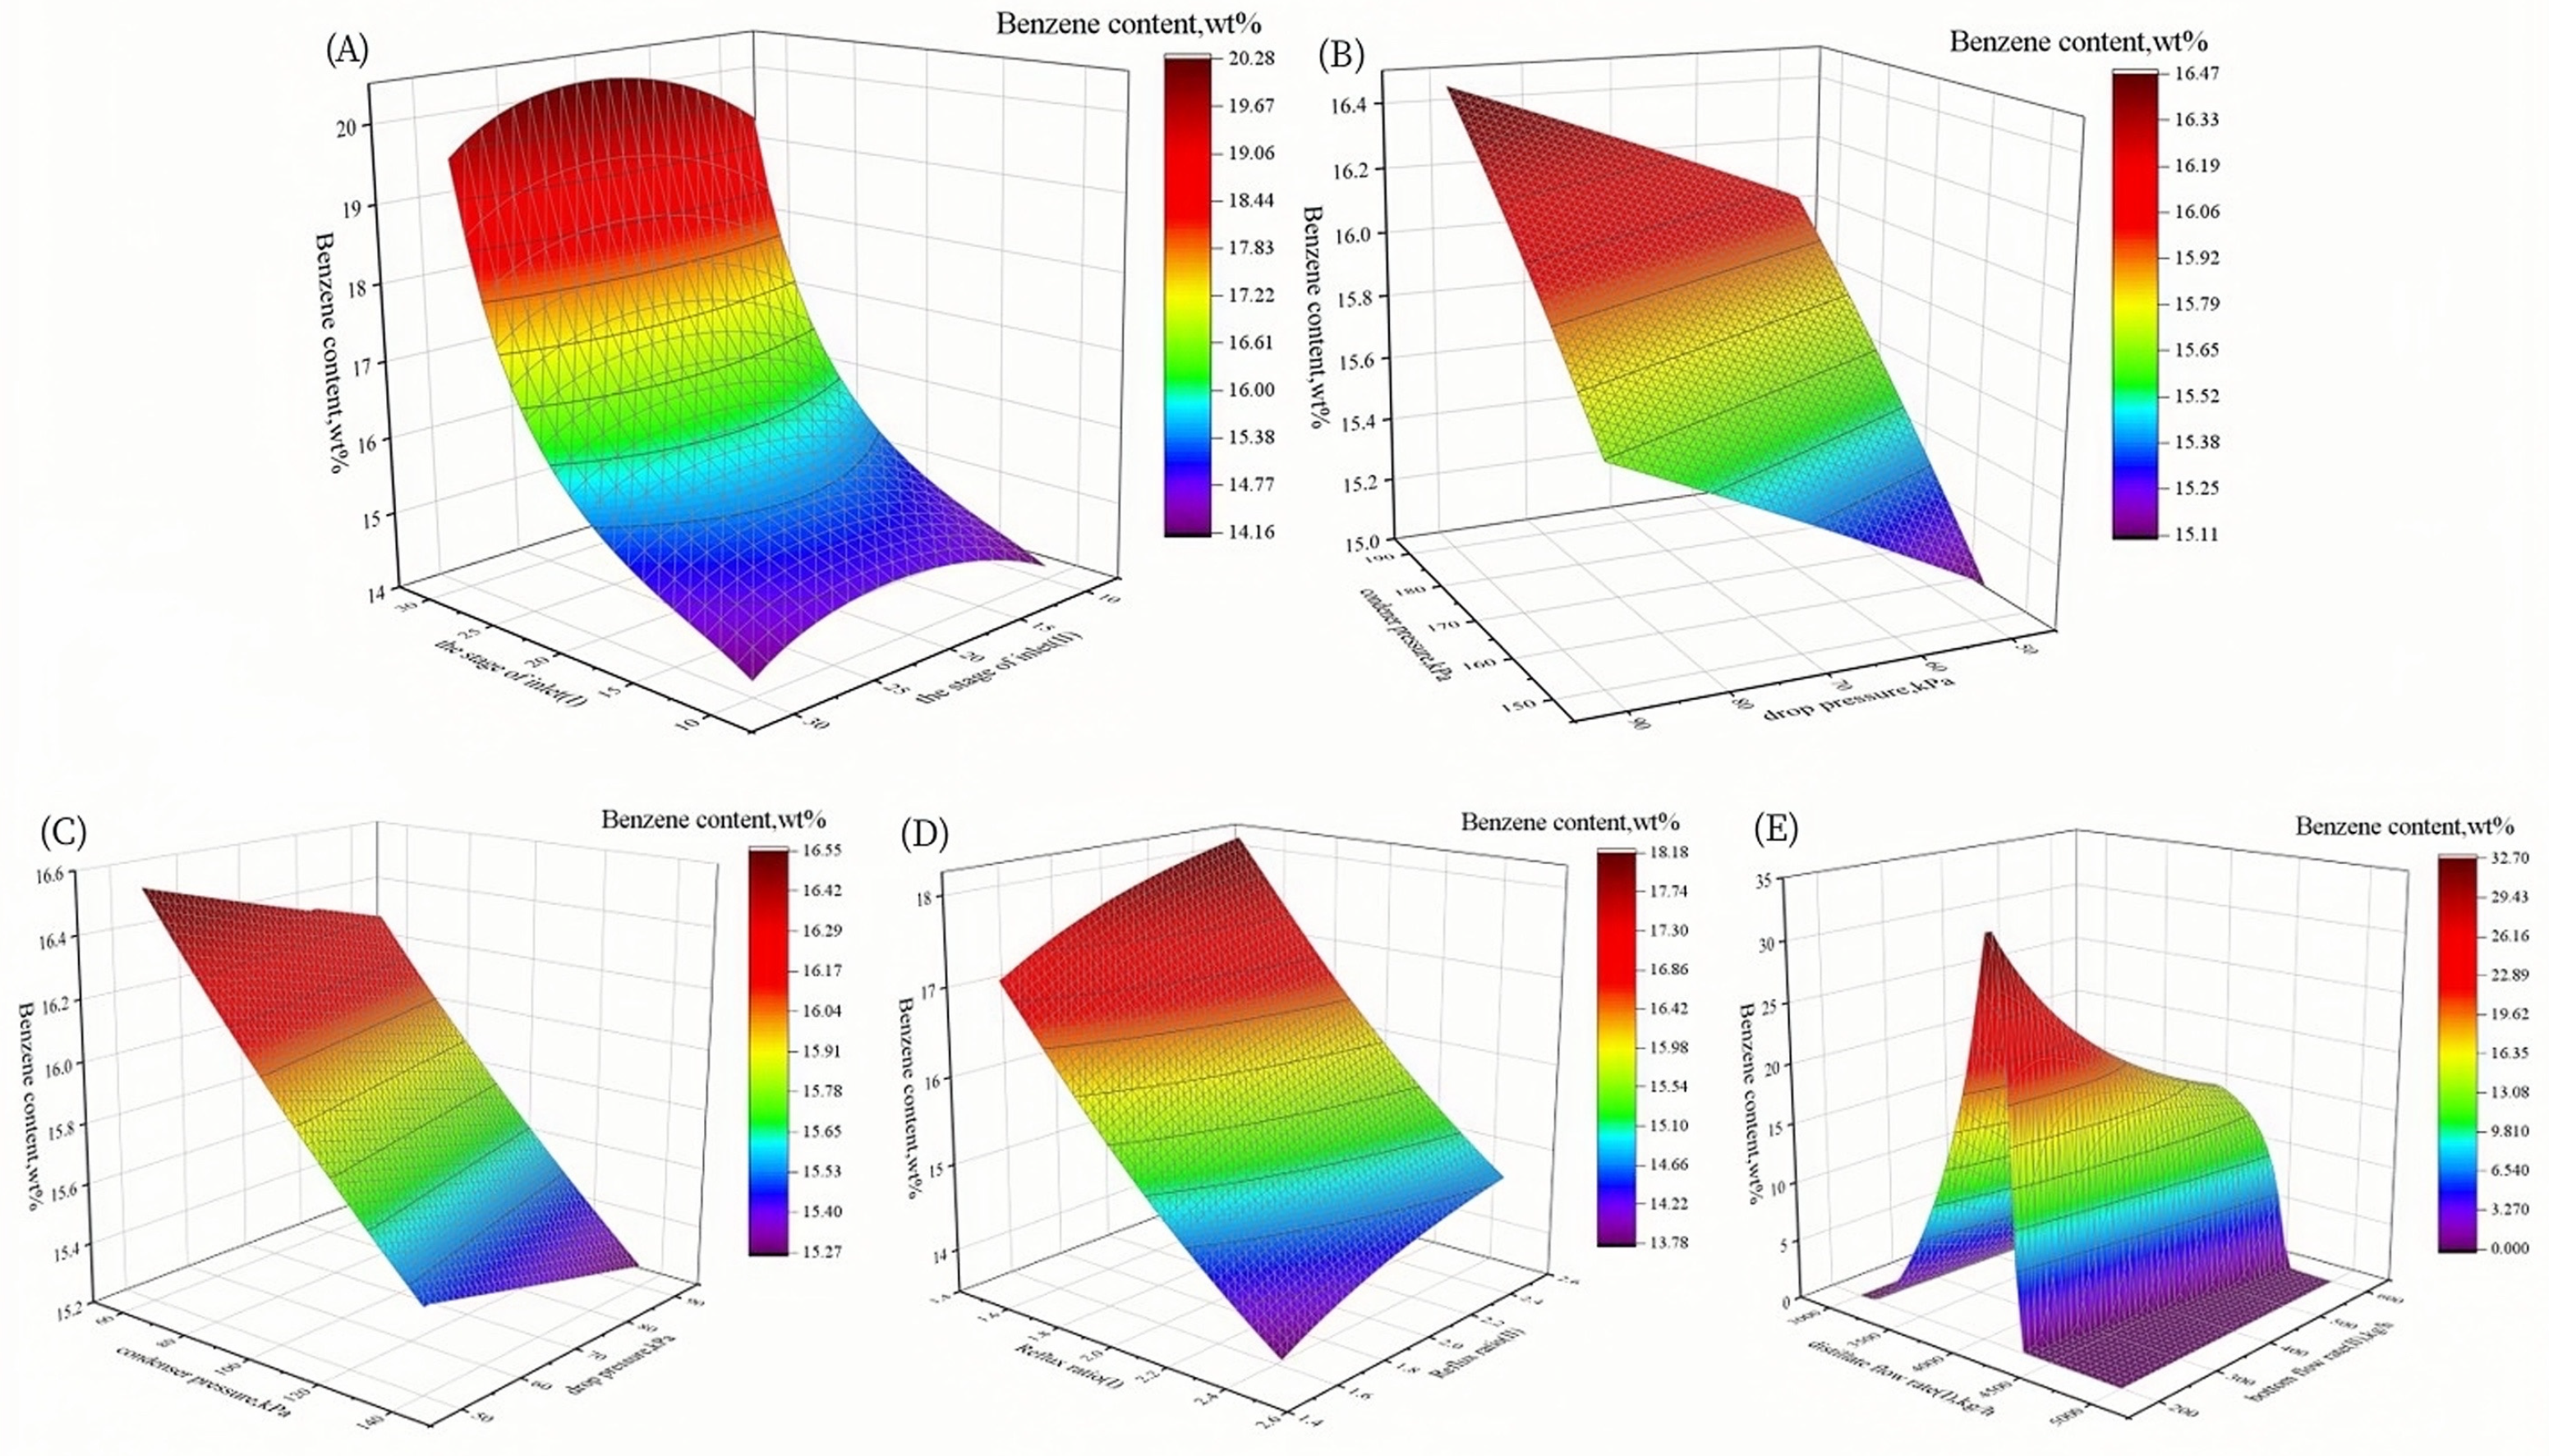
The number of inlet and outlet stages, condenser pressure, column pressure drop, distillate flow rate, bottom flow rate and reflux ratio are the main factors in the double-column distillation column adjustment. The ten variables listed are subjected to sensitivity analysis in the RedFrac model in accordance with the design parameters, as illustrated in Figure 8.
Within a certain range, we can infer the following conclusions from Figure 8. Although there is little association between the enrichment rate of benzene and the number of the inlet stage in column II, it does increase as the number of the inlet stage in column I increases. It rises as the condenser pressure and the drop pressure in column I increase. It rises as the condenser pressure and the drop pressure in column II decrease. It grows as the reflux ratio of column I decreases and the reflux ratio of column II increases. It grows initially and then drops with the distillate flow rate in column I, but has little to do with the bottom flow rate in column II.

3.3.2. Multi-Objective Optimization Analysis

According to the result of the sensitivity analysis, the number of the inlet stage can be changed to 30 due to its improper primary value. The sideline flow rate is then used as the objective function, with the benzene content in feedstock serving as the constraint condition and the eight variables—all but the number of inlet and outlet stages—as the optimization conditions. Table 4 displays the outcomes of the SQP algorithm used for nonlinear multi-objective optimization in Aspen Plus.
The benzene level of feedstock is further varied, and the ideal value is determined within the same adjustment range. The output of qualified gasoline gradually declines as the benzene content in feedstock rises. Identically, even with a 1.5 wt% benzene level, the gasoline yield might still be 99.22 wt%. According to Figure 9, the energy consumption of the device will not significantly increase even if the benzene content of the feedstock rises. This is also due to the SQP optimization module changing condenser pressure, column pressure drop, distillate flow rate, and other parameters when the benzene content grows. The qualified gasoline yield is larger than the divided wall distillation model and the single-column distillation model, while the energy consumption is also higher.

4. Comprehensive Comparison

Industrialization is mainly determined by the catalytic cracking gasoline distillation’s economic effectiveness in reducing benzene. While the refinery primarily produces high-temperature and high-pressure steam through CFB boilers and sends it to the needed unit through the pressure reducer and attemperator, the unit’s reboiler uses medium-pressure steam as its heat source. Since low-quality coal serves as the primary fuel for CFB boilers, the heat load of a reboiler can be translated into the heat value of standard coal. The economic accounting is displayed in Table 5 in accordance with the internal accounting in the refinery and the Chinese energy calculation standard [36].
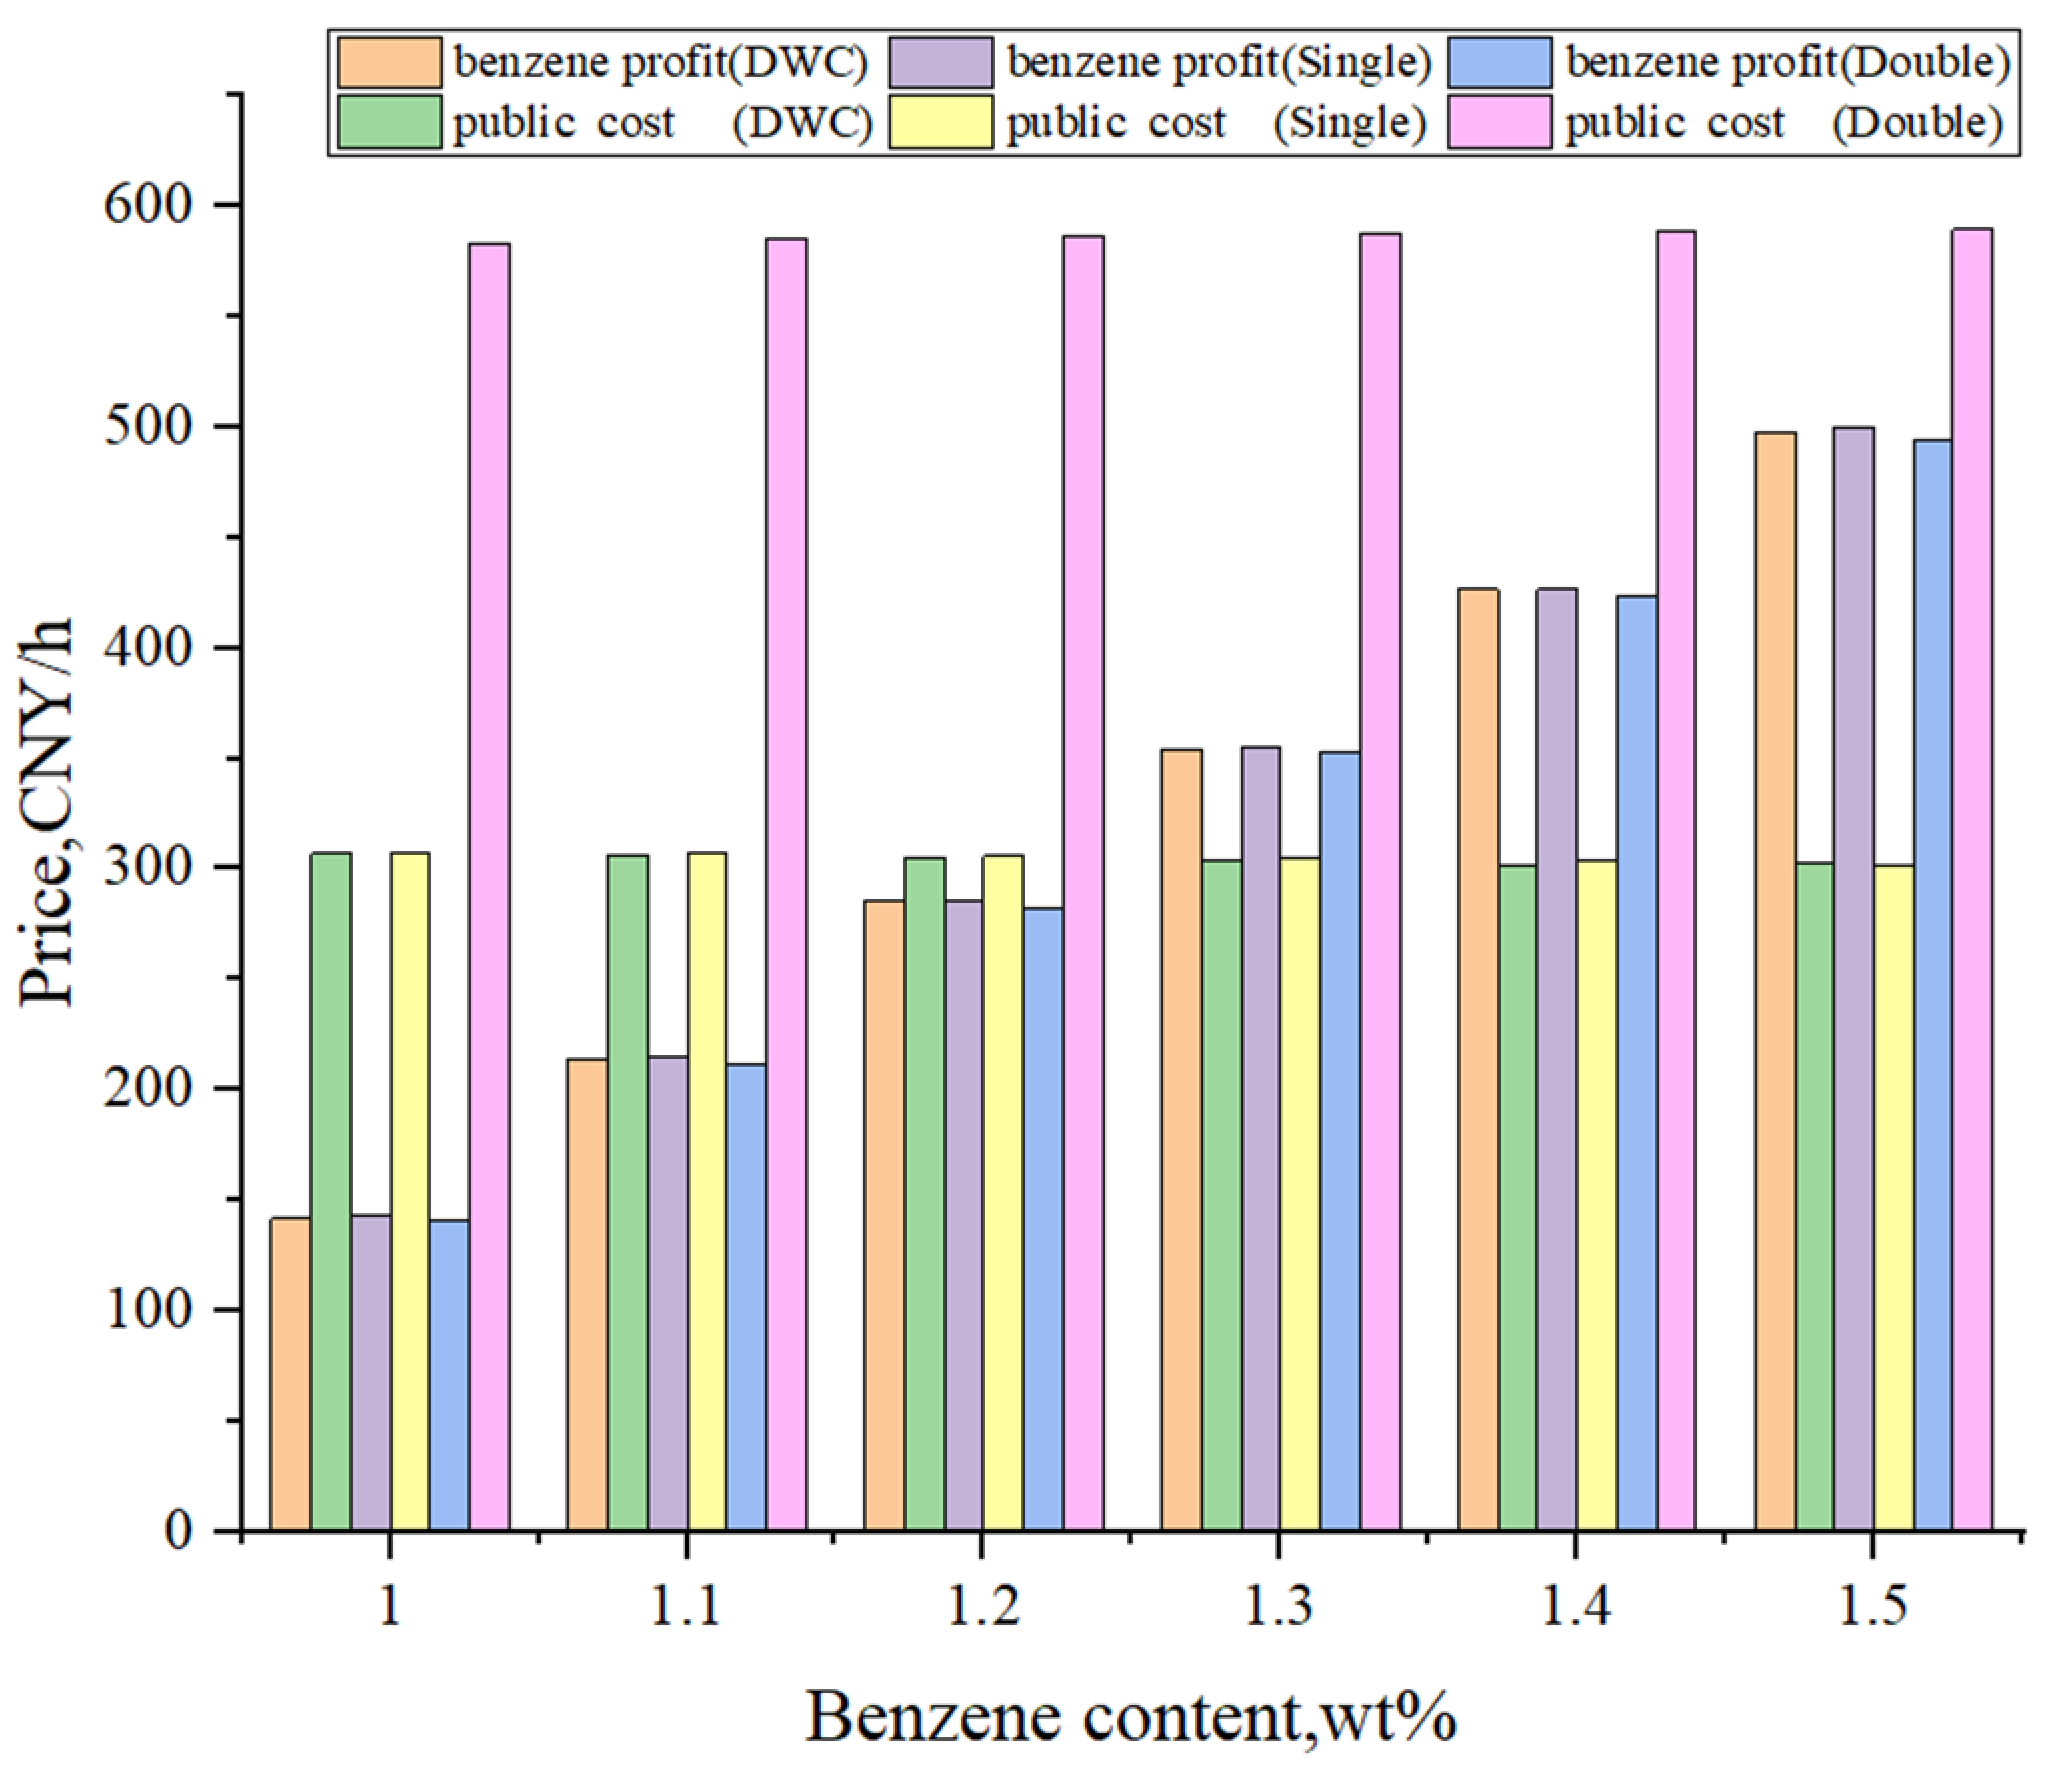
Therefore, the economic accountings of the divided wall distillation model, single-column distillation model, and double-column distillation model are carried out under the calculation criterion in Table 5, as illustrated in Figure 10.
The profit of recyclable benzene gradually rises as the benzene content in feedstocks grows, according to the information in the figure. When the benzene content exceeds 1.3 wt% for the divided wall distillation and single-column distillation processes, the benzene recovery profit even surpasses the public cost. On the other hand, the double-column distillation scheme grows with the public cost. In this scheme, benzene has the highest enrichment rate of the three models, but from an economic perspective, further optimization is required to achieve the prospect of industrialization.

5. Conclusions

Three distillation processes reduce the amount of benzene in catalytic cracking gasoline. The benzene enriched is recovered by extraction unit based on the benzene content in gasoline meeting the national norm, and the following conclusions are drawn.
(1) In comparison to the single-column distillation model, the divided wall distillation model and the double-column distillation model have more free variables. By regulating more factors, a higher benzene enrichment rate and gasoline yield can be achieved. However, double-column distillation needs higher energy consumption, and divided wall distillation needs rather complicated column equipment.
(2) Economic accountings reveal that the profit from benzene recovery compensates for or even exceeds the public cost for the divided wall distillation model and the single-column model as the benzene content in feedstock increases. Even with the single-column model, the qualified gasoline yield may reach a commendable 98.23 wt% when the benzene content in the feedstock is 1.5 wt%. Moreover, neither the overall ASTM D86 parameters nor the octane number of gasoline would be adversely impacted.
In other words, even though the optimization does not conduct a global search, there is a chance that the algorithm will locally converge to the maximum value. We can continue demonstrating the viability of distilling the benzene reduction process to produce the qualified gasoline. It offers theoretical guidance for businesses to perform pertinent optimization.

Author Contributions

Conceptualization, Z.W.; methodology, Z.W.; software, Z.W.; validation, Z.W; formal analysis, Z.W.; investigation, Z.W.; resources, Z.W.; data curation, Z.W.; writing—original draft preparation, Z.W.; writing—review and editing, Z.W.; visualization, Z.W.; supervision, Z.S., J.L. and J.S.; project administration, Z.W.; funding acquisition, M.K. All authors have read and agreed to the published version of the manuscript.

Funding

This research was funded by the National Natural Science Fund Project (Grant No. 21776505).

Data Availability Statement

Not applicable.

Conflicts of Interest

The authors declare no conflict of interest.

Abbreviations

ppressure
Vmole volume
Rgas constant
Tabsolute temperature
a&brelated to the characteristics of the component and can be expressed as a function of critical temperature
α (T) temperature function
Trreduced temperature
ωacentric factor

References

  1. Brelsford, R. US refiners complete MSAT II-compliance projects. Oil Gas J. 2016, 114, 31–32. [Google Scholar]
  2. DIN EN 228-2013; Automotive Fuels—Unleaded Petrol—Requirements and Test Methods. Deutsches Institut für Normung e.V.: Berlin, Germany, 2013.
  3. GB 18352.6-2016; Limits and Measurement Methods for Emissions from Light-Duty Vehicles (CHINA 6). Ministry of Ecology and Environment of People’s Republic of China: Beijing, China, 2020.
  4. GB 18352.5-2013; Limits and Measurement Methods for Emissions from Light-Duty Vehicles (CHINA 5). Ministry of Ecology and Environment of People’s Republic of China: Beijing, China, 2018.
  5. Spurling, R. Reducing Benzene in Gasoline: The National Challenge. In Proceedings of the 2007 NPRA Annual Meeting, San Antonio, TX, USA, 18–20 March 2007. [Google Scholar]
  6. Laredo, G.C.; Marroquin, J.O.; Castillo, J.; Perez-Romo, P.; Navarrete-Bolaños, J. Benzene reduction in gasoline by olefin alkylation: Effect of the catalyst on a C6-reformate heart-cut. Appl. Catal. A Gen. 2009, 363, 19–26. [Google Scholar] [CrossRef]
  7. Laredo, G.C.; Castillo, J.J.; Navarrete-Bolaños, J.; Perez-Romo, P.; Lagos, F.A. Benzene reduction in gasoline by alkylation with olefins: Comparison of beta and MCM-22 catalysts. Appl. Catal. A Gen. 2012, 413, 140–148. [Google Scholar] [CrossRef]
  8. Laredo, G.C.; Quintana-Solórzano, R.; Castillo, J.J.; Armendáriz-Herrera, H.; Garcia-Gutierrez, J.L. Benzene reduction in gasoline by alkylation with propylene over MCM-22 zeolite with a different Brønsted/Lewis acidity ratios. Appl. Catal. A Gen. 2013, 454, 37–45. [Google Scholar] [CrossRef]
  9. Laredo, G.C.; Castillo, J.; Marroquin, J.O.; Hernandez, F. Benzene reduction in gasoline by alkylation with olefins: Effect of the feedstock on the catalyst deactivation. Appl. Catal. A Gen. 2009, 363, 11–18. [Google Scholar] [CrossRef]
  10. Laredo, G.C.; Castillo, J.; Armendariz-Herrera, H. Benzene reduction in gasoline by alkylation with olefins: Effect of the experimental conditions on the product selectivity. Appl. Catal. A Gen. 2010, 384, 115–121. [Google Scholar] [CrossRef]
  11. Rock, K. Benzene Reduction at Lowest Capital Cost. In Proceedings of the 2008 NPRA Annual Meeting, San Diego, CA, USA, 9–11 March 2008. [Google Scholar]
  12. Brian, J.S. Technology Advancements in Benzene Saturation; NPRA Q & A Technology Forum: San Antonio, TX, USA, 2007. [Google Scholar]
  13. Nocca, J.L. Benzene Management in a MSAT 2 Environment. In Proceedings of the 2008 NPRA Annual Meeting, San Diego, CA, USA, 9–11 March 2008. [Google Scholar]
  14. Podrebarac, G.G.; Foley, R. Benzene Removal from FCC Naphtha. U.S. Patent US7501549B2, 10 March 2009. [Google Scholar]
  15. Fan, J.Y.; Yang, X.; Zhao, Z.; Duan, A.J.; Xu, C.M.; Zheng, P.; Wang, X.L.; Jiang, G.Y.; Liu, J.; Wei, Y.C. Study on hydrodesulfurization of L/W coexistence zeolite modified by magnesium for FCC gasoline. Energy Fuels 2017, 32, 777–786. [Google Scholar] [CrossRef]
  16. Zhou, C.L.; Chen, T.; Chen, T.; Li, Z.P.; Li, X.F. CFD analysis of flow field in aromatics extraction unit. In IOP Conference Series: Earth and Environmental Science, Proceedings of the 2020 4th International Workshop on Advances in Energy Science and Environment Engineering, Hangzhou, China, 10–12 April 2020; IOP Publishing Ltd.: Bristol, UK, 2020; Volume 512, p. 012178. [Google Scholar]
  17. Zhang, Q.J.; Sun, L.N.; Wei, N.; Wu, L.; Mao, H.J. The characteristics and source analysis of VOCs emissions at roadside: Assess the impact of ethanol-gasoline implementation. Atmos. Environ. 2021, 263, 118670. [Google Scholar] [CrossRef]
  18. Cantero, C.A.T.; Zúñiga, R.P.; García, M.M.; Cabral, S.R.; Calixto-Rodriguez, M.; Martínez, J.S.V.; Enriquez, M.G.M.; Estrada, A.J.P.; Torres, G.O.; Sorcia-Vázquez, F.J.; et al. Design and control applied to an extractive distillation column with salt for the production of bioethanol. Processes 2022, 10, 1792. [Google Scholar] [CrossRef]
  19. Morales, J.Y.R.; López, G.L.; Martínez, V.M.A.; Vázquez, F.J.S.; Mendoza, J.A.B.; García, M.M. Parametric study and control of a pressure swing adsorption process to separate the water-ethanol mixture under disturbances. Sep. Purif. Technol. 2020, 236, 116214. [Google Scholar] [CrossRef]
  20. Morales, J.Y.R.; Mendoza, J.A.B.; Torres, G.O.; Vázquez, F.J.S.; Rojas, A.C.; Vidal, A.F.P. Fault-tolerant control implemented to hammerstein–wiener model: Application to Bio-ethanol dehydration. Fuel 2022, 308, 121836. [Google Scholar] [CrossRef]
  21. Morales, J.Y.R.; Ortiz-Torres, G.; García, R.O.D.; Cantero, C.A.T.; Rodriguez, M.C.; Sarmiento-Bustos, E.; Oceguera-Contreras, E.; Hernández, A.A.F.; Cerda, J.C.R.; Molina, Y.A.; et al. Review of the pressure swing adsorption process for the production of biofuels and medical oxygen: Separation and purification technology. Adsorpt. Sci. Technol. 2022. [Google Scholar] [CrossRef]
  22. Cantero, C.A.T.; Lopez, G.L.; Alvarado, V.M.; Jimenez, R.F.E.; Morales, J.Y.R.; Coronado, E.M.S. Control structures evaluation for a salt extractive distillation pilot plant: Application to bio-ethanol dehydration. Energies 2017, 10, 1276. [Google Scholar] [CrossRef] [Green Version]
  23. Han, S.P. A globally convergent method for nonlinear programming. J. Optim. Theory 1977, 22, 297–309. [Google Scholar] [CrossRef] [Green Version]
  24. Powell, M.J.D. A fast algorithm for nonlinearly constrained optimization calculations. Math. Program. 1978, 45, 547–566. [Google Scholar] [CrossRef]
  25. Lv, Z.Y.; Yang, L.; Wu, L.; Peng, J.F.; Zhang, Q.J.; Sun, M.; Mao, H.J.; Min, J. Comprehensive analysis of the pollutant characteristics of gasoline vehicle emissions under different engine, fuel, and test cycles. Energies 2022, 15, 622. [Google Scholar] [CrossRef]
  26. Cui, C.; Billa, T.; Zhang, L.Z.; Shi, Q.; Zhao, S.Q.; Klein, M.T.; Xu, C.M. Molecular representation of the petroleum gasoline fraction. Energy Fuels 2018, 32, 1525–1533. [Google Scholar] [CrossRef]
  27. Hosseinifar, P.; Shahverdi, H. Prediction of the ASTM and TBP distillation curves and specific gravity distribution curve for fuels and petroleum fluids. Can. J. Chem. Eng. 2022, 100, 3288. [Google Scholar] [CrossRef]
  28. Peng, D.Y.; Robinson, D.B. A new two-constant equation of state. Ind. Eng. Chem. Fundam. 1976, 15, 59–64. [Google Scholar] [CrossRef]
  29. Li, C.Y.; Gao, Y.H.; Xia, S.Q.; Shang, Q.Y.; Ma, P.S. Calculation of the phase equilibrium of CO2–Hydrocarbon binary mixtures by PR-BM EOS and PR EOS. Trans. Tianjin Univ. 2019, 25, 540–548. [Google Scholar] [CrossRef]
  30. Gao, X.; Zhao, Y.; Yuan, W.; Liu, S.L.; Li, X.G.; Li, H.; Wang, S.X.; Lu, X.S. Thermodynamics fundamentals and energy efficiency for the separation and high-valued utilization of Fischer–Tropsch heavy oil. Int. J. Coal Sci. Technol. 2019, 58, 9118–9126. [Google Scholar]
  31. Tamayo-Galván, V.E.; Segovia-Hernández, J.G.; Hernández, S.; Hernández, H. Controllability analysis of modified Petlyuk structures. Can. J. Chem. Eng. 2008, 86, 62–71. [Google Scholar] [CrossRef]
  32. Laleh, T.M.; Yuan, X.G.; Luo, Y.Q.; Gong, C.; Yu, G.C. Numerical investigation on effect of vapor split ratio to performance and operability for dividing wall column. Chin. J. Chem. Eng. 2013, 21, 72–78. [Google Scholar]
  33. Kim, Y.H. Rigorous design of extended fully thermally coupled distillation columns. Chem. Eng. J. 2002, 89, 89–99. [Google Scholar] [CrossRef]
  34. Amminudin, K.A.; Smith, R.; Thong, D.Y.C.; Towler, G.P. Design and optimization of fully thermally coupled distillation columns Part 1: Preliminary design and optimization methodology. Chem. Eng. Res. Des. 2001, 79, 701–715. [Google Scholar] [CrossRef] [Green Version]
  35. Wenzel, S.; Röhm, H.J. Design of complex distillation columns by overall-cost optimization. Chem. Eng. Technol. 2004, 27, 484–490. [Google Scholar] [CrossRef]
  36. SH/T 5000-2011; The Calculation Method of CO2 Emissions in Petrochemical Production. China Petrochemical Press: Beijing, China, 2011.
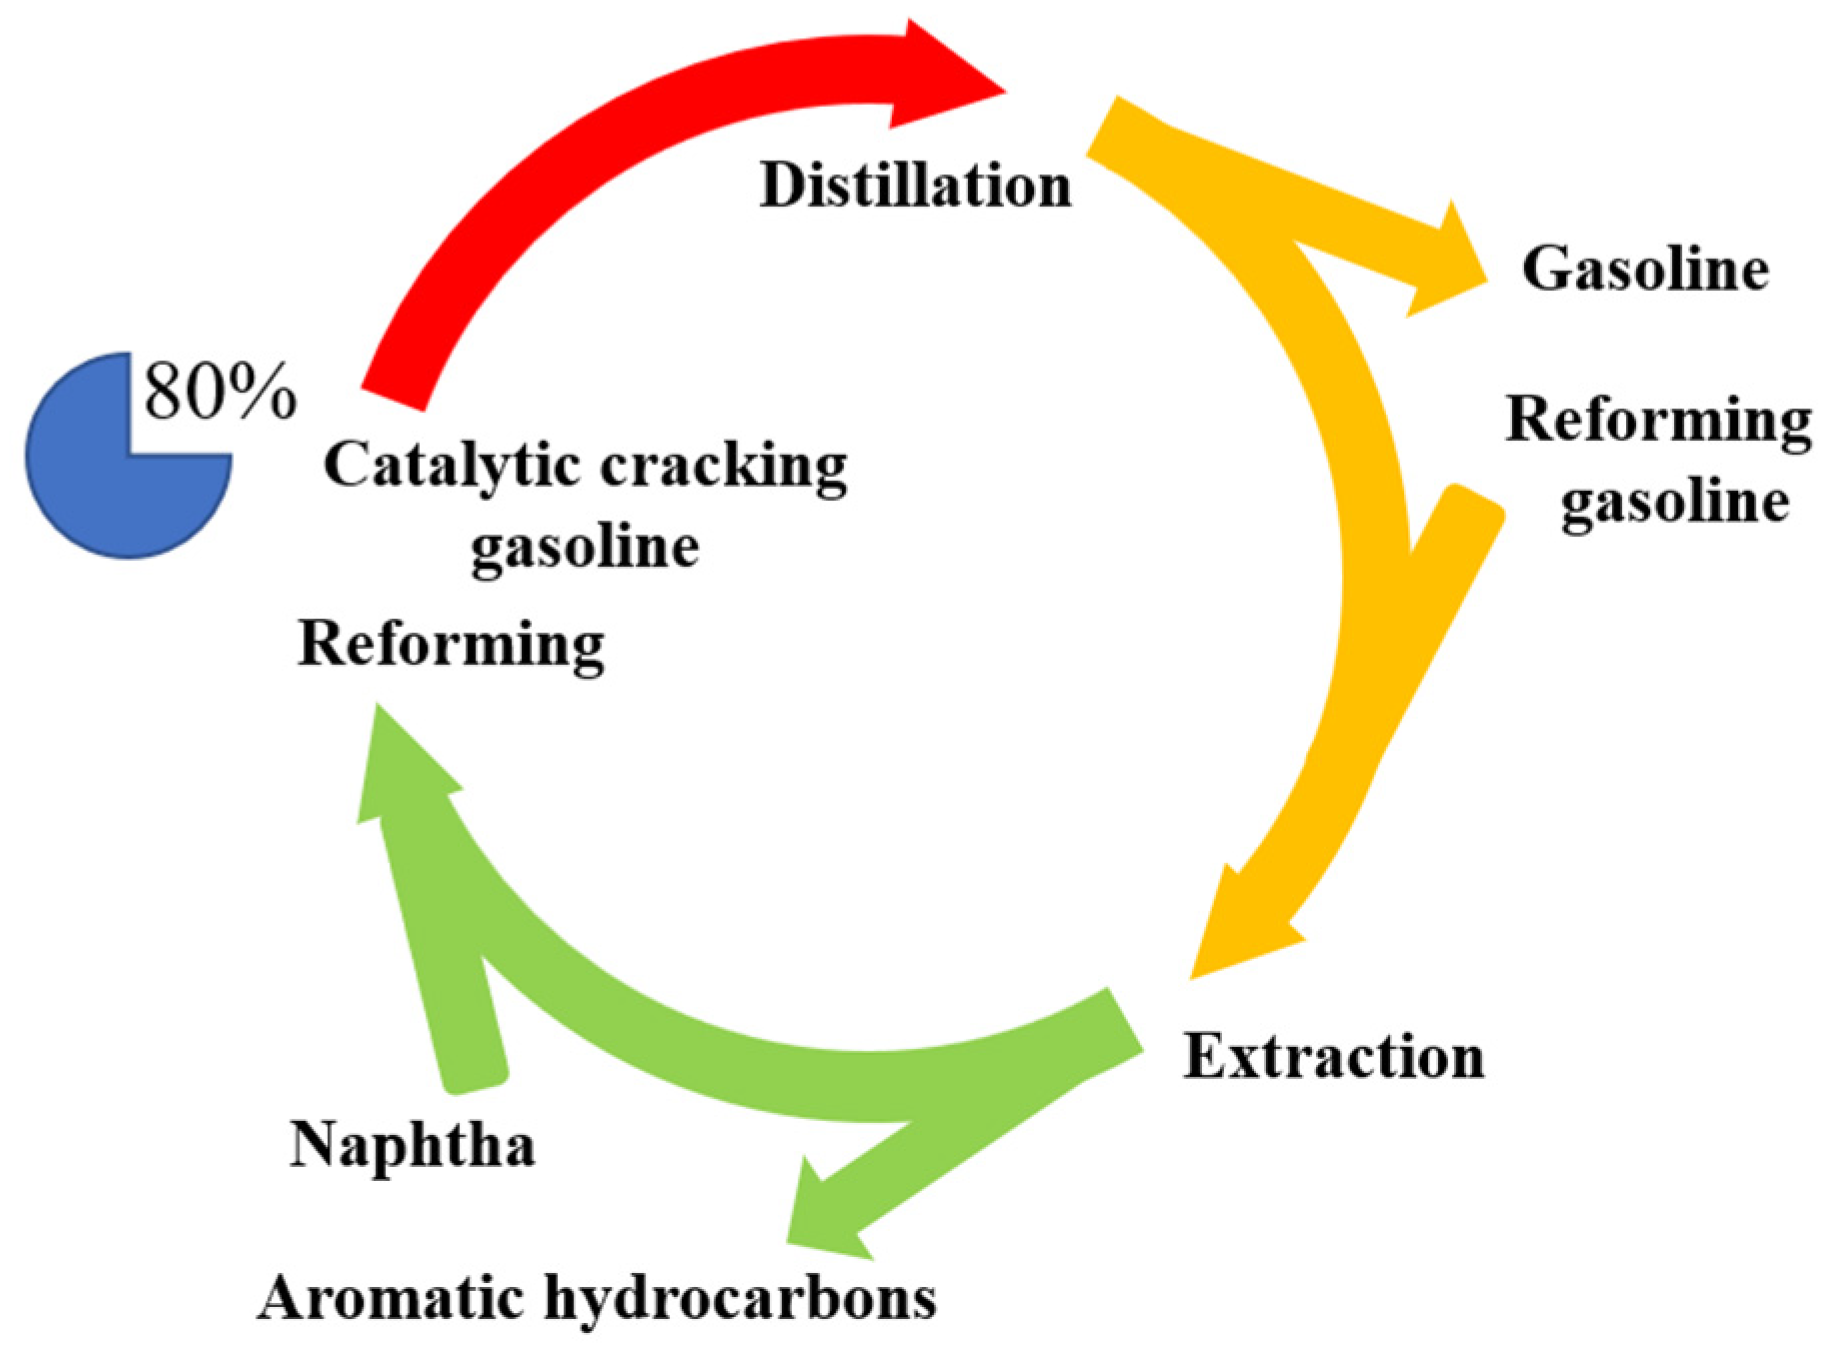
Figure 1. The new benzene reduction procedure.
Processes 11 00151 g001
Figure 2. Divided wall distillation process diagram.
Processes 11 00151 g002
Figure 3. Sensitivity analysis of benzene content. (A): The number of inlet and outlet stages; (B): gas-liquid interaction flow rate between the auxiliary column and the main column; (C): condenser pressure and pressure drop of the main column; (D): pressure and pressure drop of the auxiliary column; (E): distillate flow rate and sideline flow rate; (F): condenser pressure and reflux ratio.
Processes 11 00151 g003
Figure 4. Optimization results of different benzene content.
Processes 11 00151 g004
Figure 5. Sensitivity analysis of benzene content. (A): The number of the inlet and outlet stages; (B): condenser pressure and pressure drop of the column; (C): distillate flow rate and sideline flow rate; (D): condenser pressure and reflux ratio.
Processes 11 00151 g005
Figure 6. Optimization results of different benzene content.
Processes 11 00151 g006
Figure 7. Double-column distillation process diagram.
Processes 11 00151 g007
Figure 8. Sensitivity analysis of benzene content. (A): The number of inlet stages (column I and column II); (B): condenser pressure and pressure drop of the column I; (C): condenser pressure and pressure drop of the column II; (D): reflux ratio (column I and column II); (E): distillate flow rate of column I and bottom flow rate of column II.
Processes 11 00151 g008
Figure 9. Optimization results of different benzene content.
Processes 11 00151 g009
Figure 10. The economic accountings of the three processes.
Processes 11 00151 g010
Table 1. Measured and simulated data.
Measured Data ASTM (D86)AssaySimulation
density736.1 kg/m30%30 °C15.0 °C
vapor pressure78.8 kPa10%48.6 °C45.4 °C
sulfur content647.4 ppm50%97.5 °C96.6 °C
chlorine content0.5 ppm90%174.9 °C175.0 °C
aromatic content25.6 wt%95%187.3 °C186.4 °C
olefin content28.3 wt%100%200 °C197.8 °C
Table 2. Multi-objective optimization analysis.
VariablesUnitRangeStep SizeOptimization Value
Sideline productskg/hr[10–300]0.0137.68
Condenser pressurekPa[60–140]0.0160.02
Drop pressure (M)kPa[100–180]0.01124.91
Top pressure (A)kPa[130–150]0.01130.00 (lower)
Drop pressure (A)kPa[70–90]0.0170.23
Interconnect (V)kg/hr[1500–2500]0.011503.92
Interconnect (L)kg/hr[3500–4500]0.014499.85
Distillate productskg/hr[2500–4500]0.014016.65
Reflux ratio-[1.5–2.5]0.012.5 (upper)
Table 3. Multi-objective optimization analysis.
VariablesUnitRangeStep SizeOptimization Value
Sideline productskg/hr[10–300]0.0145.42
Condenser pressurekPa[60–140]0.0160 (lower)
Drop pressurekPa[100–180]0.01100 (lower)
Distillate productskg/hr[2500–4500]0.014028.06
Reflux ratio-[1.5–2.5]0.012.50 (upper)
Table 4. Multi-objective optimization analysis.
VariablesUnitRangeStep SizeOptimization Value
Condenser pressure (I)kPa[150–190]0.01150.00 (lower)
Drop pressure (I)kPa[50–90]0.0175.15
Reflux ratio (I)-[1.5–2.5]0.012.5 (upper)
Distillate products (I)kg/hr[3000–5000]0.013936.78
Bottom products (II)kg/hr[10–300]0.0121.74
Condenser pressure (II)kPa[60–140]0.0160.00 (lower)
Drop pressure (II)kPa[50–90]0.0150.00 (lower)
Reflux ratio (II)-[1.5–2.5]0.012.5 (upper)
Table 5. Economic accounting.
EnergyPrice, CNYCalorific ValueNote
Benzene7/kg--
Cooling water0.26/t45.071 MJ/t25 °C/35 °C
Standard coal1.5/kg29.271 MJ/kg-
Disclaimer/Publisher’s Note: The statements, opinions and data contained in all publications are solely those of the individual author(s) and contributor(s) and not of MDPI and/or the editor(s). MDPI and/or the editor(s) disclaim responsibility for any injury to people or property resulting from any ideas, methods, instructions or products referred to in the content.