1. Introduction
Increased human activities, including in the industrial sector, are highly linked to increased carbon emissions which have been identified as the main cause of the increased global temperature (global warming) [
1]. In 2019, the European Commission published a set of guidelines, known as the EU Green Deal, aiming to overcome climate change via becoming the first carbon neutral continent by 2050 [
2]. The Green Deal is a pan European strategy, focusing on transforming Europe into a competitive economy decoupled from resource use, with no person and no place left behind in this initiative [
3]. The EU Green Deal involves several actions in order to promote efficient use of resources for a cleaner, greener, and more circular economy, to restore biodiversity and to reduce pollution, via supporting research and innovation for the development of greener solutions. The EU Commission is keen on supporting manufacturing companies financially for the integration of novel technologies since manufacturing is considered one of the top contributors in carbon emissions.
Until now, the majority of the related research have been focusing on energy efficiency, since energy is the highest contributor in carbon emissions regardless of the source of energy consumption (domestic usage, industry usage or transport usage) [
4,
5,
6,
7,
8,
9]. Other approaches have focused on developing the life cycle of products from linear economy scenarios (make, use, dispose) to circular economy scenarios which use recycling or reusing to increase the lifecycle of products [
10,
11,
12,
13,
14,
15,
16,
17].
The abovementioned approaches have only been focusing on a specific part of the products, processes, or production lines, most of them assuming that the step in question was the heaviest contributor in the carbon footprint of the product, process, or production line. A recently published work [
18] performed a sensitivity analysis on three different types of processes (material removal, primary forming, and deforming) and showed that the most carbon intensive step is not always the one related to the energy but depends on the type of process or the specific case study and can also be related to raw material selection. The previously mentioned work proposed a more holistic approach used for the calculation and reduction of the carbon footprint.
The current work aims to compare the environmental impact of two frequently used material removal processes in industry (drilling and milling) via comparing conventional and non-conventional methods and determining the carbon intensive part of the processes.
2. Materials and Methods
2.1. Manufacturing Levels
All industrial production lines can be classified per process, machine tool, and system level, with the process level related to the process itself, the machine tool level to the auxiliary processes contributing to the processes, and the system level to the overall production, disposal, and transport of materials, tools, and products.
The previously described holistic approach used this classification of manufacturing levels, as described by Fysikopoulos et al. [
3], to allocate the carbon emissions per manufacturing level, but also to identify whether the carbon emissions were related to energy, material or tool consumption, production, disposal, or transport [
18]. The same approach was used in this work, to categorize the different carbon emissions per process, machine tool or system level, but also the origin (energy or materials) or type (consumption, production, disposal or transport).
2.2. Carbon Footprint Calculation
Carbon emissions are calculated on the basis of the resources produced, consumed, or disposed during a process and the related carbon emission factor. From a theoretical perspective, the carbon emissions for material removal at the process level (
) derive from energy consumption:
is related to the electrical energy generation source, while
is a quantitative parameter, namely related to how much energy is needed to complete this process.
depends on the raw material, the final product requirements, and the machine specifications, such as feed rate and process speed.
At the machine level, other steps of the production are taken into consideration, concerning the energy consumed by the machine during starting up, idle time, and the downtime step, and any auxiliary materials and resources needed to operate the machine tool. Generally, carbon emissions at the machine tool level (
) are calculated by:
with
carbon emissions from auxiliary equipment (namely starting energy, basic energy, idle energy, and downtime energy),
carbon emissions from tool consumption and
carbon emissions from consumable consumption, where consumables can be a lubricant, coolant, or chips.
The system level includes not only the process and the material tool-related steps, but also the steps that are associated with the production, transport, and disposal of resources in general. Hence, the carbon emissions at the system level are given by:
with
carbon emission factor of electrical energy,
energy required for the process itself,
energy required for the operation of auxiliary/peripheral equipment,
carbon emission factor for tool consumption,
energy required for tool consumption,
carbon emission factor for material and consumable consumption,
amount of material and consumable used in the operation,
carbon emission factor during transport to and from the production site,
amount of transported quantity,
carbon emission factor of production of material, tool, and consumables,
quantity produced,
carbon emission factor of disposal of material, tool, and consumables,
quantity that will be disposed or recycled and
lifetime of material, tool, and consumables.
2.3. Life Cycle Analysis
In this paper, the environmental impact and carbon footprint was calculated using a Life Cycle Analysis software called SimaPro (9.3.03, PRé Sustainability B.V., Amersfoort, The Netherlands), in combination with Ecoinvent Database 3.1, assuming “Allocation, default system model” as models for the environmental impact and carbon footprint. The environmental impact was assessed for climate change (including carbon footprint), ozone depletion, ionizing radiation, photochemical ozone formation, particulate matter, human toxicity, acidification, eutrophication, ecotoxicity, land use, water use, and resource use.
2.4. Case Studies
According to Chryssolouris [
19], manufacturing consists of processes which alter the form, shape, and/or material properties of a given material or equipment, which perform the manufacturing processes, and systems, which are the combinations of manufacturing equipment and humans bound by a common material and information flow. The focus in this study is the material removal processes which are considered the backbone of industry, and more specifically, the conventional and the non-conventional material removal processes, with mechanical and thermal (laser) processes, respectively. Two sets of processes were chosen: the one-dimensional material removal process (drilling) and the two-dimensional material removal process (grooving), both from the conventional and the non-conventional side (laser). For all processes, the following steps were assumed to be included for the calculation of the environmental impact:
Process (conventional drilling, laser drilling, conventional milling, laser grooving) and energy required for the process
Auxiliary equipment or resources used for the process, in the form of chips creation for the conventional methods or in the form of additional energy used from the auxiliary systems for the laser methods
Production of chromium steel from raw resources
Hot rolling of steel to create the steel sheet
The common assumption for all processes is the grid mix, assuming high voltage electrical energy for Europe, except Switzerland. Regarding transport to and from the factory, transport is pre-included in the Ecoinvent model selected, hence there is no mention in the environmental impact and carbon footprint calculation.
Regarding drilling, in the specific case study a 4.9 mm diameter hole was drilled into a steel sheet with dimensions 10 cm in length, 10 cm in width, and 2 mm in thickness. For the production of the steel part, it was assumed that raw steel was produced andhot rolling was then used to transform the melted steel into the square part that was drilled. The process of hole drilling were either conventional drilling or laser drilling. Values for parameters were taken from the literature [
6,
20], in order to provide the necessary data for the calculations of this work. The novelty of this paper lies in the fact that these abovementioned data were used for the carbon footprint and environmental impact calculation and not for energy consumption and energy efficiency as they were used in the original papers. For the conventional drilling, parameters from Fysikopoulos et al. (2014) were used [
6], while for the laser drilling, parameters from the experimental setup were used [
20]. The energy used was electricity high voltage (values for Europe except Switzerland). For the grooving/milling processes, the specific case study was to endmill lengthwise a steel sheet with dimensions 1000 mm in length, 1000 mm in width, and 5mm in thickness. The width of the cut was 10 mm and the depth of the cut 5 mm. The grid mix was given for high voltage electricity (values for Europe except Switzerland). Parameters from the literature were used for both conventional milling [
5] and laser grooving [
21].
3. Results
In all processes, assumed steps were allocated per manufacturing levels, as shown in
Table 1, with the process level including referring to the conventional drilling, laser drilling, conventional milling, or laser grooving. In the rest of the levels (machine tool and system), the steps were the same for all cases, with chips’ creation being included at the machine tool level, while the system level included the production and hot rolling of steel.
Environmental impact and carbon footprint of each case were calculated per step and per manufacturing level in the sections that follow.
3.1. Conventional Drilling
Process level includes the process of conventional drilling itself with the main parameter being the energy required for the process, while at the machine tool level, the addition of chips’ creation was included in addition to the energy required for conventional drilling. The chips’ creation was linked to the volume of material removed. At the system level, the production and formation of the steel sheet were included, with the volume of the steel sheet being the determining parameter.
Calculations on carbon footprint per manufacturing level are defined in
Table 1 and depicted in
Figure 1 per steps involved. The allocation per manufacturing level is summarized in
Table 2, with the addition of the percentage of the value per manufacturing level to the overall value of carbon emissions for conventional drilling. As shown by the percentages and the absolute values, the smallest contribution on the carbon footprint was derived from the process level and the energy consumed during conventional drilling (
Table 2), while the majority of carbon emissions came from the production of steel and, secondary, from the forming of the steel sheet.
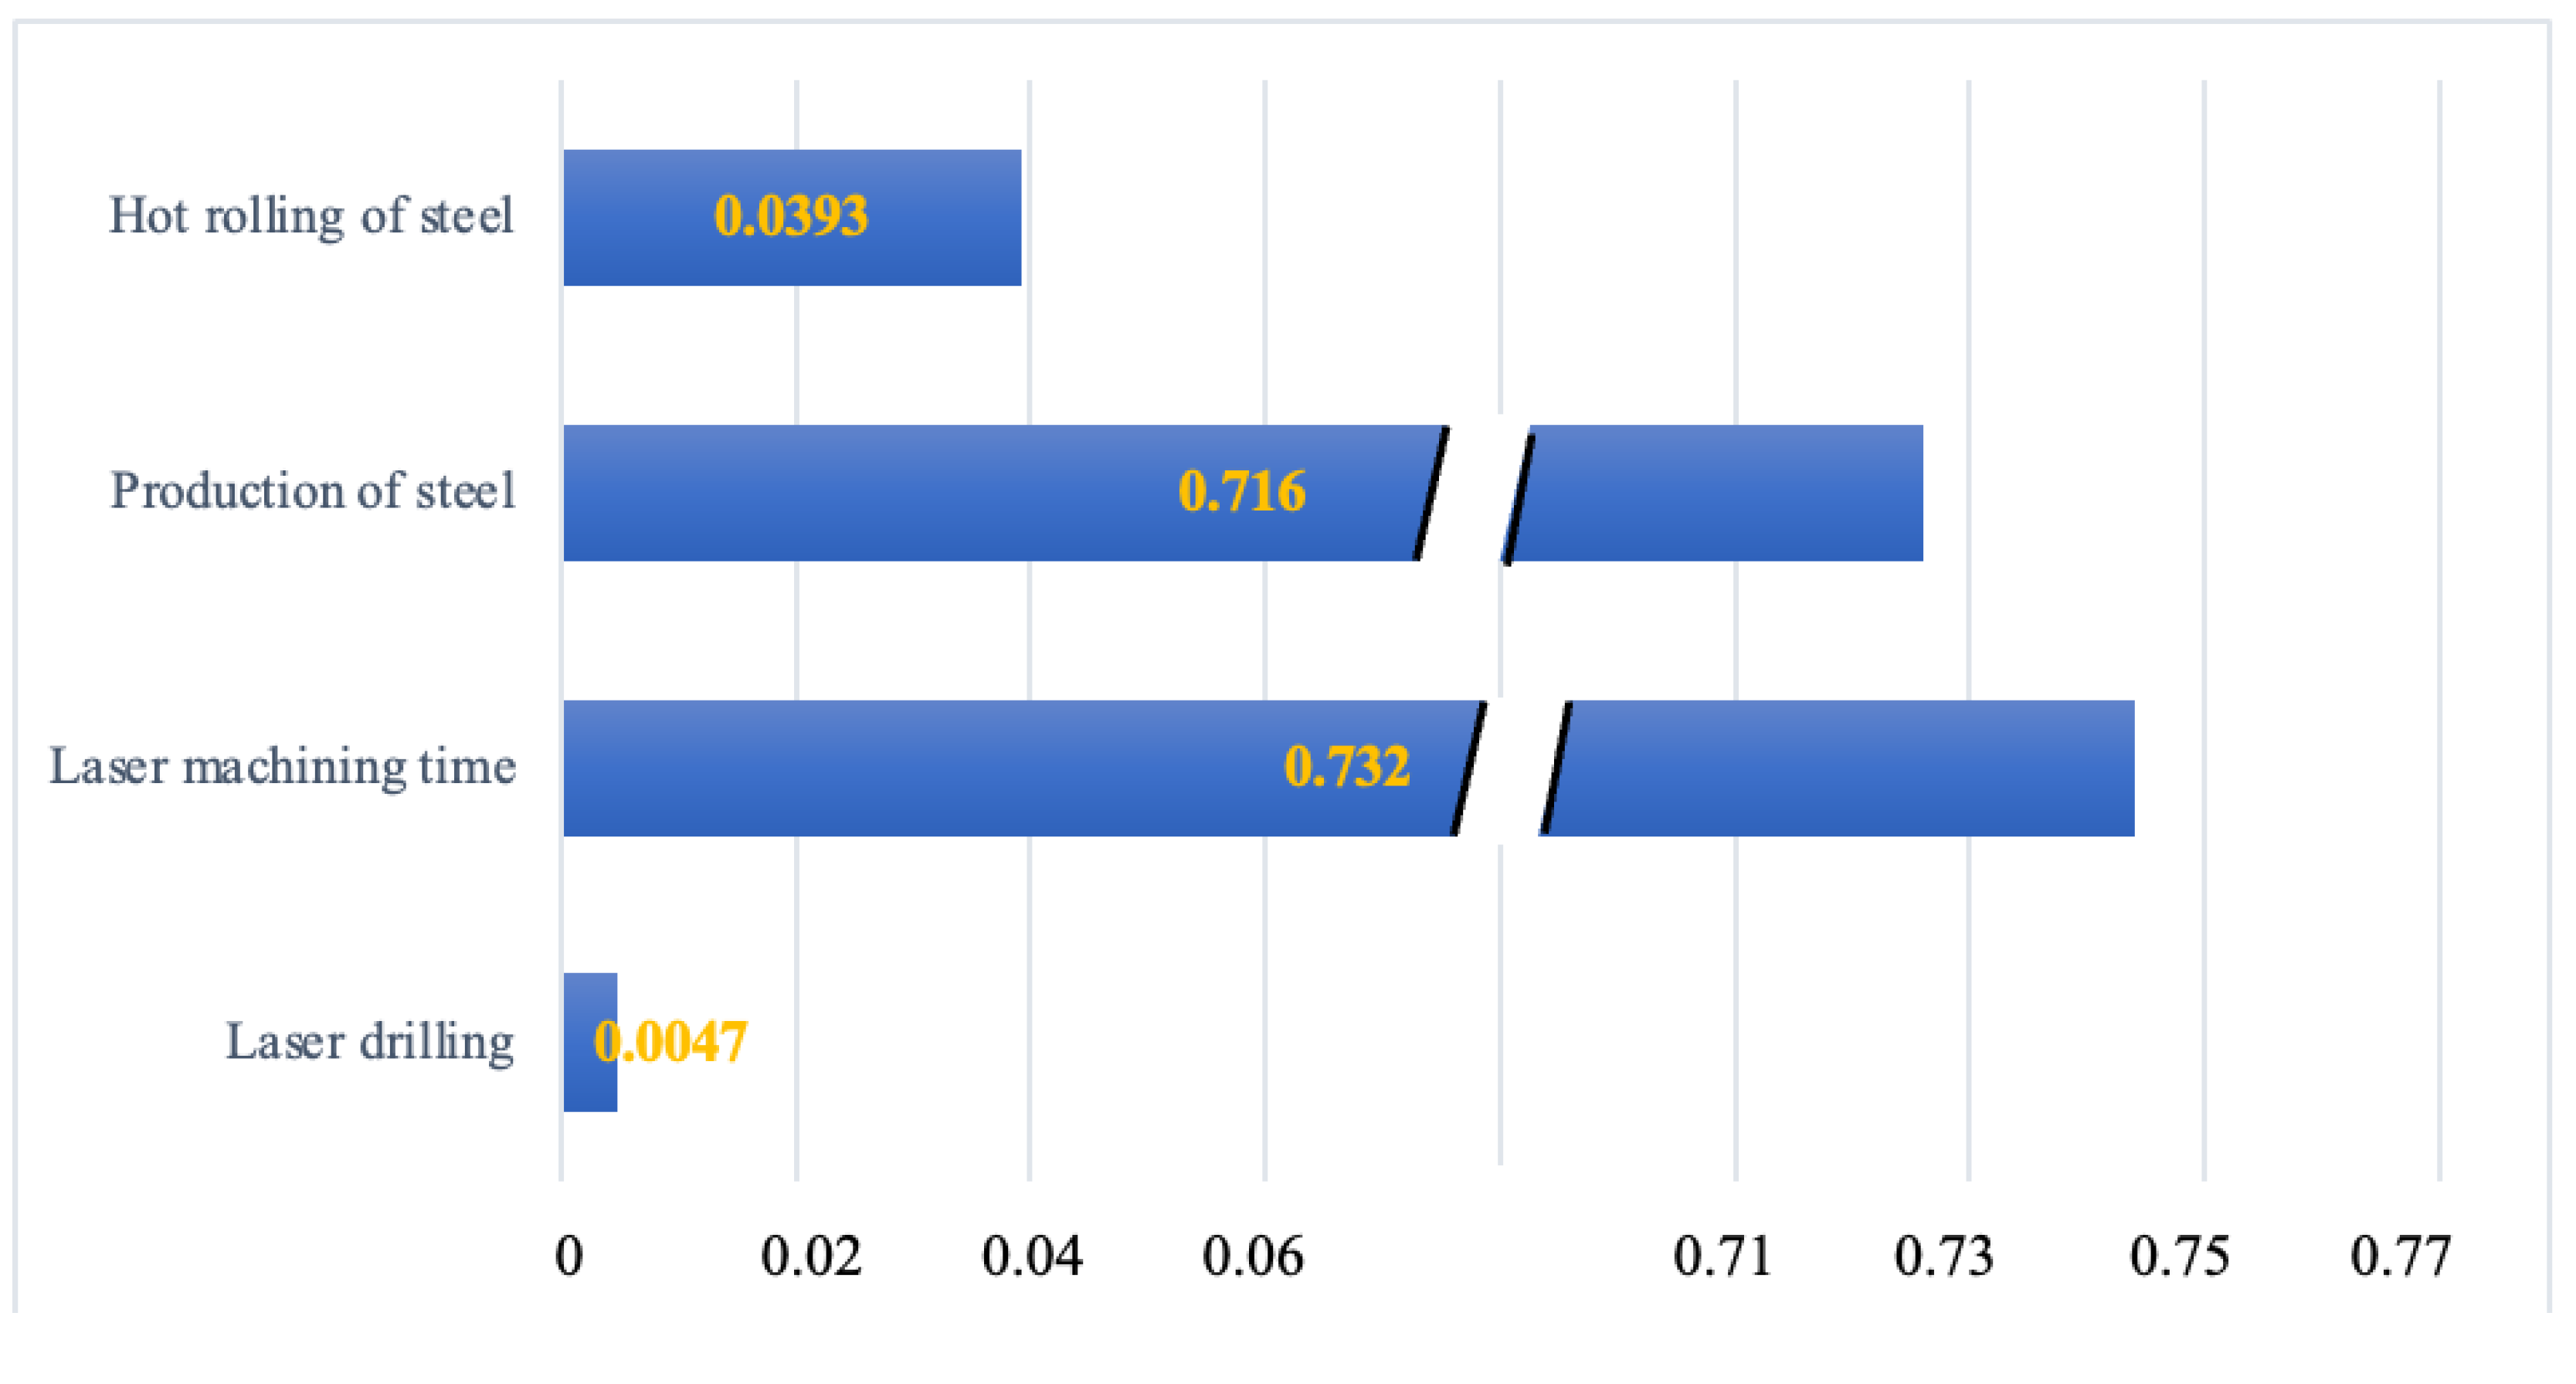
3.2. Laser Drilling
As already mentioned, laser drilling was the focus of the process level, with the main parameter being the energy used for the laser drilling of the hole, while the additional energy was consumed from the machine during drilling (machine tool level) and was related to the machining time. The machining time was calculated on the basis of the volume removed during laser drilling. Similar to conventional drilling, the production of steel and the hot rolling of steel were allocated at the system level.
The carbon footprint per step was calculated by SimaPro and is depicted in
Figure 2, while it is also summarized in
Table 3 allocated per manufacturing level and with the percentage of carbon emissions per level with respect to the total carbon footprint calculated. Similar to the case of the conventional drilling, the process-related carbon footprint holds the smallest percentage (0.004%), while the majority of the carbon footprint came from the production of the steel sheet and, secondary, from the forming of the steel sheet.
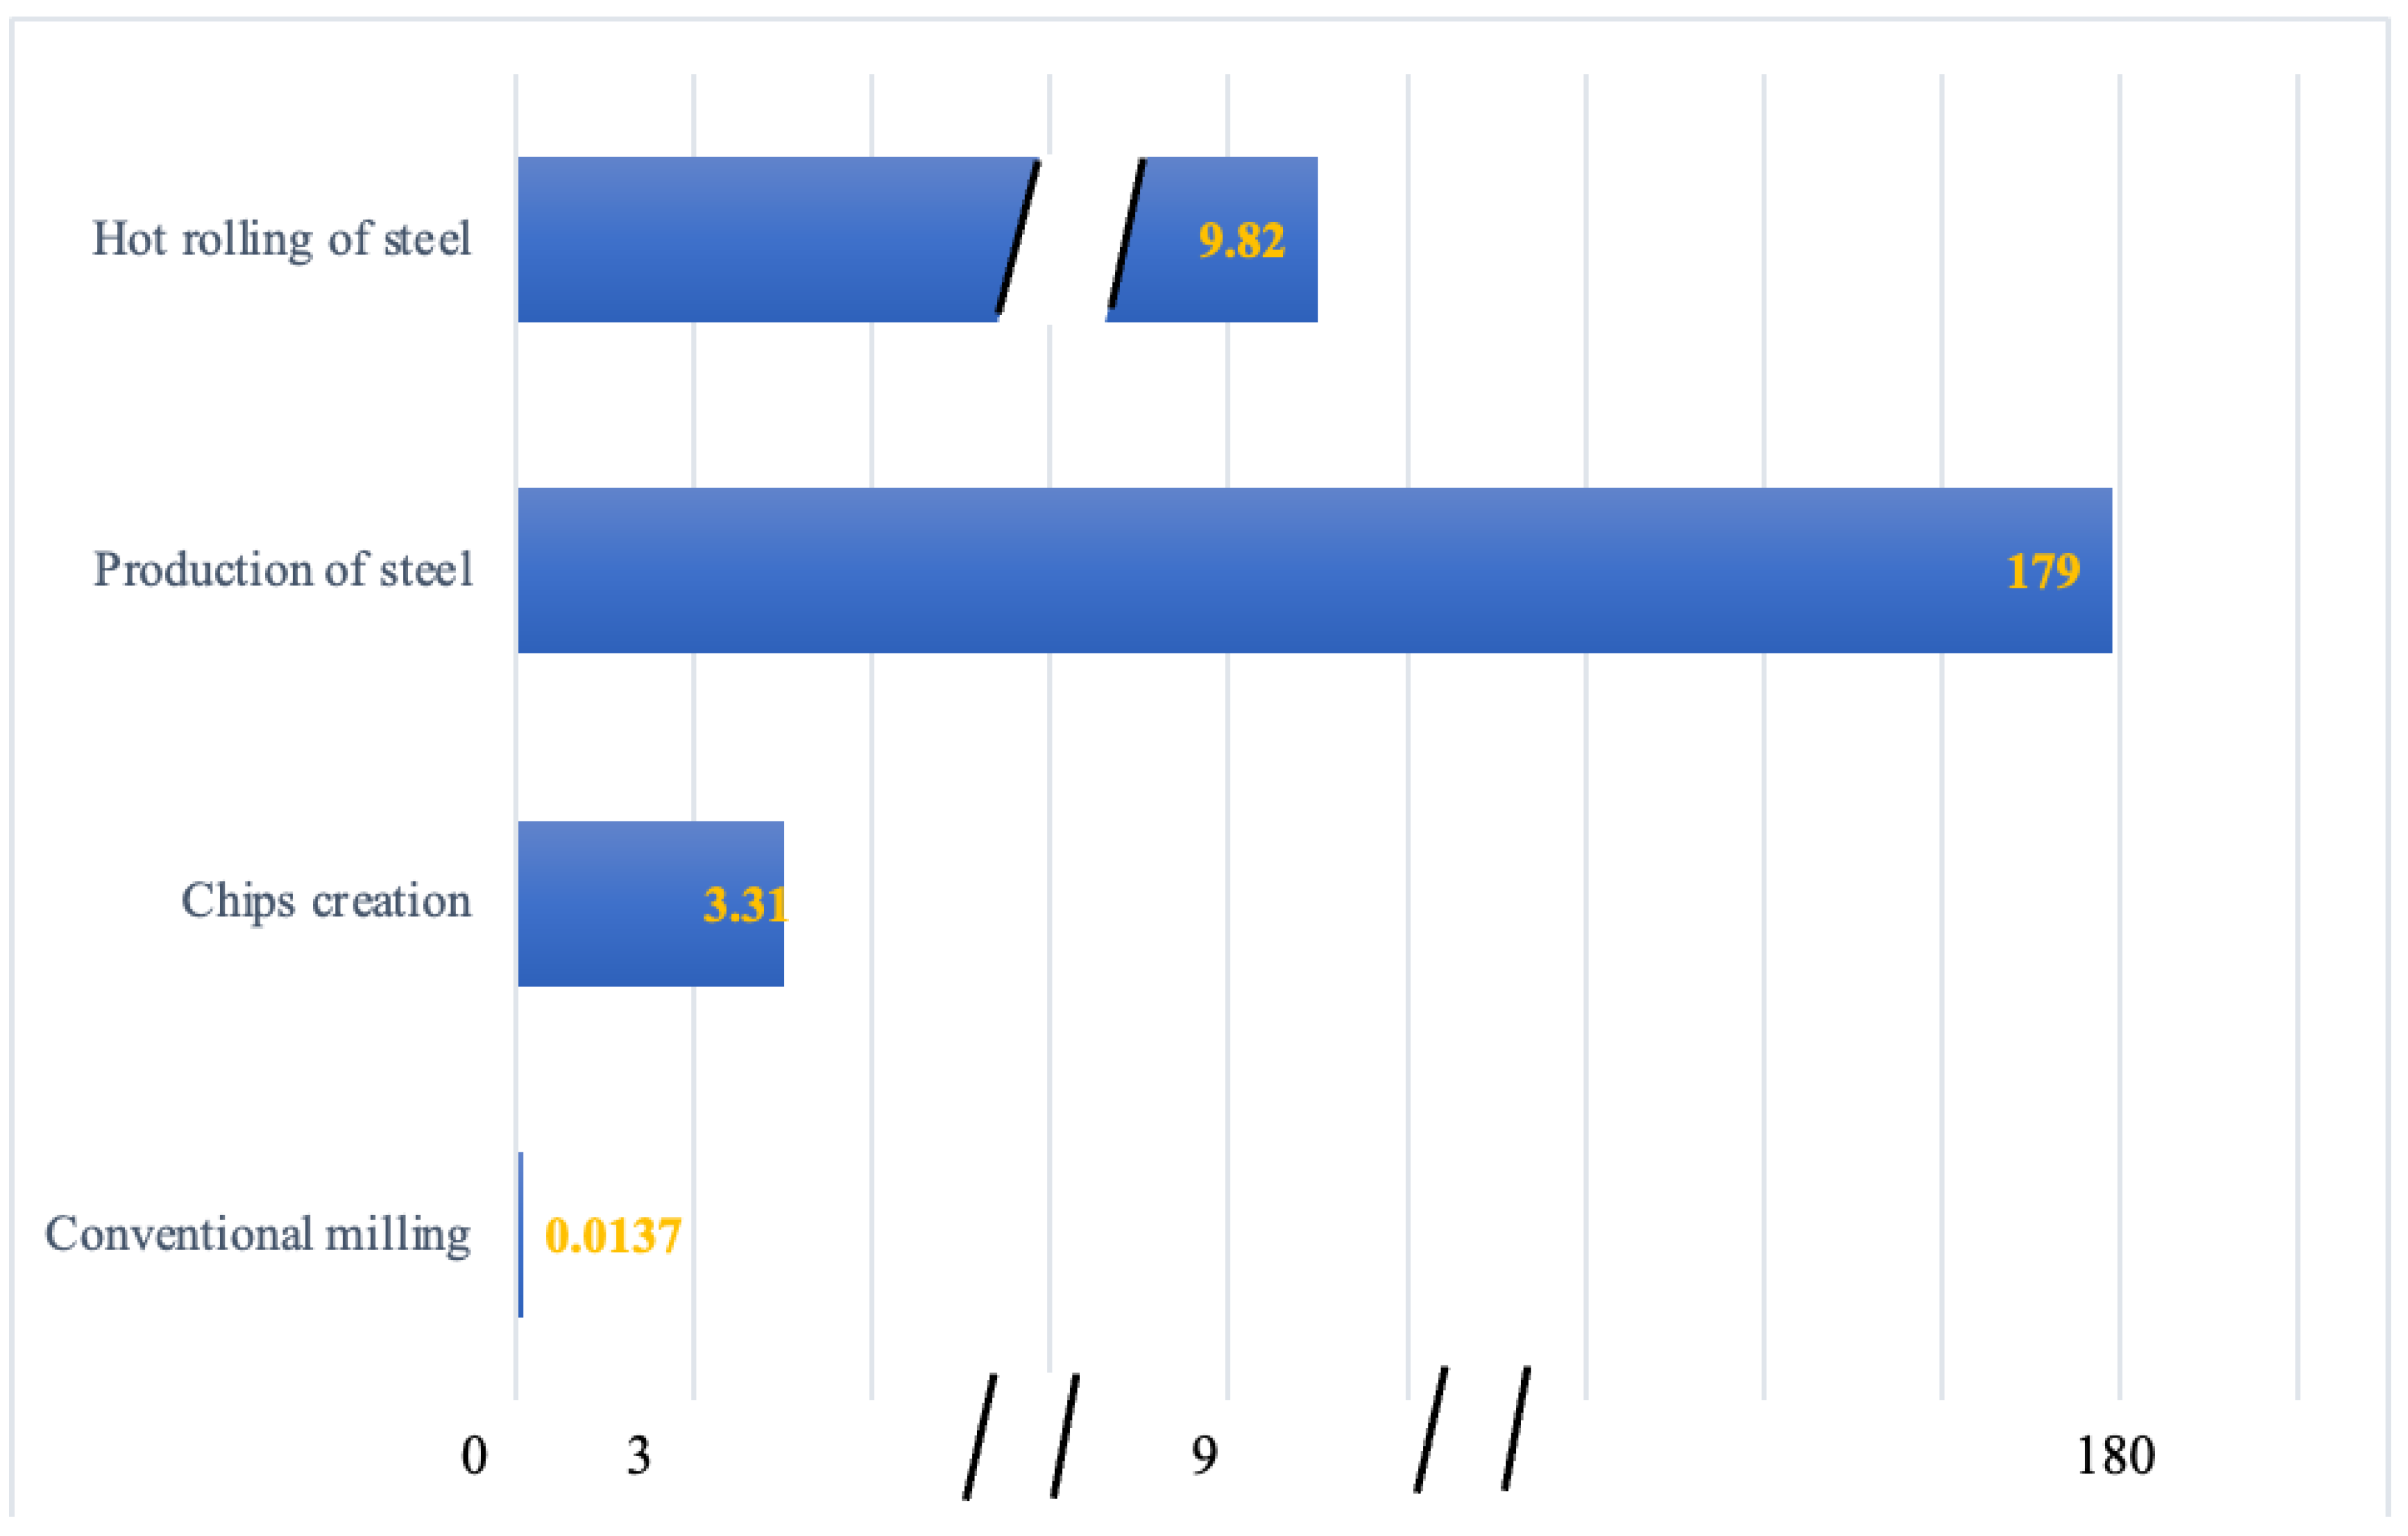
3.3. Conventional Milling
Conventional milling requires energy for the material removal at the process level, with the main parameter being the energy consumed during the process, while at the machine tool level, the addition of chips’ creation was also included which was related to the volume of material removed. At the system level, the material-related emissions were included, and these are the production of steel and the forming of the steel sheet via hot rolling, linked to the volume of the steel sheet.
The carbon footprint as calculated by SimaPro is depicted in
Figure 3 per step included in conventional milling. When summarized per manufacturing level, the values for the carbon footprint are summarized in
Table 4. The production of steel and the forming of the steel sheet accounts for the majority of the carbon footprint, with the process carbon footprint accounting for 0.007% of the total carbon footprint.
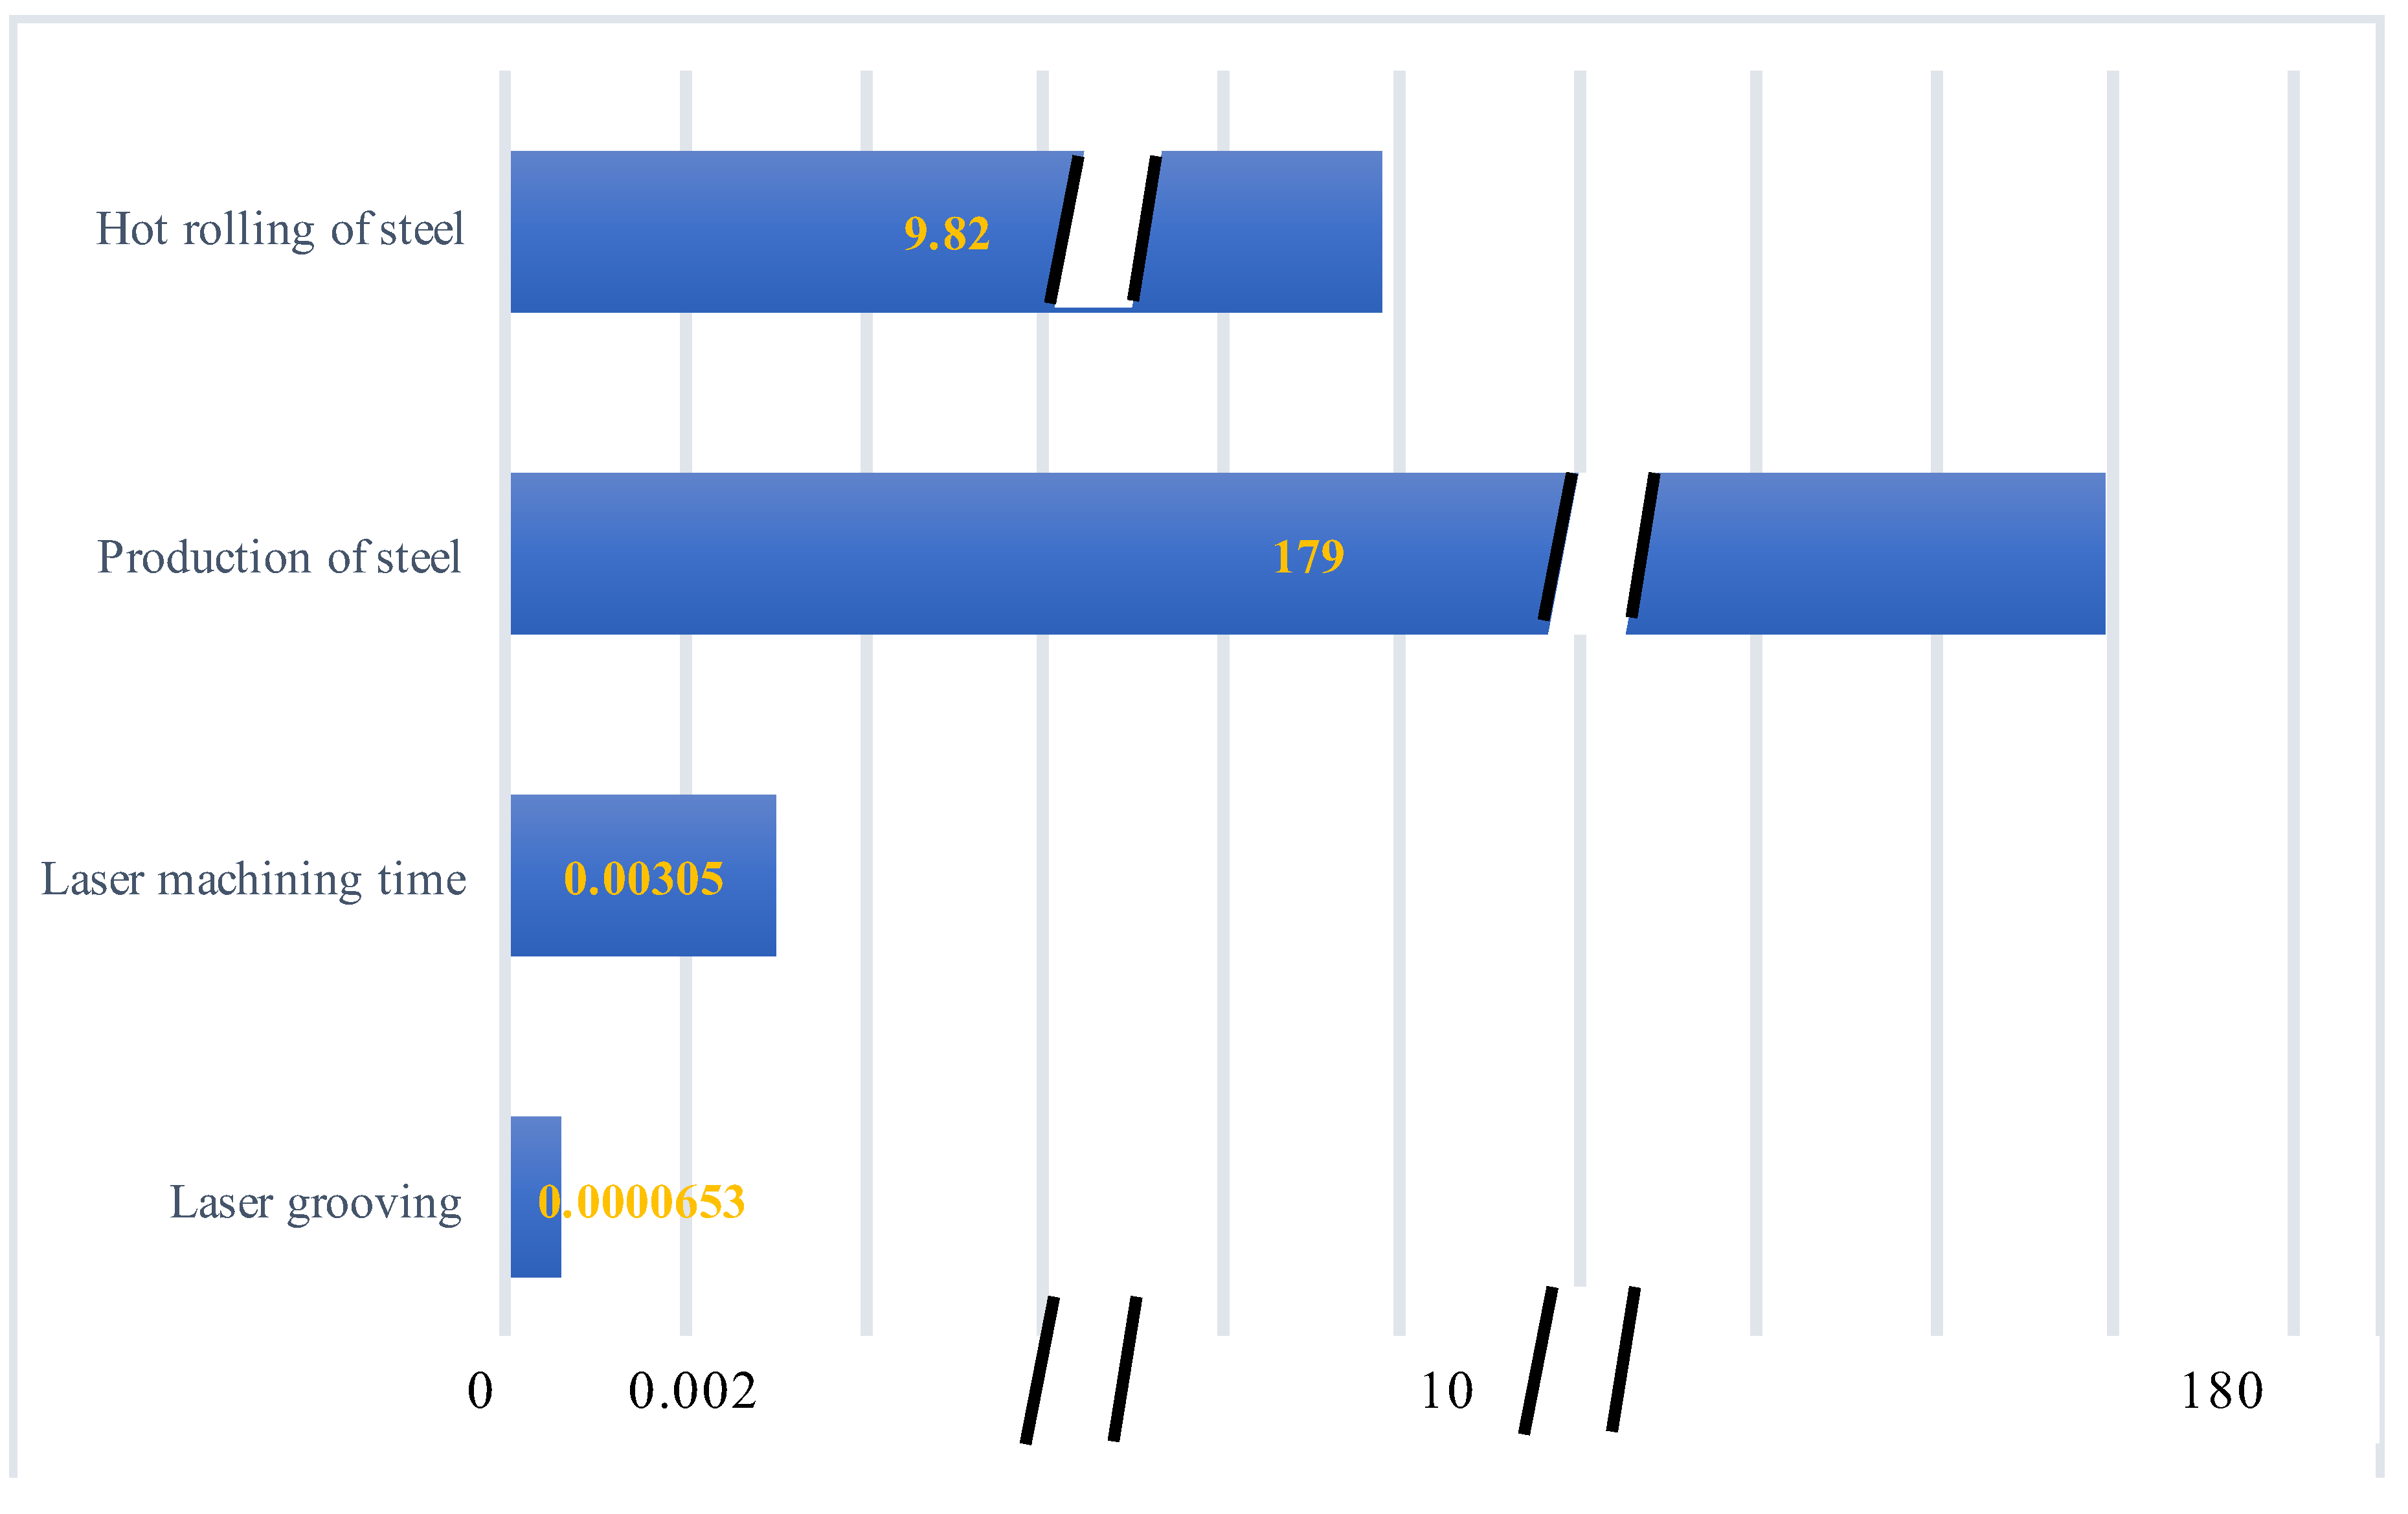
3.4. Laser Grooving
Assumptions for the steps involved in laser grooving follow the same logic as in laser drilling. The process level refers to the process itself with energy required for the grooving being the main parameter, with the machine tool level including also the energy consumed by the auxiliary equipment as determined by the machining time, while the system level includes the production and forming of the steel sheet.
The carbon footprint per steps included in laser grooving can be found in
Figure 4, while the carbon footprint was then allocated per level and the respective percentages per total carbon footprint were calculated (
Table 5) with the majority of the carbon footprint coming from the system level, while the process itself accounted only for 0.000035% of the total carbon footprint.
3.5. Comparison
The key parameters that were used for the calculation of energy required and the carbon footprint for each process are presented in
Table 6.
From
Table 6, it is shown that there is no clear trend when comparing the energy required and the energy efficiency between a conventional and a non-conventional approach. In the case of drilling, conventional drilling requires less energy than the laser-based drilling, while in the case of milling, laser milling requires less energy than the conventional milling. On the other hand, energy efficiency, which is defined as the volume of material removed per energy required [
6], follows the opposite trends with conventional drilling being more energy efficient than the laser drilling and laser grooving being more energy efficient than laser grooving.
When comparing the carbon footprint per level between conventional and laser drilling (
Table 7), the difference in values for the carbon footprint is noticeable; with 1.92·10
−5 kg CO
2 eq for conventional drilling and 0.0047 kg CO
2 eq for laser drilling, which is two orders of magnitude difference. Therefore, the carbon footprint follows the same logic as in energy required, with the process of laser drilling being less environmentally friendly (higher carbon footprint) than the process of conventional drilling. At the machine tool level, the carbon footprint of laser drilling is much higher than the respective conventional drilling, due to the high energy consumption of the auxiliary equipment. The differences are minimized at the system level, mainly because the carbon footprint of steel production and forming are considerably larger than the carbon footprint at the process and machine tool level.
As seen in
Table 7, the difference between the respective carbon footprint is evident for process and machine tool levels with the ratio in order of 10
−3. At the system level, the carbon footprints were comparable for the processes (
Figure 5), the differences between the two processes were smaller, and this is due to the fact that at the system level the environmental impact was mainly derived from the production of steel and the hot rolling of steel into steel sheet. Even in this case, the environmental impact of laser drilling at the system level was larger than the environmental impact of conventional drilling at the same level.
A comparison between conventional milling and laser grooving shows that the energy required for removing the same amount of material was larger for the case of conventional milling (
Table 6). Energy efficiency of the conventional milling was smaller than the energy efficiency of the laser grooving, determining that laser grooving is preferable if energy efficiency is the target. When it comes to carbon footprint (
Table 8), laser grooving was less carbon intensive, especially at the process (6.53·10
−5 kg CO
2 eq) and machine levels (0.00311 kg CO
2 eq), than conventional milling (0.0137 kg CO
2 eq for process level and 3.32 kg CO
2 eq for machine tool level). The carbon footprint of the two approaches was comparable at the system level because the carbon footprint of steel production and hot rolling were higher than the process-related carbon emissions.
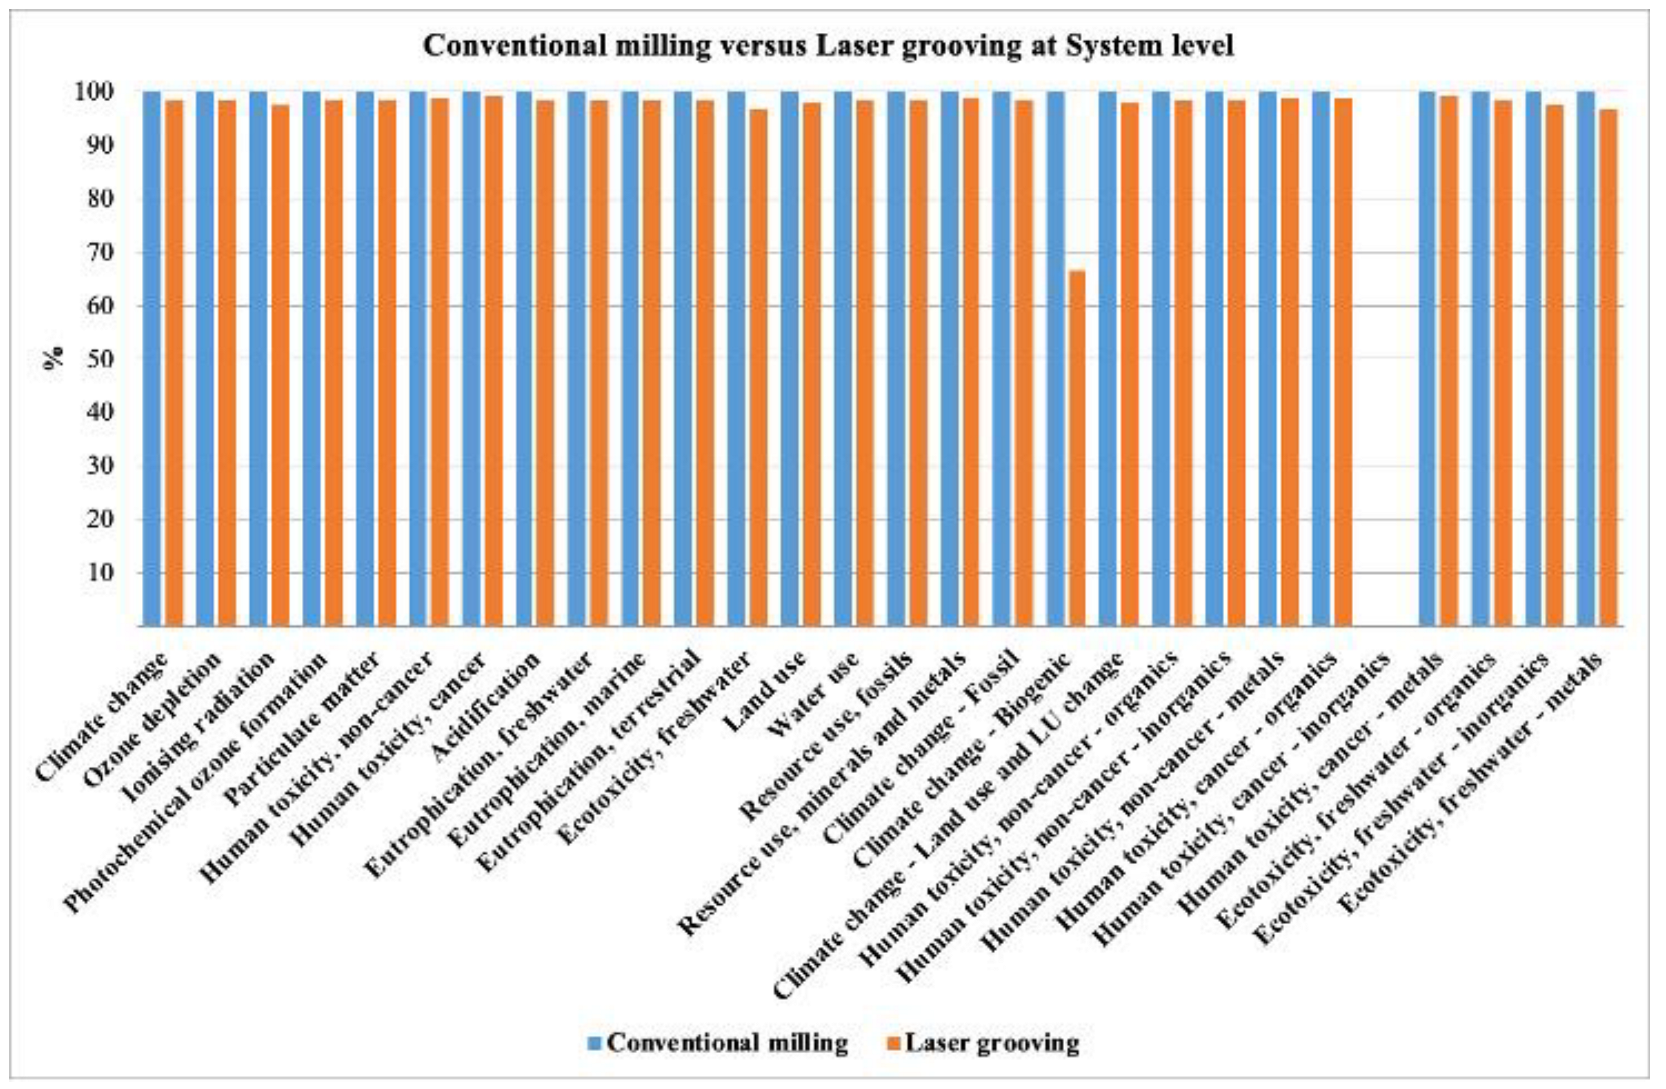
At the process and machine tool level, the difference between conventional milling and laser grooving was significant, as shown in
Table 8. At the system level, the environmental impact of the two approaches was comparable, as shown in
Figure 6. This is because of the high environmental impact of the production of steel and the hot rolling into steel sheet at the system level, the values for environmental impact were comparable, with laser grooving affecting the environment slightly less than the conventional milling.
4. Discussion
The aim of this study was to compare the environmental impact and the carbon footprint of conventional and non-conventional material removal processes. It was shown that conventional processes can be either more or less environmentally friendly than the respective laser-based processes depending on the case. This is due to differences in the physicochemical phenomena taking place during material removal which are related to the magnitude of cutting forces required to perform the material removal. Regardless of the case, the process level had the lowest carbon footprint, followed by the machine tool level, while the system level shared the highest contribution in the carbon footprint of each case.
According to Panagiotopoulou et al. (2021) [
18], the material production is the heaviest contributor for carbon emissions in the case of material removal. In that study, the production of steel was allocated at the system level, hence the result of the current study is aligned with the literature results [
18], where the values at the system level are much higher than the rest of the levels. This is also supported by previous work [
22], where the embodied energy of steel was estimated to be 4 to 25 larger than the machining energy. Steel production is not the only energy/carbon intensive step of the system level since steel requires additional processing to be formed into sheets or other forms before the material process. Rolling accounts for 24% of the total global average energy requirements on the process from ore, which accounts for a large share of the global average energy since steel is the dominant material in the global material production [
23].
On the other hand, energy consumption is either the first or second contributor to the carbon footprint of a process, production line or product [
18], depending on the case. Most studies declare that energy consumption from auxiliary equipment is the most energy intensive part of a process [
22]. In the current study, at the machine tool level, the auxiliary equipment for laser material removal and the production of chips during conventional material removal were also energy and carbon intensive, because of high energy demands in the first case and material-related parameters in the second case. For laser-based processes, the power for machining was the lowest contributor, while “always on” or “periodically on” subsystems accounted for the rest of the power (94%), as described in the literature [
24], which is also true for most processes, as mentioned by Devoldere et al. (2007) [
25] that more than 87% of the energy consumption is used for the machine tool level.
In the current study, the carbon footprint for conventional drilling was lower than the carbon footprint for laser drilling, while in the case of laser grooving and conventional milling the opposite was shown. A comparison with data already found in the literature was not possible, since there is no similar study to the authors’ knowledge. However, this trend can be explained by the physicochemical phenomena taking place during material removal processes. Between conventional drilling and conventional milling, the cutting forces in the second case are much larger due to the significant increase in cutting forces from the one-dimensional drilling to the two-dimensional milling. In the case of laser-based processed, the physical mechanisms of material removal are the same for both laser drilling and laser grooving, especially since energy is related to the absorptivity of the material which is the same for both cases.
The manufacturing sector aims at providing high quality products, but this comes with a high cost, therefore compromises must be made in order to achieve the highest quality with the least cost. This cost may be due to post-processing of the product or to increased energy consumption. This is because the key elements of manufacturing (sustainability, quality, time, and flexibility) are inter-connected [
26], and therefore someone must choose a specific focus to address for the process optimization, rather than addressing all key elements at once. A measurable parameter of sustainability (both financially and environmentally) is the energy usage. Until recently, the energy consumption and energy efficiency of processes has been the focus of research and the attention of industry. However, due to global warming and the Green Deal, the attention of research and industry has shifted from energy to the carbon footprint and environmental impact. This aligns with the fact that energy may not be the most carbon intensive part in the life cycle of a product, as shown in this study. Therefore, a more holistic approach should be applied to account for all resources, both in terms of energy sources and materials, especially in the case of raw materials. This holistic approach is the calculation of the carbon footprint and environmental impact in general. In this study, it is evident how carbon intensive the drilling of a single hole can be, in both cases of conventional and laser-based drilling. The same is shown for the removal of a small volume either using conventional milling or laser-based grooving. The life-cycle analysis and calculation of the carbon footprint and environmental impact should be taken into considering when designing a process, when organizing or scheduling a production line or even when choosing the right materials. The calculating the carbon footprint and environmental impact is not the end of the road, but rather the beginning of optimization and reduction of carbon footprint for a greener manufacturing sector and towards carbon neutrality.
Carbon footprint alone is not sufficient enough to battle pollution and restore biodiversity. Environmental impact is a more general term than includes water and land pollution and human toxicity. Metal processing industries, in particular, are estimated to highly contribute to human toxicity and ecotoxicity as measured in a Swedish-based study [
27]. The results of environmental impacts affect human health and planet life, while affecting biodiversity. This information on the environmental impact of processes could be used to better design the production for them to be more environmentally friendly [
28].
Carbon footprint and environmental impact should not be viewed as an overall number for the whole production line. It is important to know which steps at which manufacturing level are the most energy and carbon intensive in order to know which step should be optimized to reduce the carbon footprint and environmental impact significantly. In this study, the production and rolling of steel were the most carbon intensive steps, therefore these steps should be further optimized. This can be done via using recycled materials since the production of secondary steel requires only 50% of the intensity of primary steel production [
29]. Another option for significant carbon footprint reduction is the use of advanced and new materials with lower energy intensity that are designed for greener and more sustainable production.
The current approach may be applicable to all manufacturing processes, but the results of this study cannot be extrapolated and generalized for all material removal processes. A parametric study should be performed to generalize the results of material removal processes and create a modeling framework to be used in all material removal processes. Another limitation of this study is the lack of comparison of the carbon footprint of processes using different materials such as recycling or advanced materials to conclude on the contribution of the material production step on the total carbon footprint. However, no data were available for this calculation. Last but not least, the life cycle presented in this study was a simplistic representation of the real life cycle of the material removal processes and should be addressed in future work.
5. Conclusions
Different material removal processes are being used in manufacturing, with the main types being; (1) mechanical, (2) thermal, (3) electrochemical and (4) chemical. Selection of the appropriate material removal process is usually based on the material and its properties, the process cost, the expected outcome, or other criteria. However, a comparison between the different processes based on their environmental impact was never performed and this is exactly what this work aimed to address this. This study showed that the carbon footprint at the process level had the lowest contribution in the total carbon footprint while the majority of carbon emissions come from the production of steel and the rolling of steel. This is important information coming from the allocation of the carbon footprint and environmental impact per production step and manufacturing levels in order to know which step should be optimized for a significant reduction in the carbon footprint and environmental impact.
It was also shown that the physicochemical mechanisms during material removal have an impact of determining whether the conventional or the laser-based process is the most carbon intensive among the two. In the case of drilling, the conventional process is less carbon intensive than laser-based drilling, while laser-based grooving is more environmentally friendly than conventional milling. This is due to the fact that in the conventional cases, power and energy, and therefore carbon emissions, are related to the magnitude of cutting forces which are significantly increased from drilling to grooving. On the contrary, energy consumption in laser-based processes is linked to material absorptivity which remains the same for the cases in this study.
Future work should focus on performing a parametric study on material removal processes, to develop a generic mathematical model that could be used in all material removal processes. Furthermore, the effect of using recycled or greener materials should be determined in future studies, as well as the effect of assuming a circular scenario in material removal processes.


