1. Introduction
To meet the rapid growth of global energy consumption, ultra-high temperature and ultra-high pressure petroleum and gas wells have gradually attracted the attention of the industry. However, due to the complex downhole environment of such petroleum and gas wells, the stress of drill pipe is very complicated in the process of drilling [
1,
2]. Consequently, the failure of drill pipe often occurs in ultra-deep well drilling. In recent years, a large number of drill-pipe failures in ultra-deep wells have been reported, and serious drill pipe failures have occurred in some areas [
3,
4].
Many scholars have tried to explain the reasons behind the failure of drill pipe. Zamani et al. (2016) investigated numbers of past drill pipe research results and discussed all metallurgical and mechanical aspects of failure that can occur for a drill pipe. They argued that the foremost factors may be complex loading, combined stresses and different types of vibrations. In addition, they support that the fatigue crack is the root cause of drill-pipe failure [
5]. Liu et al. (2015) analyzed the axial cracking failure in consideration of the service condition, material quality and stress corrosion mechanism systematically, proceeded measurement and inspection on macroscopic and microscopic morphology of crack surface, corrosion products and circumferential residual stress. Then, established the relationship between the erosion wear loss of drill pipe and drilling parameters such as gas injection volume and rate of penetration [
6]. Huang et al. (2017) built a drill-pipe erosion experiment model based on the micro-cutting model of single rock particle. Their test results show that the gas-injection volume has more impact on drill-pipe erosion compared to the rate of penetration, and a high rate of penetration will suppress the erosion wear of drill pipe [
7]. Abdo et al. (2017) considered that the main reason causing drill pipes failure is fatigue due to vibration. Hence, a novel in-house experimental setup has been developed to mimic downhole axial, lateral and torsional vibration modes and mechanisms in drilling operations, and investigate the drill-pipe fatigue failure due to cyclic stresses, on account of the research deficiency of quantitative assessment methods of drill-pipe fatigue [
8]. Luo et al. (2020) provided a modified model for the S-N data, revealing the correlation between the fatigue life and fatigue limit, equivalent stress amplitude reflecting the effect of stress ratio to predict the fatigue damage of drill-pipe. The research shows that the mechanism of the fatigue fracture was examined by scanning electron microscopy [
9]. Zhang et al. (2020) analyzed the chemical composition, mechanical properties and microstructures of the failed drill-pipe materials by experiments. Then used the finite element method to investigate the static stress characteristics and fatigue life of the drill pipe joint under multi-axial alternating loads and found that the alternating load was the main factor of failure [
10]. Ahmed et al. (2020) investigated a twisted-off failure specimen of heavy weight drill pipe (HWDP) though macro and micro tests. Their research showed that the HWDP failed by a corrosion fatigue mechanism [
11].
Since 2021, drill-pipe failures have been reported more frequently. Liu et al. (2021) analyzed the failure of aluminum alloy drill pipe and studied the formation of pits and horizontal cracks on the surface of the drill pipe. They came to the conclusion that the cause of failure of aluminum alloy drill pipe is mainly attributed to the brittleness sensitivity of intermittent-banded second phase and inclusions to corrosive media from a muddy environment [
12]. Yu et al. (2022) investigated the failure of S135 steel drill pipe and thought that the crack originated from the corrosion pit on the inner wall because of stress concentration, and extended along the circumference during the operation of lifting drill pipe for many times, and finally led to sudden fracturing [
13]. Liu et al. (2022) studied the first titanium alloy drill-pipe failure accident, which occurred during the drilling of an ultra-short radius horizontal well in China; the results revealed that there are many micro-cracks on the surface of titanium alloy drill pipes that cannot be detected according to the current standards; when the titanium alloy drill pipe was used under the ultra-short radius horizontal drilling condition, the pipe body had slight deformation and these micro-cracks rapidly expanded throughout the entire wall thickness, resulting in the fracture failure [
14].
According to the literature, previous studies have summarized the causes of drill pipe failure as fatigue, corrosion, erosion, vibration, and stress concentration. Drill pipe failure is highly uncertain and difficult to predict. Although many scholars have undertaken a lot of research on drill pipe failure, it is still frequently reported. Recently, a drill pipe failure occurred during an unstuck operation, in order to find the reason for the fractured drill pipe. This paper used the experimental methods including macroscopic analysis, metallographic structure and energy spectrum analysis, chemical composition analysis and mechanical property analysis, combined with 3D drill pipe-sedimentary gravel thermal stress coupled finite element model, studied the failure mechanism of drill pipe caused by sedimentary gravel sticking. The measures to avoid the failure of drill pipe in field drilling operation are put forward. The research is of great significance to drill pipe protection and field operation safety.
4. Modeling
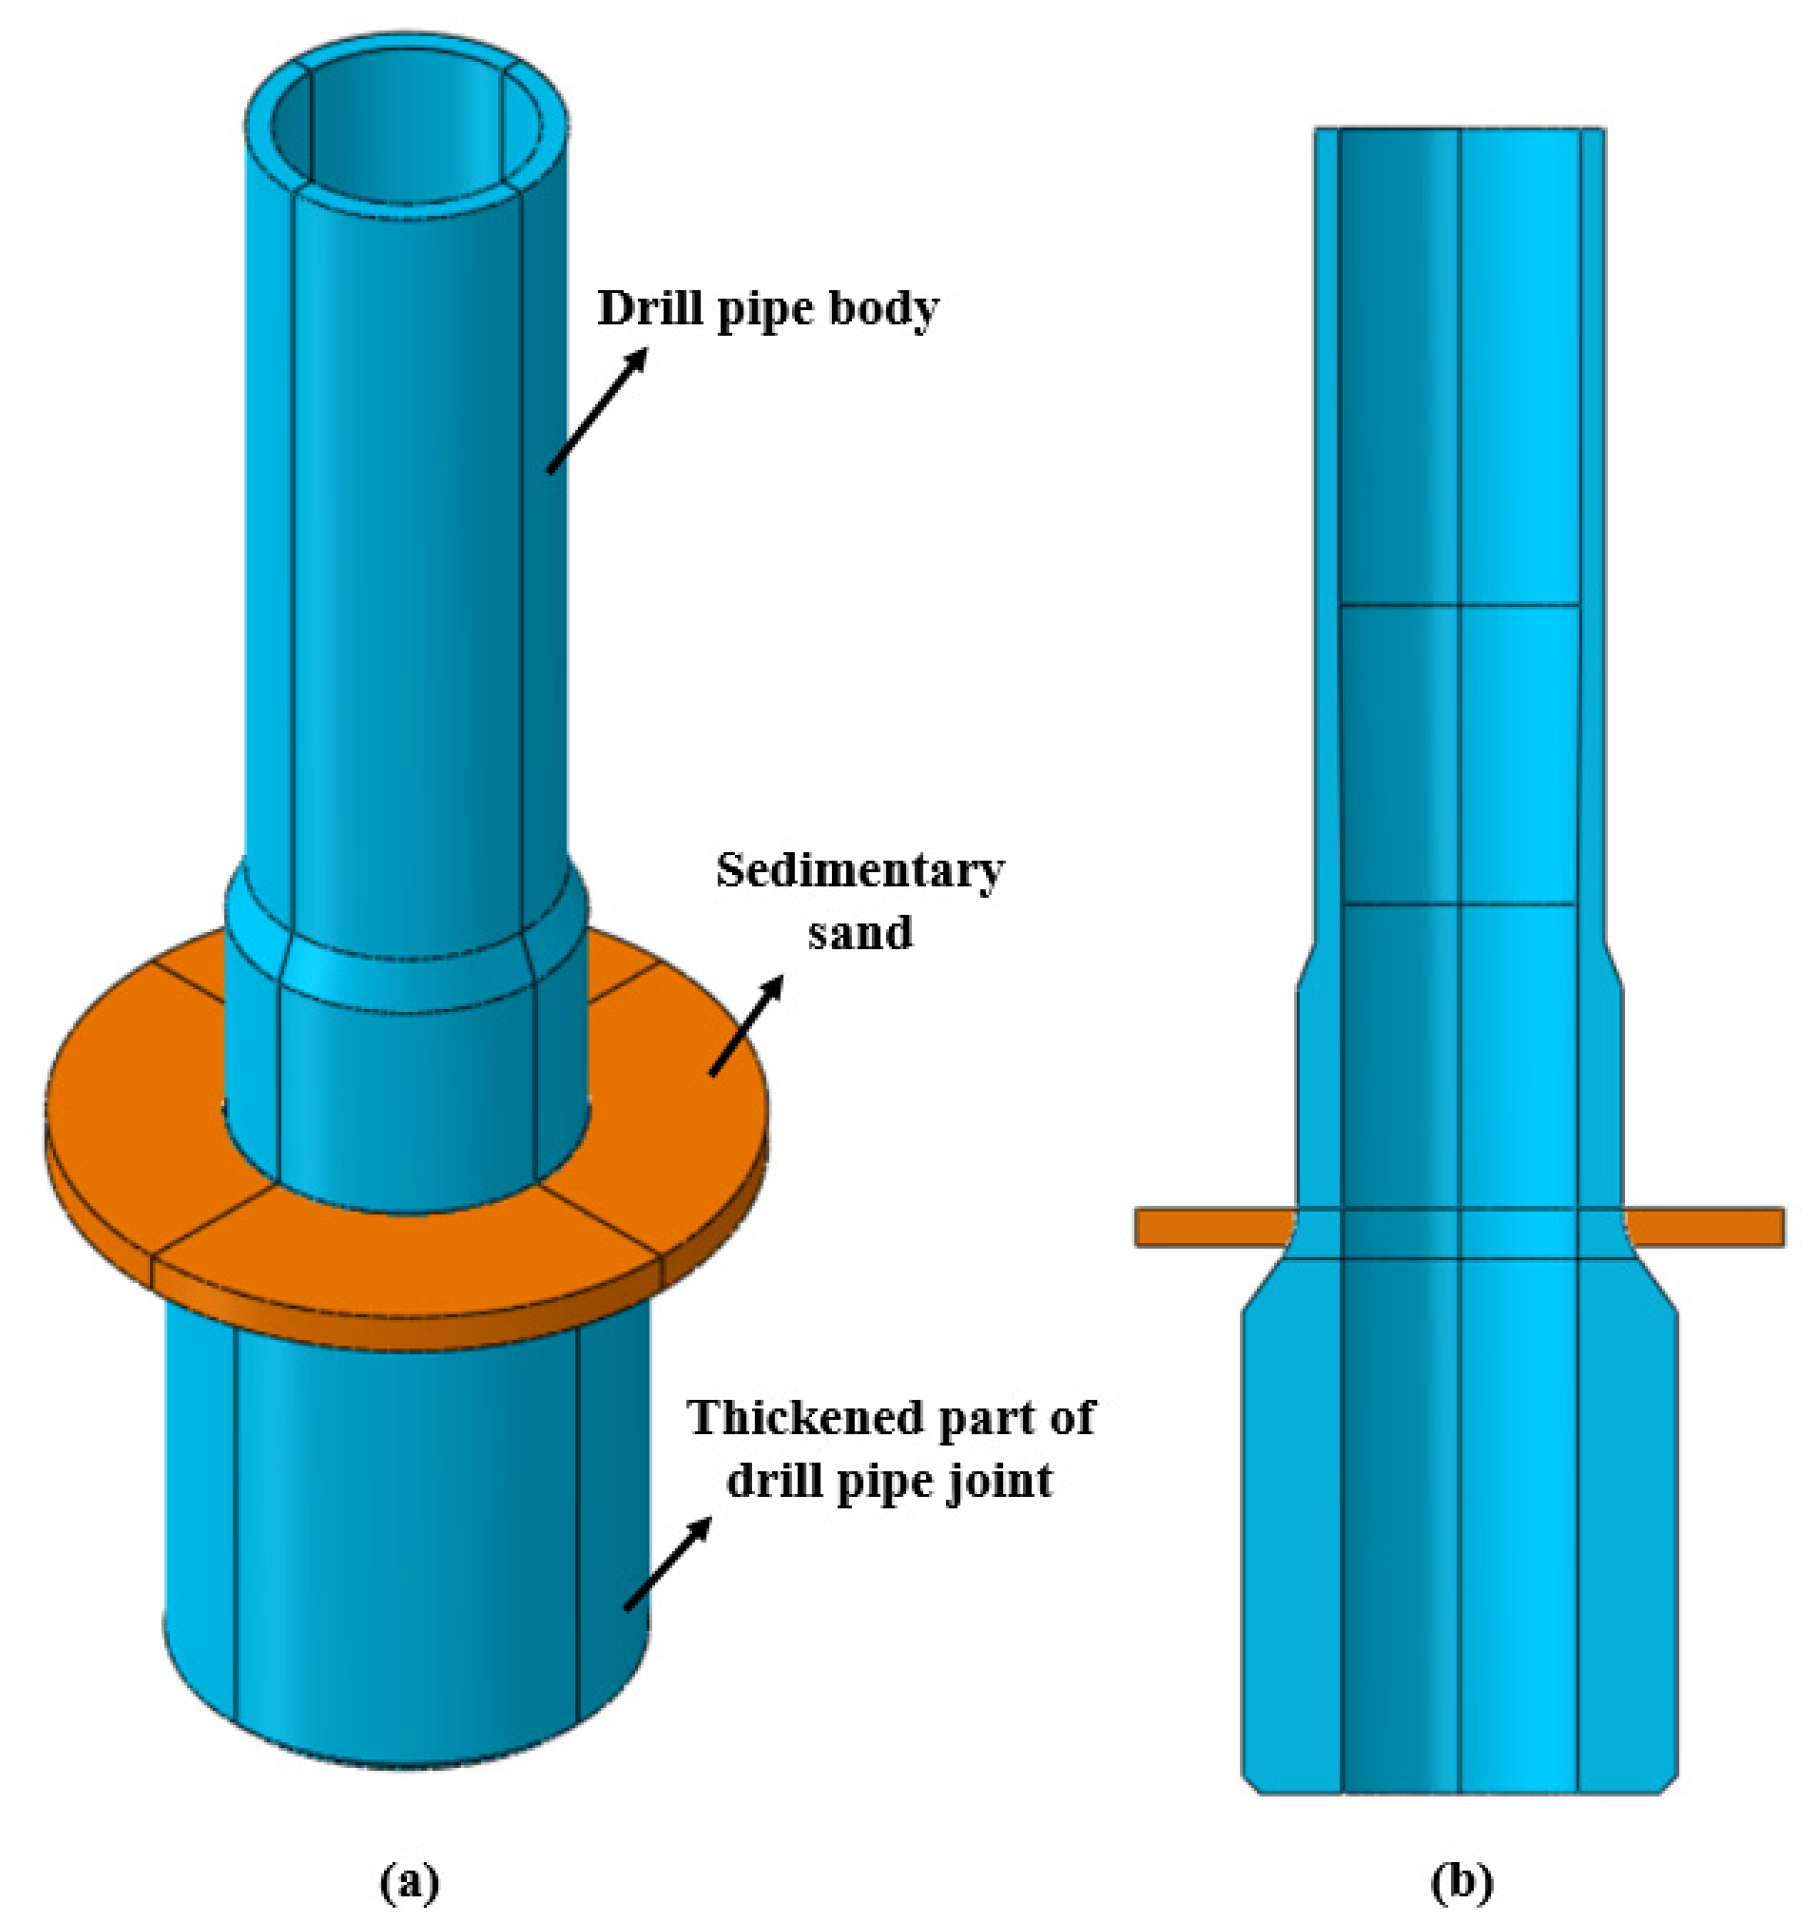
Based on the real size and failure condition of drill pipe mentioned in the failure case, a drill pipe and sedimentary gravel model in contact with drill pipe were established, forming a stress-temperature coupling three-dimensional (3D) finite element model. The 3D model, including the solid model is presented in
Figure 8a, and the axial section view is shown in
Figure 8b.
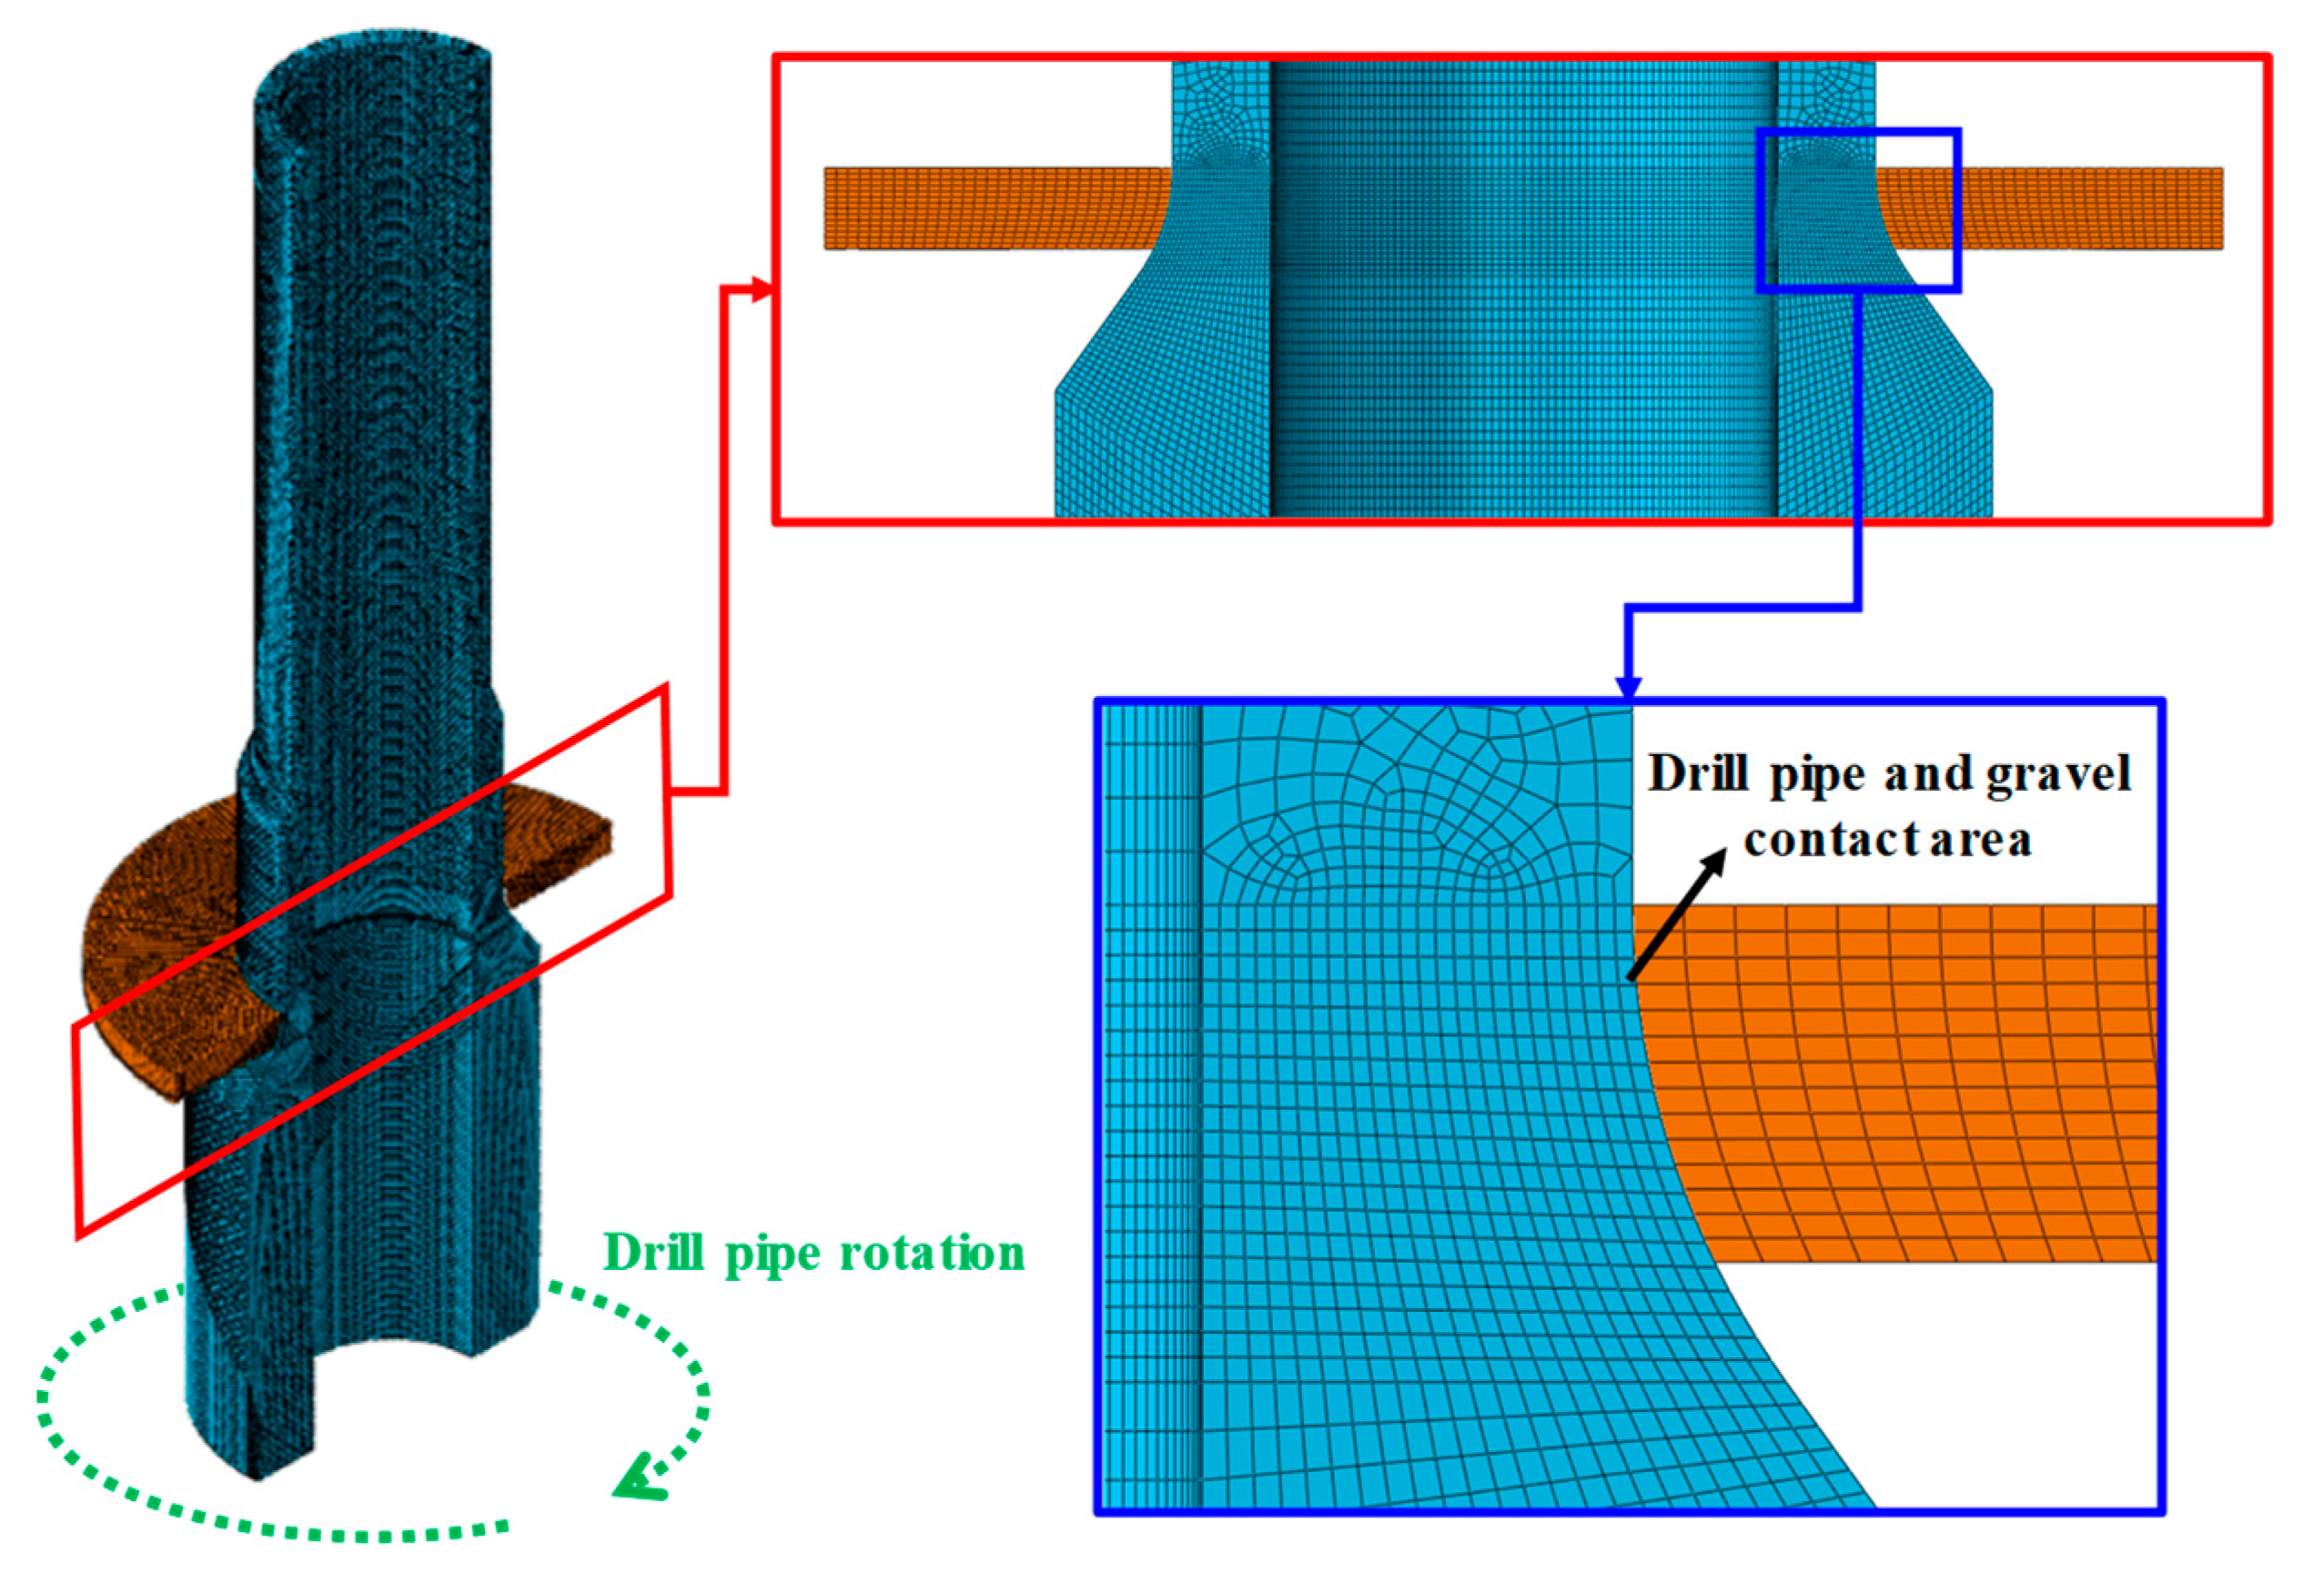
The solid model was meshed. To make the simulation calculation results more accurate, secondary mesh encryption was carried out in the friction welding area where drill pipe and gravel contact as shown in
Figure 9. The drill-pipe material is S135 steel; the mechanical and thermodynamic properties, referring to the mechanical performance test results, are shown in 3.3 above. Meanwhile, the properties of the sedimentary gravel material properties are shown in
Table 3. The friction coefficient between drill pipe and gravel particles is set to 0.35.
The core of solving the transient temperature field problem is to use the corresponding numerical method to solve the linear ordinary differential equations. By deducing the governing equation of the three-dimensional transient temperature field in classical thermodynamics, the linear ordinary differential equations with time
t as the independent variable can be obtained [
15,
16].
where,
C is the heat capacity matrix;
is the derivative array of node temperature with respect to time;
K is the heat conduction matrix;
is node temperature array;
P is the temperature load array.
The elements of matrix
C,
K and
P are integrated by the corresponding matrix elements of the element, as follows:
By means of the above equation, the partial differential equation problem in time domain and space domain can be transformed into the initial value problem of the ordinary differential equation of temperature with N nodes in space domain.
Thermal stress is the result of the interaction of temperature field and stress field. The interaction of temperature field and stress field is called thermal-solid coupling problem. The finite element equation calculated by thermo-structure analysis is:
where,
M is the mass matrix;
u and
T are displacement and temperature load, respectively.
C is structural damping matrix;
Ct is specific heat matrix;
K is the structure stiffness matrix;
Kt is the heat conduction matrix;
F is the total equivalent nodal force array;
Q is the total equivalent node heat flux vector [
17].
5. Results and Discussion
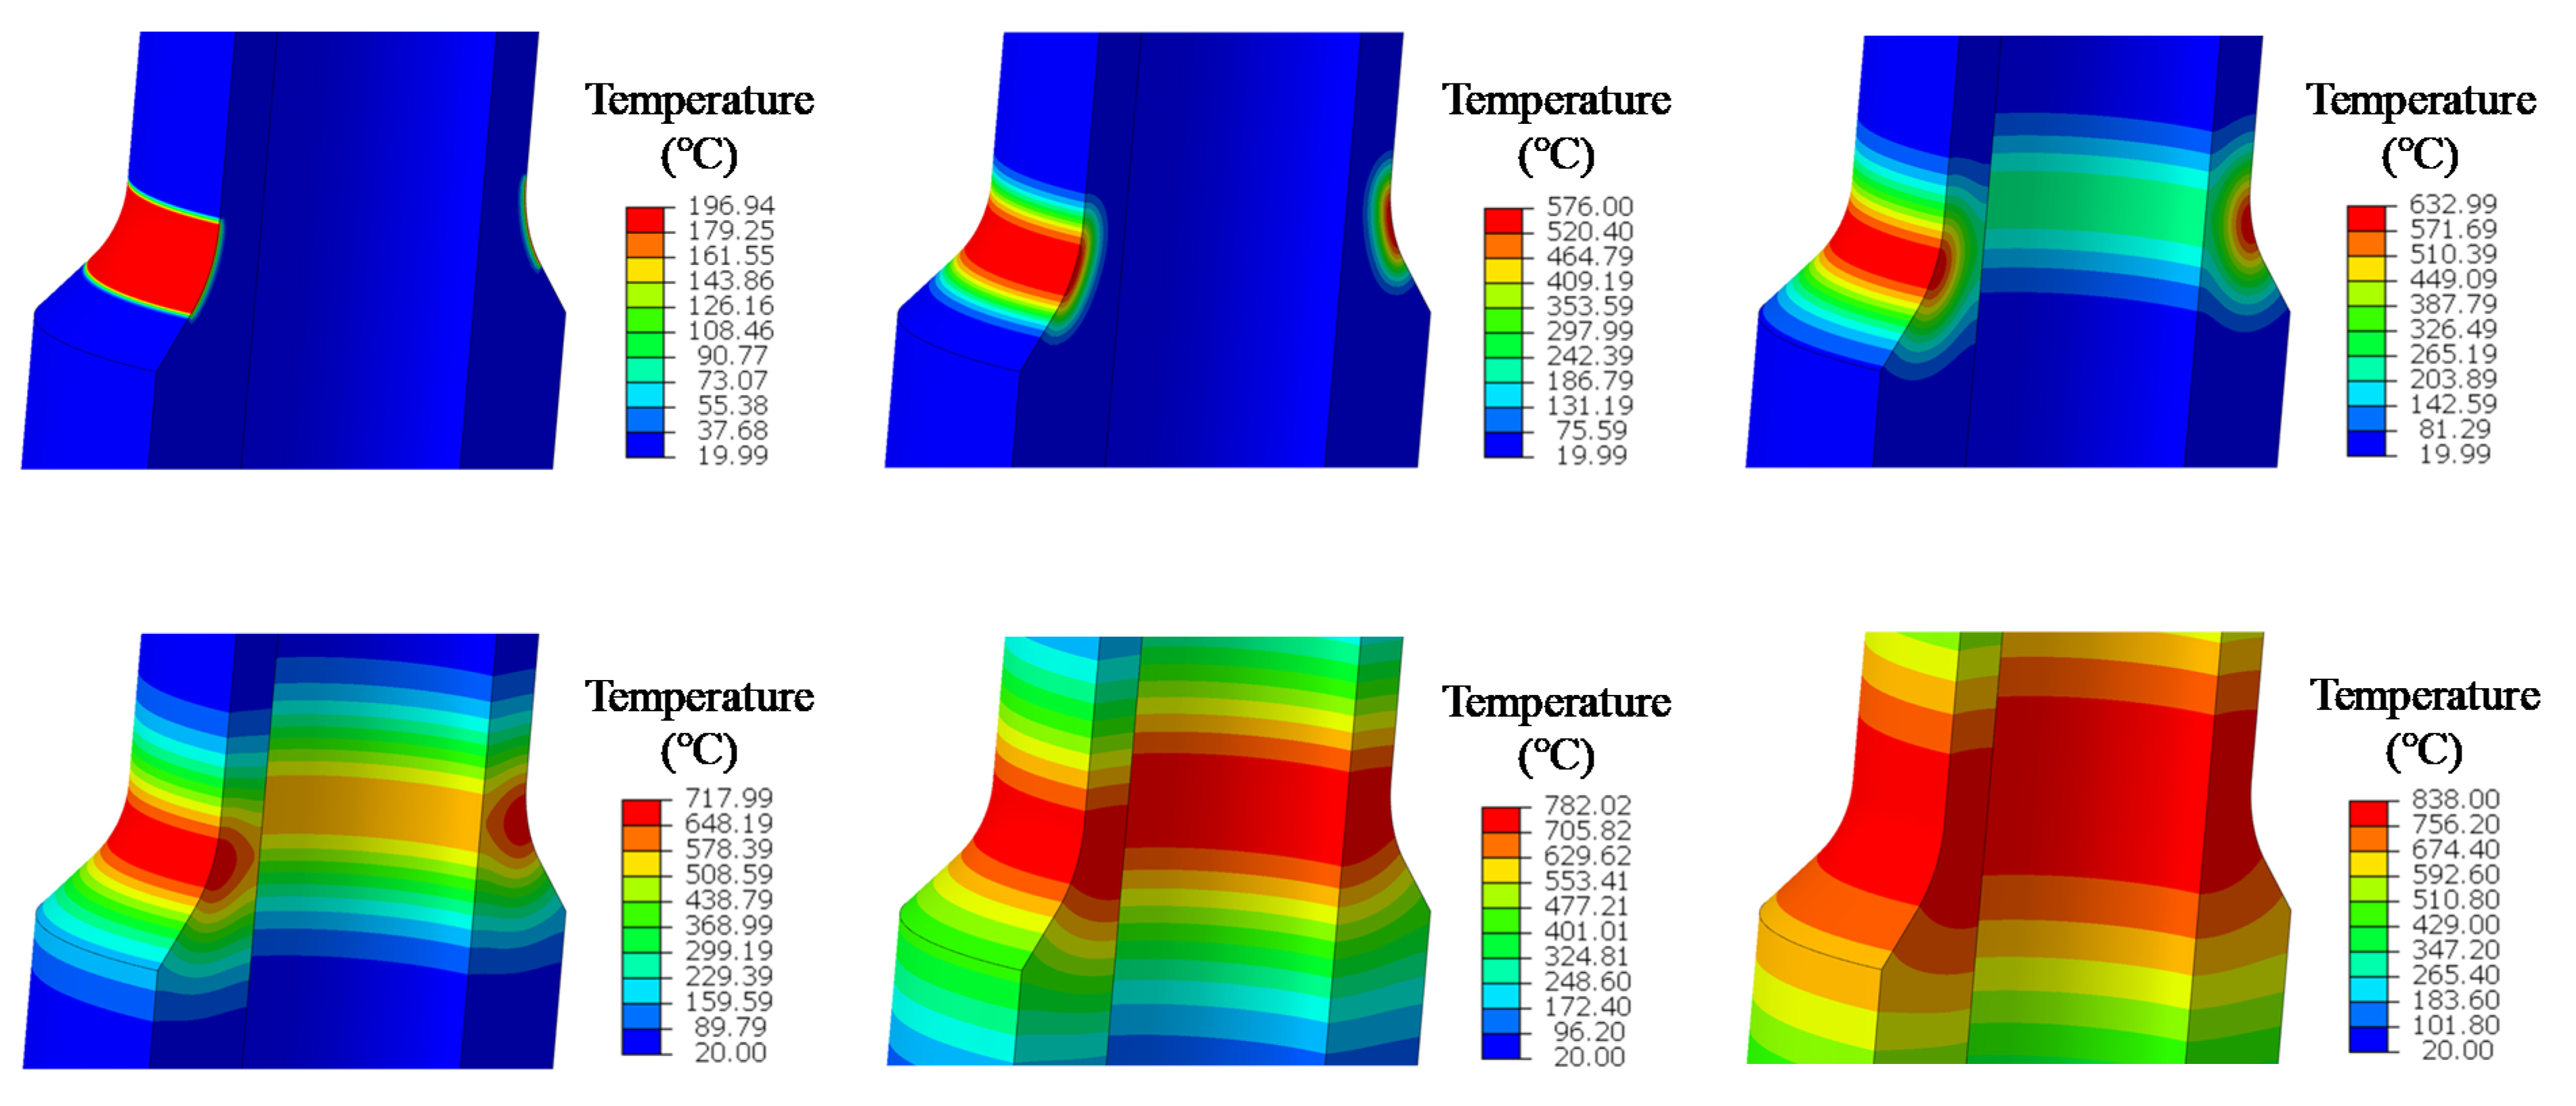
In the actual drilling operation, according to the 5530 m depth of wellbore, the hydrostatic pressure of drill pipe environment can be calculated as 81.3 MPa. Due to the obvious pressure drop of drilling fluid during the process of drilling fluid passing through the drill bit and then returning from the wellbore, the internal pressure of drill pipe can be calculated as 92.8 MPa according to Bernoulli equation. At the same time, the drill pipe is subjected to axial loads from the upper drill pipe and the formation. When the drill pipe rotates, the sedimentary gravel in the wellbore will rub against the friction welding area of the drill-pipe joint, resulting in friction heat, changing the thermal stress of the drill pipe material, resulting in metal phase transformation, reducing the strength of the drill pipe, and ultimately leading to fracture failure of the drill pipe. When the drill pipe rotation speed is 60 rpm, the temperature-distribution contour diagram of the friction area between the drill pipe and gravel advancing over time is shown in
Figure 10. It can be seen that the highest temperature occurs in the friction welding area of drill pipe where the outer wall of drill pipe is in contact with the sedimentary gravel, and gradually decreases to both ends, and the maximum temperature of the outer wall of drill pipe reaches 838 °C. At the same time, the lowest temperature was found at both ends of the drill pipe, with a minimum temperature of 20 °C. The temperature change of the outer wall of the drill pipe follows the following steps:
(i) At the initial stage of friction, a high temperature zone is generated at the contact area between the outer wall of the drill pipe and the gravel, but the temperature change does not extend across the drill pipe;
(ii) As time goes on, the temperature in the friction region further increases and the temperature variation region expands, but the high temperature region becomes more concentrated;
(iii) Later, the high temperature zone also began to expand, and the temperature variation zone extended to a larger area of the drill pipe. From the analysis of the temperature level and distribution with time, it can be seen that at the beginning of the contact friction between the drill pipe and gravel, the temperature of the outer wall of drill pipe begins to rise due to the heat generated by friction. Subsequently, due to the cooling effect of the drilling fluid, the hot zone on the drill pipe began to be concentrated in the friction area, and the temperature continuously spread across the drill pipe. Finally, as the temperature increases, the entire temperature range expands across the drill pipe.
However, the variation in temperature level and distribution along the direction of drill-pipe wall thickness has a great influence on the strength of drill pipe material.
Figure 11 shows the temperature level and distribution of drill pipe along the wall thickness direction under the condition of a well depth of 5530 m and a drill pipe rotation speed of 60 rpm. It can be seen that the temperature-expansion process on the drill pipe axis is the same as that on the outer wall, while the temperature change process on the drill pipe wall thickness direction follows the following steps:
(i) When the friction between drill pipe and gravel begins, the temperature increases in the thinner area of drill pipe wall thickness;
(ii) Subsequently, the zone of temperature variation begins to expand into the drill pipe along the wall thickness until the high temperature zone completely passes through the drill pipe wall thickness;
(iii) After the hot zone passes through the drill pipe wall thickness, it begins to extend axially along the drill pipe. From this process analysis, it can be seen that in the direction of the drill-pipe wall thickness, the high-temperature zone firstly expands from the outside to the inside, and gradually reduces the material strength of the whole drill-pipe wall thickness, and then expands along the drill-pipe axial direction, and the reduction range of material strength becomes larger.
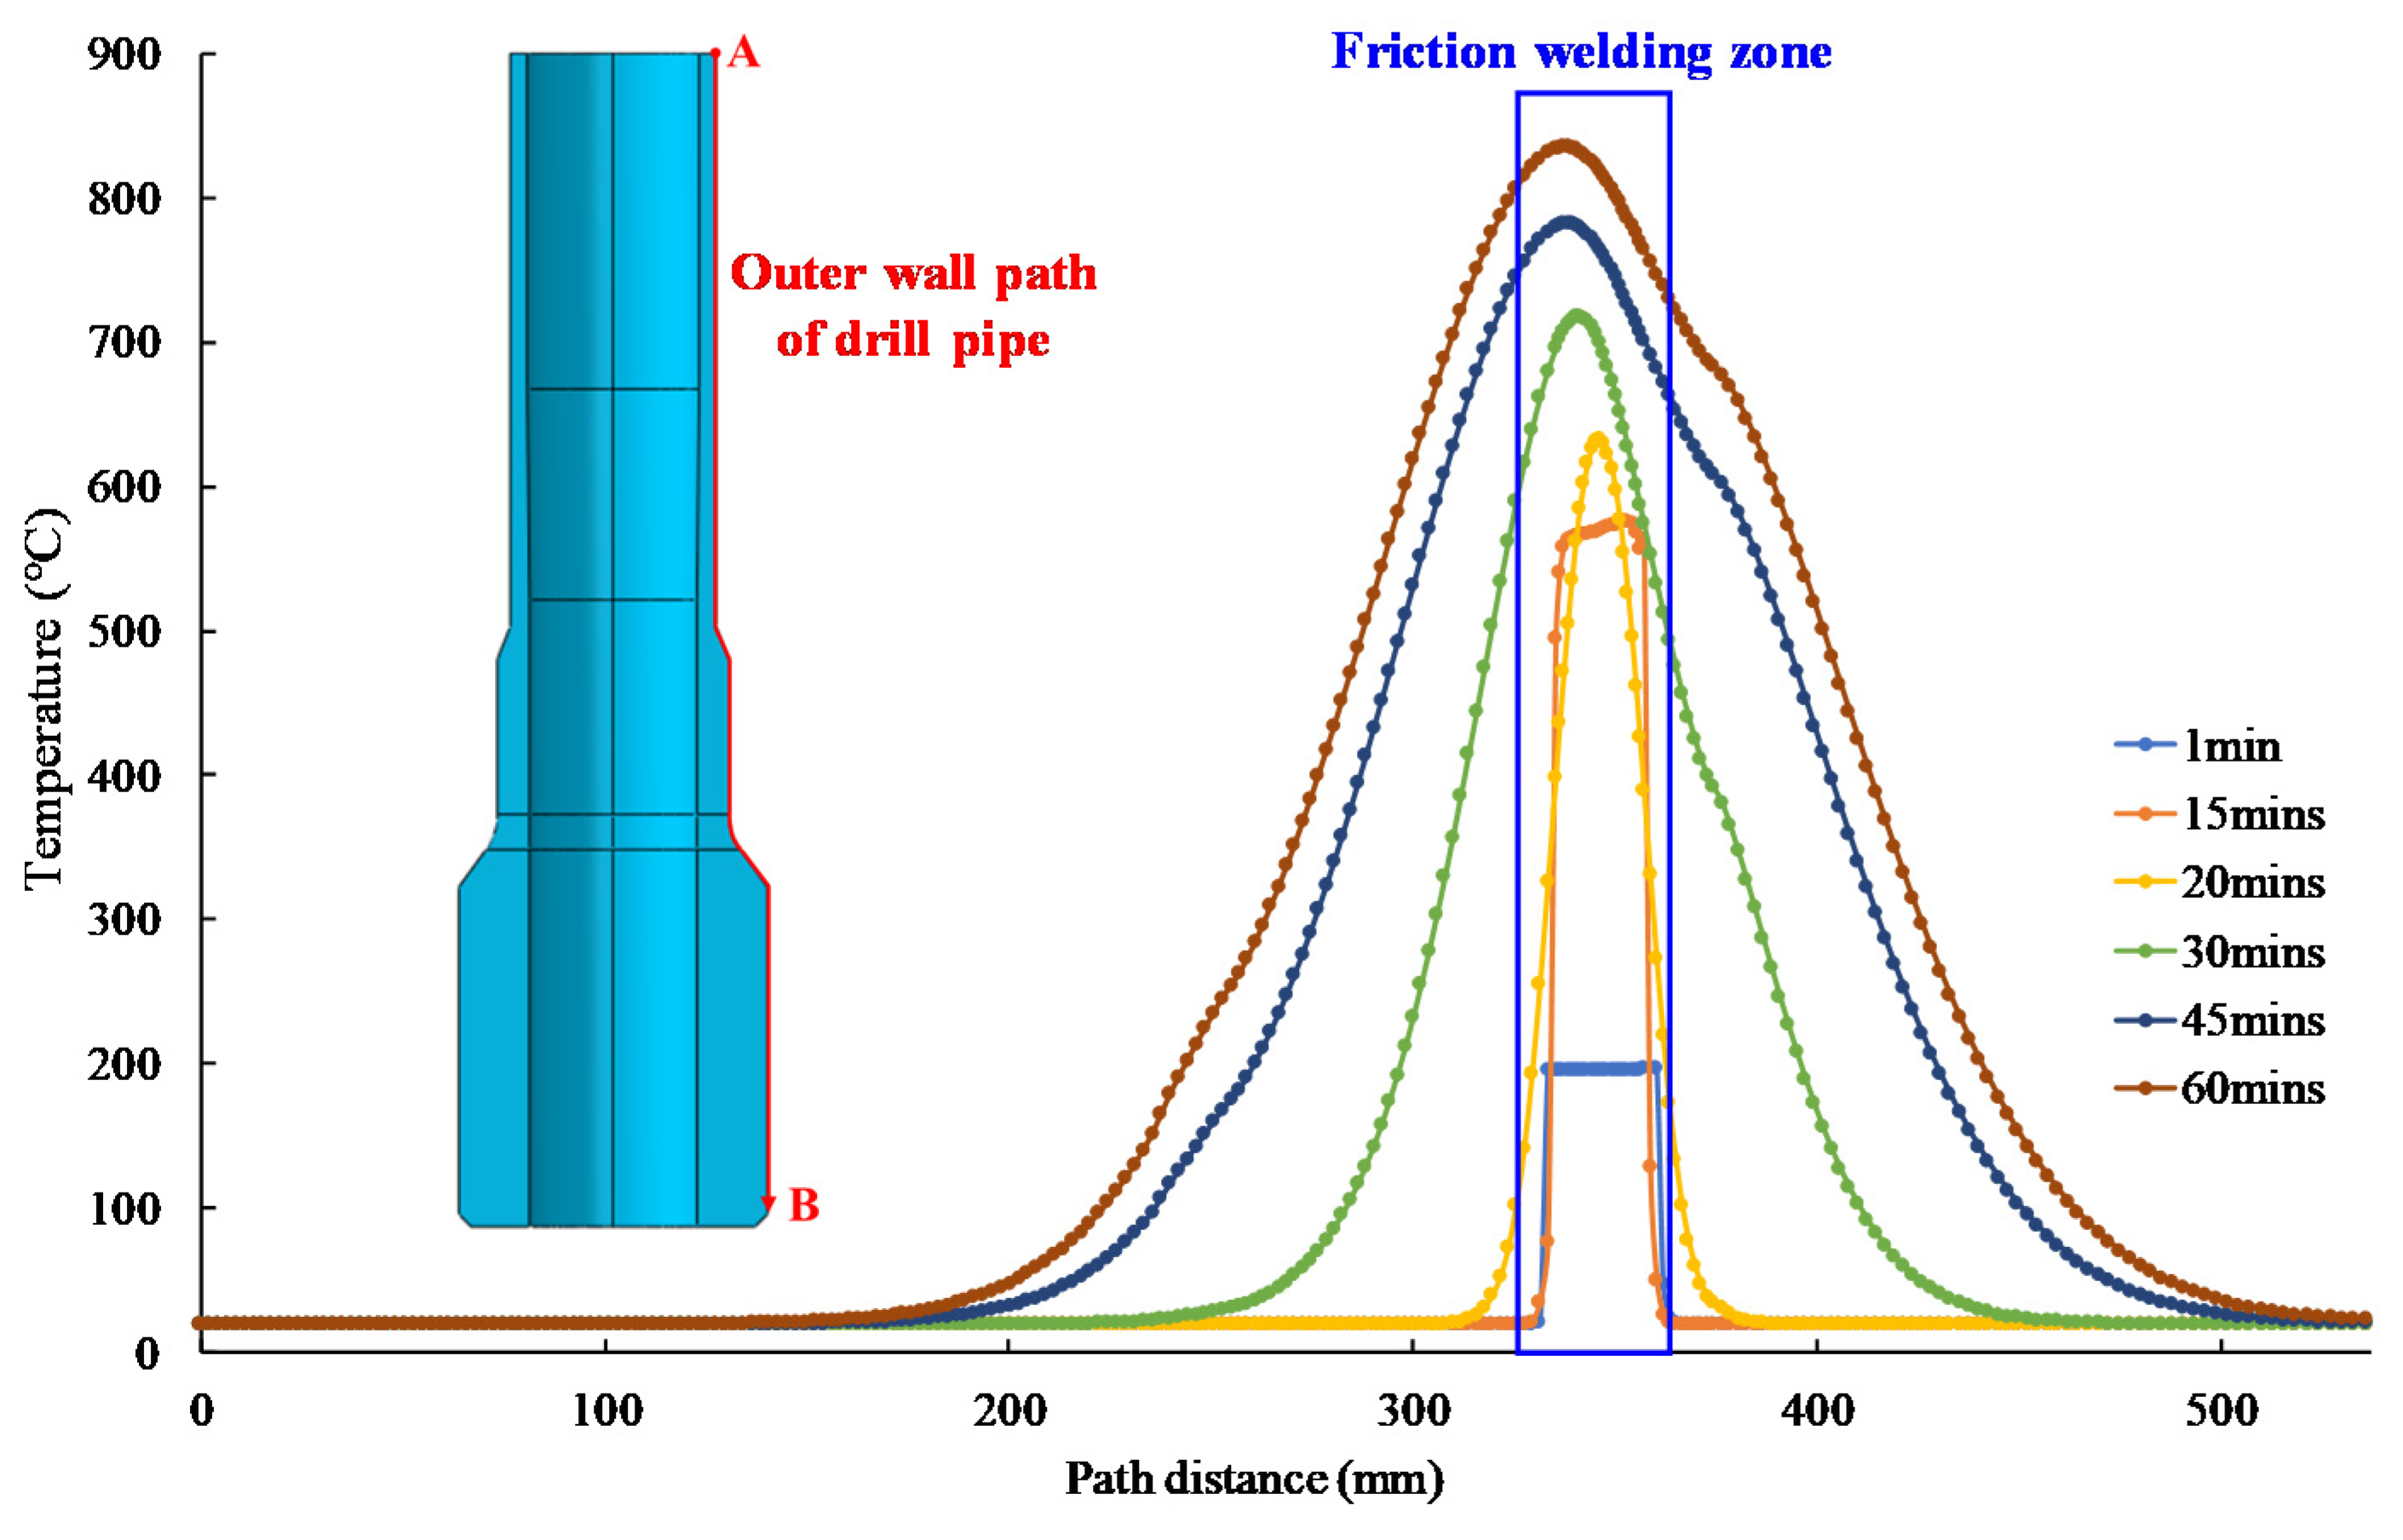
The axial temperature distribution curves of the outer and inner walls of the drill pipe were extracted by defining paths from top to bottom along the inner and outer walls of drill pipe, respectively.
Figure 12 displays the temperature distribution of the outer wall of the drill pipe at different times. It can be seen that as time goes on, the maximum temperature on the drill pipe becomes higher and higher. In the initial friction, the temperature changes only in the contact area, and then gradually spreads to the whole friction welding area and even other areas. After 60 min of friction between the drill pipe and the gravel, the highest temperature on the outer wall of the drill pipe reached 838 °C.
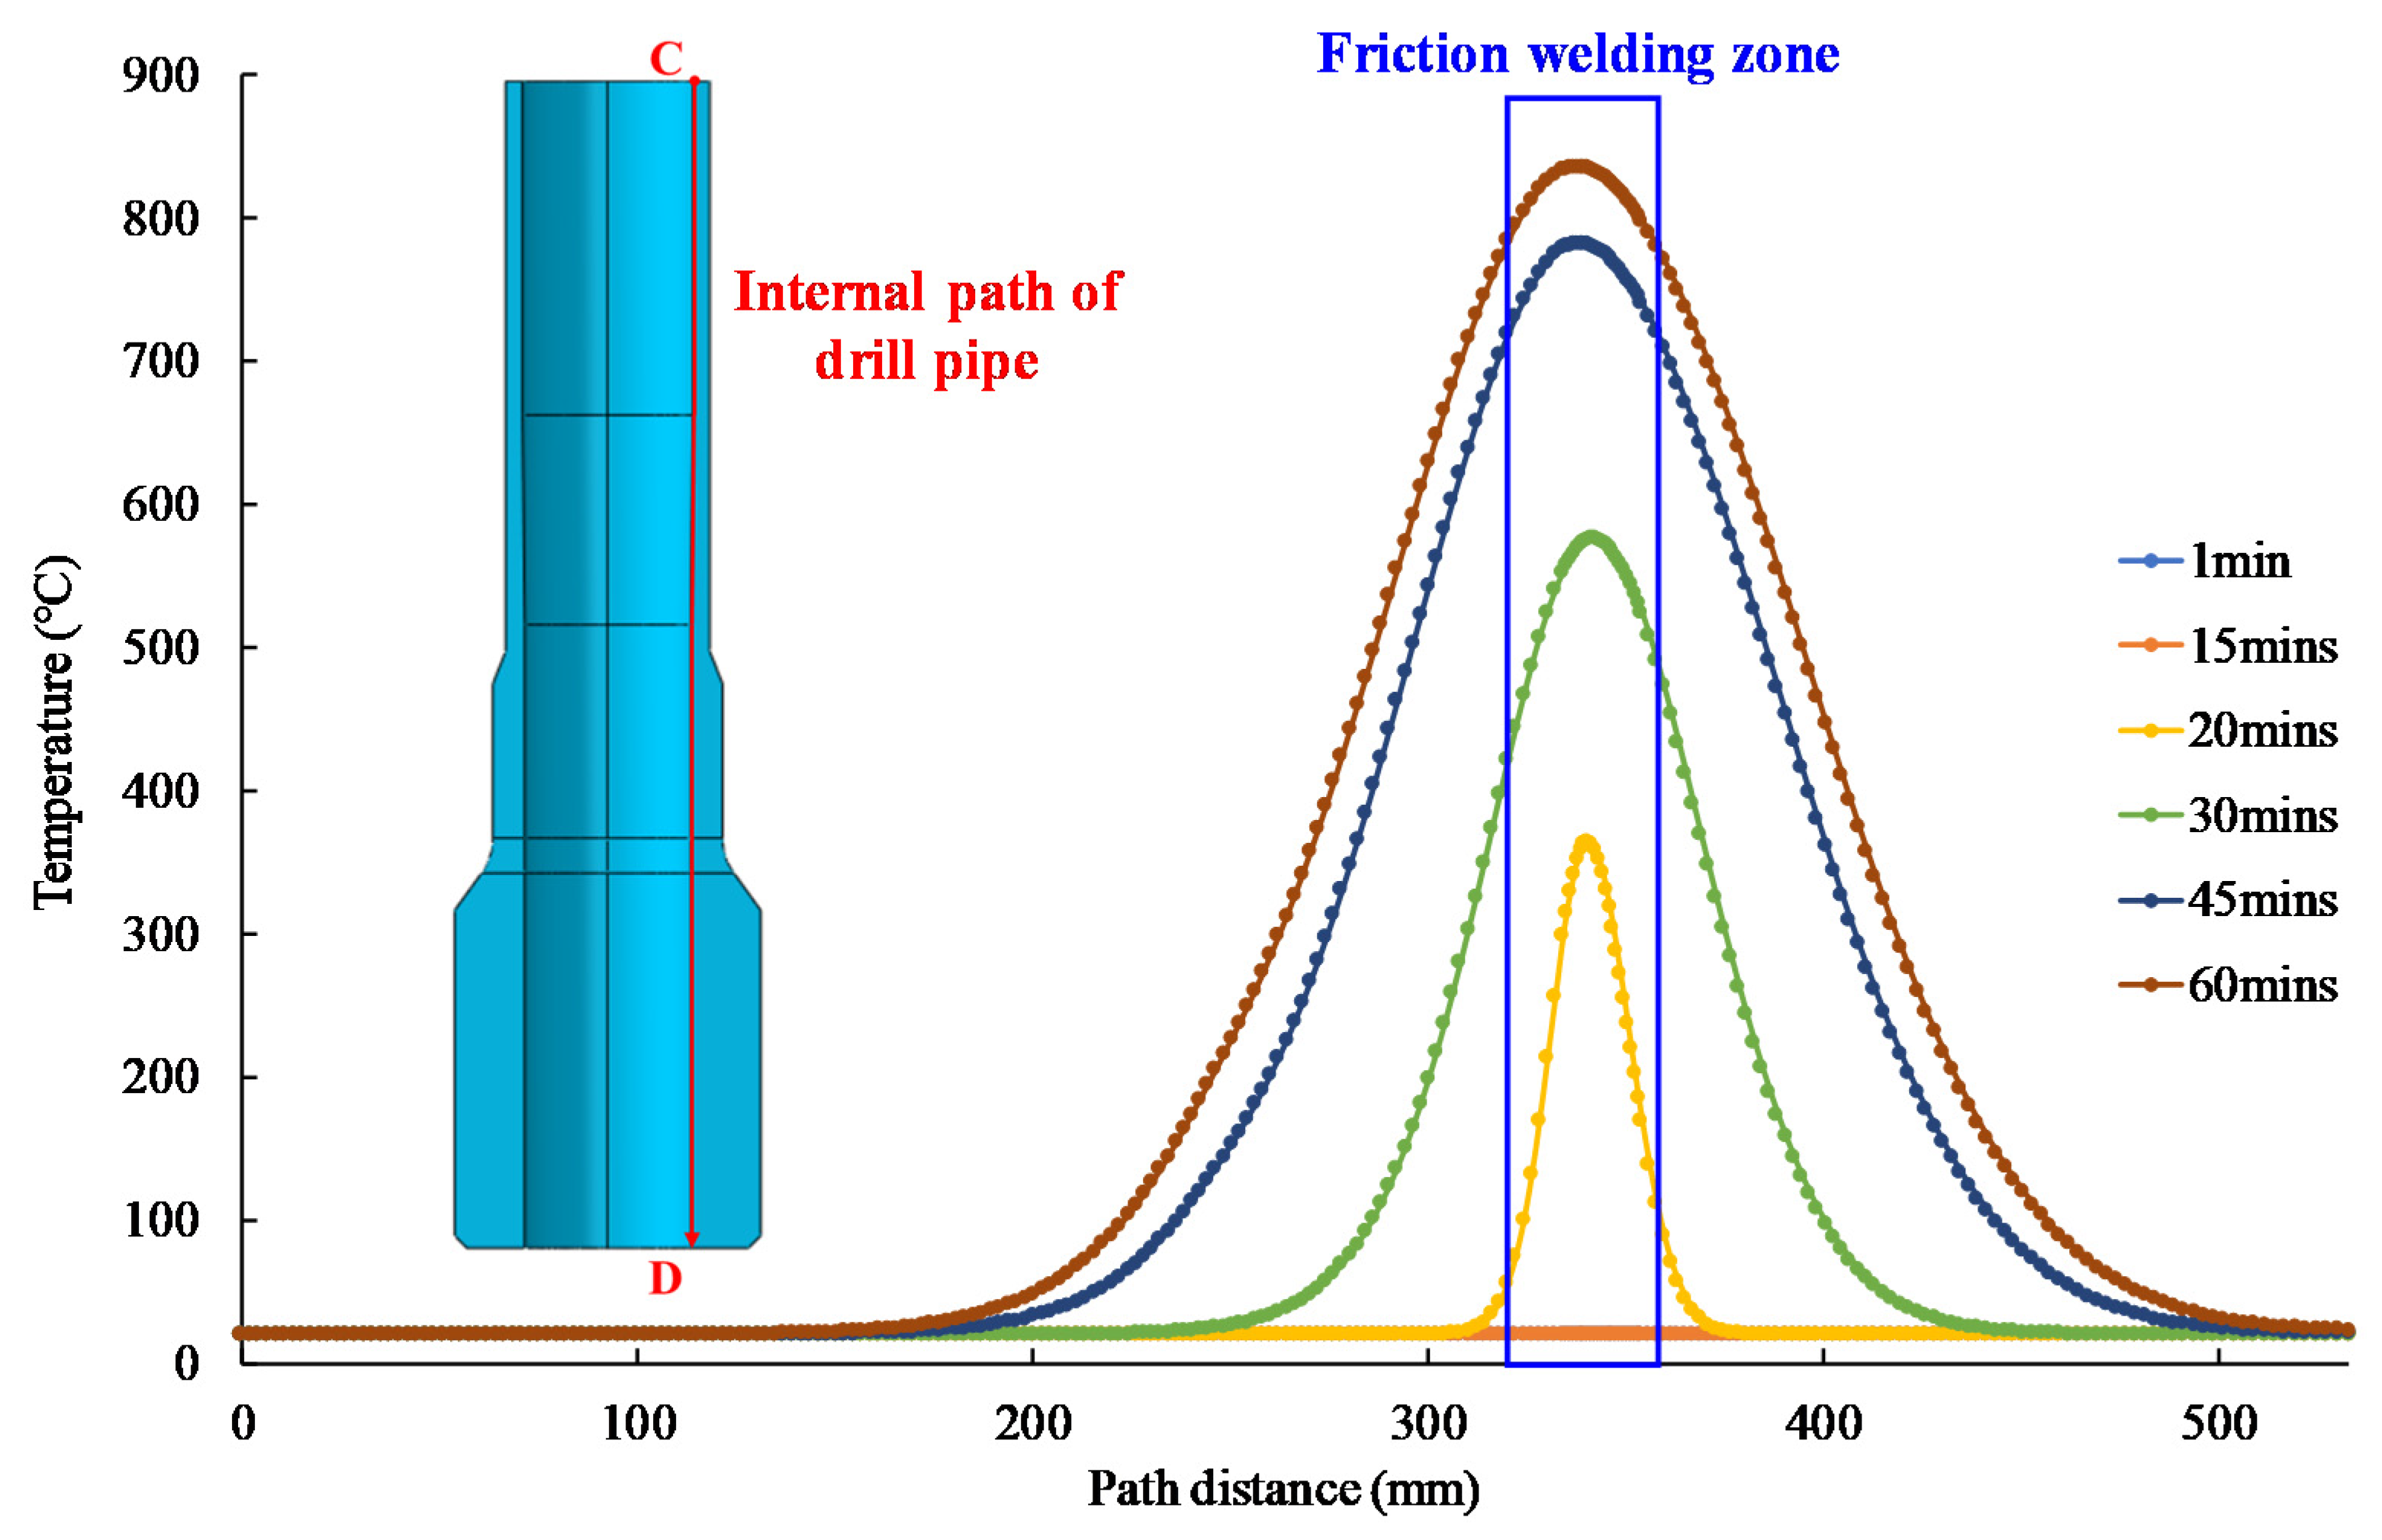
Figure 13 displays the internal temperature distribution of the drill pipe at different times. It is clear that when the friction time between drill pipe and sedimentary gravel is less than 15 min; the friction heat generated on the outer wall of drill pipe does not pass through the thickness of drill pipe wall, so there is no temperature change in the inner wall of drill pipe. Then, as time goes on, the temperature inside the drill pipe gradually increases and the range of temperature changes gradually increases, with the highest temperature appearing in the friction welding area and even extending to the area outside the contact zone. When the friction time reaches 60 min, the maximum internal temperature of the drill pipe reaches 836 °C, which is very close to the external temperature of the drill pipe. Hence, the law can be obtained to know that in the actual drilling process, if there is sand settling in the wellbore, the on-site operation should control the drilling time of each drill-pipe rotation. On the one hand, it can avoid the high temperature caused by the long time friction between drill pipe and gravel, resulting in the phase transition of drill pipe material and reduce the strength of drill pipe. On the other hand, it can avoid the high temperature of the outer wall of drill pipe penetrating the wall thickness of drill pipe, resulting in the overall strength of the friction welding area of drill pipe, or even fusing the drill pipe.
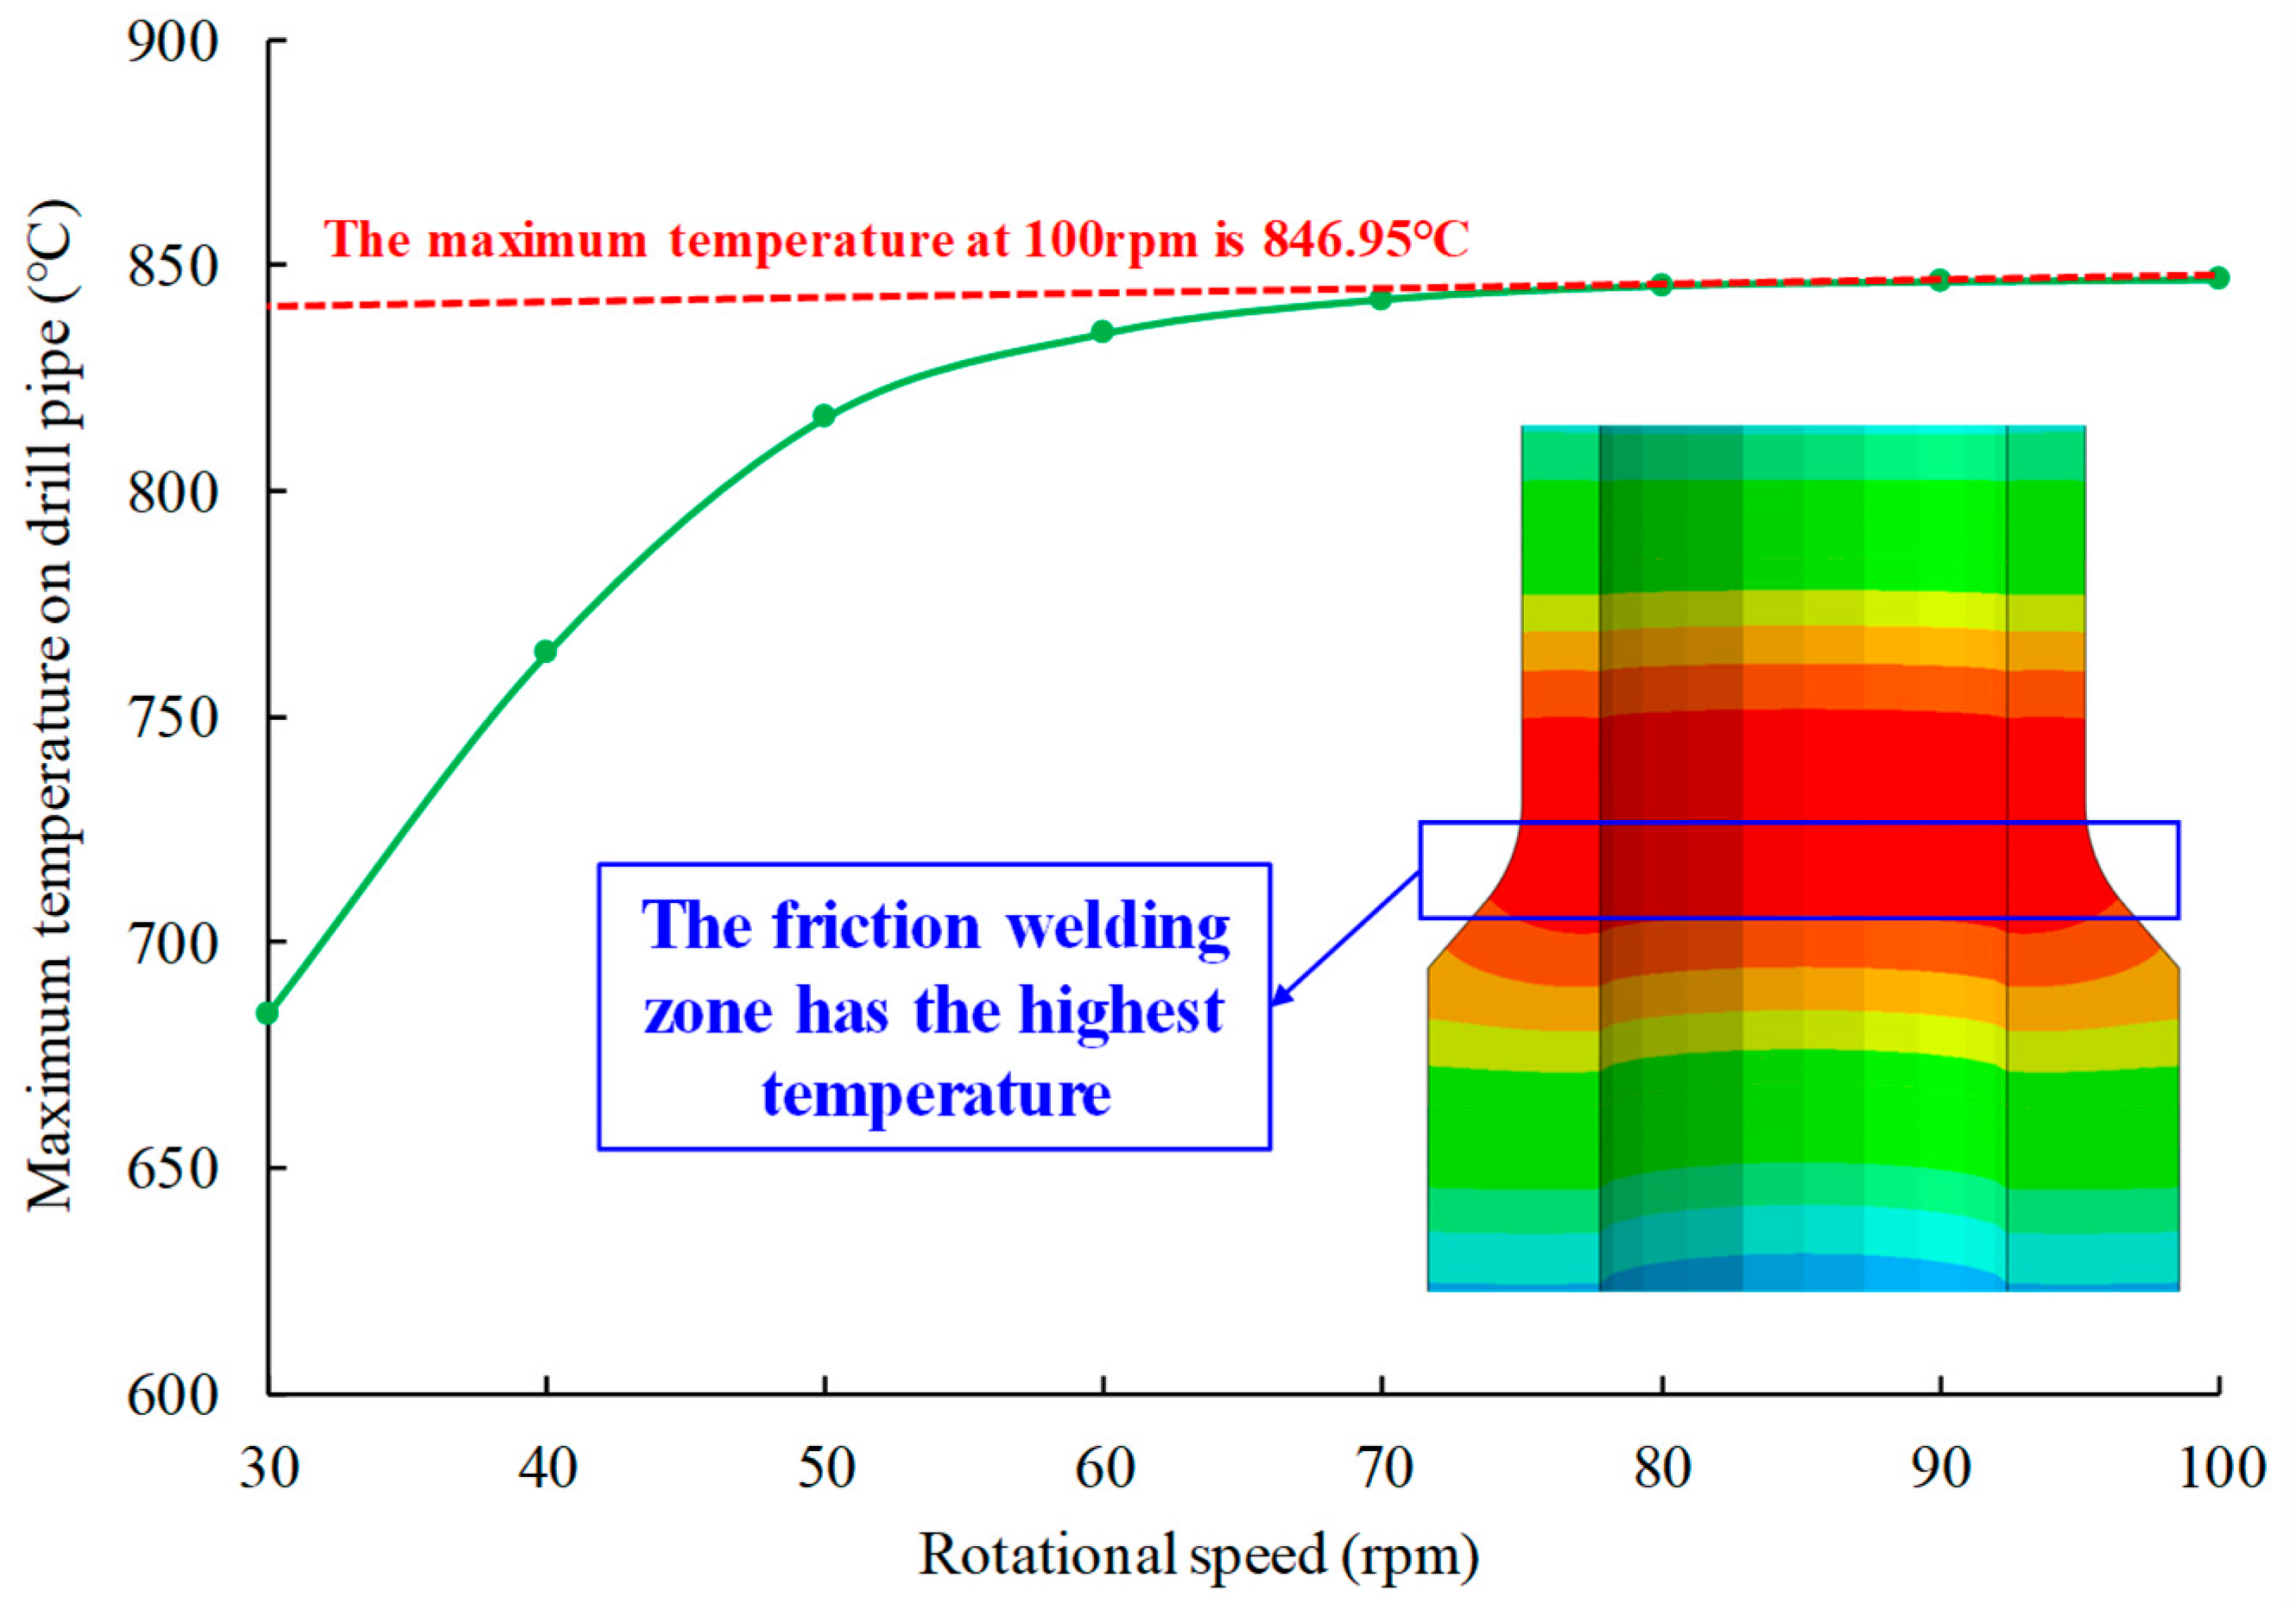
As a factor that can be controlled in the actual drilling process, the rotational speed also has a great influence on the heat generated by the friction between the friction welding area of the drill pipe and gravel deposited in the wellbore. By controlling the drilling speed of the drill pipe in the finite element model, the friction heat generation between the drill pipe and the gravel was simulated under different rotation speed conditions. The relationship between the maximum temperature on the drill pipe and the variation in rotational speed is shown in
Figure 14. The process of increasing the maximum temperature on drill pipe can be divided into two stages:
(i) When the drill pipe speed is lower than 50 rpm, the maximum temperature on the drill pipe increases with the increase in the rotation speed rapidly. For example, when the drill pipe speed is 30 rpm, the maximum temperature on the drill pipe is 684 °C, while when the drill pipe speed is 50 rpm, the maximum temperature is 816 °C;
(ii) When the drill pipe rotation speed is higher than 50 rpm, the increasing trend of the maximum temperature on the drill pipe gradually becomes slow. When the drill pipe rotation speed is 100 rpm, the maximum temperature is 847 °C, compare with the maximum temperature under the condition of 50 rpm, the increase is slight. Therefore, it can be seen from the analysis of the law that, in the actual underground drilling process, if sand and gravel deposition occurs in the wellbore, the rotational speed of the drill pipe can be artificially controlled to avoid the phase transition of metal and the reduction of strength of the drill pipe caused by the high friction temperature. Based on the results of this study, we recommend that the rate of penetration should be artificially controlled at around 50 rpm during drilling. At the same time, it is recommended that the drilling time should not exceed 60 min, and switching the drill pipe in time and cooling down. Meanwhile, keeping a clean hole and drilling fluid circulation are effective measures to prevent such failure.
The fracture process of the failed drill pipe can be deduced by experiment and finite element analysis: First, during the operation, a large amount of cuttings accumulated on top of the failed drill-pipe external threaded joint due to poor wellbore stability. Under the pressure of the upper mud, the accumulated cuttings gradually compacted, blocking the mud circulation channel. Secondly, during the rotation and lifting operation, there is severe friction and wear between the joint and the cuttings. Due to the lack of mud cooling and lubrication, a lot of friction heat is generated, which makes the local temperature of the contact part rise rapidly, austenitizing occurs in the structure of drill pipe material, the strength of material matrix decreases greatly, and the outer diameter and wall thickness decrease continuously. Finally, under the action of tensile, torsion and other composite loads, the material at high temperature will yield deformation and fracture.


