Article

Evaluation of the Zinc Sulfate Catalytic Effect in Empty Fruit Bunches Pyrolysis

by
María Alejandra Suárez Useche
1,*,
York Castillo Santiago
2,*,
Juan B. Restrepo
1,
Alberto Ricardo Albis Arrieta
1 and
Karen Patricia Agámez Salgado
1
1
Bioprocess Faculty of Engineering, Universidad del Atlántico, Carrera 30 # 8-49, Puerto Colombia, Atlántico 081001, Colombia
2
Laboratory of Thermal Sciences (LATERMO), Mechanical Engineering Department (TEM/PGMEC), Fluminense Federal University, Rua Passo da Pátria 156, Niterói 24210-240, RJ, Brazil
*
Authors to whom correspondence should be addressed.
Processes 2022, 10(9), 1748; https://doi.org/10.3390/pr10091748
Submission received: 19 July 2022 / Revised: 23 August 2022 / Accepted: 28 August 2022 / Published: 2 September 2022
(This article belongs to the Special Issue Kinetic Modeling of Biomass Pyrolysis Processes)

Abstract

:
The effect of zinc sulfate as a catalyst on the pyrolysis of empty fruit bunches (EFB) from oil palm was assessed. Thus, a thermo-gravimetric analyzer coupled with a Fourier transform infrared spectroscopy (TG-FTIR) was used, while the percentage of catalyst varied between 0 wt% and 3 wt% at different heating rates (10, 30, and 50 K/min). The kinetic parameters (activation energy, pre-exponential factor, and reaction order) and activation energy distribution were calculated using three kinetic models. The thermogravimetric curves for the EFB pyrolysis showed three prominent peaks in which the maximum mass loss rate was mainly due to cellulose and lignin pyrolysis. On the other hand, FTIR analysis indicated that the main gaseous products were CO2, CO, H2O, CH4, NH3, acids, and aldehydes (CH3COOH). The samples with 2 wt% of catalyst presented higher activation energies in pseudo reactions 1 and 2, ranging between 181,500 kJ/mol–184,000 kJ/mol and 165,200 kJ/mol–165,600 kJ/mol, respectively. It was highlighted that the first pseudo reaction with an activation energy range between 179,500 kJ/mol and 184,000 kJ/mol mainly contributes to the cellulose pyrolysis, and the second pseudo reaction (165,200 kJ/mol–165,600 kJ/mol) could be ascribed to the hemicellulose pyrolysis.

1. Introduction

The ongoing search for energy security and environmental sustainability and the depletion of oil reserves has boosted the development of processes based on alternative resources. One of them is biomass, a renewable energy source that can partially replace fossil fuels, reducing gas emissions into the atmosphere [1]. The oil palm industry is one of the largest producers of residual solid biomass, generating quantities that are approximately twice the amount of crude palm oil (CPO) produced in a palm oil mill (POM) [2]. It is worth noting that CPO is the vegetable oil with the highest production in the world. In 2020, CPO production was 72.27 million metric tons [3]. Indonesia (10,830,000 ha of plantation) and Malaysia (5,150,000 ha of plantation) are the two countries with the most significant CPO production, corresponding to 78% of the global production area [4].
In comparison, Colombia (465,000 ha) is the fifth-largest CPO-producing country, with 2.3% of the global production area [5]. According to estimates by Fedepalma [6], sector production is equal to 8.1% of Colombian agriculture. Recently, expansion of the oil palm sector has been associated with deforestation. In the lead-producing countries, the environmental impacts are also associated with deforestation, biodiversity loss, land-use change, soil quality, landscape deterioration, and greenhouse gas emissions by removing carbon stock from the soil [7]. In Colombia, the situation is different because the oil palm has been correlated with the conversion of scrublands, croplands, and savannas [8,9,10]. The solid biomass from POM is composed of empty fruit bunches (EFB) in a mass ratio of 22 to 25% of fresh fruit bunches (FFB), the fiber in a mass fraction from 12 to 14% of FFB, and palm kernel shell with 6 to 7% of FFB mass fraction [11]. The EFB has a high calorific value, approximately 16.7 kJ/kg on a dry basis, and, with proper treatment, can be used for steam generation in boilers, furnaces, and ovens [12]. In addition, 800 dm3 of effluent from palm oil mill effluent (POME) is produced for each ton of EFB [13].
The problematic management of the biomass generated in the agro-industrial sector has led to environmental and economic concerns. Therefore, its use to obtain bioenergetic products through biochemical and thermochemical routes could be a promising alternative to resolve those difficulties [14]. Currently, the thermochemical route is the most used since it can efficiently and economically convert biomass and wastes into valuable fuels for different applications, e.g., biofuels, raw materials for the chemical industry, heat and electricity generation, among others [15]. Among the main thermochemical processes are gasification, hydrothermal liquefaction, combustion, and pyrolysis. The pyrolysis process is the most promising because it can simultaneously obtain bio-oil, bio-char, and non-condensable gases without using oxygen [16]. The quality of pyrolysis performance is affected by various process parameters such as heating rate, temperature, residence time, pressure, type of reactor, and raw material with diverse characteristics such as size, structure, and shape [17]. Biomass pyrolysis process types include conventional or slow, vacuum, fast, and flash [18]. Fast pyrolysis stands out from the others because it can maximize bio-oil production, which is a desirable and easy-to-transport product [19].
The characteristic parameters of the fast pyrolysis process are very high heating rates, reaction temperatures in the range of 425 to 600 °C, vapor residence times in the reactor less than 3 s, and quickly produced gas-cooling [20]. Therefore, a fundamental understanding of the behavior and kinetics of pyrolysis is essential for the efficient thermochemical conversion of biomass. Thermogravimetric analysis (TGA) coupled with Fourier transform infrared spectrometry (FTIR) is an accurate means to study, not only mass loss characteristics, but also, kinetic parameters [21].
Ma et al. [22] determined the behavior and characteristics of African palm kernel pyrolysis using TGA-FTIR analysis and studied the reaction kinetics using free integral method models. The authors calculated the activation energy describing the thermal devolatilization mechanism of African palm kernel pyrolysis processes at different conversion rates using the multiple heating rates method (heating rates of 10, 20, 30, and 40 K min−1). Thus, the palm kernel pyrolysis mechanism was established to design and efficiently operate palm kernel thermochemical conversion. Ordonez-Loza et al. [23] investigated non-isothermal TGA of the pyrolysis (inert atmosphere) and combustion (using air) of bio-oil from sugarcane bagasse at three heating rates: 5, 10, and 20 °C/min. The biomass samples were heated from 25 °C to 900 °C, and the evolved gases in the TG furnace were carried in an FTIR cell, where the composition and present functional groups were analyzed. The authors observed that the intensity of the CO2 FTIR peaks during bio-oil combustion was ten-times higher than the intensity of the CO2 peaks obtained during the pyrolysis process. They concluded that TGA-FTIR analysis of sugarcane bagasse bio-oil is crucial for studying biomass thermal degradation/oxidation.
On the other hand, biomass pyrolysis studies have shown that the bio-oil obtained is not high-quality enough to be used directly as fuel. Therefore, it must be submitted to treatments such as upgrading, considerably increasing production costs. Catalytic pyrolysis improves the quality of bio-oil and reduces production costs, promoting the production and quality of bio-oil through appropriate catalysts [24]. Albis et al. [25] studied the catalytic effect of ferric and zinc sulfate on hemicellulose pyrolysis through the thermogravimetric analysis technique. The results were fitted to kinetic models: n-order, isoconversional, and activation energy distribution (DAEM). The authors concluded that the presence of these salts considerably altered the shapes of the thermogram. Chen et al. [26] analyzed biomass (sawdust and sorghum distillery) catalytic pyrolysis phenomena and mechanisms using a Zeolite Socony Mobil-5 (ZSM-5) as a catalyst via TGA and pyrolysis-gas chromatography/mass spectrometry, focusing on catalytic level identification and aromatic hydrocarbons (AHs) formation. The results suggested that biomass pyrolysis processes could be divided into three zones, from a heat-transfer dominant zone (zone 1) to dominant catalysis zones (zones 2 and 3). The optimum biomass-to-catalyst ratio was 1/10, where AHs formation was significantly intensified, especially for sawdust.
Regarding zinc sulfate use, Rachel-Tang et al. [27] evaluated the EFB thermochemical conversion considering some supported Zn catalysts. The results indicated that a catalyst with 15 wt% of Zn supported on ZSM-5 led to the highest bio-oil yield conversion, where it was concluded that zinc catalysts improve the bio-oil yield and favor the furfural content in the bio-oil. However, high zinc content catalysts are expensive, and their utilization could be unfeasible. Li et al. [28] studied zinc sulfate as a contaminant of corn biomass and its catalytic effect on pyrolysis. The ZnSO4 demoted the fragmentation of hemicellulose while promoting cellulose degradation. Thus, the zinc catalyst use benefited the multimolecular repolymerization of the primary degradation products (biochar and bio-oil). Mayer et al. [29] investigated the effect of biomass preparation on the pyrolysis process using zinc sulfate and zinc nitrate and found that sample preparation changed the matrix and the biomass physical-chemical properties, increasing the thermal stability of cellulose during pyrolysis. Thus, biomass pyrolysis in the presence or absence of zinc catalysts must be prepared carefully to gain reliable and comparable results.
Based on the previous discussion, limited studies analyzed the effect of mineral catalysts on EFB pyrolysis and the chemical compounds present in their products. Thus, this work aims to evaluate the catalytic effect of zinc sulfate on the behavior and kinetics of EFB pyrolysis, focused on the EFB mass-loss characteristics at heating rates of 10, 30, and 50 K/min. Three models (activation energy, pre-exponential factor, and reaction order) were used to calculate the activation energy and to describe the thermal devolatilization mechanism of EFB pyrolysis processes. Finally, the products resulting from the EFB pyrolysis were analyzed, considering the FTIR of different samples and their evolution through different heating rates.

2. Materials and Methods

2.1. Samples Preparation and Characterization

The EFB was subjected to a grinding and sieving process where particles with diameters of approximately 60 μm were obtained. Once the sample was dry and free of impurities, the characterization process was performed. The method of Ona et al. [30] was used for structural analysis, which indicates the procedure for extractives, lignin, holocellulose, and cellulose determination. The proximate analysis was performed according to the ASTM D3172–07a standard [31], while the ultimate analysis was carried out following the CHNS/O equipment procedure.
Regarding the catalyst, the zinc sulfate was initially dehydrated at a temperature of 180 °C, and it was then mixed with the biomass by impregnation using solutions or suspensions. Appropriate amounts of catalyst were mixed with the biomass to obtain percentages of 1%, 2%, and 3% of catalyst. The mixtures obtained were stirred for 2 h, and the solid phases were recovered and dried at 105 °C. The biomass and catalyst mixtures were reserved in a desiccator until further analysis.

2.2. TGA-FTIR Analysis

The TGA–FTIR test setup consisted of a thermogravimetric balance (Setsys Evo, Setaram) coupled to a Fourier transform infrared spectrometer (IR-Afinnity, Shimadzu) equipped with a gas cell with a pathlength of 10 cm and KBr windows (Pike). Approximately 15–18 mg of the EFB/catalyst mixtures samples was used for each test. The temperature was raised from room temperature (25 °C) to 750 °C under heating rates of 10, 20, and 30 K/min. The flow rate of the carrier gas (high-purity N2) was 50 mL/min. The resolution and spectral region of the FTIR ranged from 400 to 4000 cm−1, and the spectrum scan was conducted at 13.35-s intervals [32].

2.3. Kinetic Modeling

The thermogravimetric data were fitted by using three models extensively reported in the literature: the n-reaction order model, the pre-exponential factor model, and the distributed activation energy model (DAEM) [33,34,35,36,37].

2.3.1. N-Reaction Order Model

This is a differential model in which the pyrolysis rate is considered a conversion-dependent reaction and can be expressed as a temperature-dependent function [38]. The decomposition rate of a solid substance heated at a constant rate ( β = d T d t ) can be written as shown below [39]:
β ( d α d T ) = A   e x p ( E a R T ) f ( α )
where A is the pre-exponential or frequency factor; E a is the activation energy; R , the universal gas constant; T , the absolute temperature; f ( α ) , the kinetic function represents the kinetic model, and α is the conversion. By applying the Napierian logarithm function to (1) and assuming the reaction model f ( α ) = ( 1 α ) n , typically used in this type of process and analysis [40], the following equation is obtained:
ln ( d α d T ) n ln ( 1 α ) = ln ( A β ) E a R T
If the left side of (2) is plotted as a function of 1/T, it is possible to obtain the activation energy from the slope and the pre-exponential intercept factor with the ordinate.

2.3.2. Pre-Exponential Factor Model

This model estimates the activation energy with an isoconversional method in which the activation energy is related to the heating rate, keeping the conversion constant [41].
ln β = C 1 E a R T
where C 1 is an integration constant and R is the universal gas constant. The activation energy can be calculated from the slope of l n ( β ) as a function of 1/T.

2.3.3. Distributed Activation Energy Model

DEM is a parallel reaction model with activation energy based on Gaussian distribution, where the mass spectrometric intensities signal or the derivative thermogravimetry (DTG) curve could be calculated using Equation (4) [42].
Y C a l c ( t ) = j = 1 M C J d x j d t
where x j represents the fraction of unreacted material by the j -th equations, and C j represents the partial equation of the j -th measured quantity. The model assumes first-order kinetics and a dependence on the kinetic constant of the Arrhenius equation.
The activation energies for the involved reactions agree with a Gaussian distribution function with parameters E ( 0 , j ) and σ j . If the solution of a first-order kinetic equation at a given value of E is denoted as X j ( t , E ) , the x j functions of (4) can be calculated using Equation (5).
x j ( t ) = 0 ( 2 π ) 1 2 σ j 1 e x p [ ( E E 0 , j ) 2 2 σ j 2 ] X j ( t , E ) d E

2.4. Standard Deviation

The dispersion of the data obtained was analyzed through the standard deviation, which can be defined by Equation (6).
S = 1 N ( x i X ¯ ) 2 N
where X ¯ is the sample mean, x i is each data value, and N is the number of data-points.

2.5. Experimental Design

A 3 × 4 factorial design of experiments was selected. Manipulated variables were catalyst concentration (4 levels: 0, 1, 2, and 3% of ZnSO4) and heating rate (10, 30, and 50 K/min) for 12 experimental treatments.

2.6. FTIR Analysis of Evolved Gases

Infrared spectra (IR) of the different samples were analyzed to identify the products resulting from the EFB pyrolysis aiming to study their evolution through temperature.

3. Results

3.1. Samples Characterization

The results from the structural characterization and proximate and ultimate analysis of the EFB are presented in Table 1.

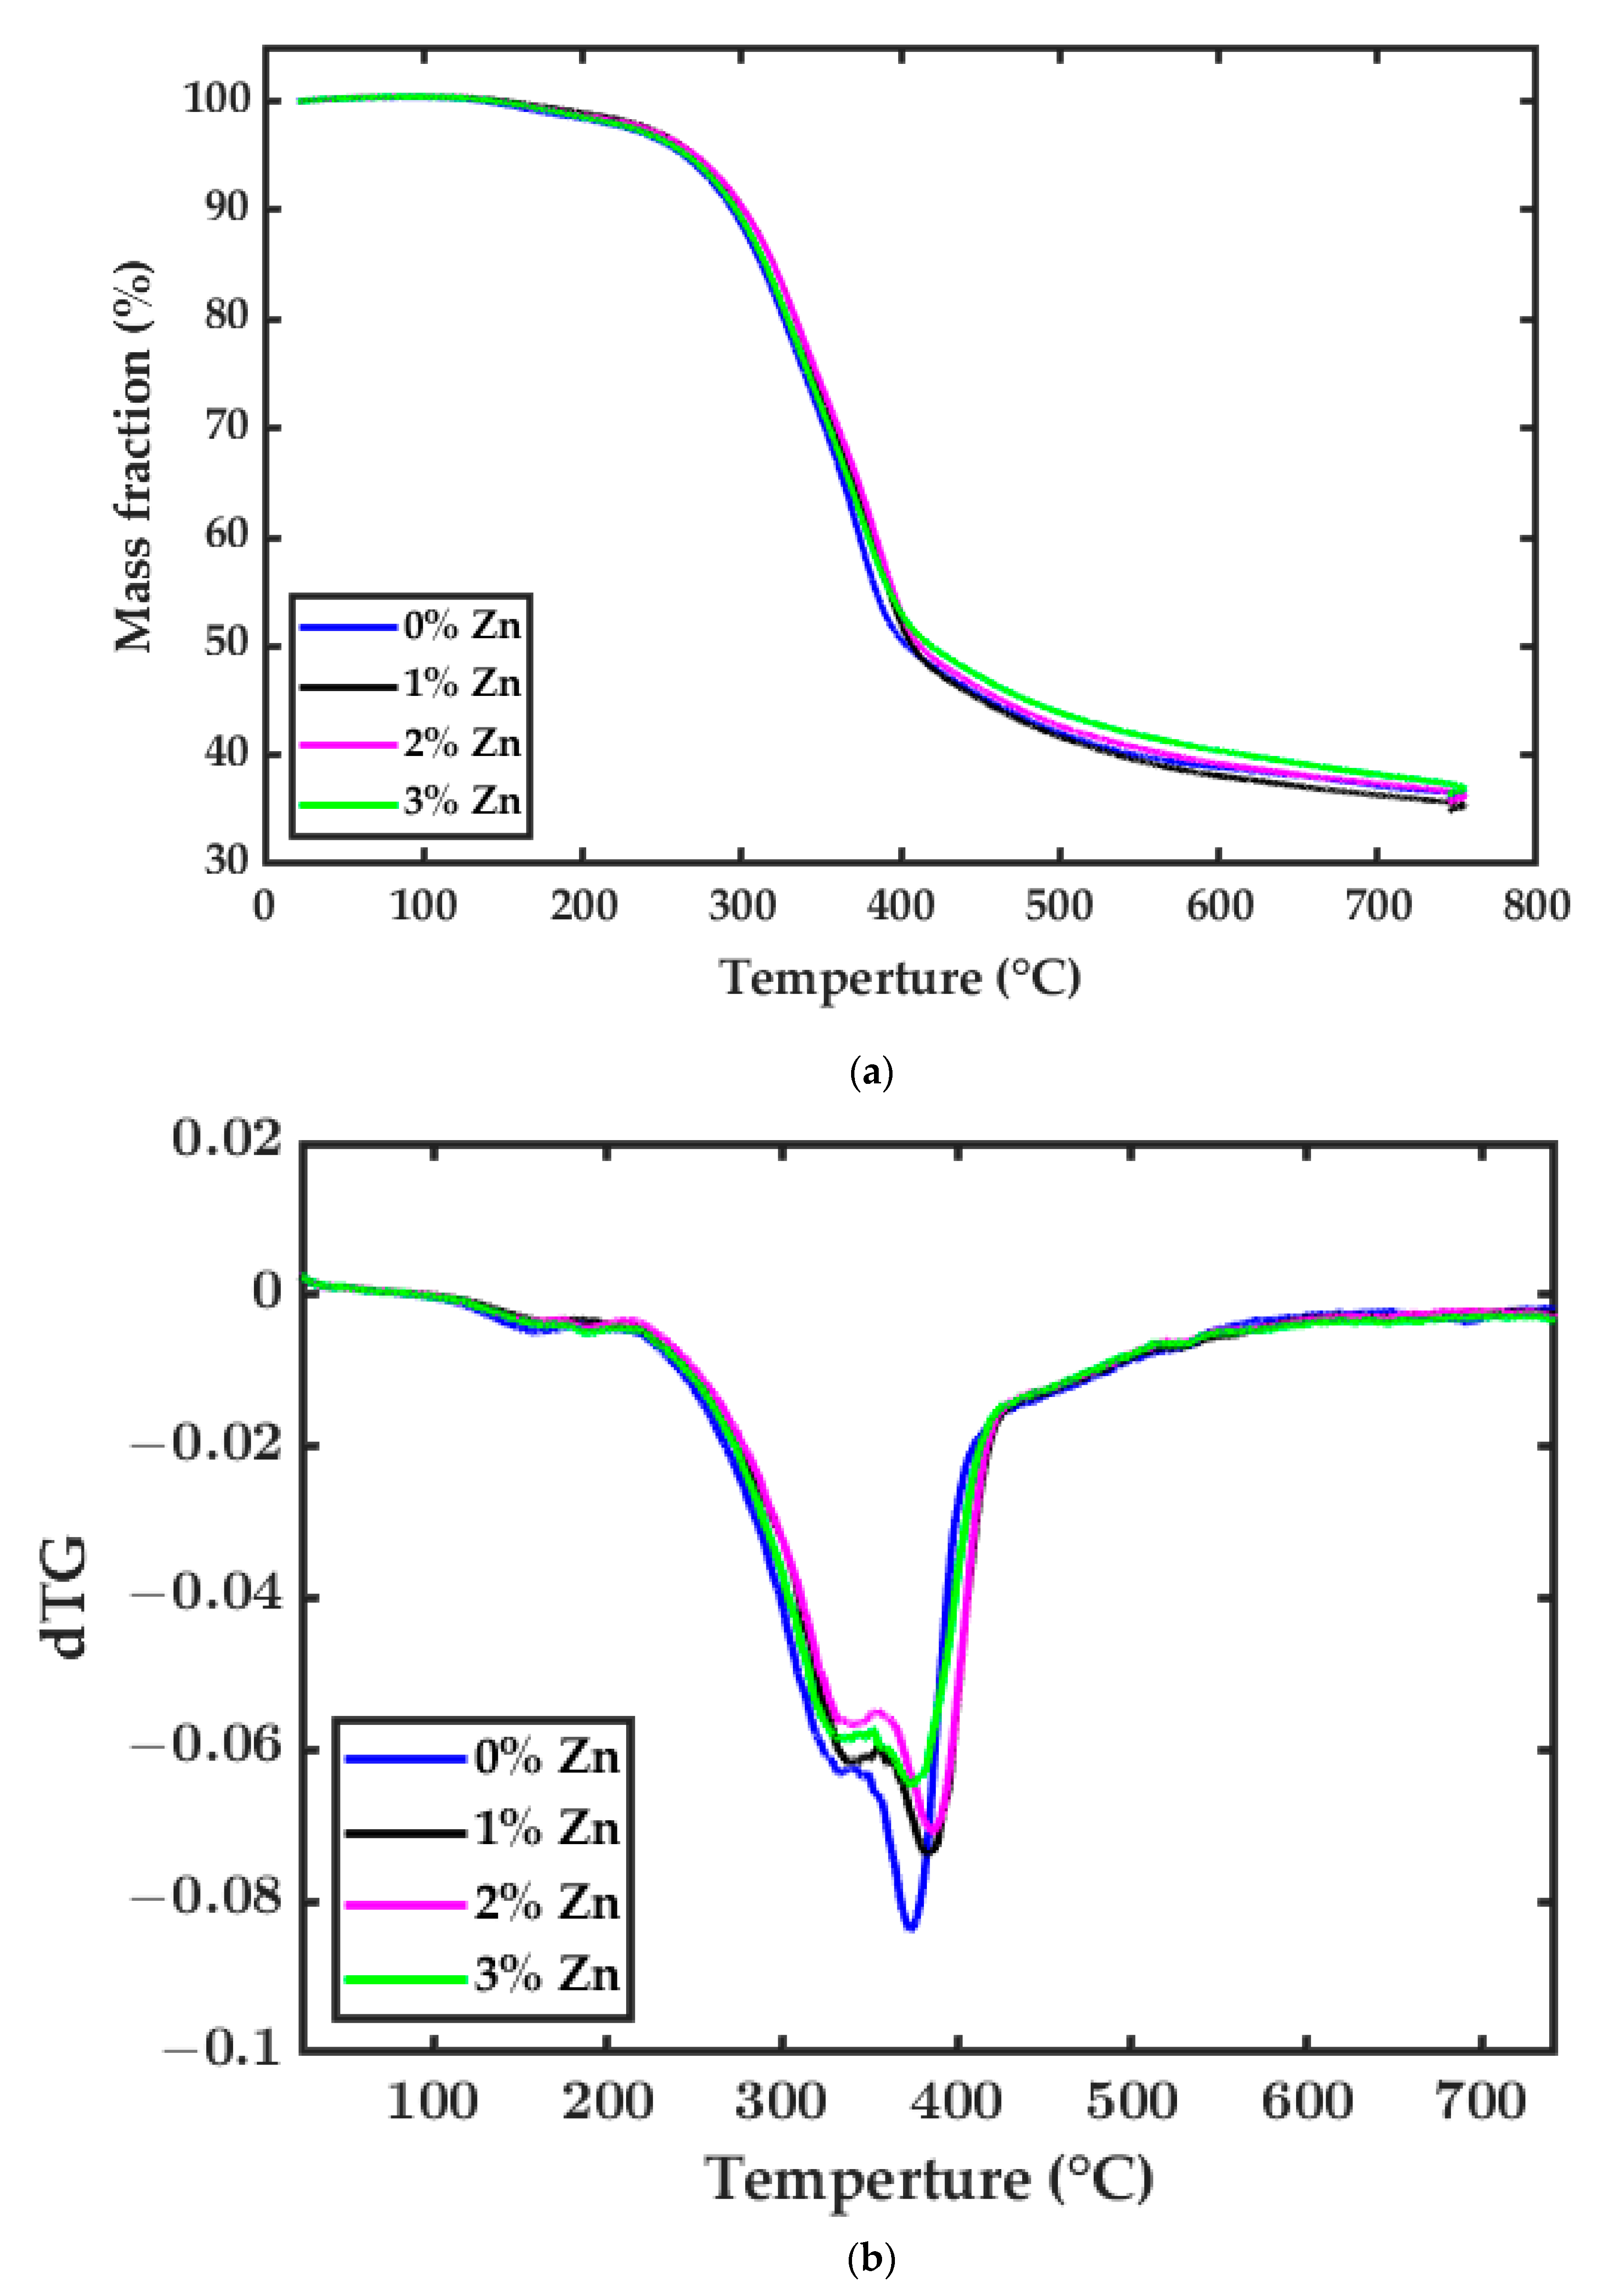
3.2. Thermogravimetric Analysis

The thermogravimetric curves of the samples were analyzed as a result of the catalytic pyrolysis process. Figure 1, Figure 2 and Figure 3 illustrate the mass loss curves during the EFB catalytic pyrolysis at the different heating rates (10 K/min, 30 K/min, and 50 K/min) and the stages of the catalytic pyrolysis where the mass loss of the samples occurs can be seen in the DTG curves.
In Table 2, the carbonization percentages of the samples and the mass loss during the pyrolysis reaction were related. In addition, Table 3 shows the temperatures at which the 50% mass loss was reached.

3.3. Kinetic Parameters

3.3.1. N-Reaction Order Model Assessment

Table 4 shows kinetic parameters such as activation energy (Ea), pre-exponential factor (A), and reaction order (N), as well as the determination coefficient (R2) obtained from the n-reaction order model. A fitting graph for EFB using the n-reaction order model is shown in supporting material A.

3.3.2. Pre-Exponential Factor Model Assessment

Table 5 shows the activation energy and the determination coefficient obtained from the pre-exponential factor model. In Table 6, the average activation energies for the central conversions (0.3–0.8) were calculated since those values were considered the most representative of the reaction. A fitting graph for EFB using the pre-exponential factor model is shown in supporting material A.

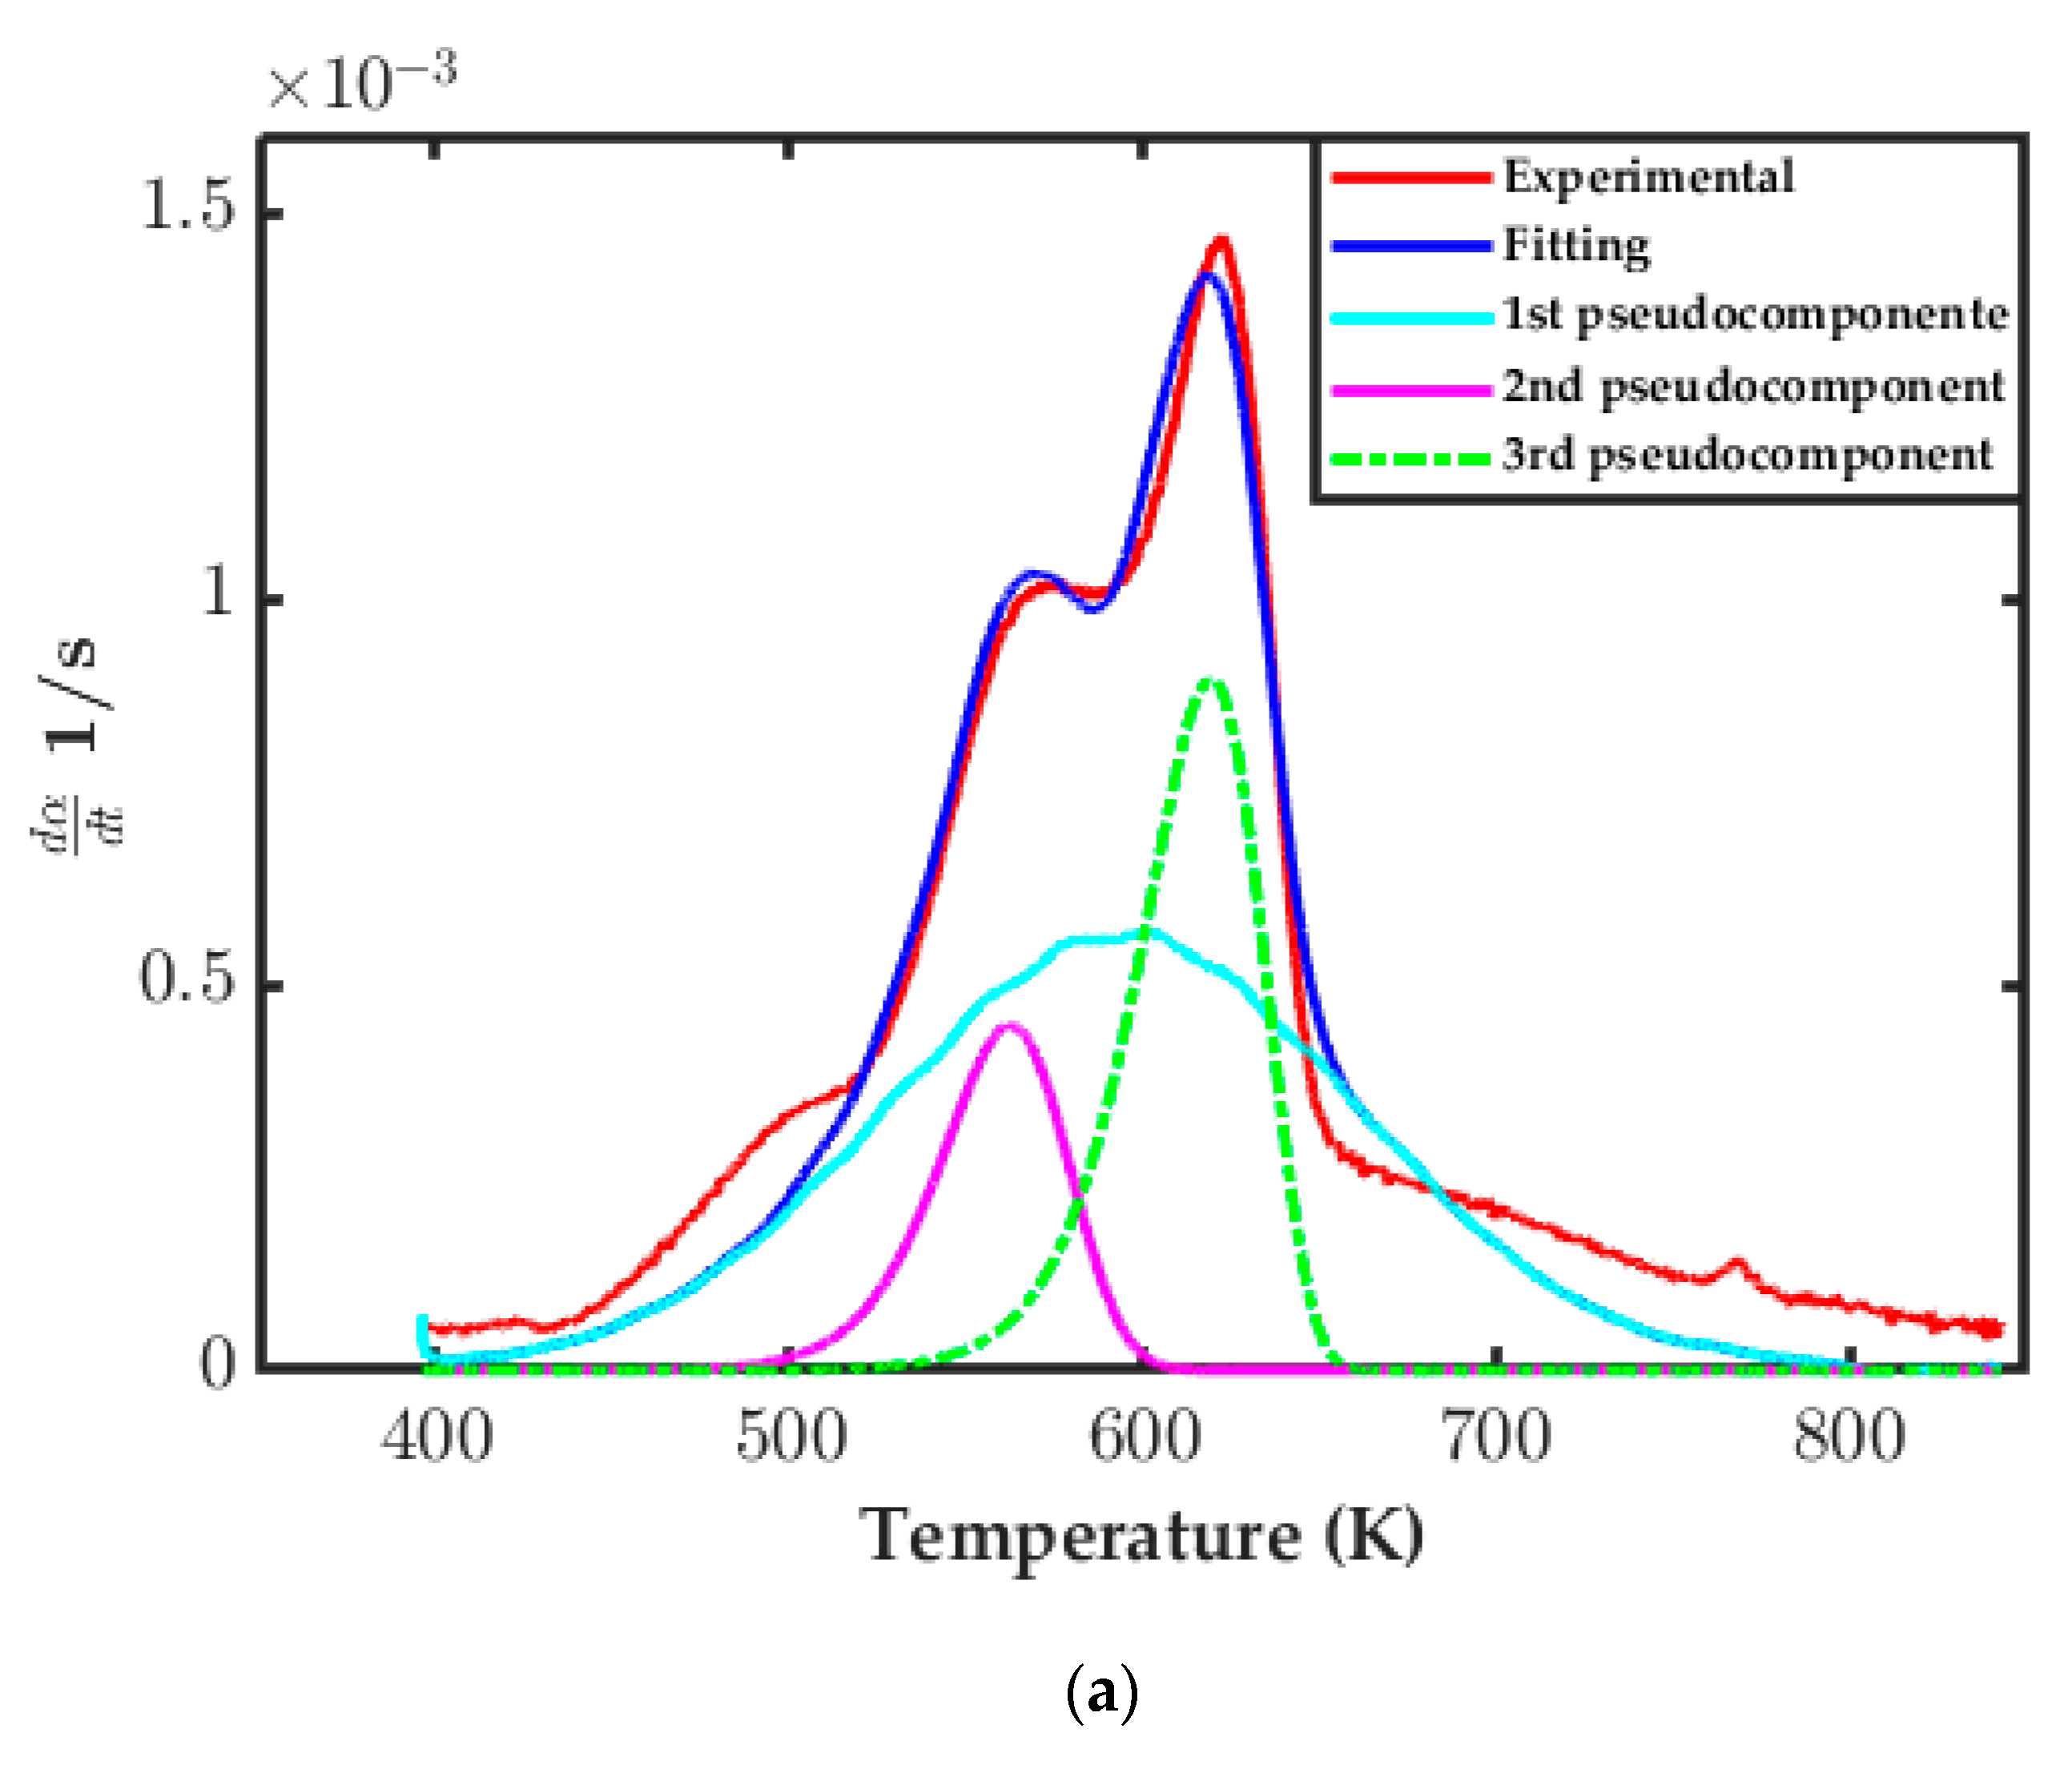
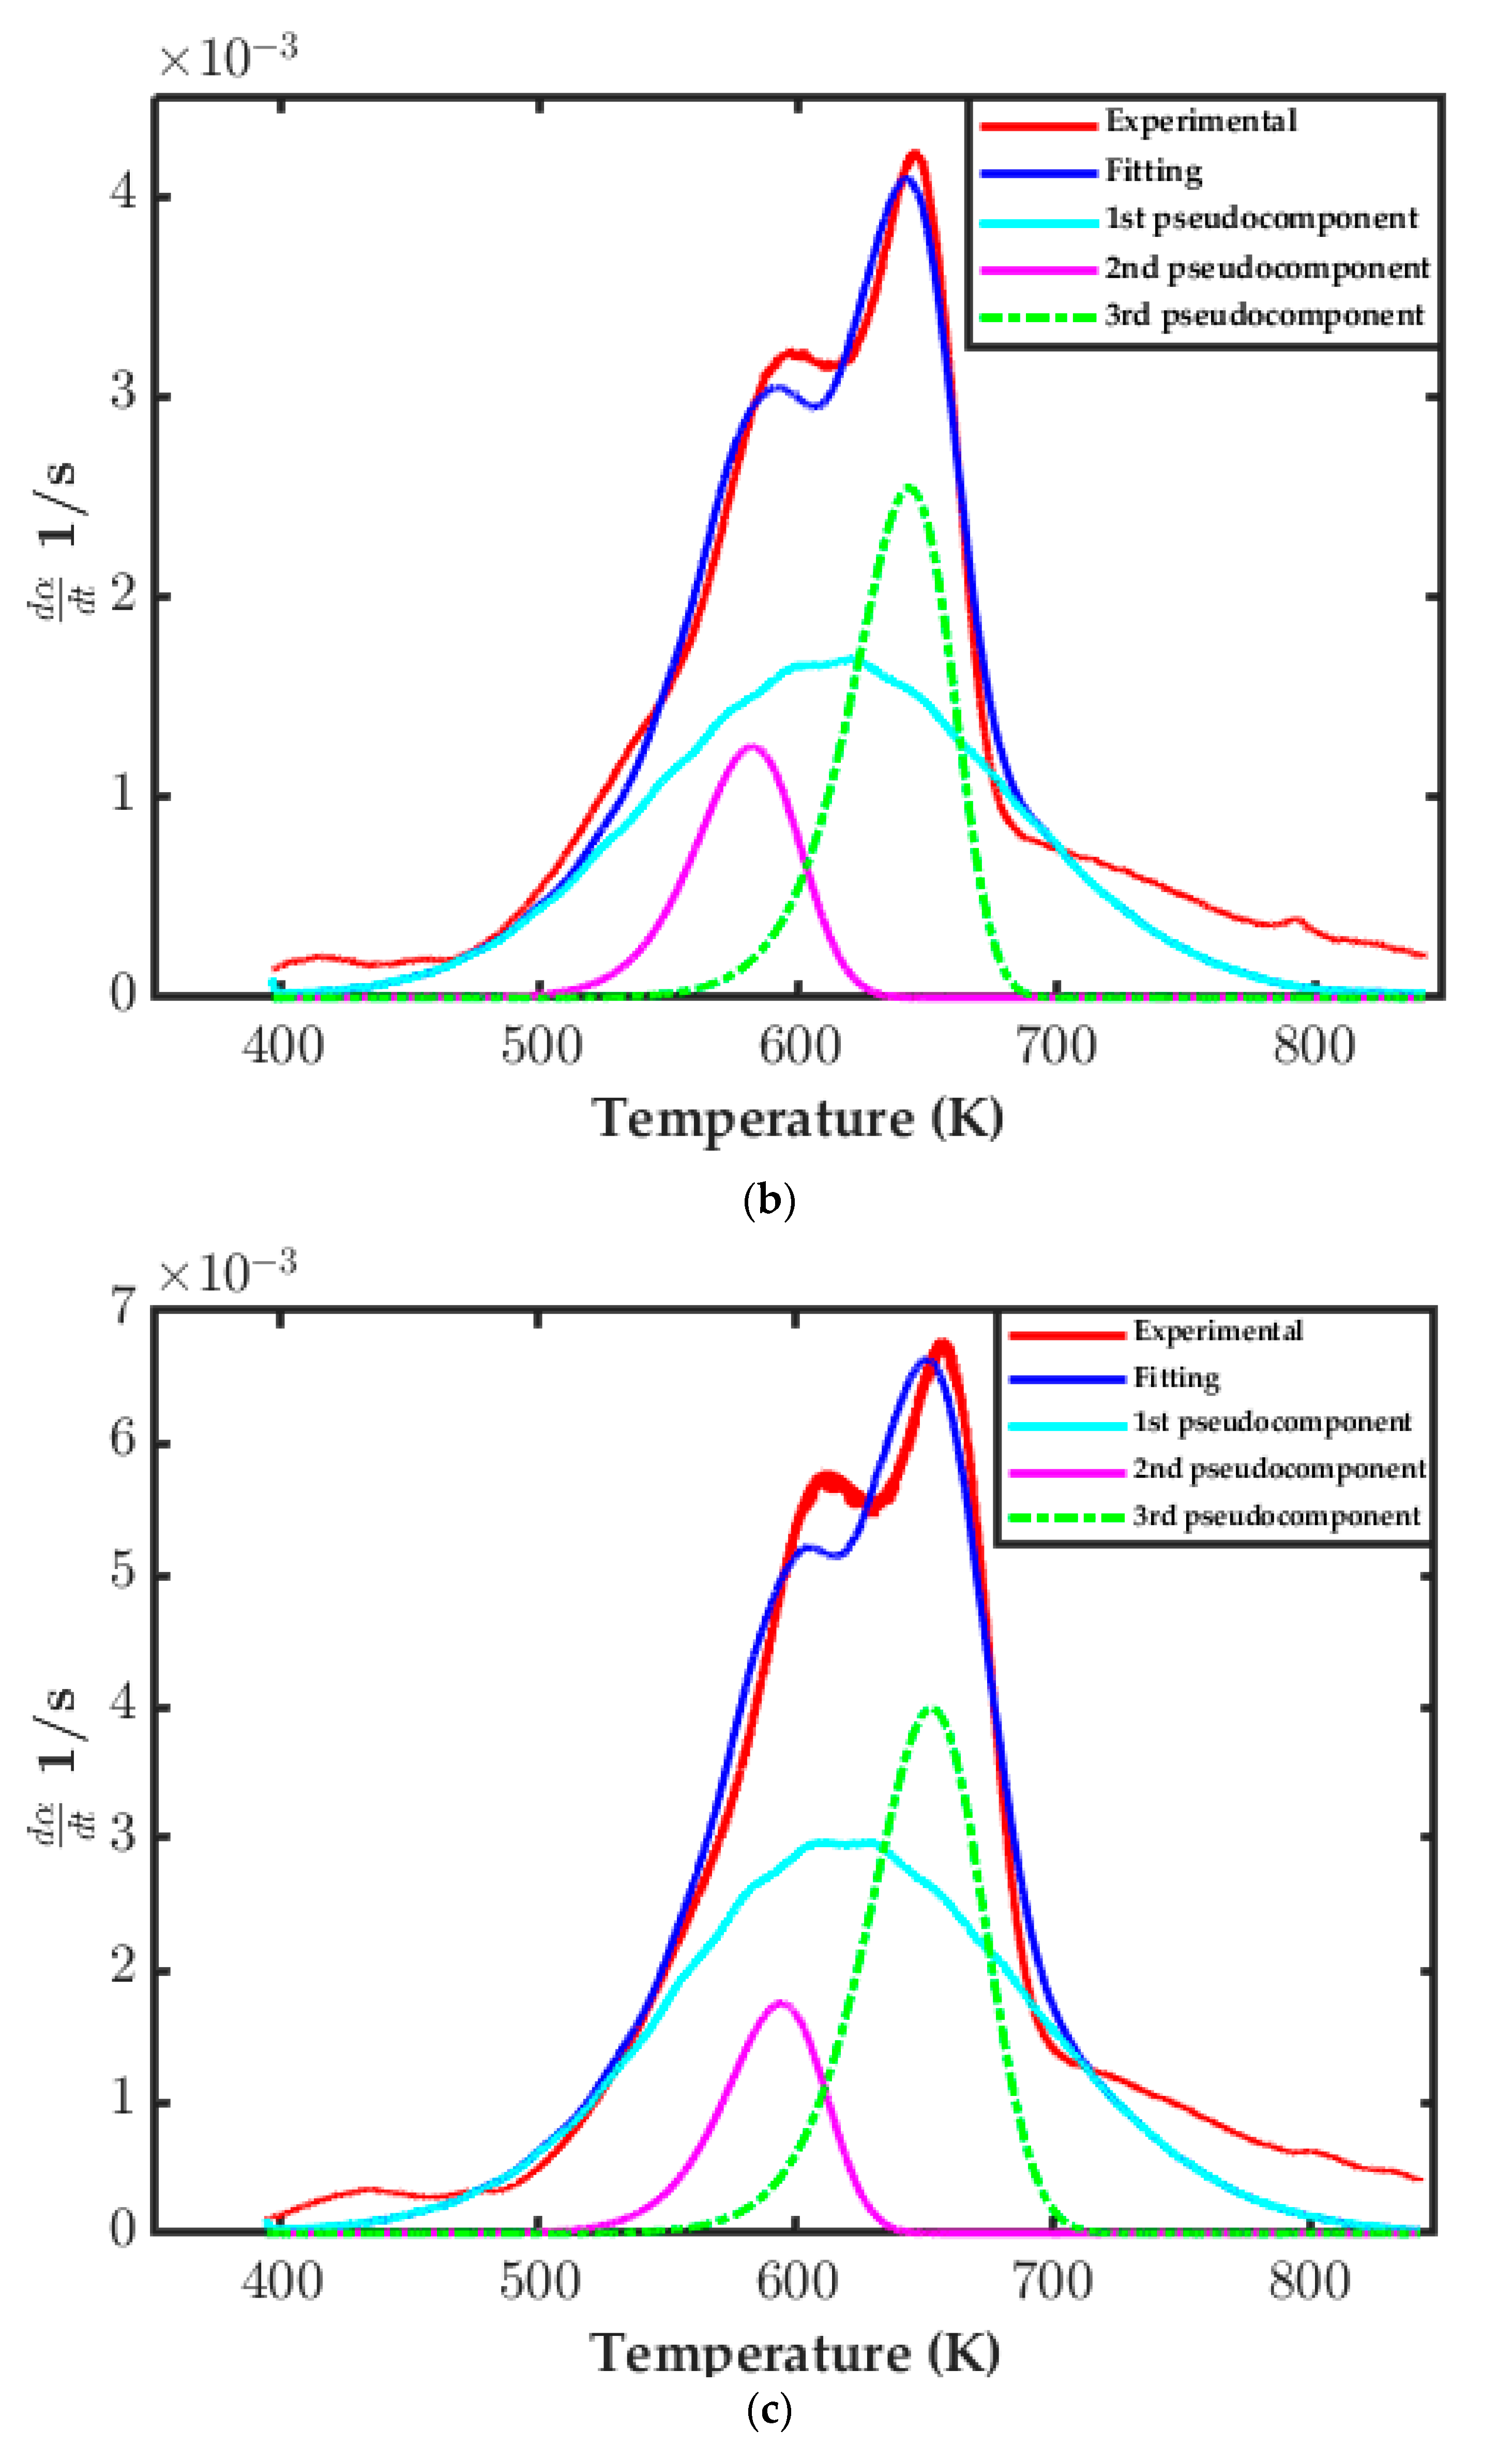
3.3.3. Distributed Activation Energy Model (DAEM) Assessment

This model allowed fitting of the DTG curve through a series of parallel first-order reactions. Figure 4 shows the different fits applied for EFB sample with 1% Zn. The different fits applied for EFB without catalyst, EFB + 2% Zn, and EFB + 3% Zn samples are shown in A supporting material B.
Table 7, Table 8, Table 9 and Table 10 show the values obtained for the activation energy and their standard deviation ( s ) , the proportionality constant ( C ) , and the standard deviation (SE) using the model at constant values of pre-exponential factor.

3.4. FTIR Analysis of Evolved Gases

Two crucial temperatures were considered for the analysis at which the most significant IR spectrums were evidenced. Figure 5 shows the graphs obtained to identify the chemical compounds of EFB samples. The spectrums for EFB + 1% Zn, EFB + 2% Zn, and EFB + 3% Zn samples are shown in supporting material C.

4. Discussion

The data in Table 1 show that the structural analysis of the rachis indicated that its composition was mainly cellulose (47%), followed by lignin (16.25%) and hemicellulose (12%). The ultimate analysis showed that EFB has a high percentage of carbon and oxygen, 42.8% and 50.05%, respectively, which was validated with the FTIR study where the presence of hydroxyl, carbonyl, aliphatic, and alkyl groups were evidenced. Proximate analysis indicated that the biomass studied is rich in volatile matter, making it a suitable fuel for pyrolysis, facilitating the elimination of gas compounds [43].
From Table 2, it was determined that samples at the different heating rates presented a mass loss of approximately 67%, and the carbonized percentages ranged from 31–33%. Significant mass loss of the samples occurred between 200 °C and 400 °C, and moisture removal was evident around 120 °C with a relatively constant mass loss, as shown in Figure 1, Figure 2 and Figure 3.
It was expected that with higher heating rates, the samples would present a higher percentage of char since the pyrolysis reaction occurred in a shorter time [44]. However, this was only observed in the EFB sample without catalyst, where at a heating rate of 50 K/min, the highest percentage of carbonized was obtained (33.72%); for the other EFB samples with catalyst, the highest percentage of char was obtained at 30 K/min and 10 K/min.
The DTG curves of the different samples (Figure 1, Figure 2 and Figure 3) showed three noticeable zones related to the mass loss rate. The first stage, between 30 and 200 °C, was due to the release of water by evaporation and dehydration. A second peak found between 250 and 320 °C could be ascribed to hemicellulose pyrolysis, which occurs between 220 and 315 °C [45].
A third phase occurred between 300 and 400 °C which was attributed to the cellulose pyrolysis whose maximum mass loss occurred at around 350 °C. The lignin pyrolysis covered almost the entire temperature range and presented a low mass loss at approximately 350 °C. Hence, it was deduced that the maximum loss rate for the samples was mainly due to the cellulose and lignin pyrolysis, the main composition of the biomass [46].
It can be observed in Figure 1 that the sample with 3% Zn presented more noticeable peaks in stages 1 and 2. Likewise, the EFB sample without catalyst had a weak second peak. The prominent reaction peak for the 0% and 3% catalyst samples occurred at around 325 °C, and for the samples with 1% and 2%, at 350 °C. The results of Figure 2 indicate that in the reactions at 30 K/min, the EFB sample without catalyst had the first stage of mass loss with a more pronounced peak as opposed to its second stage with an almost non-existent peak in the hemicellulose pyrolysis as described by Salem et al. [47]. For curves at 10 K/min, it could be observed that the third stage corresponds to cellulose and lignin pyrolysis and occurs at temperatures lower than 350 °C for the samples with 0% and 3% Zn [48]. For EFB samples with 1% and 2% Zn, the cellulose and lignin pyrolysis occur at around 375 °C.
Finally, Figure 3 indicates that the first and second stages present very subtle peaks for all the samples, where the most notable peaks correspond to the EFB samples mixed with 1% and 2% of catalyst. As observed in Figure 4, the third stage appeared first with temperatures around 350 °C for the samples with 0% and 3% of Zn.
In general, it was analyzed that the variation in the heating rates influenced the first stages of the reaction since the peaks became more prominent at a lower heating rate. Thus, as the heating rate was increased, the peaks in the first and second stages tended to markedly decrease [49]. The reaction of the third stage corresponding to the cellulose pyrolysis was delayed for higher heating rates (30 K/min and 50 K/min) [50], occurring at temperatures greater than 350 °C, while for 10 K/min, the third stage occurred from 325 °C.
Table 4 shows the kinetic parameters obtained for the n-reaction order model, where R2 values close to 1 were observed for some heating rates. However, the reaction orders do not have a logical physicochemical meaning since data between 0.08 and 0.1 for pyrolysis reactions have not been reported. It was also observed that the activation energy values were in the magnitude of 107; these values are considered very high and far from the expected values, which may be a consequence of the model only considering one stage, while pyrolysis occurs in several stages. Therefore, the model was not considered appropriate to simulate the EFB pyrolysis behavior.
Table 5 shows that the activation energy at the different conversions did not maintain a constant range, i.e., the pyrolysis process occurred in several stages. Thus, Table 6 shows the activation energy averages in the central conversions between 0.3 and 0.8, considered the most representative of the reaction. The average values in Table 6 are far from those reported by Albis et al. [51] and Li et al. [28] who reported activation energy higher than 300 KJ/mol by using zinc sulfate as a catalyst.
It is worth mentioning that it was not possible to fit the model to the experimental data using one and two pseudo components. Hence, as shown in Figure 4, three pseudo components were used to model all the experimental runs carried out at the different heating rates and catalyst percentages. Considering the kinetic parameters shown in Table 7, Table 8, Table 9 and Table 10, it was observed that the kinetic constant (c) presents similar results in all cases, that is, within the same range, in each run performed.
For catalyst percentage of 1%, the highest values of activation energy were obtained at a heating rate of 50 K/min, for 2% of Zn at 30 K /min, and with a 3% catalyst, the highest values of Ea were obtained at 10 K/min. Therefore, increasing the catalyst percentage increases the maximum Ea value without augmenting the heat rate [52].
The activation energy results for the first pseudo reaction were similar between the samples with and without catalyst, obtaining values between 179,000 kJ/mol and 181,000 kJ/mol for samples of 0%, 1%, and 3% Zn. The EFB sample with 2% Zn showed a higher result than the previous one, ranging between 181,500 kJ/mol and 184,000 kJ/mol. In the second pseudo reaction, there was little difference between the analyzed reactions, obtaining the same range of values between 165,200 kJ/mol and 165,600 kJ/mol in the activation energy. In the third pseudo reaction, the energy activation values varied between 176,900 kJ/mol and 177,100 kJ/mol for all samples.
The species considerably decreased in the EFB pyrolysis without a catalyst as the temperature increased from approximately 300 °C to 600 °C. CO2 was the main product, reaching maximum peaks in a temperature range of 350 °C to 380 °C and began to decay at 500 °C, as shown in Figure 5. This behavior was related to breaking the C-O bond, and it is also possible to identify the CH3COOH appearance at temperatures between 300 °C and 380 °C and the NH3 presence with low peaks in some samples [53].
The FTIR spectra of the samples with catalyst subjected to pyrolysis (Figures S6–S8 in supporting material) showed different behaviors for the evolution of the product concerning temperature. The species decreased with increasing temperature for the EFB samples with 1% Zn, obtaining maximum CO2 peaks between 290 °C and 330 °C. However, the H2O evolution increased with temperature for pyrolysis at 10 K/min [54]. The species evolution in the pyrolysis with 2% Zn did not present a considerable variation between 300 °C and 500 °C for the heating rates of 10 K/min and 30 K/min. Nevertheless, it is observed that the samples subjected to heating of 50 K/min did begin to decrease slightly from 400 °C. This is evidenced mainly in secondary species such as CH3COOH which reduced its peak by more than half, and NH3 which no longer had a visible spectrum at that temperature.
The sample mixed with 3% Zn showed a significant decrease in the products with increasing temperature between 400 °C and 600 °C, where the maximum CO2 peaks occurred between 250 °C and 360 °C, while species such as CO and CH4 augmented considerably in the same temperature range when using 10 K/min and 50 K/min. The release of CO was probably due to the decarbonylation reaction of the alkyl with carbonyl groups (-CHO) and the increase in its emissions at high temperatures as a result of secondary reactions, while the cleavage of methoxide possibly caused the emission of the CH4 (-OCH3-) and methylene (-CH2-) groups [55].

5. Conclusions

The growth in the demand for energy, fuels, and chemical products is crucial in developing biorefineries. Thus, analyzing the possibility of diversifying the use of by-products from the oil palm industry through catalytic pyrolysis is essential. The catalyst could contribute to absorbing the oxygenated compounds present in bio-oil which can then be used as a by-product in biorefineries and thus promote actions to reduce dependence on fossil fuels and, consequently, CO2 emissions.
Based on the results of the evaluation conducted in the energy analysis fields, there is evidence for the possible implementation of these alternatives for the use of biomass in the contexts of agro-industrial economies which require the inclusion of residual biomass from oil palm, specifically from EFB as a complement to improve yields.
This work focuses on analyzing the effect of zinc sulfate on EFB pyrolysis. For this purpose, a thermo-gravimetric analyzer coupled with a Fourier transform infrared spectroscopy (TG-FTIR) was used to assess the kinetic parameters (activation energy, pre-exponential factor, and reaction order) and activation energy distribution considering three kinetic models. The experiments were carried out using catalyst percentages ranging from 0 wt% to 3 wt% and different heating rates (10, 30, and 50 K/min).
The results showed that the crucial pyrolysis temperature was found at around 350 °C where the main mass loss was associated with cellulose and lignin pyrolysis. The sample that presented the highest mass loss was the EFB mixed with 1% Zn at 10 K/min (68.99%), while the mixture of EFB/3% Zn at 10 K/min presented the lowest mass loss (63.58%) but the highest percentage of char (36.42%). On the other hand, three significant peaks were evidenced in the TG curves, the first associated with eliminating moisture and the second with hemicellulose pyrolysis. However, it became less noticeable for the reactions with heating rates of 30 K/min and 50 K/min. The third peak corresponded to cellulose and lignin pyrolysis.
Using the DAEM model, it was possible to model all the experiments with favorable results, thus adjusting the curve DTG through a series of first-order parallel reactions. For this case, the best fit occurred when using three pseudo components, i.e., three independent reactions in parallel. It is opportune to mention that using zinc sulfate as a catalyst in EFB pyrolysis did not contribute to accelerating the reaction or decreasing the activation energy. On the contrary, this parameter increased for pseudo reaction 1 in the samples of 2% Zn and remained in the same value range in pseudo reactions 1 and 3 for the four samples analyzed.
The FTIR of the evolved gases determined that the main gaseous pyrolysis products are CO2, CO, H2O, CH4, NH3, and CH3COOH. CO2 was the main product, reaching the highest peaks at temperatures close to 300 and 400 °C. In comparison, secondary products, such as CH3COOH and NH3, presented low peaks and were only noticeable in some samples at specific temperatures (close to 400 °C).

Supplementary Materials

The following supporting information can be downloaded at: https://www.mdpi.com/article/10.3390/pr10091748/s1, Figure S1. N-Reaction Order model fitting for EFB. Figure S2. Pre-Exponential Factor model fitting for EFB. Figure S3. DAEM model fitting for: (a) EFB at 10 K/min; (b) EFB at 30 K/min; (c) EFB at 50 K/min. Figure S4. DAEM model fitting for: (a) EFB + 2% Zn at 10 K/min; (b) EFB + 2% Zn at 30 K/min; (c) EFB + 2% Zn at 50 K/min. Figure S5. DAEM model fitting for: (a) EFB + 3% Zn at 10 K/min; (b) EFB + 3% Zn at 30 K/min; (c) EFB + 3% Zn at 50 K/min. Figure S6. FTIR spectrum of EFB + 1% Zn sample: (a) 10 K/min at 95 °C, (b) 10 K/min at 693 °C, (c) 30 K/min at 303 °C, (d) 30 K/min at 600 °C, (e) 50 K/min at 326 °C, (f) 50 K/min at 599 °C. Figure S7. FTIR spectrum of EFB + 2% Zn sample: (a) 10 K/min at 326 °C, (b) 10 K/min at 475° C, (c) 30 K/min at 331 °C, (d) 30 K/min at 545 °C, (e) 50 K/min at 277 °C, (f) 50 K/min at 414 °C. Figure S8. FTIR spectrum of EFB + 3% Zn sample: (a) 10 K/min at 267 °C, (b) 10 K/min at 493 °C, (c) 30 K/min at 359 °C, (d) 30 K/min at 600 °C, (e) 50 K/min at 296 °C, (f) 50 K/min at 436 °C.

Author Contributions

Conceptualization, M.A.S.U. and Y.C.S.; methodology, M.A.S.U. and K.P.A.S.; software, J.B.R. and A.R.A.A.; validation, M.A.S.U., Y.C.S. and K.P.A.S.; formal analysis, M.A.S.U. and K.P.A.S.; investigation, Y.C.S.; resources, A.R.A.A.; data curation, J.B.R.; writing—original draft preparation, M.A.S.U. and Y.C.S.; writing—review and editing, J.B.R. and A.R.A.A.; visualization, J.B.R.; supervision, A.R.A.A. and Y.C.S.; project administration, J.B.R.; funding acquisition, A.R.A.A. All authors have read and agreed to the published version of the manuscript.

Funding

The authors wish to express gratitude for the financial support from Universidad del Atlántico (Grant ING10-FGI2016) and from the National Petroleum, Natural Gas and Biofuels Agency (PRH-ANP 51.1) Grant FEC 4261.

Institutional Review Board Statement

Not applicable.

Informed Consent Statement

Not applicable.

Data Availability Statement

Not applicable.

Conflicts of Interest

The authors declare no conflict of interest.

Nomenclature

CPOCrude palm oil
POMPalm oil mill
EFBEmpty fruit bunches
FFBFresh fruit bunches
TGAThermogravimetric analysis
FTIRFourier transform infrared spectrometry
DAEM Distributed activation energy model
ZSM-5Zeolita socony mobil-5
AHsAromatic hydrocarbons
HVHeating value
dTGThe first derivative of the TGA curve respect to time
EaActivation energy
APre-exponential factor
NReaction order
R2Determination coefficient
IRInfrared spectra

References

  1. Pareek, A.; Dom, R.; Gupta, J.; Chandran, J.; Adepu, V.; Borse, P.H. Insights into renewable hydrogen energy: Recent advances and prospects. Mater. Sci. Energy Technol. 2020, 3, 319–327. [Google Scholar] [CrossRef]
  2. Loh, S.K. The potential of the Malaysian oil palm biomass as a renewable energy source. Energy Convers. Manag. 2017, 141, 285–298. [Google Scholar] [CrossRef]
  3. Hoe, B.C.; Chan, E.S.; Ramanan, R.N.; Ooi, C.W. Direct recovery of palm carotene by liquid-liquid extraction. J. Food Eng. 2022, 313, 110755. [Google Scholar] [CrossRef]
  4. Ramirez-Contreras, N.E.; Munar-Florez, D.A.; Garcia-Nuñez, J.A.; Mosquera-Montoya, M.; Faaij, A.P.C. The GHG emissions and economic performance of the Colombian palm oil sector; current status and long-term perspectives. J. Clean. Prod. 2020, 258, 120757. [Google Scholar] [CrossRef]
  5. González-Delgado, A.D.; Barajas-Solano, A.F.; Leon-Pulido, J. Evaluating the Sustainability and Inherent Safety of a Crude Palm Oil Production Process in North-Colombia. Appl. Sci. 2021, 11, 1046. [Google Scholar] [CrossRef]
  6. Fedepalma. The Oil Palm Agribusiness in Colombia; Icolgraf: Bogotá, Colombia, 2019. [Google Scholar]
  7. Khatun, R.; Reza, M.I.H.; Moniruzzaman, M.; Yaakob, Z. Sustainable oil palm industry: The possibilities. Renew. Sustain. Energy Rev. 2017, 76, 608–619. [Google Scholar] [CrossRef]
  8. Furumo, P.R.; Aide, T.M. Characterizing commercial oil palm expansion in Latin America: Land use change and trade. Environ. Res. Lett. 2017, 12, 24008. [Google Scholar] [CrossRef]
  9. Castiblanco, C.; Etter, A.; Aide, T.M. Oil palm plantations in Colombia: A model of future expansion. Environ. Sci. Policy 2013, 27, 172–183. [Google Scholar] [CrossRef]
  10. Castanheira, É.G.; Acevedo, H.; Freire, F. Greenhouse gas intensity of palm oil produced in Colombia addressing alternative land use change and fertilization scenarios. Appl. Energy 2014, 114, 958–967. [Google Scholar] [CrossRef]
  11. Batlle, E.A.O.; Santiago, Y.C.; Venturini, O.J.; Palacio, J.C.E.; Lora, E.E.S.; Maya, D.M.Y.; Arrieta, A.R.A. Thermodynamic and environmental assessment of different scenarios for the insertion of pyrolysis technology in palm oil biorefineries. J. Clean. Prod. 2020, 250, 119544. [Google Scholar] [CrossRef]
  12. Yan, M.; Hantoko, D.; Susanto, H.; Ardy, A.; Waluyo, J.; Weng, Z.; Lin, J. Hydrothermal treatment of empty fruit bunch and its pyrolysis characteristics. Biomass Convers. Biorefinery 2019, 9, 709–717. [Google Scholar] [CrossRef]
  13. Garcia-Nunez, J.A.; Ramirez-Contreras, N.E.; Rodriguez, D.T.; Silva-Lora, E.; Frear, C.S.; Stockle, C.; Garcia-Perez, M. Evolution of palm oil mills into bio-refineries: Literature review on current and potential uses of residual biomass and effluents. Resour. Conserv. Recycl. 2016, 110, 99–114. [Google Scholar] [CrossRef]
  14. Marques, T.E.; Santiago, Y.C.; Renó, M.L.; Maya, D.M.Y.; Sphaier, L.A.; Shi, Y.; Ratner, A. Environmental and Energetic Evaluation of Refuse-Derived Fuel Gasification for Electricity Generation. Processes 2021, 9, 2255. [Google Scholar] [CrossRef]
  15. Santiago, Y.C.; González, A.M.; Venturini, O.J.; Sphaier, L.A.; Batlle, E.A.O. Energetic and environmental assessment of oil sludge use in a gasifier/gas microturbine system. Energy 2022, 244, 123103. [Google Scholar] [CrossRef]
  16. Branca, C.; Di Blasi, C. Thermal Devolatilization Kinetics of Dry Distiller’s Grains with Solubles (DDGS). Processes 2021, 9, 1907. [Google Scholar] [CrossRef]
  17. Kalargaris, I.; Tian, G.; Gu, S. Combustion, performance and emission analysis of a DI diesel engine using plastic pyrolysis oil. Fuel Process. Technol. 2017, 157, 108–115. [Google Scholar] [CrossRef]
  18. Al Arni, S. Comparison of slow and fast pyrolysis for converting biomass into fuel. Renew. Energy 2018, 124, 197–201. [Google Scholar] [CrossRef]
  19. Altantzis, A.-I.; Kallistridis, N.-C.; Stavropoulos, G.; Zabaniotou, A. Apparent Pyrolysis Kinetics and Index-Based Assessment of Pretreated Peach Seeds. Processes 2021, 9, 905. [Google Scholar] [CrossRef]
  20. Basu, P. Biomass Gasification, Pyrolysis, and Torrefaction: Practical Design and Theory, 2nd ed.; Basu, P., Ed.; Elsevier Inc.: San Diego, CA, USA, 2013; ISBN 978-0-12-396488-5. [Google Scholar]
  21. Fateh, T.; Richard, F.; Rogaume, T.; Joseph, P. Experimental and modelling studies on the kinetics and mechanisms of thermal degradation of polymethyl methacrylate in nitrogen and air. J. Anal. Appl. Pyrolysis 2016, 120, 423–433. [Google Scholar] [CrossRef]
  22. Ma, Z.; Chen, D.; Gu, J.; Bao, B.; Zhang, Q. Determination of pyrolysis characteristics and kinetics of palm kernel shell using TGA-FTIR and model-free integral methods. Energy Convers. Manag. 2015, 89, 251–259. [Google Scholar] [CrossRef]
  23. Ordonez-Loza, J.; Chejne, F.; Jameel, A.G.A.; Telalovic, S.; Arrieta, A.A.; Sarathy, S.M. An investigation into the pyrolysis and oxidation of bio-oil from sugarcane bagasse: Kinetics and evolved gases using TGA-FTIR. J. Environ. Chem. Eng. 2021, 9, 106144. [Google Scholar] [CrossRef]
  24. Wang, Y.; Akbarzadeh, A.; Chong, L.; Du, J.; Tahir, N.; Awasthi, M.K. Catalytic pyrolysis of lignocellulosic biomass for bio-oil production: A review. Chemosphere 2022, 297, 134181. [Google Scholar] [CrossRef] [PubMed]
  25. Albis, A.; Ortiz, E.; Piñeres, I.; Osorio, J.; Monsalvo, J. Pirólisis de hemicelulosa catalizada por sulfato de zinc y sulfato férrico. Rev. ION 2018, 31, 37–49. [Google Scholar] [CrossRef]
  26. Chen, W.-H.; Cheng, C.-L.; Lee, K.-T.; Lam, S.S.; Ong, H.C.; Ok, Y.S.; Saeidi, S.; Sharma, A.K.; Hsieh, T.-H. Catalytic level identification of ZSM-5 on biomass pyrolysis and aromatic hydrocarbon formation. Chemosphere 2021, 271, 129510. [Google Scholar] [CrossRef]
  27. Rachel-Tang, D.Y.; Islam, A.; Taufiq-Yap, Y.H. Bio-oil production via catalytic solvolysis of biomass. RSC Adv. 2017, 7, 7820–7830. [Google Scholar] [CrossRef]
  28. Li, C.; Ji, G.; Qu, Y.; Irfan, M.; Zhu, K.; Wang, X.; Li, A. Influencing mechanism of zinc mineral contamination on pyrolysis kinetic and product characteristics of corn biomass. J. Environ. Manage. 2021, 281, 111837. [Google Scholar] [CrossRef]
  29. Mayer, Z.A.; Apfelbacher, A.; Hornung, A. Effect of sample preparation on the thermal degradation of metal-added biomass. J. Anal. Appl. Pyrolysis 2012, 94, 170–176. [Google Scholar] [CrossRef]
  30. Ona, T.; Sonoda, T.; Shibata, M.; Fukazawa, K. Small-scale method to determine the content of wood components from multiple eucalypt samples. Tappi J. 1995, 78, 121–126. [Google Scholar]
  31. ASTM D3172–07a; Standard Practice for Proximate Analysis of Coal and Coke. ASTM International: West Conshohocken, PA, USA, 2007.
  32. Barbosa, K.P.; Chamorro, M.V.; Arrieta, A.A.; Ariza, I.P.; Ortíz, E.V. Evaluation of the effect of silicon on the carbonization process of Colombian semi-anthracites. J. Therm. Anal. Calorim. 2022. [Google Scholar] [CrossRef]
  33. Vyazovkin, S.; Burnham, A.K.; Criado, J.M.; Pérez-Maqueda, L.A.; Popescu, C.; Sbirrazzuoli, N. ICTAC Kinetics Committee recommendations for performing kinetic computations on thermal analysis data. Thermochim. Acta 2011, 520, 1–19. [Google Scholar] [CrossRef]
  34. Hu, G.; Li, J.; Zhang, X.; Li, Y. Investigation of waste biomass co-pyrolysis with petroleum sludge using a response surface methodology. J. Environ. Manage. 2017, 192, 234–242. [Google Scholar] [CrossRef] [PubMed]
  35. Cheng, S.; Zhang, H.; Chang, F.; Zhang, F.; Wang, K.; Qin, Y.; Huang, T. Combustion behavior and thermochemical treatment scheme analysis of oil sludges and oil sludge semicokes. Energy 2019, 167, 575–587. [Google Scholar] [CrossRef]
  36. Chang, G.; Huang, Y.; Xie, J.; Yang, H.; Liu, H.; Yin, X.; Wu, C. The lignin pyrolysis composition and pyrolysis products of palm kernel shell, wheat straw, and pine sawdust. Energy Convers. Manag. 2016, 124, 587–597. [Google Scholar] [CrossRef]
  37. Blaine, R.L.; Kissinger, H.E. Homer Kissinger and the Kissinger equation. Thermochim. Acta 2012, 540, 1–6. [Google Scholar] [CrossRef]
  38. Wang, X.; Huang, Z.; Wei, M.; Lu, T.; Nong, D.; Zhao, J.; Gao, X.; Teng, L. Catalytic effect of nanosized ZnO and TiO2 on thermal degradation of poly(lactic acid) and isoconversional kinetic analysis. Thermochim. Acta 2019, 672, 14–24. [Google Scholar] [CrossRef]
  39. Chen, N.; Ren, J.; Ye, Z.; Xu, Q.; Liu, J.; Sun, S. Kinetics of coffee industrial residue pyrolysis using distributed activation energy model and components separation of bio-oil by sequencing temperature-raising pyrolysis. Bioresour. Technol. 2016, 221, 534–540. [Google Scholar] [CrossRef]
  40. Martín-Lara, M.A.; Blázquez, G.; Zamora, M.C.; Calero, M. Kinetic modelling of torrefaction of olive tree pruning. Appl. Therm. Eng. 2017, 113, 1410–1418. [Google Scholar] [CrossRef]
  41. Albis, A.; Ortiz, E.; Suárez, A.; Piñeres, I. TG/MS study of the thermal devolatization of Copoazú peels (Theobroma grandiflorum). J. Therm. Anal. Calorim. 2014, 115, 275–283. [Google Scholar] [CrossRef]
  42. Yu, C.; Ren, S.; Wang, G.; Xu, J.; Teng, H.; Li, T.; Huang, C.; Wang, C. Kinetic analysis and modeling of maize straw hydrochar combustion using a multi-Gaussian-distributed activation energy model. Int. J. Miner. Metall. Mater. 2022, 29, 464–472. [Google Scholar] [CrossRef]
  43. Mishra, R.K.; Mohanty, K. Characterization of non-edible lignocellulosic biomass in terms of their candidacy towards alternative renewable fuels. Biomass Convers. Biorefinery 2018, 8, 799–812. [Google Scholar] [CrossRef]
  44. Yu, J.; Paterson, N.; Blamey, J.; Millan, M. Cellulose, xylan and lignin interactions during pyrolysis of lignocellulosic biomass. Fuel 2017, 191, 140–149. [Google Scholar] [CrossRef]
  45. Meng, A.; Zhou, H.; Qin, L.; Zhang, Y.; Li, Q. Quantitative and kinetic TG-FTIR investigation on three kinds of biomass pyrolysis. J. Anal. Appl. Pyrolysis 2013, 104, 28–37. [Google Scholar] [CrossRef]
  46. Chen, W.-H.; Eng, C.F.; Lin, Y.-Y.; Bach, Q.-V. Independent parallel pyrolysis kinetics of cellulose, hemicelluloses and lignin at various heating rates analyzed by evolutionary computation. Energy Convers. Manag. 2020, 221, 113165. [Google Scholar] [CrossRef]
  47. Salem, I.B.; Saleh, M.B.; Iqbal, J.; El Gamal, M.; Hameed, S. Date palm waste pyrolysis into biochar for carbon dioxide adsorption. Energy Rep. 2021, 7, 152–159. [Google Scholar] [CrossRef]
  48. Yeo, J.Y.; Chin, B.L.F.; Tan, J.K.; Loh, Y.S. Comparative studies on the pyrolysis of cellulose, hemicellulose, and lignin based on combined kinetics. J. Energy Inst. 2019, 92, 27–37. [Google Scholar] [CrossRef]
  49. Xing, D.; Li, J. Effects of Heat Treatment on Thermal Decomposition and Combustion Performance of Larix spp. Wood. BioResources 2014, 9, 4274–4287. [Google Scholar] [CrossRef]
  50. Yu, S.; Yang, X.; Zhou, H.; Tan, Z.; Cong, K.; Zhang, Y.; Li, Q. Thermal and Kinetic Behaviors during Co-Pyrolysis of Microcrystalline Cellulose and Styrene–Butadiene–Styrene Triblock Copolymer. Processes 2021, 9, 1335. [Google Scholar] [CrossRef]
  51. Arrieta, A.A.; Muñoz, E.O.; García, V.B.; Cantillo, A.G.; Chamorro, M.V.; Ochoa, G.V. Catalytic effect of CaCl2 and ZnSO4 on the pyrolysis of cedar sawdust. Chem. Eng. Trans. 2018, 65, 673–678. [Google Scholar] [CrossRef]
  52. Sonobe, T.; Worasuwannarak, N. Kinetic analyses of biomass pyrolysis using the distributed activation energy model. Fuel 2008, 87, 414–421. [Google Scholar] [CrossRef]
  53. Gao, N.; Li, A.; Quan, C.; Du, L.; Duan, Y. TG–FTIR and Py–GC/MS analysis on pyrolysis and combustion of pine sawdust. J. Anal. Appl. Pyrolysis 2013, 100, 26–32. [Google Scholar] [CrossRef]
  54. Sheng, J.; Ji, D.; Yu, F.; Cui, L.; Zeng, Q.; Ai, N.; Ji, J. Influence of Chemical Treatment on Rice Straw Pyrolysis by TG-FTIR. IERI Procedia 2014, 8, 30–34. [Google Scholar] [CrossRef] [Green Version]
  55. Shen, D.K.; Gu, S.; Luo, K.H.; Wang, S.R.; Fang, M.X. The pyrolytic degradation of wood-derived lignin from pulping process. Bioresour. Technol. 2010, 101, 6136–6146. [Google Scholar] [CrossRef] [PubMed]
Figure 1. EFB at 10 K/min heating rate: (a) Mass loss curve for samples with 0%, 1%, 2%, and 3% catalyst. (b) DTG curves for samples with 0%, 1%, 2%, and 3% catalyst.
Processes 10 01748 g001
Figure 2. EFB at 30 K/min heating rate: (a) Mass loss curve for samples with 0%, 1%, 2%, and 3% catalyst. (b) DTG curves for samples with 0%, 1%, 2%, and 3% catalyst.
Processes 10 01748 g002
Figure 3. EFB at 50 K/min heating rate: (a) Mass loss curve for samples with 0%, 1%, 2%, and 3% catalyst. (b) DTG curves for samples with 0%, 1%, 2%, and 3% catalyst.
Processes 10 01748 g003
Figure 4. DAEM model fitting for: (a) EFB + 1% Zn at 10 K/min; (b) EFB + 1% Zn at 30 K/min; (c) EFB + 1% Zn at 50 K/min.
Processes 10 01748 g004aProcesses 10 01748 g004b
Figure 5. FTIR spectrum of EFB sample: (a) 10 K/min, (b) 30 K/min, and (c) 50 K/min.
Processes 10 01748 g005aProcesses 10 01748 g005b
Table 1. Structural, ultimate, and proximate analysis of EFB.
Structural Analysis, Dry Basis (wt.%)
Extractives20.0
Lignin17.1
Cellulose50.2
Hemicellulose12.8
Ultimate analysis, dry basis (wt.%)
Carbon42.9
Sulfur0.2
Nitrogen0.8
Hydrogen6.0
Oxygen 150.1
Proximate analysis, dry basis (wt.%)
Moisture content8.0
Ash17.6
Volatiles65.6
Fixed carbon16.8
Higher heating value (kJ/kg)17953.5
1 By difference.
Table 2. Percentage of carbonization and mass loss for different heating rates.
Heating Rates EFBEFB + 1% ZnEFB + 2% ZnEFB + 3% Zn
10 K/minMax. temperature (°C)750.3750.4750.3750.3
% mass loss67.969.068.963.6
% Char/carbonized32.131.031.136.4
30 K/minMax temperature (°C)799.8749.5749.5749.6
% mass loss68.265.268.567.2
% Char/carbonized31.834.831.532.8
50 K/minMax. temperature (°C)746.6746.6746.7746.7
% mass loss66.366.768.866.9
% Char/carbonized33.733.331.233.1
Table 3. EFB samples temperature at 50% conversion.
Heating RatesEFB
Temperature
(°C)
EFB + 1% Zn
Temperature
(°C)
EFB + 2% Zn
Temperature
(°C)
EFB + 3% Zn
Temperature
(°C)
10 K/min311.7309.3313.8313.6
30 K/min328.4350.7339.6342.6
50 K/min350.3358.7347.8353.0
Table 4. Kinetic results n-reaction order model.
% CatalystHeating Rate (K/min)Ea
(J/mol)
A
( s 1 )
NR2
0102.37 × 107298.120.100.88
0302.38 × 107734.800.080.86
0502.65 × 1071665.900.070.85
1102.51 × 107363.830.100.87
1302.80 × 1071347.350.090.84
1502.85 × 1072133.510.110.84
2102.55 × 107381.530.100.88
2302.69 × 1071136.150.090.87
2502.81 × 1072008.060.080.85
3101.79 × 107117.950.050.78
3302.64 × 1071082.680.090.85
3502.71 × 1071760.980.080.85
Table 5. Kinetic results pre-exponential factor model.
ConversionEFBEFB + 1% ZnEFB + 2% ZnEFB + 3% Zn
Ea
(J/mol)
R2Ea
(J/mol)
R2Ea
(J/mol)
R2Ea
(J/mol)
R2
0.17.74 × 1040.987.57 × 1041.08.52 × 1051.008.49 × 1040.99
0.21.03 × 1050.981.05 × 1050.991.10 × 1050.991.12 × 1050.99
0.31.17 × 1050.971.17 × 1050.991.24 × 1050.991.23 × 1050.99
0.41.30 × 1050.971.29 × 1050.991.37 × 1050.991.37 × 1050.99
0.51.41 × 1050.981.40 × 1050.991.48 × 1050.991.50 × 1050.99
0.61.45 × 1050.981.46 × 1050.991.51 × 1050.991.56 × 1050.99
0.71.48 × 1050.991.46 × 1050.991.49 × 1050.991.59 × 1050.99
0.81.82 × 1050.991.61 × 1050.991.66 × 1050.991.89 × 1050.99
0.92.30 × 1050.992.08 × 1050.992.10 × 1050.982.54 × 1050.99
1.09.36 × 1040.402.40 × 1050.852.02 × 1050.862.12 × 1050.86
Table 6. Average kinetic energy (Ea) and standard deviation between central conversions (0.3 to 0.8).
SamplesAverage Ea (J/mol)Standard Deviation
EFB1.44 × 10321,885
EFB + 1% Zn1.40 × 10315,250
EFB + 2% Zn1.46 × 10314,162
EFB + 3% Zn1.52 × 10322,376
Table 7. Kinetics results DAEM model for the EFB sample.
ParametersHeating Rate (K/min)
103050
C10.480.470.49
A1 (s−1)2.01 × 10132.01 × 10132.01 × 1013
Ea1 (Kj/mol)1.79 × 1051.79 × 1051.81 × 105
s12.98 × 1021.92 × 1031.75 × 103
C20.280.260.23
A2 (s−1)2.09 × 10132.09 × 10132.09 × 1013
Ea2 (Kj/mol)1.65 × 1051.65 × 1051.66 × 105
s25.01 × 1034.80 × 1034.28 × 103
C30.941.081.11
A3 (s−1)2.09 × 10132.09 × 10132.09 × 1013
Ea3 (Kj/mol)1.77 × 1051.77 × 1051.77 × 105
s33.97 × 1043.97 × 1043.97 × 104
SE3.36 × 10−151.77 × 10−158.38 × 10⁻¹⁶
Table 8. Kinetics results DAEM model for the EFB + 1% Zn sample.
ParametersHeating Rate (K/min)
103050
C10.470.460.43
A1 (s−1)2.01 × 10132.01 × 10132.01 × 1013
Ea1 (Kj/mol)1.82 × 1051.82 × 1051.83 × 105
s17.12 × 1023.20 × 1032.37 × 103
C20.240.210.14
A2 (s−1)2.09 × 10132.09 × 10132.09 × 1013
Ea2 (Kj/mol)1.65 × 1051.65 × 1051.66 × 105
s25.07 × 1035.41 × 1034.96 × 103
C31.091.141.34
A3 (s−1)2.09 × 10132.09 × 10132.09 × 1013
Ea3 (Kj/mol)1.77 × 1051.77 × 1051.77 × 105
s33.97 × 1043.97 × 1043.97 × 104
SE1.12 × 10−168.92 × 10−165.61 × 10⁻¹⁵
Table 9. Kinetics results DAEM model for the EFB + 2% Zn sample.
ParametersHeating Rate (K/min)
103050
C10.500.490.42
A1 (s−1)2.01 × 10132.01 × 10132.01 × 1013
Ea1 (Kj/mol)1.82 × 1051.83 × 1051.84 × 105
s16.69 × 1027.75 × 1031.54 × 104
C20.190.240.17
A2 (s−1)2.09 × 10132.09 × 10132.09 × 1013
Ea2 (Kj/mol)1.65 × 1051.65 × 1051.66 × 105
s25.17 × 1035.39 × 1041.12 × 104
C31.061.101.32
A3 (s−1)2.09 × 10132.09 × 10132.09 × 1013
Ea3 (Kj/mol)1.77 × 1051.77 × 1051.77 × 105
s33.97 × 1043.97 × 1043.96 × 104
SE4.94 × 10−167.08 × 10−169.11 × 10⁻¹⁵
Table 10. Kinetics results DAEM model for the EFB + 3% Zn sample.
ParametersHeating Rate (K/min)
103050
C10.370.360.35
A1 (s−1)2.01 × 10132.01 × 10132.01 × 1013
Ea1 (Kj/mol)1.81 × 1051.81 × 1051.81 × 105
s17.69 × 10370,581.63 × 102
C20.270.280.20
A2 (s−1)2.09 × 10132.09 × 10132.09 × 1013
Ea2 (Kj/mol)1.65 × 1051.65 × 1051.66 × 105
s25.09 × 1046.86 × 1038.72 × 103
C31.101.171.36
A3 (s−1)2.09 × 10132.09 × 10132.09 × 1013
Ea3 (Kj/mol)1.77 × 1051.77 × 1051.77 × 105
s33.97 × 1043.97 × 1043.97 × 104
SE2.26 × 10−165.46 × 10−162.54 × 10⁻¹⁵
Publisher’s Note: MDPI stays neutral with regard to jurisdictional claims in published maps and institutional affiliations.

