Abstract
To improve the seeding qualification rate and stability of the air-suction vibrating disc type seed meter on the rice seedling raising line, in this paper, an improved wireless sensor network node layout optimization algorithm was proposed, and the operation monitoring system of the seed meter was designed using the Internet of Things and configuration software. In the system, the upper computer software adopted the Kingview software, the lower computer took the STM32F429IGT and CC2530 as the core controllers, and ZigBee was selected for data transmission to build the wireless sensor network. The acquisition of field status information and the sending of control instructions were realized through the sensor nodes constructed by the CC2530 core controller. The data was sent to the coordinator node in real-time through the wireless sensor network. The coordinator node realized the bidirectional transmission of data with Kingview and the upper computer control instructions forwarding using the ASCII protocol The host computer monitoring and management software was developed based on configuration software to realize real-time data monitoring, access database storage, fault alarm, control command sending and other functions. The experimental results showed that the detection accuracy of the system for the seeding amount and missed seeding amount was 94.3% and 95.6%, respectively, which could realize the monitoring of the primary working status of the seed meter. The system realized effective data transmission and data remote wireless transmission function, which provided sufficient theoretical and data support for the performance optimization of the seed meter, and laid a good foundation for the visualization and intelligence of information data.
1. Introduction
The accumulative rice planting area in China is about 30 million hectares, accounting for about 30% of the country’s total grain planting area and about 20% of the world’s rice planting area [1]. Whether rice can achieve a high yield will involve the overall livelihood of the people [2]. Super rice has been the first choice of Grain Growers because of its high yield [3]. With the continuous promotion of mechanized and intelligent rice planting, super rice factory seedling raising has become one of the main ways of mechanized rice planting [4]. In the process of seedling raising and transplanting, due to the requirement of 1–2 plants/hole seedling formation rate of super rice [5], the current mechanical seed metering device was challenging to meet the needs of seeding accuracy [6], which was easy to damage the rice buds [7]. Through the periodic vibration of the seed tray [8], the air suction vibrating disk seed metering device made the seed rice sprouts in a controllable “boiling” state and uniformly distributed in the seed tray space [9]. The seed suction tray relies on the negative pressure provided by the fan to generate suction [10] for the moving rice buds to realize the efficient and reliable seed metering of the seed metering device [11].
At present, various universities and scientific research institutes have carried out a series of studies on the performance monitoring of seeders [12], which has laid a good foundation for the monitoring of the working state of the seed meter and the improvement of its performance [13]. Hao et al. [14] used photoelectric sensors to monitor the seeding performance of the precision seeder, and collect the pulse signals generated during the falling process of the seeds through the infrared detection device. The MCU processed the obtained pulse signal to obtain the falling time interval, which was compared with the set-theoretical time interval. Then the seeding rate, replaying rate, and missed seeding rate were calculated. The single seed monitoring accuracy of the system could reach almost 98.8%. Ji et al. [15] developed a seeder metering monitoring system based on reflective infrared photoelectric induction, and developed hardware circuits with functions such as seed grain signal pickup, vehicle speed acquisition, dust-proof motor control, and alarm display. A specific calculation method was carried out with the time difference as the key factor to realize the judgment of key performance indicators such as seeding rate, replaying, and missing seeding. The monitoring accuracy of the seeding rate, replaying rate, and missed seeding rate were 98.5%, 85.6%, and 95.1%, respectively. Huang et al. [16] developed a remote seed metering monitoring system based on GPS and GPRS. The PVDF piezoelectric sensor was used to obtain the sowing quality information of the finger clip seed metering device in real-time, the GPS was used to obtain the position information, and the data transmission was realized through GPRS. The detection accuracy of the seeding rate, missing seeding rate, and replaying rate were 97.4%, 96.1%, and 95.9%, respectively. Zhou et al. [17] studied the seeding performance monitoring method based on the acquisition and analysis of capacitance signals, and designed a high-precision capacitance detection circuit with MCU PIC18F2580, capacitance conversion chip MS3110 and AD7685 as the core. The monitoring accuracies of the seeding rate, replaying rate, and missed seeding rate were 94.6%, 88.1%, and 93.5%, respectively. Chen et al. [18] designed an online monitoring device for rapeseed seed metering devices based on a linear array CCD sensor. Through the real-time monitoring of the continuous transformation of pixel values, the accurate measurement of the broadcast amount was realized. The metering accuracy of the device for 5, 10, and 20 min continuous seed metering can reach more than 97%. Although the above research has achieved good results [19], there was no online monitoring system for the air-suction cup seed meter for rice industrialized seedling raising [20]. Therefore, this paper proposed a wireless sensor network based on ZigBee to realize wireless data transmission between nodes [21], sensor nodes to realize data acquisition [22], coordinator nodes to realize centralized data processing and forwarding [23], and to communicate with the host computer by RS485 bus [24]. The running status and seed metering effect of the seed metering device was monitored using the upper computer [25].
Based on the Internet of Things technology [26], this paper proposed an online monitoring system scheme for the air-suction vibrating disc seed meter based on the Internet of Things [27] and configuration software to solve the problem of the low degree of intelligence of air-suction vibrating disc seed meter [28]. An online monitoring system was designed and implemented for air suction vibrating disc seed metering devices based on ZigBeeand configuration software [29]. In this system [30], the real-time parameters such as the running state of the seed metering device and seed metering effect were obtained [31], and the fault alarm [32], monitoring data, access database storage, and query functions were realized [33]. The performance of the seed metering device was optimized [34], which improved the qualification rate and stability of precision seeding of super rice industrialized seedling raising [35].
2. Working Principle of Seed Meter
As a vital component of the rice seedling raising line [36], the performance of the seed meter will directly determine the effect of the rice seedling raising in the factory, thus affecting the rice yield [37]. According to the needs of super rice industrial seedling raising, the research group developed the air-suction vibrating disc seed meter to improve the efficiency of the seed meter and reduce the damage to sprouts [38]. The structure diagram of the air-suction vibrating disc seed meter is shown in Figure 1, which was composed of a seed suction disc, a stepping motor, a screw guide rail, an air duct interface, a seed disc, a frame, a moving wheel, a servo motor, a crank connecting rod mechanism, a base and a high-pressure fan. During operation, the movement of the crank connecting rod mechanism causes the seed tray to vibrate with a certain amplitude and frequency, so that the seeds in the seed tray were in a uniform boiling state. The high-pressure fan provided appropriate negative pressure for the seed suction disc to realize seed suction, and the screw guide rail structure offered motion control for the seed suction and seed metering of the seed disc, which realized the whole process of seed suction and seed metering.
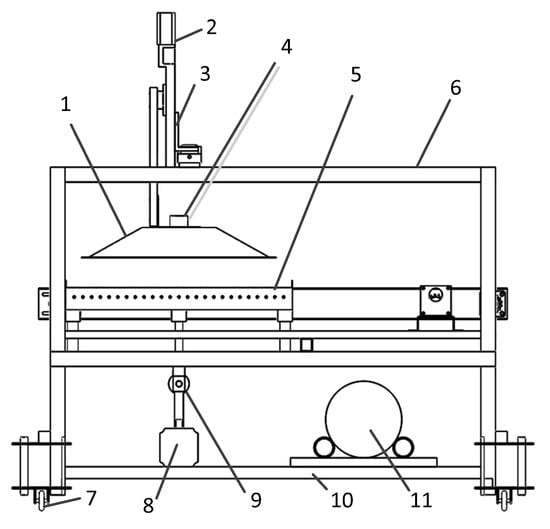
Figure 1.
Air suction vibrating disc seed metering device structure diagram. 1. sucker 2. stepper motor 3. screw guide 4. air duct interface 5. seed tray 6. Frame 7. moving wheel 8. servo motor 9. crank mechanism 10. base 11. high-pressure fan.
3. System Design
3.1. Overall System Design
The system consisted of a PC host computer, main controller, coordinator node, terminal node, and sensor. The coordinator node was composed of STM32F429IGT and CC2530. STM32F429IGT realized data processing and protocol conversion, and realizes communication with the upper computer. CC2530 was responsible for ZigBee data transmission. The terminal node comprised CC2530 and its peripheral circuits, and obtains relevant data such as field sensors and switch status. The sensor was used to receive and process data related to the operation status of the seed metering device. When the coordinator node and the terminal node were successfully networked, the terminal node sends the processed relevant data to the coordinator node through ZigBee wireless protocol. The coordinator node CC2530 communication module received the data sent by multiple nodes to process and judge whether there was alarm information, and sent the monitoring data and alarm information to the STM32F429IGT main controller through the RS232 bus. The main controller realized bidirectional data exchange with PC software through RS485 bus and ASCII protocol. The overall schematic diagram of the system is shown in Figure 2.
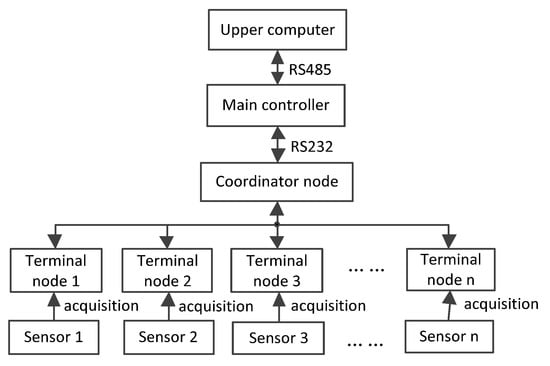
Figure 2.
System overall schematic diagram.
3.2. Wireless Communication Mode Selection
ZigBee, WiFi, and Bluetooth were relatively mature short-distance wireless transmission solutions [39]. Table 1 compares transmission protocols of several common wireless communication methods [40]. WiFi and Bluetooth transmission bandwidths were high, but the communication distance and anti-interference characteristics were not good. Generally, the rice seedling raising assembly line was in a complex environment [41]. Considering the transmission rate, the actual requirements of communication distance and the anti-interference of the system, ZigBee was selected as the wireless transmission protocol of the system.

Table 1.
Common wireless communication modes.
3.3. Node Layout Optimization Algorithm
Combined with the actual situation of the system, the wireless sensor network adopted ZigBee mesh topology to improve the networking efficiency and the maximum distance limit of single node transmission. The monitoring area deployment was simplified into a network structure, and the impact of elevation difference on video signal attenuation was reduced through antenna position optimization. For the node distribution settings within a unified local range, it was assumed that there were no heterogeneous nodes in the network, each node had the same performance, and the effective range of communication between each node was a circular area with the node as the center and as the radius. Figure 3 shows the implementation process of the optimization algorithm.
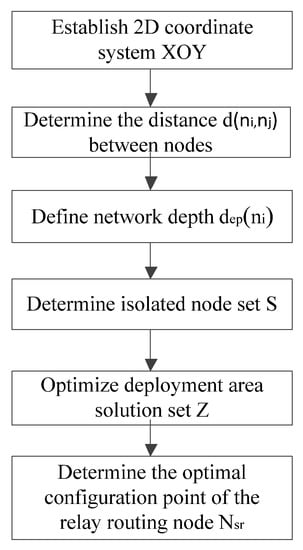
Figure 3.
The implementation process of the optimization algorithm.
In the area of deployment, established the coordinate system XOY. The distance between nodes and in ZigBee wireless sensor network could be calculated as
Network depth could be defined as
In Equation (2), —the reliable distance of data single-hop transmission between nodes
The coordinator node network depth of ZigBee network was 0, the initial depth of other nodes in the network was −1.
Assume that the number of isolated nodes in the current ZigBee network was set , defined the isolated boundary point as the point closest to the signal coverage in S.
In Equation (3), N—network node set.
was the closest node between node and non-isolated node.
The connection function between the nodes was defined as:
When it is within the effective communication range of , the optimal solution set Z of the relay routing node selected for was:
In Equation (5), k—the number of nodes satisfying the constraint set.
When selected the nodes within the Z set area, the ZigBee network can obtain the optimal connectivity effect.
In area Z, the reliability, load balance and transmission delay of ZigBee network transmission needed to be comprehensively considered according to the actual demand. Therefore, the communication cost function was defined as:
According to Equation (5), the minimum value obtained by was the optimal configuration point of .
Assuming that the constraint set of in Equation (5) above was an empty set, then:
When the network added a new routing node , it returned and searched for the newly isolated boundary point in the ZigBee network again. It kept cycling and stopped when there were no isolated nodes in the network.
4. System Hardware Design
4.1. ZigBee Node Design
The ZigBee coordinator node was composed of STM32F429IGT main controller, CC2530, key module, TFT display module, execution module, power module, and host computer. STM32F429IGT was used as the main controller to connect with the key module, display module and execution module at the same time, which realized the communication with Kingview and CC2530. The power module provided 3.3 V power for both STM32F429IGT and CC2530 modules. The schematic diagram of the coordinator node is shown in Figure 4a.
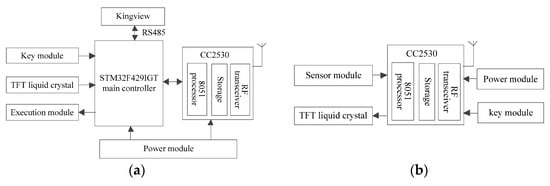
Figure 4.
Node schematic diagram. (a) Coordinator node schematic diagram; (b) Terminal node schematic diagram.
The terminal node mainly realized on-site sensor data acquisition and wireless transmission, including CC2530, sensor module, TFT display module, power module and key module. The schematic block diagram of the terminal node is shown in Figure 4b.
4.2. Hardware Schematic Design
The core controller of the wireless data transmission module for the ZigBee node adopted CC2530 of TI Company. This chip integrated the RF transceiver of IEEE802.15.4 standard 2.4 G frequency band. The peripherals included 12 bit 8-channel A/D converter, 2 USART serial ports, 21 general GPIO, a watchdog timer and sleep mode timer with a 32 kHz crystal oscillator. A ZigBee node could be formed with only a few external circuits. The schematic diagram of CC2530 is shown in Figure 5.
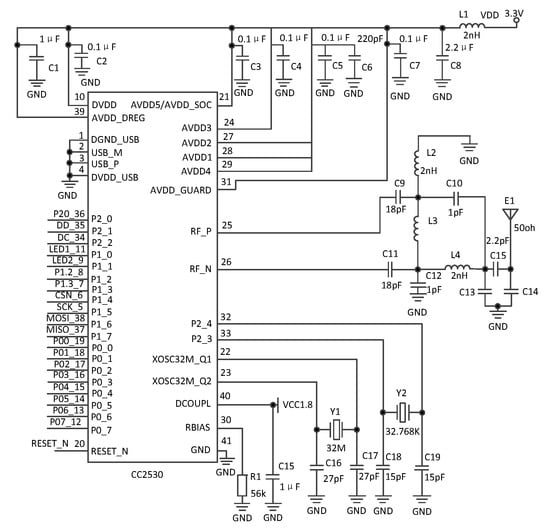
Figure 5.
CC2530 schematic diagram.
RF transceiver module was connected to the RF_P and RF_N pins of CC2530, and the RF_P and RF_N pins output differential signals, which had the advantages of high gain and anti-interference. LC balun matching circuit was adopted in this design. The conversion of balanced signal through impedance matching was realized by C9, C11, C10, and L4, which improved the data transmission capacity. The RF transceiver module circuit is shown in Figure 6.
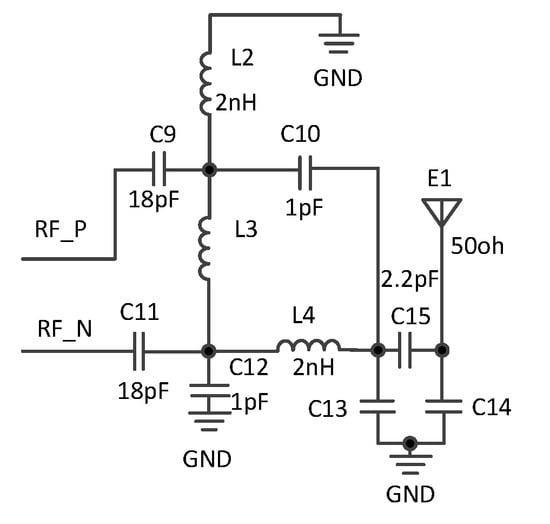
Figure 6.
RF transceiver module circuit.
CC2530 could be powered by 2.2 V~3.6 V wide voltage, combined with its low power consumption. It could provide three power management modes: wake-up mode 0.2 mA, interrupt mode 0.4 μA and sleep mode 1 μA. The system was in wake-up mode during normal operation. It could be set as interrupt mode according to actual needs. When external conditions trigger, CC2530 could be switched from interrupt mode to wake-up mode. When the node worked for a long time and needed low power consumption, the CC2530 could be set to the low power consumption mode. That was, the normal state was in the sleep mode, and some special interrupts could trigger the CC2530 to wake up from the sleep mode. The three working modes of CC2530 ensured that the ZigBee node could work stably for a long time under direct connection to the power supply.
The RS485 communication module circuit is shown in Figure 7. The RS485 data transceiver was mainly realized by the SP3485 chip. RS485_TX and RS485_RX were the data transmitter and receiver respectively, and RS485_RE was the transmit/receive enable end. Pin A of SP3485 chip was connected to a 3.3 V power supply through 360-ohm pull-up resistance, and Pin A was grounded through 360 ohm pull-down resistance.
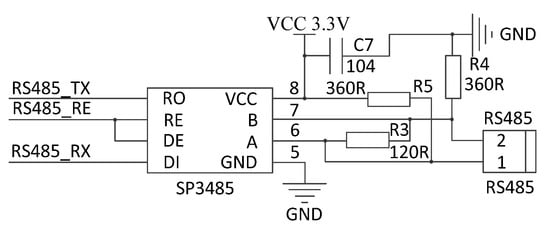
Figure 7.
RS485 communication module circuit.
The power conversion module circuit is shown in Figure 8. Since the system input power supply was 5 V, STM32F429IGT chip, CC2530 chip and the back-end circuit required a 3.3 V power supply. The power conversion module circuit was realized by the AMS1117-3.3 chip. The input terminal was connected to C4 (104) filter capacitor; the output terminal was connected to the C5 (220 μF), and C6 (104) filter capacitor. The module converted power from +5 V to +3.3 V.
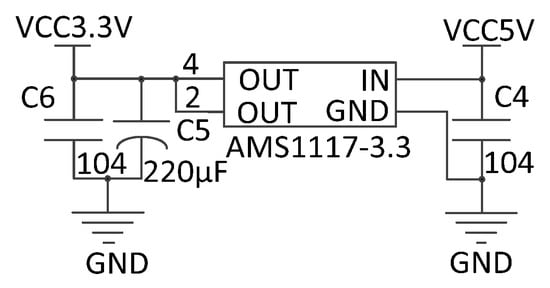
Figure 8.
Power conversion module circuit.
Two functions were provided by the STM32F429IGT reset circuit: power-on reset and key reset. Reset could be provided by two cycle high level of RC When the circuit was working, it could be reset by pressing the reset button. The circuit of the RESET module is shown in Figure 9.
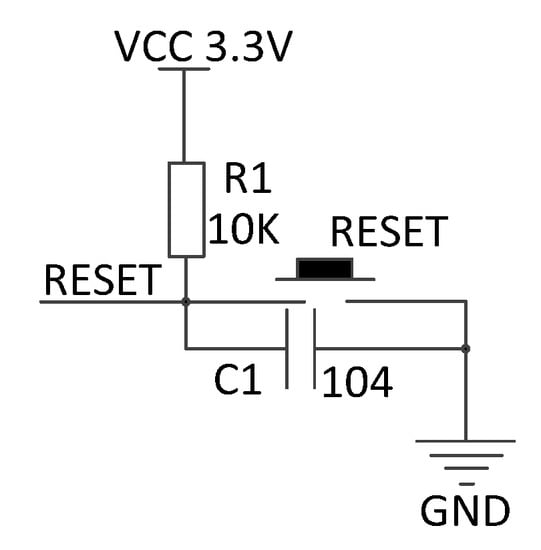
Figure 9.
Reset module circuit.
5. System Software Implementation
5.1. Implementation of Kingview Communication
Communication port setting: the communication port could be selected in the configuration king software equipment column, MCU communication port could be COM1 or COM2. MCU address setting: MCU address format in Kingview was ##.#, the first two addresses were device addresses, ranging from 0 to 63, “1” data packing.The communication parameter mode is shown in Table 2. The latter address was set by the user to pack or not, in which “0” means data was not packed, and “1” means data was packed. The baud rate could be selected from 2400/4800/9600/19200 bps according to the actual communication requirements, and the communication mode could be set to RS232/RS422/RS485 communication protocol mode, with no parity check, eight data bits, and one stop bit.
Table 2.
Communication parameter mode.
5.2. Realization of Communication between Single Chip Microcomputer and Configuration Software
The software part of the system mainly included the upper computer online monitoring and storage processing part. The lower computer main controller was STM32F429IGT, mainly responsible for site data acquisition, processing, and communication. There were three main communication modes for communication between Kingview and MCU: (1) Developing a communication protocol driver based on Kingview software; (2) Communication by dynamic data exchange; (3) Communication with MCU by ASCII protocol. With comprehensive consideration, the system chose the third communication method. The flow chart of communication between the microcontroller and the configuration software is shown in Figure 10.
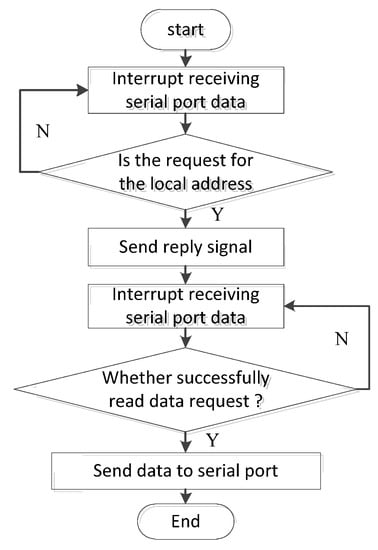
Figure 10.
Flow chart of communication between microcontroller and configuration software.
According to the ASCII communication protocol format provided by Kingview, the communication protocol commands between Kingview and MCU could be divided into read/write according to the data transmission direction. The specific format is shown in Table 3 and Table 4.
Table 3.
Upper computer data write command.
Table 4.
Data reading command received by the upper computer.
The data write command sent by the host computer is shown in Table 3.
The data read command received by the upper computer is shown in Table 4.
This command represents the data receiving the command, that was, Kingview received the data format sent by MCU. Compared with the data write command sent by the bit computer, this command had one more data part.
Data: data actually transmitted, represented by ASCII code, twice the number of bytes.
When MCU received the data read/write command sent by Kingview, MCU performs XOR verification and gave a response command.
If the XOR check was correct, the response command was as shown in Table 5.
Table 5.
MCU verification correct response command.
If the XOR check was wrong, the verification error response command was as shown in Table 6. “**” indicated that the bit could be arbitrarily set to 0/1.
Table 6.
MCU verification error response command.
6. Experiment and Result Analysis
6.1. Monitoring System Experiment
In May 2022, the experiment was conducted on the air-suction vibrating disc seed meter at Jiangsu University. To verify the proposed node deployment optimization algorithm and ensure the scalability of the system, five terminal nodes, two routing nodes, and 1 coordinator node were set during the experiment. During the experiment, the coordinator node and the terminal node were started in turn. The system realized the ad hoc network, the field displayed monitoring data, and the data exchanged with the Kingview software through the ASCII protocol. The physical drawing of the air suction vibrating disc seed metering device is shown in Figure 11a. The main controller monitoring interface is shown in Figure 11b.
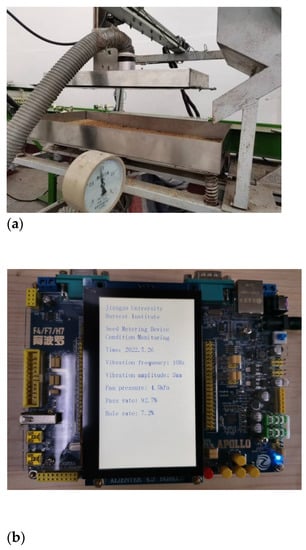
Figure 11.
Field bench test of the monitoring system of air suction vibrating disk seed metering device. (a) Test platform of air suction vibrating disc seed metering device; (b) Main controller monitoring interface.
6.2. ZigBee Network Loss Bit Error Rate Test
To obtain the performance of the ZigBee wireless sensor network, the data transmission stability of ZigBee network nodes was tested. The experiment was conducted in a relatively open room with a running time of 1 h. The bit error rate test results are shown in Table 7. Each terminal node obtained 1800 frames of data and compared it with the actual received data through accurate acquisition. The experimental results showed that the bit error rate of this system was between 0.38% and 0.56%, which could meet the monitoring requirements of this system.
Table 7.
Bit error rate test.
6.3. Upper Computer Software
Aiming at the intelligent needs of the air-suction vibrating disc seed meter, an online monitoring system for the air-suction vibrating disc type seed meter was implemented based on the configuration software. The main monitoring interface of the upper computer is shown in Figure 12. This interface provided the functions of the main interface, seed metering device 1, seed metering device 2, seed metering device 3, real-time alarm, historical alarm, real-time curve, historical curve, real-time data recording, historical data recording, log out, and exit. The obtained data and alarm records were saved in the access database for later reference, and provided a good foundation for data statistics and later performance improvement of the seed metering device.
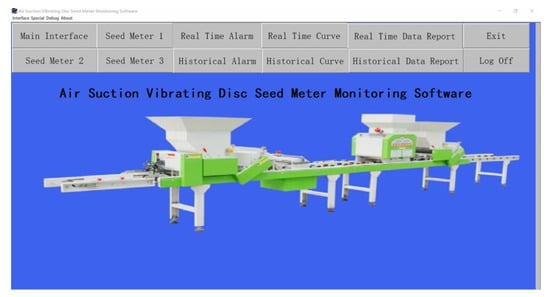
Figure 12.
Upper computer monitoring main interface.
Seed meter running state monitoring interface is shown in Figure 13. This interface could realize switching with other interfaces, and could display the qualified seeding number, replays number, holes number, qualified rate, replay rate, hole rate, vibration frequency of the seed plate, vibration amplitude, fan air pressure, fan running status, fan switch, vibration motor status, vibration motor switch, fault display, manual automatic switching, etc.
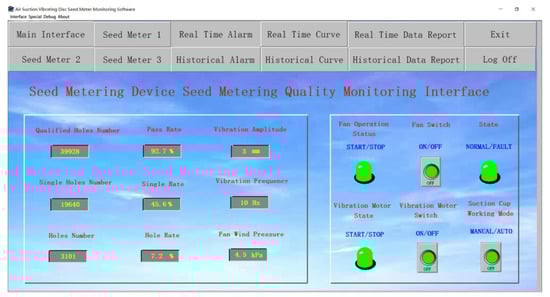
Figure 13.
Seed meter running status monitoring interface.
Figure 14 shows the history curve interface for monitoring the operation status of the seed meter. This interface could visualize the monitoring data and provide data information that could be referred to by the field staff. The curve showed the qualification rate, single hole rate, and void rate of the seed metering device in real-time. These values were related to the number of qualified seed holes, the number of single seed holes, and the number of holes in the seedling tray monitored during each seeding, respectively. However, the influence of the single acquisition value on the overall pass rate, the single hole rate, and the hole rate would not be too great. The curve tended to be gentle.
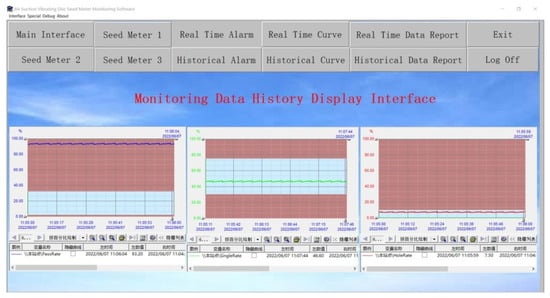
Figure 14.
History curve interface of seed meter running status monitoring.
7. Conclusions
- (1)
- An improved wireless sensor network node layout optimization algorithm was proposed, which adopted ZigBee mesh topology to improve networking efficiency and improve the maximum transmission distance of a single node. The monitoring area deployment was simplified into a network structure, and the impact of elevation difference on signal attenuation was reduced through antenna position optimization.
- (2)
- A monitoring system based on ZigBee and configuration software was designed. The upper computer adopted Kingview software, the lower part used STM32F429IGT and CC2530 as the core controllers, and ZigBee was used for data transmission to build a wireless sensor network.
- (3)
- The experimental results showed that the detection accuracy of the system was 94.3% for the seeding amount and 95.6% for the missing seeding amount. However, the detection accuracy of the missed seeding rate of the current seed meter monitoring system was 93.5%. The performance of this system had been greatly improved, which laid a good foundation for the later artificial replanting and the improvement of the qualified rate of industrialized seedling raising. This caused the system ran stably and reliably. The upper computer detection software could realize the functions of seed metering quality, real-time monitoring, and display of key equipment operation status, Access database storage, fault alarm and control instruction sending, etc.
8. Prospect
- (1)
- In future research work, we will improve and optimize the part of the state data acquisition of the seed meter. By improving the detection accuracy of the seed meter performance monitoring module, the seed metering pass rate of the seed meter is improved.
- (2)
- The scalability improvement of the monitoring system will be a major improvement direction in the later period. We will strive to improve the scalability and portability of the monitoring system so that the system can be used in more agricultural equipment monitoring systems.
Author Contributions
During the writing of this manuscript, J.C. (Junhui Cheng) provided the formulation of ideas and overall research goals and objectives. Y.L. (Yaoming Li) and J.C. (Jin Chen) provided financial support and experimental guidance for the project of this publication. Y.L. (Yanbin Liu) conducted a research and investigation process, specifically performing the experiments and data collection. K.J. and T.C. participated in the creation of the model. All authors have read and agreed to the published version of the manuscript.
Funding
This research was funded by the National Natural Science Foundation of China, grant number 31871528, 51975257; Major scientific and technological innovation projects in Shandong Province, grant number 2019JZZYO10729. Anhui Province University Outstanding Young Talents Support Project, grant number gxyq2022064; Scientific research project of West Anhui University, grant number WXZR202115; Jiangsu graduate research and Practice Innovation Program, grant number KYCX22_3680.
Institutional Review Board Statement
Not applicable.
Informed Consent Statement
Not applicable.
Data Availability Statement
Not applicable.
Conflicts of Interest
The authors declare no conflict of interest.
References
- Wang, F.; Zhao, B.; Wang, H.; Liu, Y.; Li, Y.; Wang, L. Research on field monitoring system of saline-alkali land based on ZigBee and TCP/IP. J. Agric. Mach. 2019, 50, 207–213. [Google Scholar]
- Ji, K.; Li, Y.; Liang, Z.; Liu, Y.; Cheng, J.; Wang, H.; Zhu, R.; Xia, S.; Zheng, G. Device and Method Suitable for Matching and Adjusting Reel Speed and Forward Speed of Multi-Crop Harvesting. Agriculture 2022, 12, 213. [Google Scholar] [CrossRef]
- Li, Y.; Song, Z.; Li, F.; Yan, Y.; Tian, F.; Sun, X. Design and Test of Combined Air Suction Cotton Breed Seeder. J. Eng. 2020, 2020, 7598164. [Google Scholar] [CrossRef]
- Wang, S.G.; Kang, J.M.; Yan, L.M. Design and Development of New Type Conductor Delivery of Air-Suction Metering Device. In Applied Mechanics and Materials; Trans Tech Publications Ltd.: Wollerau, Switzerland, 2015; Volume 775, pp. 78–82. [Google Scholar]
- Lü, J.; Yang, Y.; Li, Z.; Shang, Q.; Li, J.; Liu, Z. Design and experiment of an air-suction potato seed metering device. Int. J. Agric. Biol. Eng. 2016, 9, 33–42. [Google Scholar]
- Wang, D.; Wang, J.; Shang, S. Design and Experimental Study on Seed Metering Device of Peanut Plot Seeder. Agric. Mach. Technol. 2019, 13, 38–41. [Google Scholar]
- Liu, Q.; Cui, T.; Zhang, D.; Yang, L.; Wang, Y.; He, X.; Wang, M. Design and experimental study of seed precise delivery mechanism for high-speed maize planter. Int. J. Agric. Biol. Eng. 2018, 11, 81–87. [Google Scholar] [CrossRef]
- Han, D.; Zhang, D.; Jing, H.; Yang, L.; Cui, T.; Ding, Y.; Wang, Z.; Wang, Y.; Zhang, T. DEM-CFD coupling simulation and optimization of an inside-filling air-blowing maize precision seed-metering device. Comput. Electron. Agric. 2018, 150, 426–438. [Google Scholar] [CrossRef]
- Gao, X.; Cui, T.; Zhou, Z.; Yu, Y.; Xu, Y.; Zhang, D.; Song, W. DEM study of particle motion in novel high-speed seed metering device. Adv. Powder Technol. 2021, 32, 1438–1449. [Google Scholar] [CrossRef]
- Sun, Y.; Qiang, H.; Xu, J.; Lin, G. Internet of Things-based online condition monitor and improved adaptive fuzzy control for a medium-low-speed maglev train system. IEEE Trans. Ind. Inform. 2019, 16, 2629–2639. [Google Scholar] [CrossRef]
- Ray, P.P. Internet of things based physical activity monitoring (PAMIoT): An architectural framework to monitor human physical activity. In Proceedings of the IEEE CALCON, Kolkata, India, 7–8 November; 2014; pp. 32–34. [Google Scholar]
- Gnotthivongsa, N.; Alinsavath, K.N. Real-time Corresponding and Safety System to Monitor Home Appliances based on the Internet of Things Technology. Int. J. Mod. Educ. Comput. Sci. 2020, 12, 1–9. [Google Scholar] [CrossRef]
- Guo, H.; Cao, Y.; Song, W.; Zhang, J.; Wang, C.; Wang, C.; Yang, F.; Zhu, L. Design and Simulation of a Garlic Seed Metering Mechanism. Agriculture 2021, 11, 1239. [Google Scholar] [CrossRef]
- Hao, X.; He, X.; Zou, Y.; Li, X.; He, R. Research on the monitoring system of precision seeding performance based on photoelectric sensor. J. South China Agric. Univ. 2017, 38, 120–124. [Google Scholar]
- Ji, C.; Chen, X.; Chen, J.; Wang, S.; He, P. Monitoring system for seeding quality of corn no-tillage precision seeder. J. Agric. Mach. 2016, 47, 1–6. [Google Scholar]
- Huang, D.; Zhu, L.; Jia, H.; Yu, T.; Yan, J. Remote corn seeding quality monitoring system based on GPS and GPRS. Chin. J. Agric. Eng. 2016, 32, 162–168. [Google Scholar]
- Zhou, L.; Wang, S.; Zhang, X.; Yuan, Y.; Zhang, J. Monitoring system for corn planter seeding performance based on capacitance signal. Chin. J. Agric. Eng. 2012, 28, 16–21. [Google Scholar]
- Chen, Y.; Xiang, Y.; Wu, M.; Xiong, Y.; Lin, J.; Li, Y. Design and experiment of an online monitoring device for rapeseed drill seed metering based on linear array CCD. J. Hunan Agric. Univ. 2019, 45, 327–331. [Google Scholar]
- Chen, P.Y.; Wu, J.X.; Li, C.M.; Kuo, C.L.; Pai, N.S.; Lin, C.H. Symmetric Cryptography with Shift 2n−1, Hash Transformation, Optimization-Based Controller for Medical Image Infosecurity: Case Study in Mammographic Image. IEEE Photonics J. 2020, 12, 1–15. [Google Scholar] [CrossRef]
- Wu, J.X.; Chen, P.Y.; Li, C.M.; Kuo, Y.C.; Pai, N.S.; Lin, C.H. Multilayer fractional-order machine vision classifier for rapid typical lung diseases screening on digital chest X-ray images. IEEE Access 2020, 8, 105886–105902. [Google Scholar] [CrossRef]
- Pai, N.S.; Chen, P.X.; Chen, P.Y.; Wang, Z.W. Home Fitness and Rehabilitation Support System Implemented by Combining Deep Images and Machine Learning Using Unity Game Engine. Sens. Mater. 2022, 34, 1971–1990. [Google Scholar] [CrossRef]
- Li, Y.; Xiantao, H.; Tao, C.; Dongxing, Z.; Song, S. Development of mechatronic driving system for seed meters equipped on conventional precision corn planter. Int. J. Agric. Biol. Eng. 2015, 8, 1–9. [Google Scholar]
- Kuş, E. Field-scale evaluation of parameters affecting planter vibration in single seed planting. Measurement 2021, 184, 109959. [Google Scholar] [CrossRef]
- Shi, S.; Liu, H.; Wei, G.; Zhou, J.; Jian, S.; Zhang, R. Optimization and test of air suction seed metering device based on dem-cfd. J. Agric. Mach. 2020, 51, 54–66. [Google Scholar]
- Zhang, X.; Bai, S.; Jin, W.; Yan, J.; Shi, Z.; Yu, M.; Yuan, P.; Zhu, X. Design and Parameter Optimization of an Air-Suction Jujube Picking and Conveying Device. Trans. ASABE 2020, 63, 943–954. [Google Scholar] [CrossRef]
- Zhang, K.; Zhang, L.; Ding, Y.; Liu, X.; Zhao, X. Design and test of air-suction pepper seed metering device based on air supply and quantitative seed supply. INMATEH-Agric. Eng. 2021, 64, 345–354. [Google Scholar] [CrossRef]
- Hu, T.; Zheng, M.; Zhu, L. Research application of the internet of things monitor platform in meat processing industry. In Proceedings of the International Conference on Human-Centric Computing 2011 and Embedded and Multimedia Computing 2011; Springer: Dordrecht, The Netherlands, 2011; pp. 165–172. [Google Scholar]
- Hu, M.; Xia, J.; Zhou, Y.; Luo, C.; Zhou, M.; Liu, Z. Measurement and Calibration of the Discrete Element Parameters of Coated Delinted Cotton Seeds. Agriculture 2022, 12, 286. [Google Scholar] [CrossRef]
- Lin, C.H.; Wu, J.X.; Hsu, J.C.; Chen, P.Y.; Pai, N.S.; Lai, H.Y. Tremor Class Scaling for Parkinson Disease Patients Using an Array X-Band Microwave Doppler-Based Upper Limb Movement Quantizer. IEEE Sens. J. 2021, 21, 21473–21485. [Google Scholar] [CrossRef]
- Chen, P.Y.; Wu, J.X.; Lin, C.H.; Hsu, J.C.; Pai, N.S. Enhancement of Breast Mammography to Rapid Screen Abnormalities Using 2D Spatial Fractional-Order Feature Extraction and Multilayer Machine Vision Classifier. IEEJ Trans. Electr. Electron. Eng. 2022, 17, 132–147. [Google Scholar] [CrossRef]
- Wu, J.X.; Pai, C.C.; Kan, C.D.; Chen, P.Y.; Chen, W.L.; Lin, C.H. Chest X-Ray Image Analysis with Combining 2D and 1D Convolutional Neural Network Based Classifier for Rapid Cardiomegaly Screening. IEEE Access 2022, 10, 47824–47836. [Google Scholar] [CrossRef]
- Huang, Y.; Wang, D.; Fan, H.; Sun, J.; Shen, J.; Mi, J. Shear punching of a Ti-based bulk metallic glass. Mater. Sci. Eng. A 2013, 561, 220–225. [Google Scholar] [CrossRef]
- Wang, Z.; Yu, S.; Xiao, Z.; Habibi, M. Frequency and buckling responses of a high-speed rotating fiber metal laminated cantilevered microdisk. Mech. Adv. Mater. Struct. 2022, 29, 1475–1488. [Google Scholar] [CrossRef]
- Wu, J.; Habibi, M. Dynamic simulation of the ultra-fast-rotating sandwich cantilever disk via finite element and semi-numerical methods. Eng. Comput. 2021, 4, 1–17. [Google Scholar] [CrossRef]
- Xiong, P.; Liao, J.; Zhou, M.C.; Song, A.; Liu, P.X. Deeply Supervised Subspace Learning for Cross-Modal Material Perception of Known and Unknown Objects. IEEE Trans. Ind. Inform. 2022, 1–10. [Google Scholar] [CrossRef]
- Xiong, P.; Tong, X.; Song, A.; Liu, P.X. Robotic Multifinger Grasping State Recognition based on Adaptive Multi-kernel Dictionary Learning. IEEE Trans. Instrum. Meas. 2022, 71, 2511014. [Google Scholar] [CrossRef]
- Zheng, W.; Liu, H.; Sun, F. Lifelong visual-tactile cross-modal learning for robotic material perception. IEEE Trans. Neural Netw. Learn. Syst. 2020, 32, 1192–1203. [Google Scholar] [CrossRef] [PubMed]
- Liu, H.; Guo, D.; Zhang, X.; Zhu, W.; Fang, B.; Sun, F. Toward image-to-tactile cross-modal perception for visually impaired people. IEEE Trans. Autom. Sci. Eng. 2020, 18, 521–529. [Google Scholar] [CrossRef]
- Tseng, K.H.; Chung, M.Y.; Chen, L.H.; Chang, P.Y. Green smart campus monitoring and detection using LoRa. Sensors 2021, 21, 6582. [Google Scholar] [CrossRef] [PubMed]
- Choi, K.N.; Kolamunna, H.; Uyanwatta, A.; Thilakarathna, K.; Seneviratne, S.; Holz, R.; Hassan, M.; Zomaya, A.Y. LoRadar: LoRa sensor network monitoring through passive packet sniffing. ACM SIGCOMM Comput. Commun. Rev. 2020, 50, 10–24. [Google Scholar] [CrossRef]
- Deng, F.; Zuo, P.; Wen, K.; Wu, X. Novel soil environment monitoring system based on RFID sensor and LoRa. Comput. Electron. Agric. 2020, 169, 105169. [Google Scholar] [CrossRef]
Publisher’s Note: MDPI stays neutral with regard to jurisdictional claims in published maps and institutional affiliations. |
© 2022 by the authors. Licensee MDPI, Basel, Switzerland. This article is an open access article distributed under the terms and conditions of the Creative Commons Attribution (CC BY) license (https://creativecommons.org/licenses/by/4.0/).