Article

Fabrication and Characterization of Activated Carbon from Phyllostachys edulis Using Single-Step KOH Activation with Different Temperatures

Graduate School of Science and Engineering, Saitama University, 255 Shimo-Okubo, Sakura-ku, Saitama 338-8570, Japan
*
Author to whom correspondence should be addressed.
Processes 2022, 10(9), 1712; https://doi.org/10.3390/pr10091712
Submission received: 25 July 2022 / Revised: 22 August 2022 / Accepted: 26 August 2022 / Published: 28 August 2022
(This article belongs to the Section Environmental and Green Processes)

Abstract

:
Biomass waste from harvestable output is produced in significant quantities by agricultural and forestry processes and can have detrimental effects on the ecosystem. Therefore, biomass derived from the waste in the environment has been recognized as a potential source for preparing functional materials in recent years. In this study, activated carbon (ACs) was fabricated and characterized from Phyllostachys edulis (Moso bamboo) using single-step potassium hydroxide (KOH) activation at different temperatures (500 °C to 1000 °C). The prepared ACs were characterized for surface morphology, surface area, functional groups and crystallinity using scanning electron microscopy (SEM), Brunauer–Emmett–Teller (BET) analysis, Fourier transform infrared (FTIR) and X-ray diffraction (XRD), respectively. The SEM revealed well-formed pores on the surface of all ACs, while BET analysis revealed the presence of microporous (≤800 °C) and mesoporous (>800 °C) structures. SBET surface area and total pore volume increased with increasing activation temperature, from 434 to 1790 m2/g and 0.2089 to 0.8801 cm3/g, reaching a maximum at 900 °C. FTIR revealed the presence of carbonyl and hydroxyl groups on the surface. XRD showed a dominant amorphous structure and a low crystallization degree in all ACs.

1. Introduction

Waste from harvestable output is produced in significant quantities by agricultural and forestry processes. Around 140 Gt of biomass waste is produced annually on a worldwide scale [1], which poses serious management challenges since wasted biomass can have detrimental effects on the ecosystem [2]. According to predictions, dumping at the current rate would result in the loss of more than 5–8% of our agricultural area within the next 50 years, as well as the emergence of new illnesses, food poisoning, respiratory problems, genetic mutations and a drinking water crisis [3,4].
Agricultural waste, animal waste, industrial waste, municipal solid waste (MSW), food processing waste and other waste are examples of biomass waste that are often produced [5]. In the past 5 years, a variety of biomass waste has been studied extensively to extract natural polymers or to be transformed into useful materials for applications with added value [6]. These wastes include agricultural and forestry waste, animal waste, industrial waste and MSW. Most biomass waste is either left to naturally degrade in the field, disposed of in landfills or burned outdoors to produce charcoal. These methods are not only inefficient but also seriously polluting to the environment by emitting greenhouse gases and causing the air quality to deteriorate. Thus, creating value-added products from biomass waste for use in materials, medicine, and food packaging has lately attracted interest [7].
Biomass waste streams may be used as raw materials to make a range of goods, including construction materials, polymers, fuel and carbonaceous materials such as activated carbons. Activated carbon (ACs), a form of carbon, is a porous substance with a high surface area [8,9]. It is widely used for its attributes in different fields such as water treatment [10], wastewater treatment [10,11], ozone treatment [12], soil bioremediation, air purification [10], adsorption [13], buffering activity [14], etc. There are many methods for producing activated carbon viz. physical activation, chemical activation, single-step activation, two-step activation, etc.
Studies have developed different microporous and mesoporous ACs from different agriculture and forest biomass wastes, including almond stone, bamboo, rice husks, peels, waste tea, cotton stalk and effluent fruit bunches [15]. Results across studies have been varied, perhaps due to the variable sources of feedstocks as well as the methodology for AC development. The current study was therefore set in a bid to add to the existing database of forest waste as a potential feedstock for ACs using Phyllostachys edulis (particular species of bamboo). Originally from China and Taiwan, this temperate species of gigantic wood bamboo has now spread to other countries, including Japan, where it may be found from the south of Hokkaido to Kagoshima [16]. This bamboo may grow up to 28 m in height (92 ft). This specific kind of bamboo is the one that is most frequently utilized to make rayon in the bamboo textile industry in China and other nations [16]. This bamboo waste biomass is widely used for food cooking, heat in power plants, the metallurgy industry [17,18,19] and feedstock to produce charcoal due to the high degree of lignification [20]. It has very low nitrogen (N), sulfur (S), and ash, which makes it effective for different uses [21].
Previous studies on the use of this specie of bamboo were conducted more than a decade ago [22,23,24,25,26]. Porous charcoal was created by Lan et al. [22] using 3- to 5-year-old Moso bamboo (Phyllostachys edulis). The effects of production conditions on the heavy metal ion adsorption by Makino bamboo charcoal were examined by Wang et al. [23]. Jiang [24] investigated the variables that affect the bamboo pyrolysis process, including the final pyrolysis temperature, the rate of carbonization, the moisture level of the bamboo and the size of the bamboo. Among them, the terminal carbonization temperature had the greatest impact on the quality and characteristics of bamboo charcoal. It was also determined how well bamboo charcoal absorbed methane, benzene, methylbenzene, ammonia and chloroform. Moso bamboo was the starting material utilized by Horikawa et al. [25] to create activated carbon by chemical activation with K2CO3 and physical activation with CO2. According to their experimental findings, part of the generated activated carbon has a great deal of promise for use as adsorbents for desiccant humidity conditioners, adsorption heat pumps and general humidity conditioning.
The current study was set to develop ACs from Phyllostachys edulis using single-step KOH activation under different heating temperatures. Single-step KOH activation was recently shown to be effective in producing better quality activated carbon from Myristica fragrans shells [27]. Surface morphology, texture and other physicochemical properties of the produced activated carbon were examined using different analytical methods.

2. Materials and Methods

2.1. Materials and Chemicals

Phyllostachys edulis waste was collected from Anhui province, China. The raw material was crushed with a high-speed blender (YKB, China) and selected by using a stainless sieve (MF0.5, IKA Japan) to obtain a particle size ≤ 250 μm of the bamboo powder. The proximate analysis and ultimate analysis were conducted with the JIS M8812 standard, and their results are shown in Table 1. Additionally, the lignocellulosic analysis is also shown in Table 1. Potassium hydroxide (KOH) (>85 wt.%) and hydrochloric acid (HCl) (10%) used in this study were supplied by Wako Pure Chemical Industries, Ltd., Osaka, Japan. Nitrogen (N2) of a purity ≥ 99.9995% was taken from Suzuki Shokan Co., Ltd., Tokyo, Japan.

2.2. Preparation of Activated Carbon

Single-step activation was used to synthesize activated carbon (ACs). Therefore, 3 g of dried raw material of moso bamboo was mixed with KOH and 30 mL of distilled water, then stirred at a speed of 600 rpm at room temperature for 1 h while the mass ratio of KOH/raw material (wt.%) was kept at 1:1. The mixture solution was dried overnight at 105 °C to eliminate extra moisture entirely. The obtained oven-dried mixture was filled into a ceramic boat and set in a stainless horizontal tubular furnace under N2 atmosphere condition with a 200 mL/min flow rate for 10 min to eradicate air and then activated at 500 °C, 600 °C, 700 °C, 800 °C, 900 °C and 1000 °C for 1 h with a heating rate of 10 °C/min, respectively. Subsequently, the activated sample was cooled down to room temperature, washed with 10% HCl solution and distilled water until pH 7 to remove remaining KOH and any other soluble carbonates and/or impurities. Finally, the pure sample was dried overnight at 105 °C, ground with a mortar and preserved in the sealed glass bottle. All samples were noted as KOH-X (X stands for the activation temperature). The yield of activated carbon and residual rate of activator (KOH) were calculated from the following equation [28]:
AC   yield   ( wt . % ) = M 1 / M 0 × 100
Activator   residual   rate   ( wt . % ) = [ ( M M 1 ) / m ] × 100
  • M: Activated carbon weight after activation
  • M1: Activated carbon weight after wash
  • M0: Initial weight of precursor
  • m: Weight of KOH

2.3. Characterization of Activated Carbon

The morphology was observed with a scanning electron microscope (SEM, S-4800, Hitachi Co., Ltd., Tokyo, Japan). Carbon tape was attached to the sample base (φ = 32 mm), and the samples were spread thinly on it and fixed by crimping. All samples with a Pt-Pd coating were vacuum degassed to 5 × 10⁻⁴ Pa and further observed with a 10 kV accelerating voltage. The porous structure of ACs was analyzed using N2 adsorption isotherms at 77 K with a BELSORP-miniX (BELSORP-miniX-TKS0, MicrotracBEL Corp., Osaka, Japan) adsorption instrument at a relative pressure of P/P0~0.995. All samples were pretreated at 400 °C for 3 h under a vacuum environment before adsorption to outgassing. The specific surface area was estimated by the Brunauer–Emmett–Teller (BET) equation within a relative pressure range of 0.01–0.1. The total pore volume (Vt) was determined from the N2 adsorption isotherms (P/P0 = 0.990). The micropore volume (Vmic) and micropore size distribution were calculated from the t method and the MP method (micropore analysis method), respectively. In addition, three methods were employed to evaluate mesopore volume (Vmeso) and mesopore size distribution. (a) Vmeso was calculated as the difference between Vt and Vmic, (b) defined by the Barrett–Joyner–Halenda (BJH) method, (c) defined by the INNES method.
An X-ray diffraction (XRD) analysis was conducted to analyze the crystalline degree of ACs using RINT-Ultima III (Rigaku Co., Ltd., Tokyo, Japan) with radiation (40 mA, 40 kV, Cu Kα, λ = 0.154 nm) in a scanning angle from 10° to 60°. The scan rate was 4.0°/min. Meanwhile, the surface functional groups of the ACs were determined by Fourier transform infrared spectroscopy (FTIR) (IR-6100, JASCO Co., Ltd., Tokyo, Japan). The infrared spectrum was recorded in the 400–4000 cm−1 range by averaging 64 scans at a resolution of 4 cm−1.

2.4. Statistical Analysis

All the experiments were carried out on multiple occasions, and the results were analyzed with BELMasterTM for Windows version 7.0.18.8 (MicrotracBEL Corp., Japan).

3. Results and Discussion

3.1. Surface Morphology Characterization

The surface morphology of each sample was observed under a scanning electron microscope (SEM), as presented in Figure 1. The carbonization step produced a small number of pores due to the decomposition of volatile components, while the activator had a considerable impact on hastening porous structures (b)–(h). Subsequently, with the increase of activation temperature, the bulk was crushed into smaller particles and/or more carbon fragments, which developed more crevices as slit-shaped porous structures. There were more smaller pores formed when the temperature reached 800 °C. Some pore walls collapsed and crumbled, as compared in Figure 1b, due to the additional corrosion caused by KOH that accelerated micro–meso porosity by etching the carbon skeleton to generate the new pore structures. This was observed for (e)–(g). The identical result was also reported by Mariana et al. (2021) [27]. As redox reactions and etching effects become more intense, the carbon flakes start melting and the surface becomes rougher at 1000 °C. This structural deformation caused pore shrinkage, which led to lower porosity and surface area. In addition, oxide surface melting such as K2O also affected pore blocking. Lee et al. (2018) described similar results of blocking the pore using K2O as activation [29].

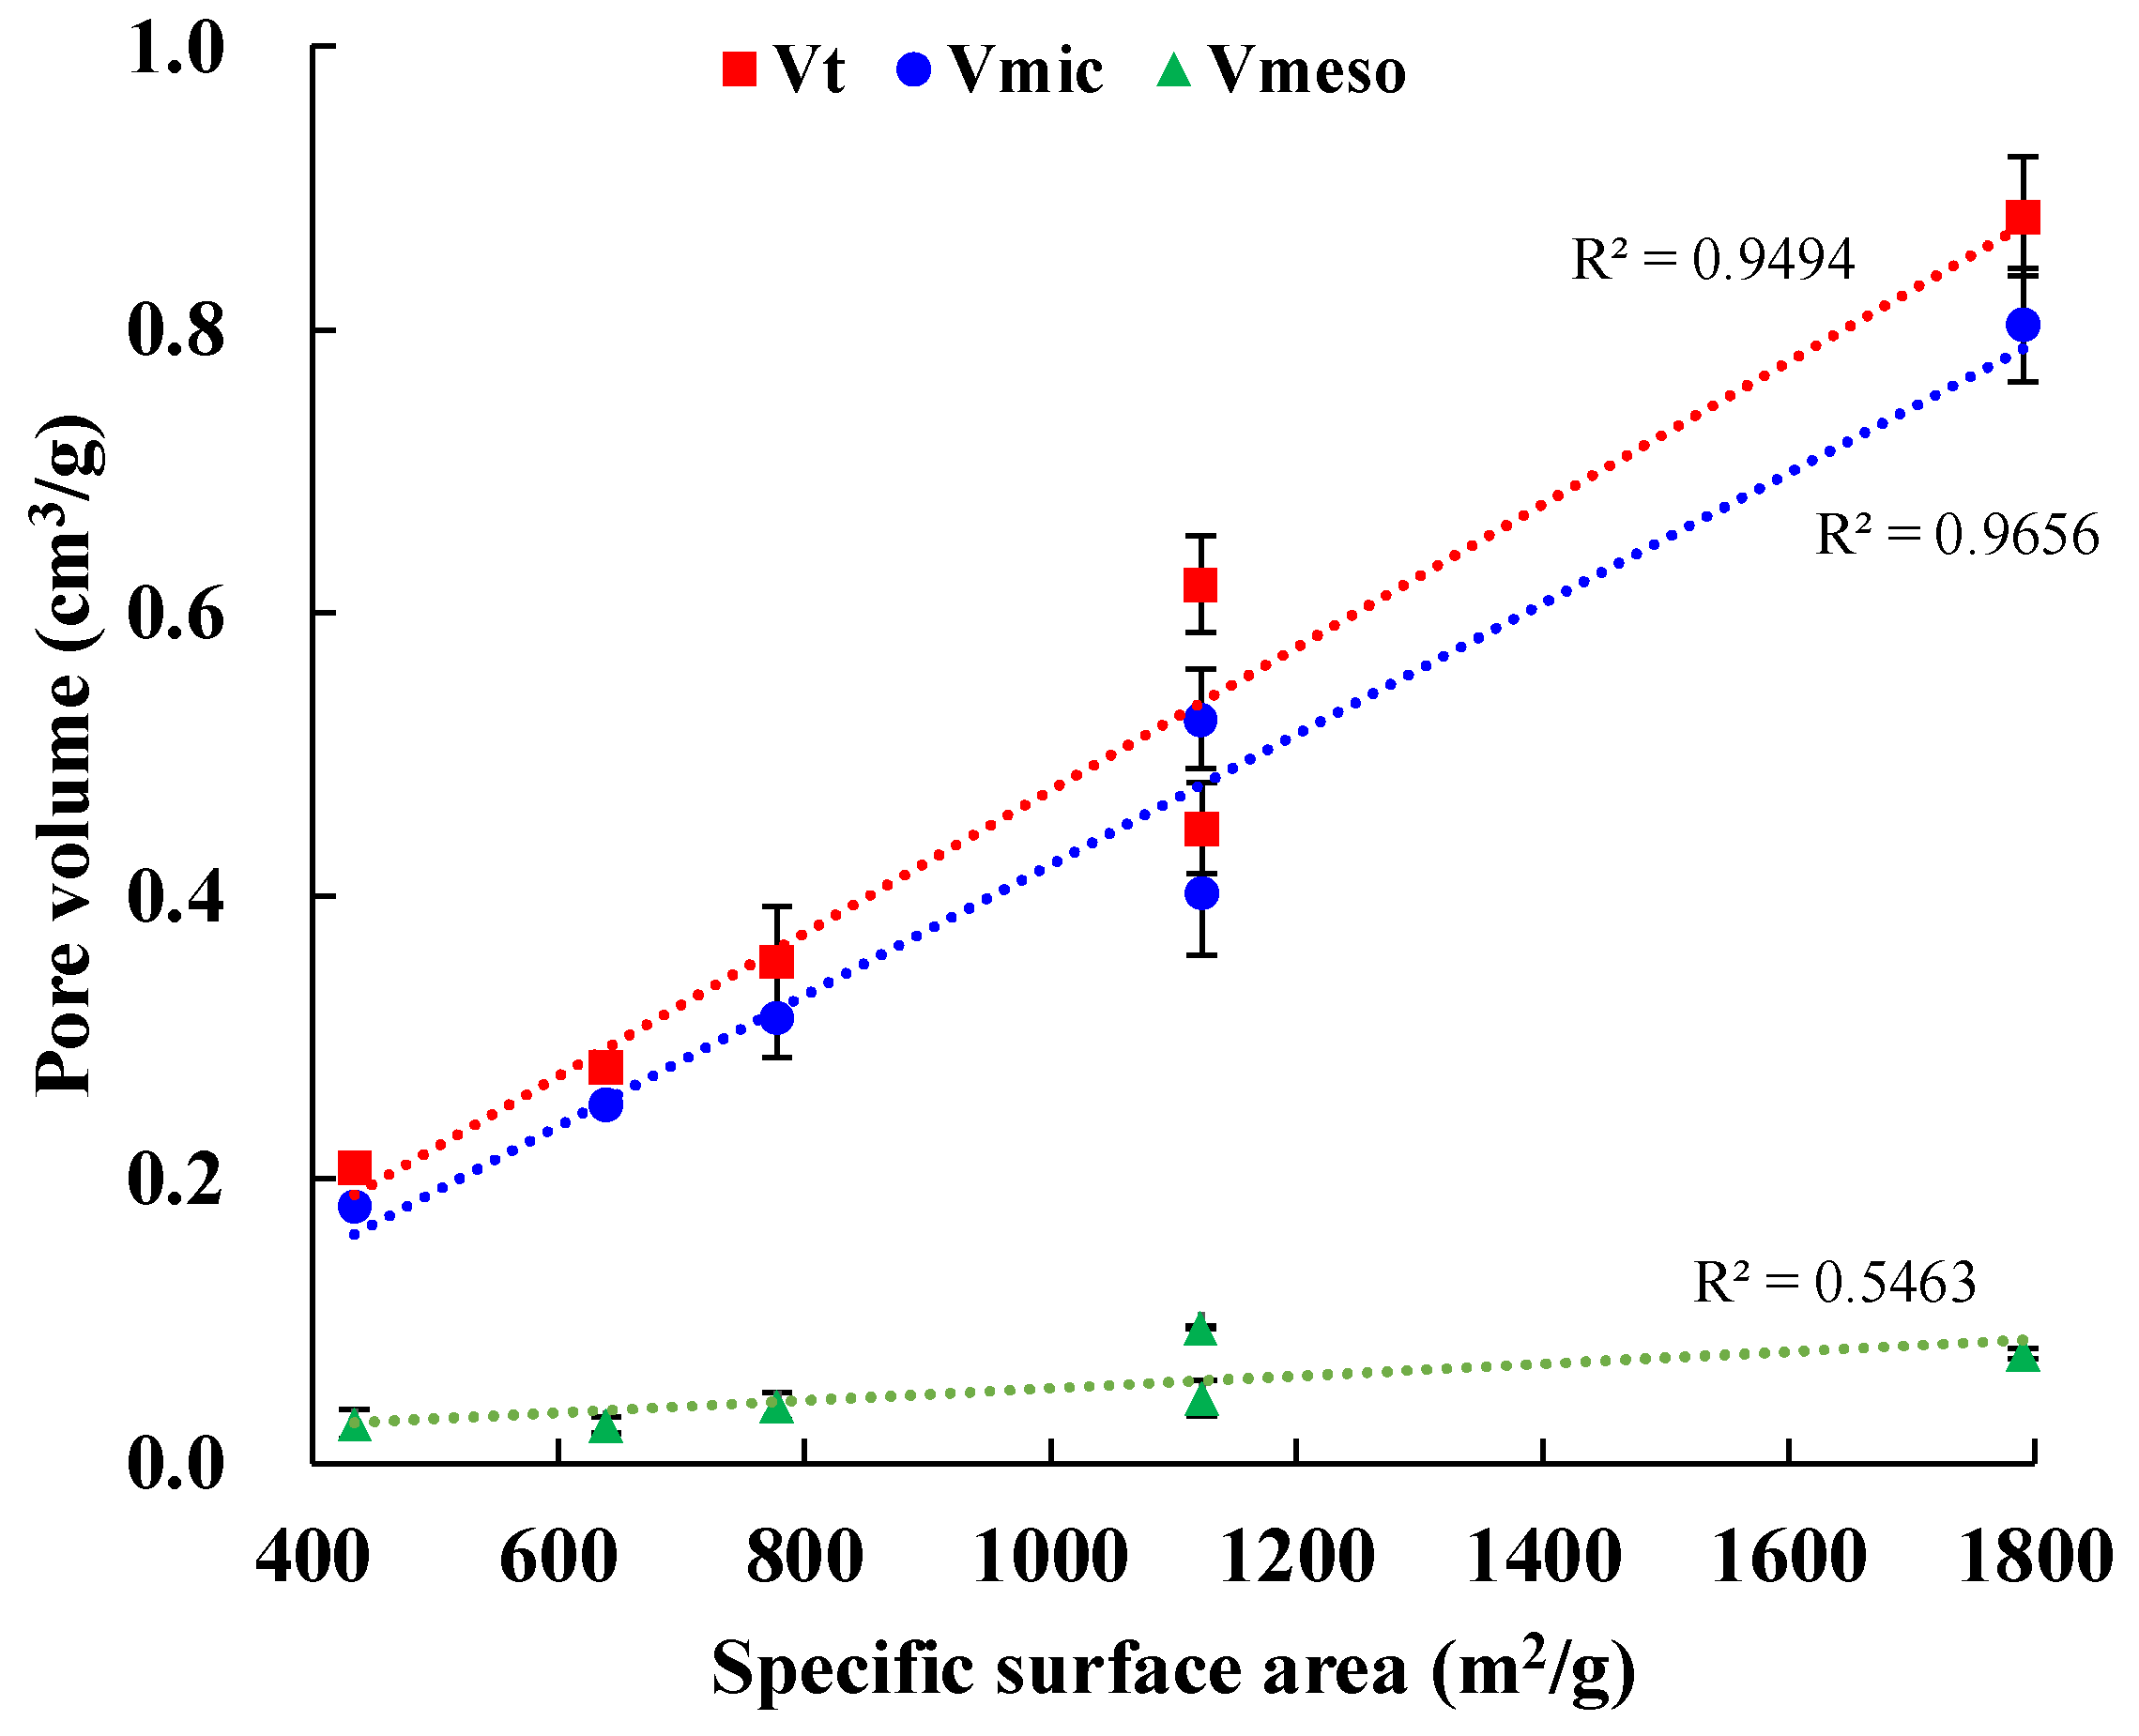
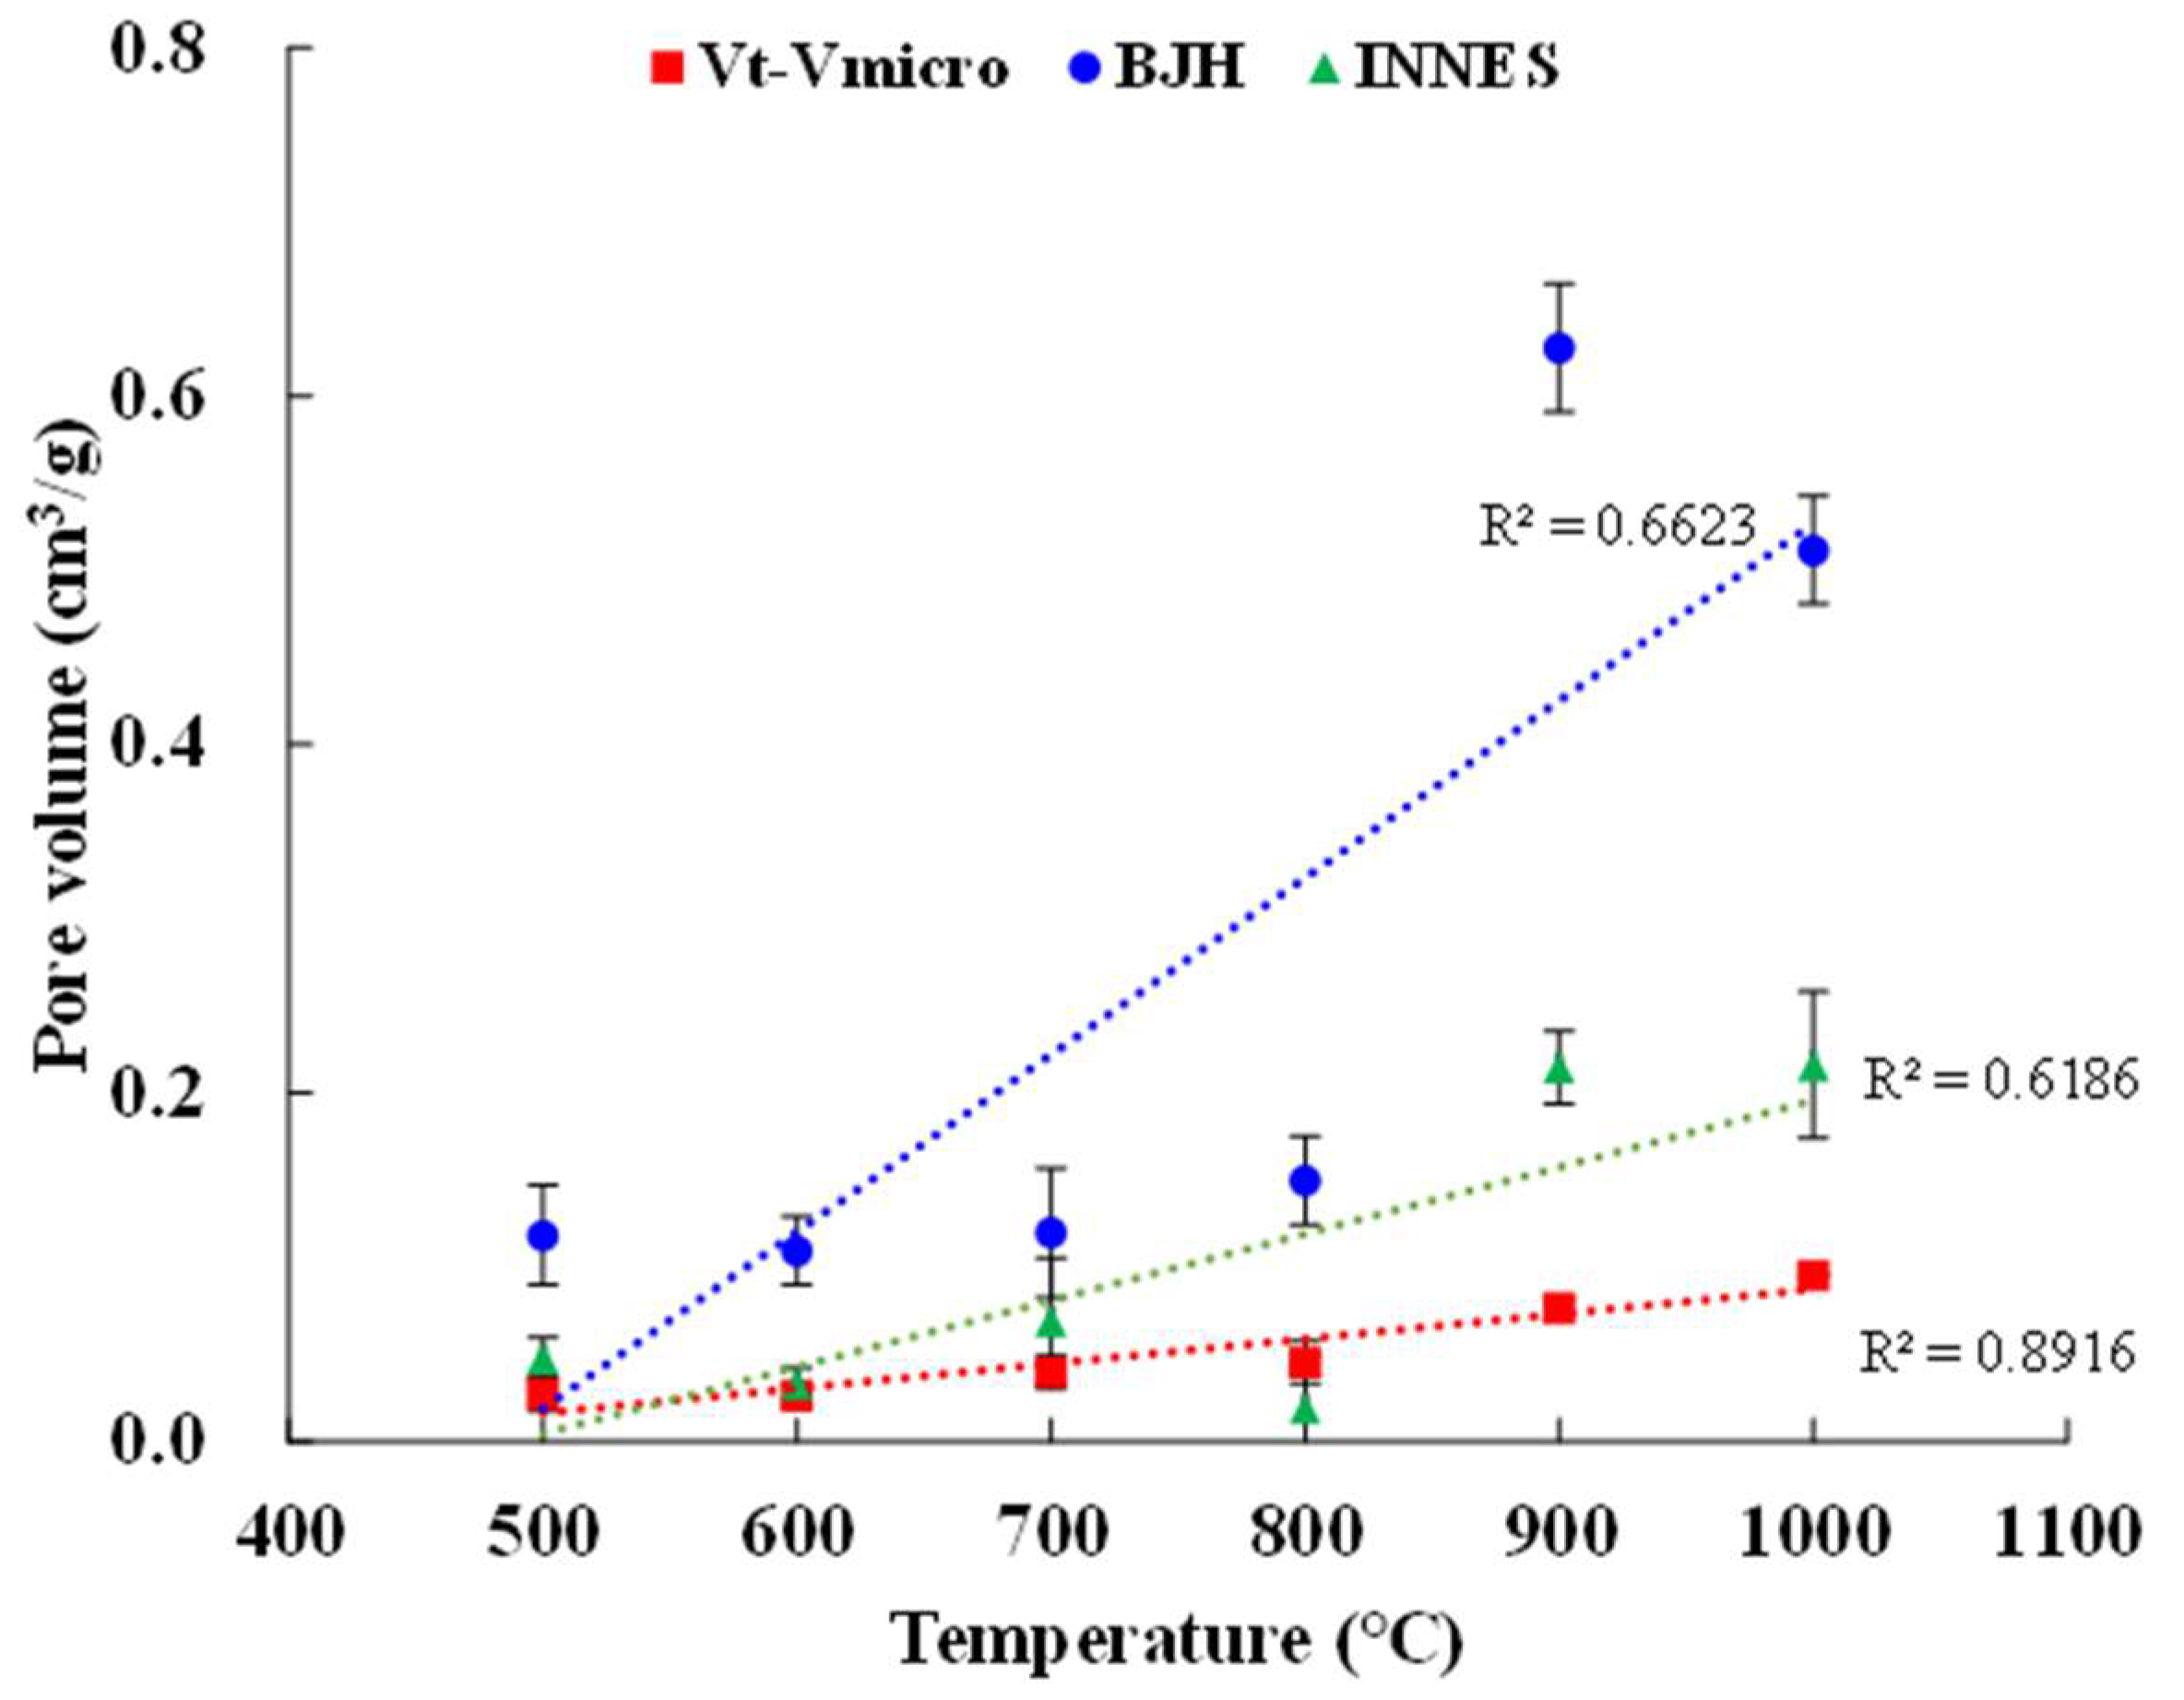
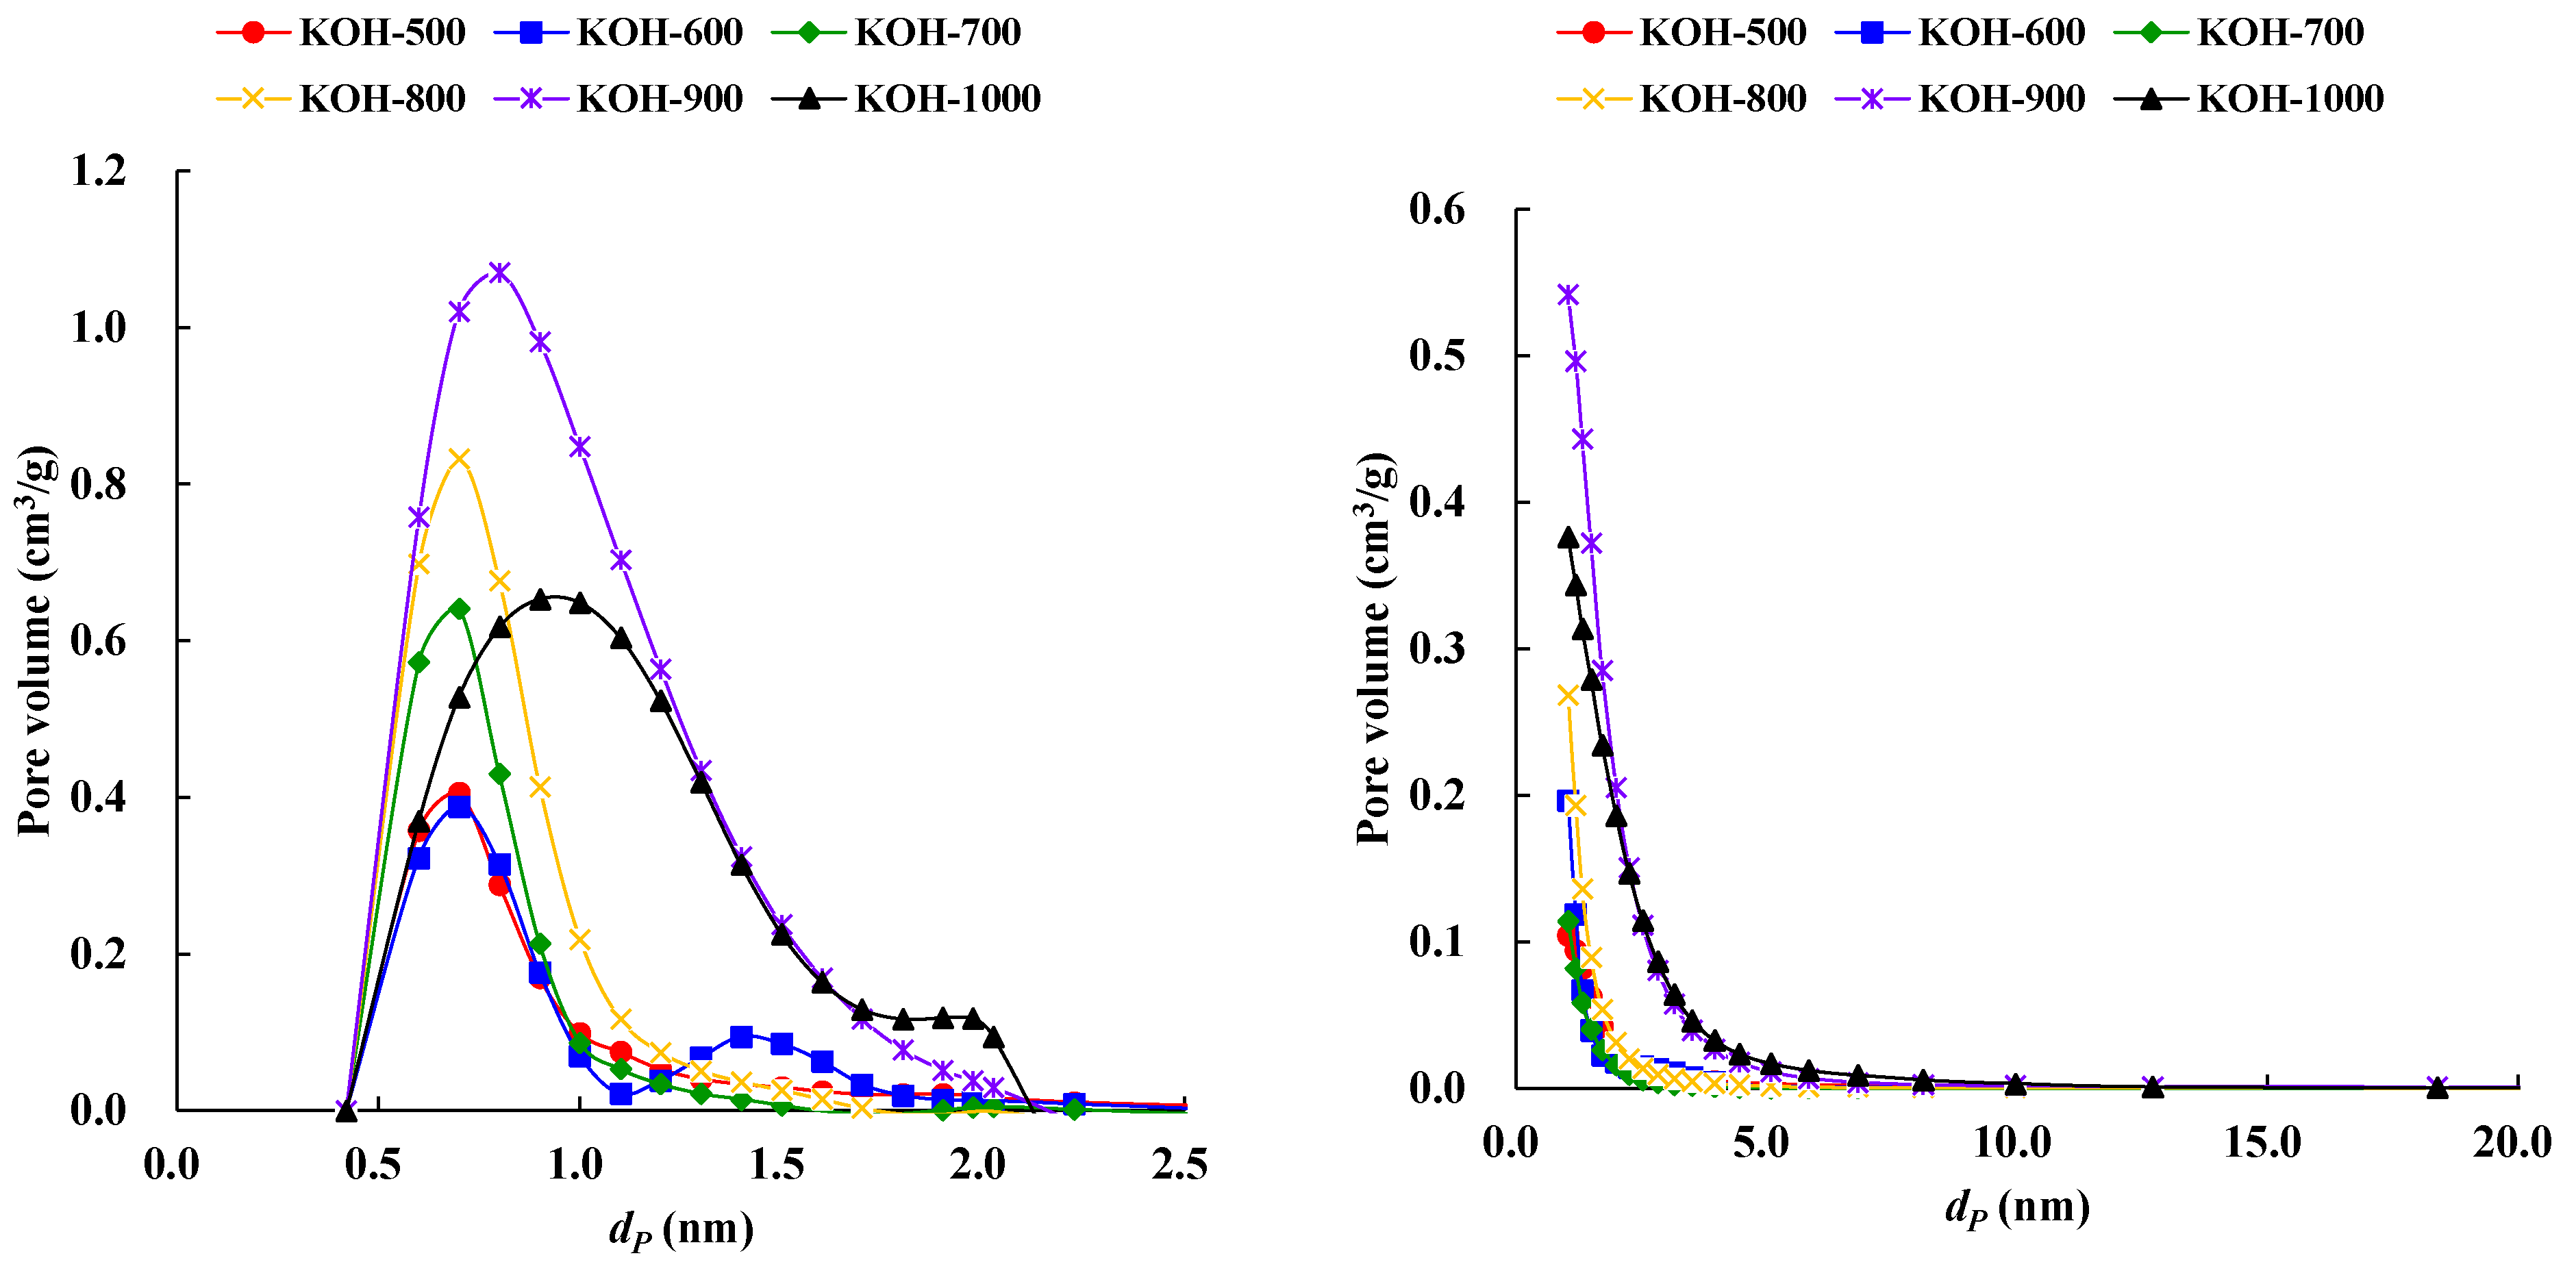
3.2. Surface Area and Porosity

The N2 adsorption isotherms of ACs prepared at different activation temperatures are shown in Figure 2. According to IUPAC classification, ACs synthesized at 500 to 800 °C exhibited conventional type I(a) adsorption isotherms (known as Langmuir) [30], indicating the presence of micropores [31], whereas at 900 and 1000 °C, a typical type I(b) isotherm was observed, revealing mesoporous structure at KOH-900 and KOH-1000 [32]. N2 adsorption increased gradually from 500 to 700 °C, then sharply at 800 and 900 °C. It was also observed that adsorption at low relative pressure increased remarkably as a vertical straight line, suggesting that microporous structure was well developed at 800 to 900 °C in ACs beneath high activation temperature. On the other hand, when the temperature reached 1000 °C, the amount of nitrogen adsorbed was reduced, virtually matching the temperature of 800 °C, implying that the BET surface area (SBET) was nearly identical to KOH-800.
Table 2 shows the BET surface area, pore volumes and porosity characteristics of ACs with KOH prepared at different activation temperatures. SBET showed the expected trend of increasing from 434 to 1790 m2/g with rising activation temperature from 500 to 900 °C, reaching its maximum value at 900 °C. When the activation temperature was raised to 1000 °C, the obtained AC SBET decreased to 1122 m2/g, the same as the AC prepared at 800 °C. The total pore volume (Vt) increased from 0.2089 to 0.8801 cm3/g at 500 to 900 °C and decreased to 0.6203 cm3/g at 1000 °C, following a similar trend as SBET of ACs. It is worth noting that although KOH-800 and KOH-1000 have almost equal SBET, the Vt of KOH-1000 was slightly greater than KOH-800 due to its mesoporous structure. In addition, the same phenomenon was also observed at the micropore volume (Vmic), which indicated a high correlation between Vt and Vmic with SBET while having less effect on mesoporous structures (Figure 3).
For the mesopore volume (Vmeso) of ACs estimation, three methods were applied as Vt-Vmic, the BJH method and the INNES method mentioned in Section 2.3. The calculated results and coefficient of determination of each method are shown in Figure S2 and Figure 4. All ACs presented clearly dominant microporosity based on Table 2 (Vmic/Vt = 84–91%) and N2 adsorption isotherms, which demonstrated that both the BJH method (R2 = 0.6623) and the INNES method (R2 = 0.6186) are inappropriate to determine Vmeso in this study. On the contrary, Vt-Vmic showed a higher R2 value, while Vmeso gradually increased with rising temperature and coincided with the N2 adsorption at P/P0 = 0.2~0.9.
The comparison of pore texture characteristics and the SBET of the activated carbon in this study and previous research results are summarized in Table 3. The ACs synthesized in this study represented higher SBET and Vt with a relative lower activator usage and holding time compared with other research. Additionally, Wu et al. (2005), Nagaraju et al. (2017) and Guo et al. (2020) used two-step activation, using carbonization to obtain char first [33,34,35]. Thus, ACs in this study are expected to consider higher activator usage, long activation time, and more preparation procedures that cause high cost and inefficiency in industrial applications.
Pore-size distribution (PSD) is also a crucial factor of ACs characteristics since it could affect the adsorption performance as an adsorbent or the efficiency of ionic transportation as a supercapacitor in most industrial applications. In general, effective ion–pore matching contributes to complete exploitation of the pores to develop the double layer structure, which is beneficial to better capacitance. To efficiently host the electrolyte ions in microporous or mesoporous carbon materials, it is necessary to develop pore size more precisely [40]. The PSD of ACs is shown in Figure 5 using the MP method and the BJH method, respectively. It was observed that the micropores of the ACs prepared at 500–800 °C were mostly distributed in the range of 0.4–1.7 nm. A significantly higher number of large micropores (1.4–2.0 nm) with diameters ranging from 0.4 to 2.0 nm were found at KOH-900 and KOH-1000 than at others. Since this range of pore size is larger than the size of the adsorbent nitrogen molecules, it is easier for nitrogen molecules to be adsorbed, which contributes to the high specific surface area. On the other hand, the mesopores were calculated to be distributed between 2 and 6 nm in KOH-900 and KOH-1000, which could be explained by the shape of the N2 adsorption isotherms.
According to Fu et al. (2020) and Mistar et al. (2020), the pore structure of ACs was mainly developed by volatile content release, gasification and the reaction of carbonates and/or oxides derived from KOH with carbon atoms [39,41]. The activation reaction mechanism of ACs with KOH is summarized as follows:
Cn + H2O = Cn−1 + CO + H2
CO + H2O = CO2 + H2
2KOH = K2O + H2O
K2O + CO2 = K2CO3
Cn + K2CO3 = Cn−2 + 2K + 3CO
Cn + K2O = Cn−1 + 2K + CO
The bamboo waste biomass began to decompose at about 360 °C as demonstrated in Figure S3. As a result, gaseous components such as CO, H2 and H2O were released by volatile decomposition. During this process, volatile components of biomass escaped from the carbon matrix, which developed initial microporous structures in the ACs. Meanwhile, gaseous molecules facilitated channel formation to provide sufficient space for inner volatile emission and the diffusion of outside activation chemicals. As the activation temperature increased, the diffusion process was accelerated and further promoted the activation reaction [41]. In addition, gaseous components such as CO, H2 and H2O were also able to cause gasification reactions (aqueous gas shift reactions) with carbon atoms, as shown in Equations (1) and (2) [42,43]. Since the KOH decomposition reaction in Equation (3) occurred below 500 °C, the SBET was expected to gradually increase in the temperature range of 500–800 °C because the reaction was accelerated by the formation of K2O, which would catalyze the gasification reaction as shown in Equation (4) and further produce K2CO3, confirming the catalytic effect at higher temperatures [36]. Therefore, it was assumed that the increased SBET at this stage mainly contributed to the release of volatiles by pyrolysis and a small amount of gasification reaction. This is consistent with the results of a nearly 20% activated carbon yield. In addition, the activator residual rate increased because the temperature was insufficient to decompose K2O and K2CO3 or to facilitate their complete interaction with carbon atoms (Figure S1). The SBET increased rapidly from 800 to 900 °C, reaching a maximum of about 1790 m2/g at 900 °C. At 600 to 800 °C, the potassium oxides and carbonates shown in Equations (5) and (6) reacted with carbon atoms, breaking down the chemical bonds between carbon atoms to form massive fragments that caused the collapse of the carbon matrix structure to create amorphous carbon. As a result, the carbon layers overlapped and micropores developed, which contributed to the high SBET [44]. The activator residual rate and activated carbon yield decreased in the high temperature range as described in Figure S1, proving that carbon atoms were consumed in large quantities due to their reactions with potassium oxides and carbonates. It was also reported that the metallic potassium atoms produced in the activation process inhibited the formation of tar, a by-product of the pyrolysis reaction, and/or promoted its secondary decomposition. Moreover, H2 has a catalytic effect on the decomposition of volatile components. It could also cleave large organic molecules into low molecular weight and be more easily released out of the reaction system, thus making them less likely to accumulate in or block the pores.
Since the activation temperature was much higher than the KOH decomposition temperature at 1000 °C, it was highly likely that the potassium compounds were volatilized before participating in the reaction. This is also consistent with the extremely low activator residue at 1000 °C. Hayashi et al. (2021) used K2CO3 as an activator and reported that when the activation temperature reached 900 °C, it exceeded the melting point of K2CO3 (891 °C), which led to easier reaction with the carbon atoms, resulting in excessive carbon consumption and a lower yield [45]. The increase in mesopores in the above temperature range was due to high temperatures accelerating the reaction rate of carbon atoms with potassium compounds, consuming more carbon atoms, and widening the pore size based on the existing micropores. It was also considered that the carbon atoms were polymerized by dehydrogenation and breaking of the original bonds, since volatiles were more easily detached at higher temperatures. Some other researchers also reported that the intercalation of potassium atoms into the carbon matrix expanded the interlayer and widened the gap between the carbon layers, resulting in the formation of slit-shaped mesopores [42,46]. The total pore volume of KOH-1000 was higher than that of KOH-800, despite lower SBET, suggesting the breaking of micro and mesoporous structures. Table 2 indicates that the average pore diameter (dave) increased from KOH-800 to KOH-1000, indicating the formation of larger pores. Fu et al. (2012) also suggested that micropores and mesopores developed as the activation temperature increased from 600 to 900 °C [42]. They also mentioned that the total pore volume and micropore volume decreased, while the mesopore volume increased after 900 °C, which suggested the destruction of the pore structure or the melting of carbon particles at high temperatures.

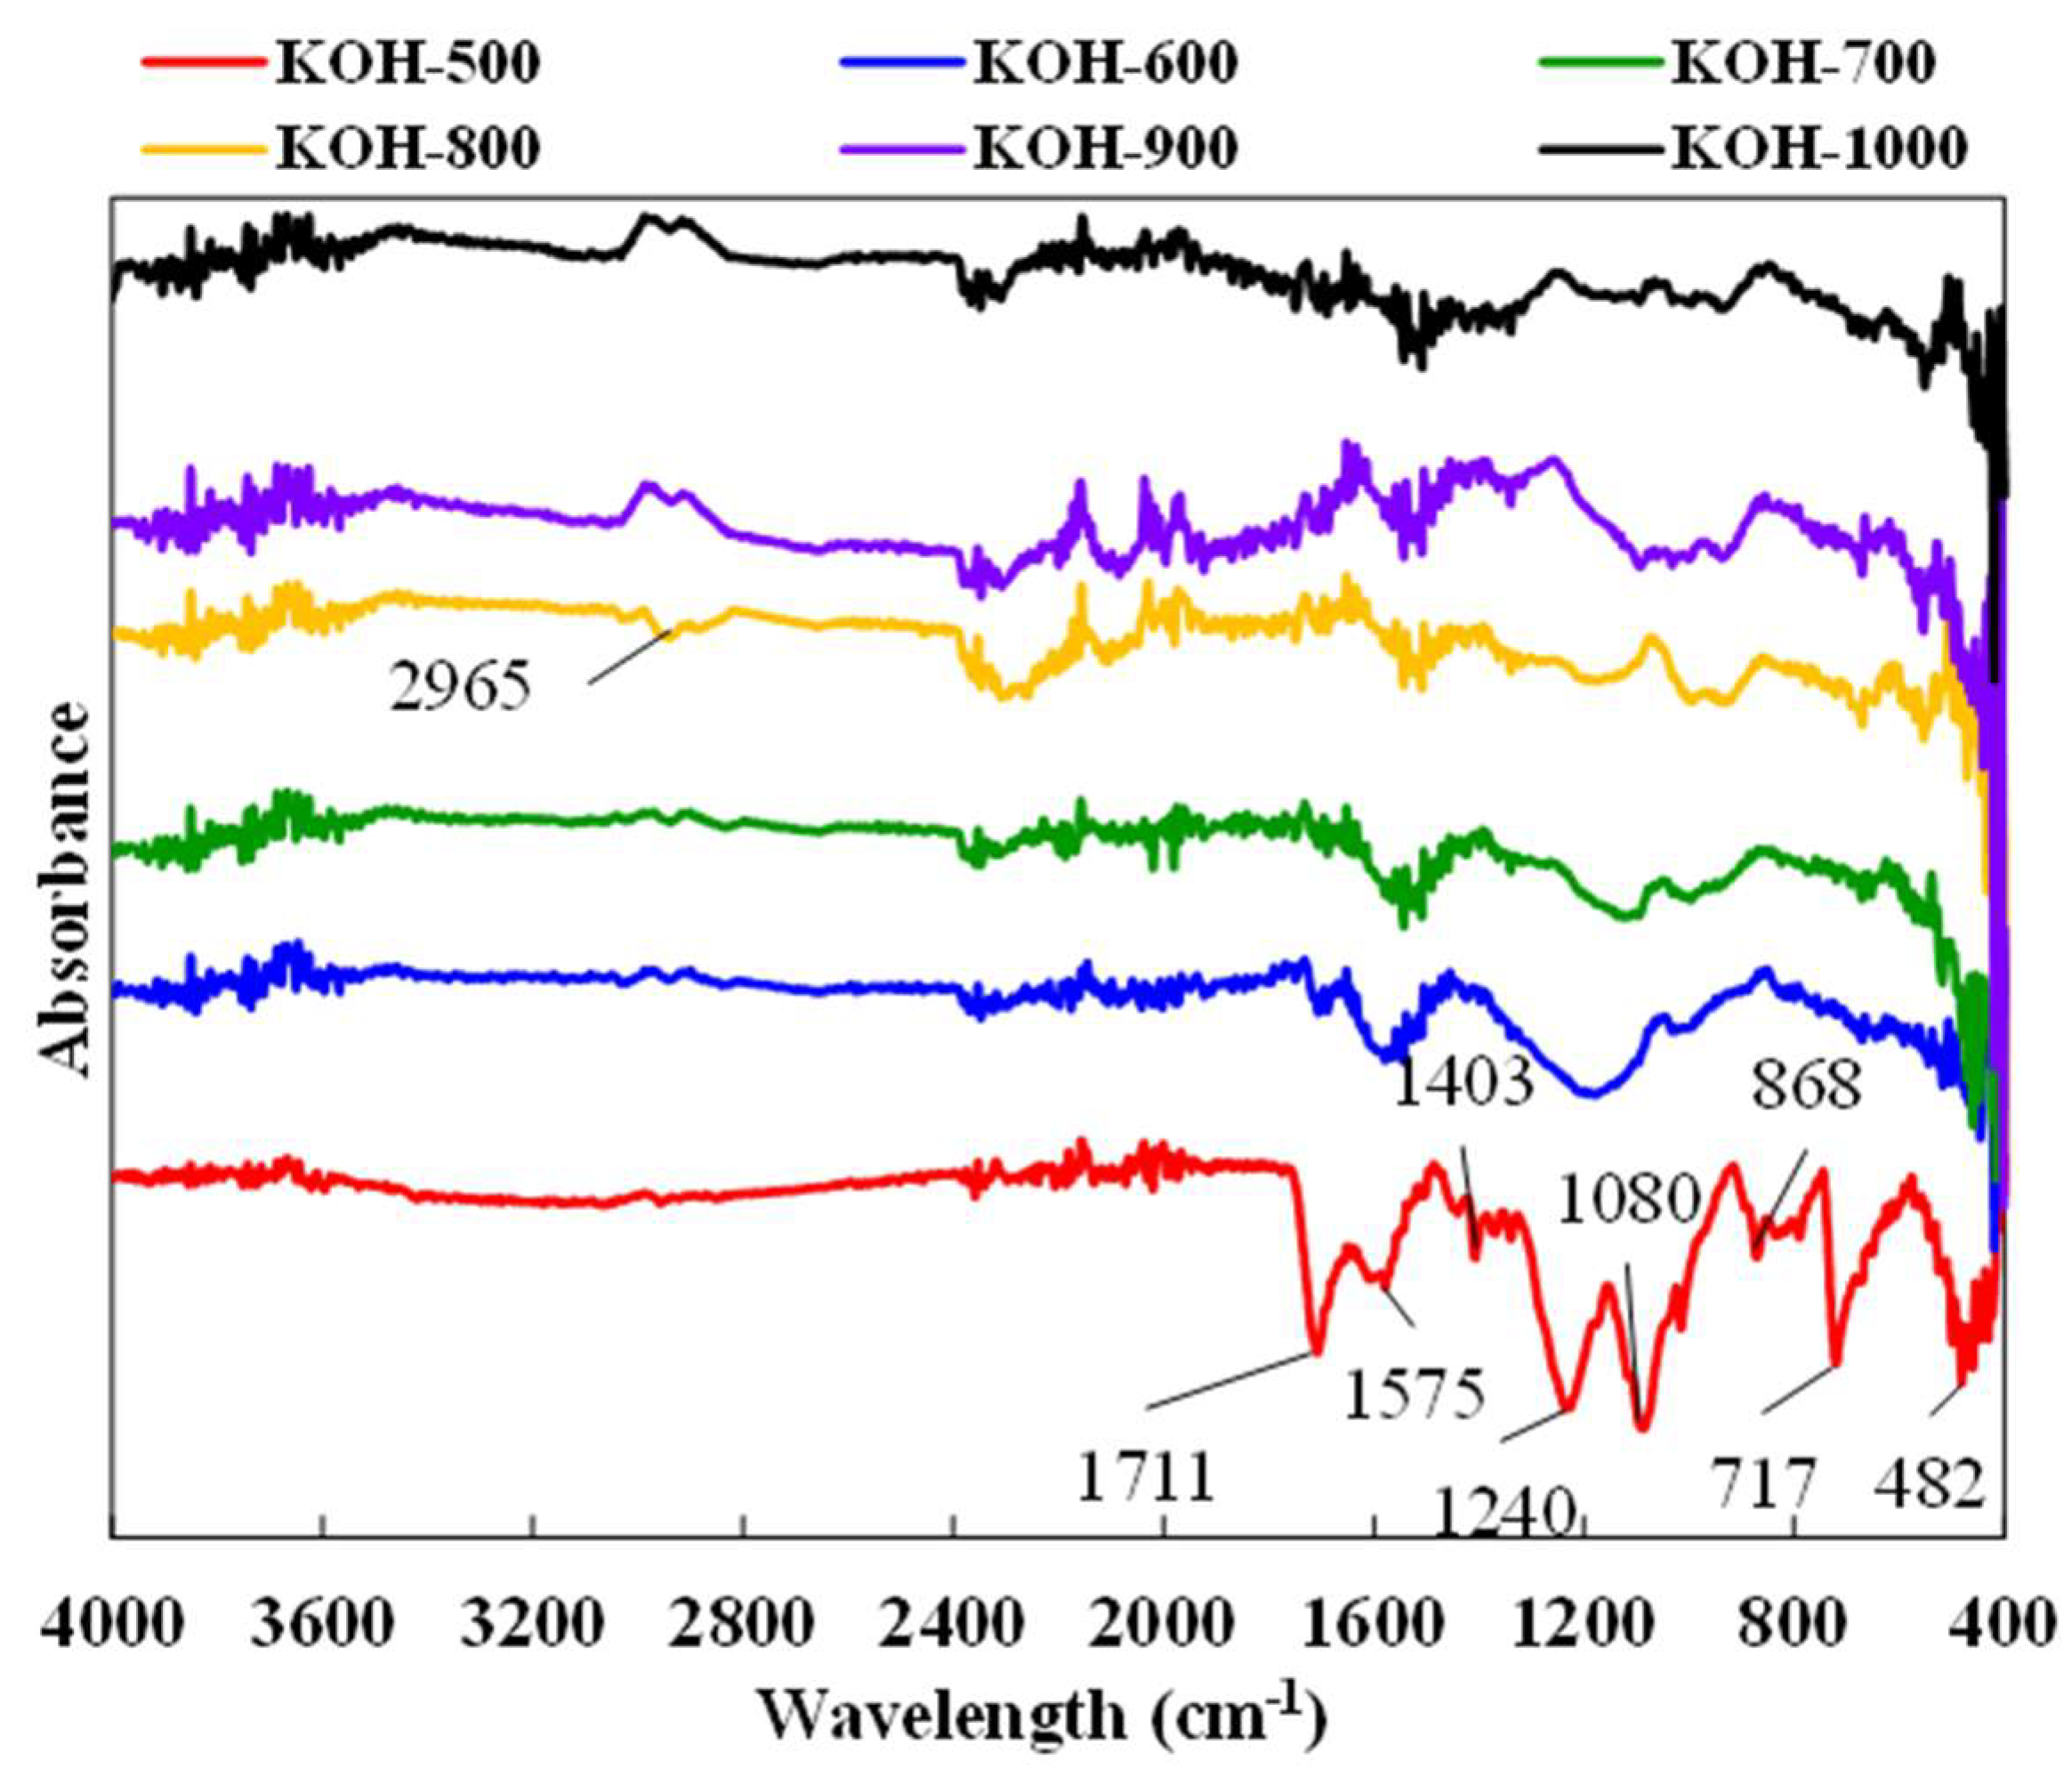
3.3. Surface Chemistry

The functional groups on the ACs surface were determined by FTIR spectrometry and are shown in Figure 6. Compared to others, KOH-500 showed several strong adsorption peaks at different wavelengths, indicating more functional groups on the surface of ACs. The bands located at 482 cm−1, 717 cm−1 and 868 cm−1 correspond to the C-H stretching vibration of aliphatic and/or aromatic groups [47]. The strong adsorption peaks observed at 1080 cm−1 and 1240 cm−1 were ascribable to the C–O–C stretching vibration of alcohols, ethers, phenols or O–H bending vibration [28,35]. The bands at 1575 cm−1 are usually related to C=O, C–O (carboxyl, aldehyde, amide bond) and/or C=C (alkene) stretching vibration, while the band at 1711 cm−1 can be attributed to C=O [48,49]. All spectra of oxygen-containing functional groups showed a decreased trend and widened with increasing activation temperature, demonstrating that alcohols, ethers, phenols and carboxylic acid decomposed at higher temperatures. On the other hand, the new band located at 2965 cm−1 from 800–1000 °C was related to C–H vibration. This revealed that the contents of aliphatic structures increased with increasing activation temperature, while oxygen-containing structures such as -OCH3- dissociated under higher temperatures [32,50,51].

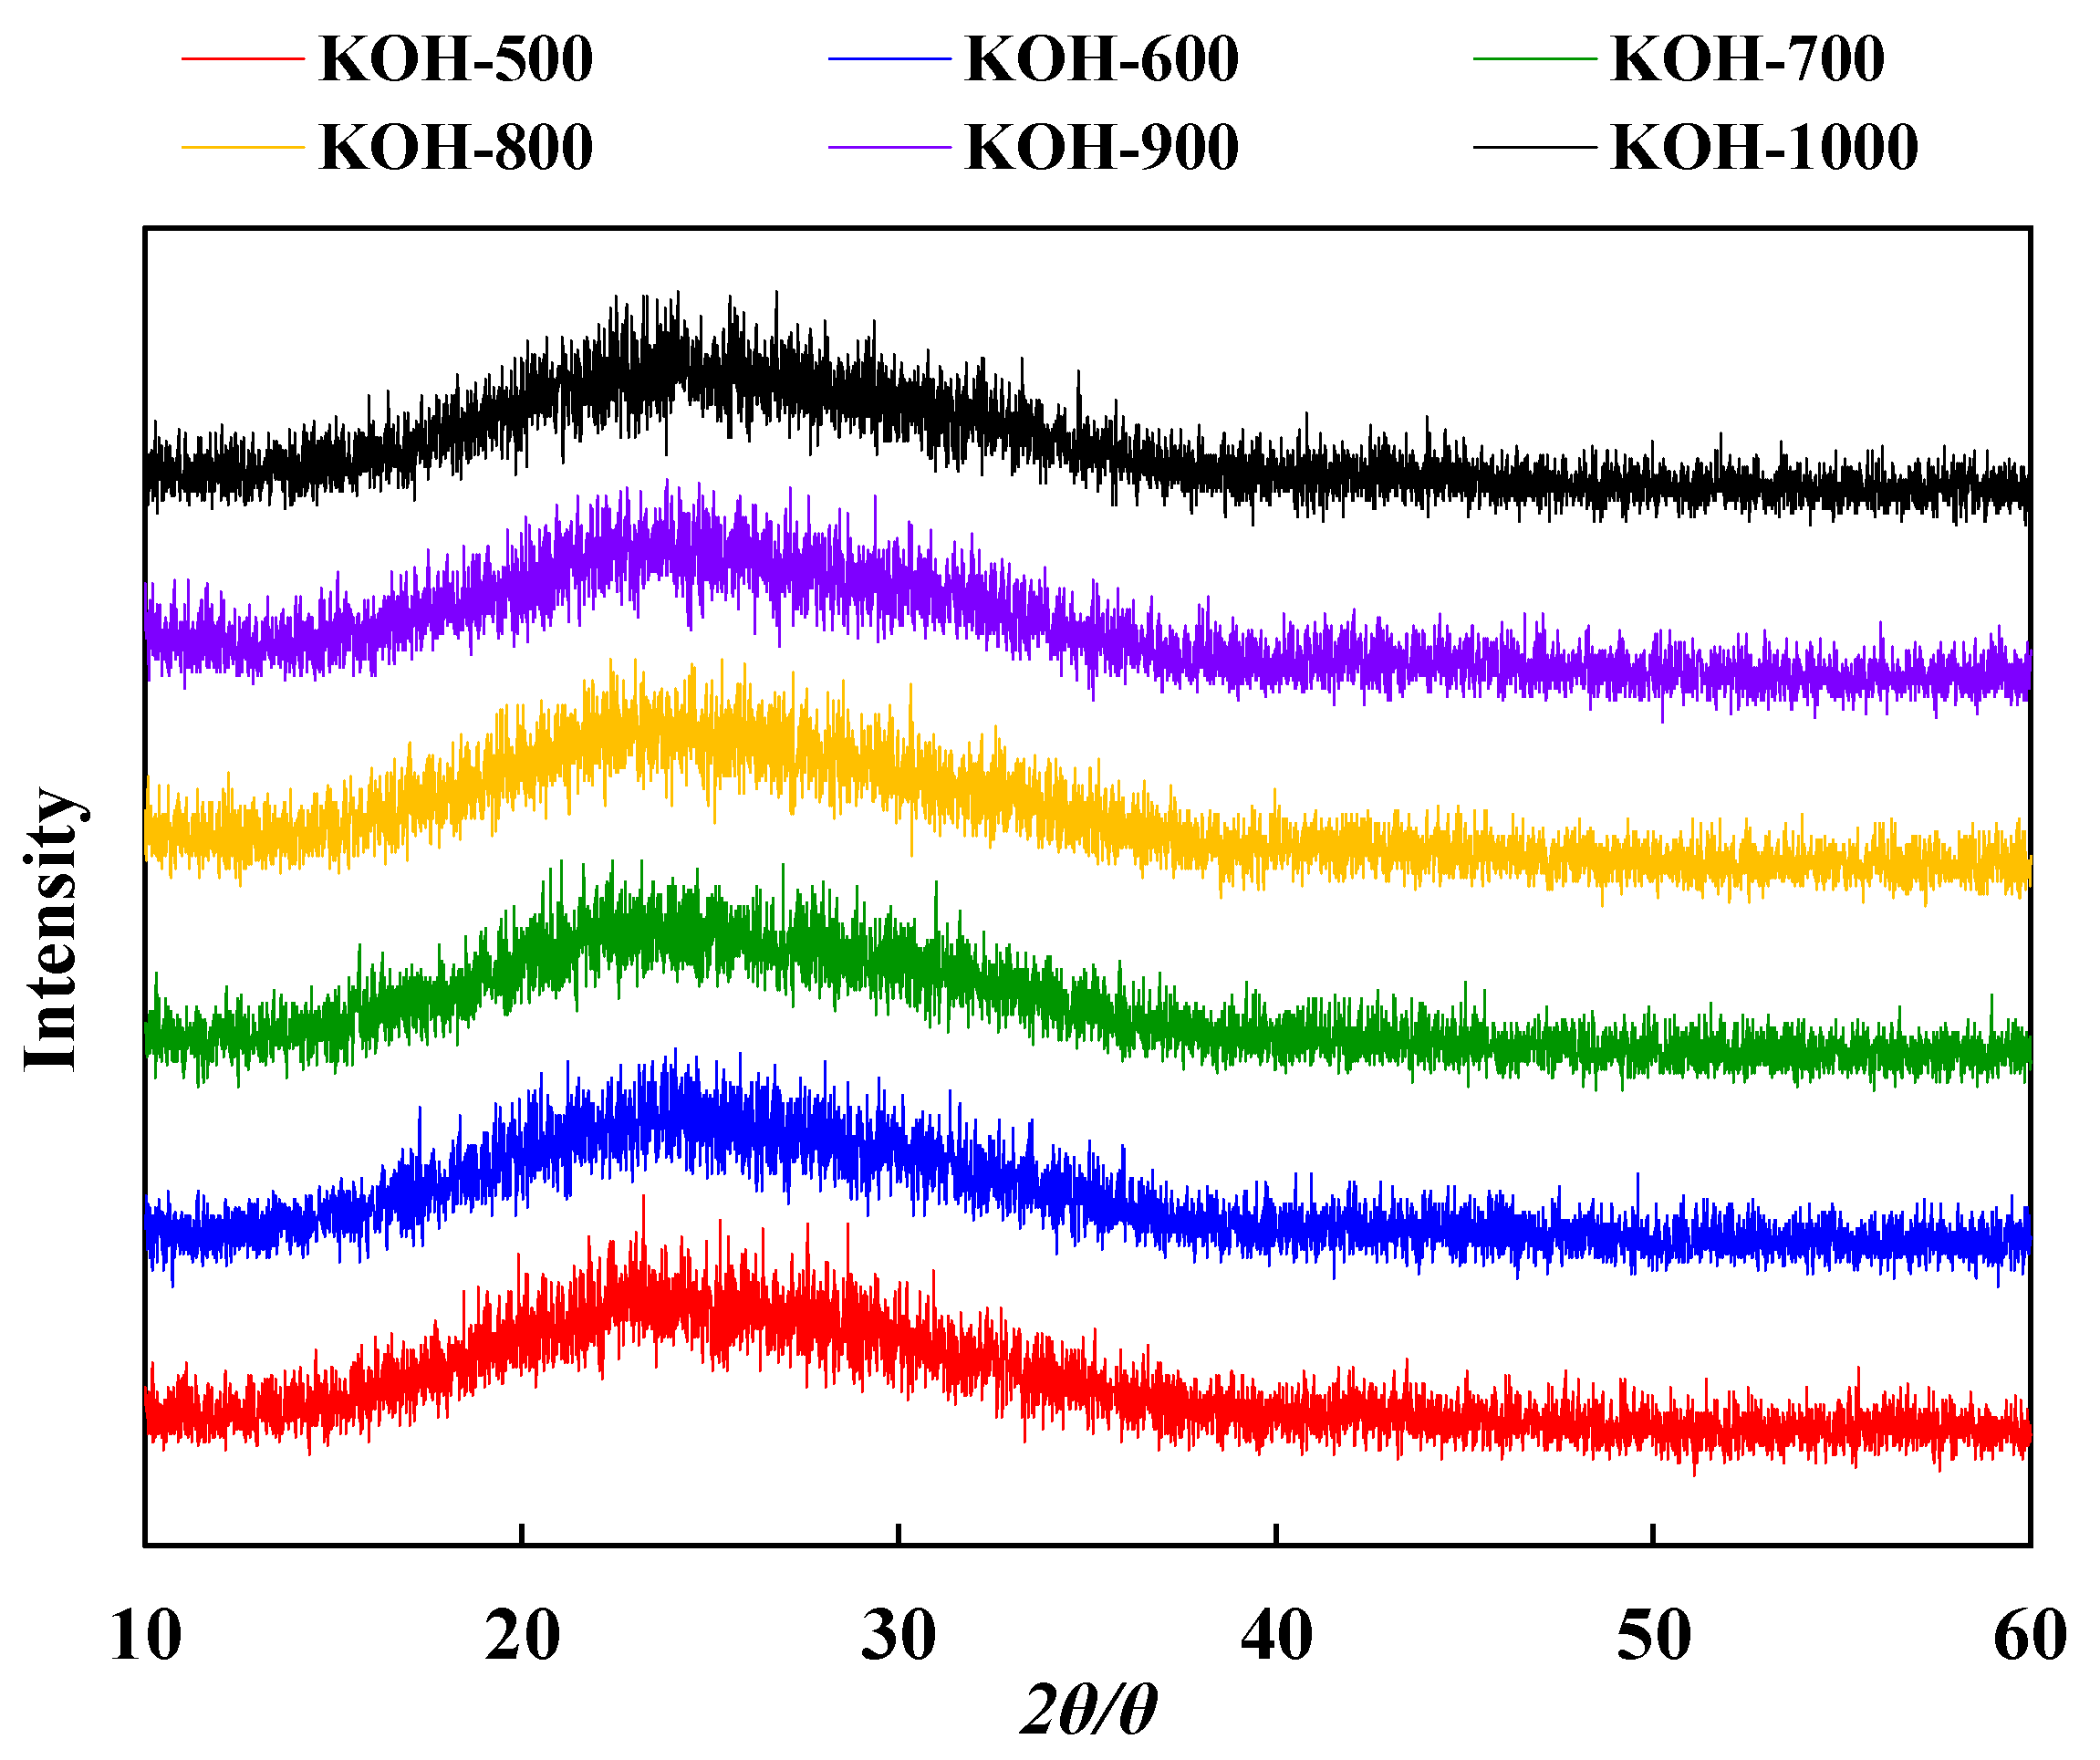
3.4. Structure Evolution of Activated Carbon

XRD was used to analyze the crystalline phase of the activated carbon. Its patterns of ACs with a scan degree from 10 to 60° are displayed in Figure 7. One broad diffraction peak at around 23° indicates the 002 plane of graphitic carbon materials. This broad peak revealed the dominant amorphous structure. This disordered arrangement of carbon atoms was also observed from SEM images and a high micropore volume ratio (84–91%) that confirmed the presence of a slit-shaped microporous structure. These findings proved that carbon compounds were successfully synthesized from biomass waste [52,53,54].

4. Conclusions

Activated carbon with an over 80% predominant microporous structure was generated from moso bamboo waste in this study using a single-stage of KOH chemical activation. SBET and Vt increased with increasing temperature from 500 to 900 °C, reaching a maximum at 900 °C. The higher activation temperature accelerated the etching effect of KOH and redox reaction with carbon atoms, which caused the collapse or crumbling of the pore structure and surface melting. In addition, the micropore volume (Vmic) showed a higher correlation between Vt and Vmic with SBET, with less effect on the mesoporous structure.

Supplementary Materials

The following supporting information can be downloaded at: https://www.mdpi.com/article/10.3390/pr10091712/s1.

Author Contributions

Conceptualization Y.G., Q.W.; methodology: Y.G.; investigation: Y.G.; data curation: Y.G.; writing—original draft preparation: Y.G.; writing—review and editing: Y.G., Q.W.; supervision: Q.W.; project administration: Q.W.; funding acquisition: Q.W. All authors have read and agreed to the published version of the manuscript.

Funding

This study was partially supported by the Special Funds for Basic Research (B) (No.22H03747, FY2022-FY2024) of Grant-in-Aid for Scientific Research of the Japanese Ministry of Education, Culture, Sports, Science and Technology (MEXT) and funding from Yamada Homes Co., Ltd. of Japan. The APC was funded by the correspondence author.

Institutional Review Board Statement

Not applicable.

Informed Consent Statement

Not applicable.

Data Availability Statement

The data presented in this study are available on request from the corresponding author. The data are not publicly available since these data are published for the first time. The authors have no problems providing them on request.

Acknowledgments

Parts of this study were supported. Y.G. thanks, the Hirose Foundation, Japan for a grant that enabled the completion of this study.

Conflicts of Interest

The authors declare that they have no known competing financial interests or personal relationships that could have influenced the research presented in this study.

References

  1. UNEP (United Nations Environment Programme). Converting Waste Agricultural Biomass into a Resource; United Nations Environment Programme Division of Technology, Industry and Economics International Environmental Technology Centre: Osaka/Shiga, Japan, 2015; Available online: www.unep.org/ietc/Portals/136/Publications/Waste%20Management/WasteAgriculturalBiomassEST_Compendium.pdf (accessed on 20 August 2022).
  2. Chun, A.M.S. Ground Rules for Humanitarian Design; Chun, A.M.S., Brisson, E., Eds.; Wiley Publishers: London, UK, 2015; ISBN 978-1-118-36159-7. [Google Scholar]
  3. Sha, T.; Liu, J.; Sun, M.; Li, L.; Bai, J.; Hu, Z.; Zhou, M. Green and low-cost synthesis of nitrogen-doped graphene-like mesoporous nanosheets from the biomass waste of okara for the amperometric detection of vitamin C in real samples. Talanta 2019, 200, 300–306. [Google Scholar] [CrossRef]
  4. Xu, C.; Nasrollahzadeh, M.; Selva, M.; Issaabadi, Z.; Luque, R. Waste-to-wealth: Biowaste valorization into valuable bio (nano) materials. Chem. Soc. Rev. 2019, 48, 4791–4822. [Google Scholar] [CrossRef] [PubMed]
  5. Tripathi, N.; Hills, C.D.; Singh, R.S.; Atkinson, C.J. Biomass waste utilisation in low-carbon products: Harnessing a major potential resource. NPJ Clim. Atmos. Sci. 2019, 2, 35. [Google Scholar] [CrossRef]
  6. Zhou, C.; Wang, Y. Recent progress in the conversion of biomass wastes into functional materials for value-added applications. Sci. Technol. Adv. Mater. 2020, 21, 787–804. [Google Scholar] [CrossRef] [PubMed]
  7. Tiwari, S.K.; Bystrzejewski, M.; De Adhikari, A.; Huczko, A.; Wang, N. Methods for the conversion of biomass waste into value-added carbon nanomaterials: Recent progress and applications. Prog. Energy Combust. Sci. 2022, 92, 101023. [Google Scholar] [CrossRef]
  8. Hadoun, H.; Sadaoui, Z.; Souami, N.; Sahel, D.; Toumert, I. Characterization of mesoporous carbon prepared from date stems by H 3 PO 4 chemical activation. Appl. Surf. Sci. 2013, 280, 1–7. [Google Scholar] [CrossRef]
  9. Chandra, T.C.; Mirna, M.M.; Sunarso, J.; Sudaryanto, Y.; Ismadji, S. Activated carbon from durian shell: Preparation and characterization. J. Taiwan Inst. Chem. Eng. 2009, 40, 457–462. [Google Scholar] [CrossRef]
  10. Heidarinejad, Z.; Dehghani, M.H.; Heidari, M.; Javedan, G.; Ali, I.; Sillanpää, M. Methods for preparation and activation of activated carbon: A review. Environ. Chem. Lett. 2020, 18, 393–415. [Google Scholar] [CrossRef]
  11. Ouki, S.K.; Neufeld, R.D. Use of activated carbon for the recovery of chromium from industrial wastewaters. J. Chem. Technol. Biotechnol. 1997, 70, 3–8. [Google Scholar] [CrossRef]
  12. Valdés, H.; Sánchez-Polo, M.; Rivera-Utrilla, J.; Zaror, C.A. Effect of ozone treatment on surface properties of activated carbon. Langmuir 2002, 18, 2111–2116. [Google Scholar] [CrossRef]
  13. Cazetta, A.L.; Spessato, L.; Almeida, V.C. The use of chemometric tools for screening and optimization of variables in the preparation and application of carbon-based materials. J. Taiwan Inst. Chem. Eng. 2021, 121, 321–336. [Google Scholar] [CrossRef]
  14. Weber, F.J.; Hartmans, S. Use of activated carbon as a buffer in biofiltration of waste gases with fluctuating concentrations of toluene. Appl. Microbiol. Biotechnol. 1995, 43, 365–369. [Google Scholar] [CrossRef]
  15. Ukanwa, K.S.; Patchigolla, K.; Sakrabani, R.; Anthony, E.; Mandavgane, S. A Review of Chemicals to Produce Activated Carbon from Agricultural Waste Biomass. Sustainability 2019, 11, 6204. [Google Scholar] [CrossRef]
  16. Wang, Z.; Stapleton, C. Phyllostachys Edulis. Flora of China; Missouri Botanical Garden: St. Louis, MO, USA; Harvard University Herbaria: Cambridge, MA, USA, 2008. [Google Scholar]
  17. Nunes, L.J.R.; Matias, J.C.O.; Catalão, J.P.S. Biomass combustion systems: A review on the physical and chemical properties of the ashes. Renew. Sustain. Energy Rev. 2016, 53, 235–242. [Google Scholar] [CrossRef]
  18. Iqbal, M.A.; Kim, K.H. Sampling, pretreatment, and analysis of particulate matter and trace metals emitted through charcoal combustion in cooking activities. TrAC-Trends Anal. Chem. 2016, 76, 52–59. [Google Scholar] [CrossRef]
  19. Woolf, D.; Amonette, J.E.; Street-Perrott, F.A.; Lehmann, J.; Joseph, S. Sustainable biochar to mitigate global climate change. Nat. Commun. 2010, 1, 1–9. [Google Scholar] [CrossRef]
  20. Chen, D.; Liu, D.; Zhang, H.; Chen, Y.; Li, Q. Bamboo pyrolysis using TG-FTIR and a lab-scale reactor: Analysis of pyrolysis behavior, product properties, and carbon and energy yields. Fuel 2015, 148, 79–86. [Google Scholar] [CrossRef]
  21. 20 Uses of Bamboo For Home, Office and Yourself (Infographic)-Bamboooz. Available online: http://www.bamboooz.com/20-uses-bamboo/ (accessed on 20 August 2022).
  22. Lan, F.L.; Lay, H.L.; Teng, W.F. Study on the moso bamboo charcoal property. Crop Environ. Bioinform. 2008, 5, 180–186. [Google Scholar]
  23. Wang, S.; Tsai, M.; Lo, S.; Tsai, M. Effects of manufacturing conditions on the adsorption capacity of heavy metal ions by Makino bamboo charcoal. Bioresour. Technol. 2008, 99, 7027–7033. [Google Scholar] [CrossRef]
  24. Jiang, S. Training Manual of Bamboo Charcoal for Producers and Consumers; Bamboo Engineering Research Center, Nanjing Forestry University: Nanjing, China, 2004; Available online: chrome-extension://efaidnbmnnnibpcajpcglclefindmkaj/https://www.terrapreta.bioenergylists.org/files/Training%20Manual.pdf (accessed on 20 August 2022).
  25. Horikawa, T.; Kitakaze, Y.; Sekida, T.; Hayashi, J.; Katoh, M. Characteristics and humidity control capacity of activated carbon from bamboo. Bioresour. Technol. 2010, 101, 3964–3969. [Google Scholar] [CrossRef]
  26. Huang, P.H.; Jhan, J.W.; Cheng, Y.M.; Cheng, H.H. Effects of carbonization parameters of Moso-bamboo-based porous charcoal on capturing carbon dioxide. Sci. World J. 2014, 2014, 937867. [Google Scholar] [CrossRef] [PubMed] [Green Version]
  27. Mariana, M.; Mistar, E.M.; Alfatah, T.; Supardan, M.D. High-porous activated carbon derived from Myristica fragrans shell using one-step KOH activation for methylene blue adsorption. Bioresour. Technol. Rep. 2021, 16, 100845. [Google Scholar] [CrossRef]
  28. Angin, D. Production and characterization of activated carbon from sour cherry stones by zinc chloride. Fuel 2014, 115, 804–811. [Google Scholar] [CrossRef]
  29. Lee, J.H.; Heo, Y.J.; Park, S.J. Effect of silica removal and steam activation on extra-porous activated carbons from rice husks for methane storage. Int. J. Hydrogen Energy 2018, 43, 22377–22384. [Google Scholar] [CrossRef]
  30. Alfatah, T.; Mistar, E.M.; Supardan, M.D. Porous structure and adsorptive properties of activated carbon derived from Bambusa vulgaris striata by two-stage KOH/NaOH mixture activation for Hg2+ removal. J. Water Process Eng. 2021, 43, 102294. [Google Scholar] [CrossRef]
  31. Nayak, A.; Bhushan, B.; Gupta, V.; Sharma, P. Chemically activated carbon from lignocellulosic wastes for heavy metal wastewater remediation: Effect of activation conditions. J. Colloid Interface Sci. 2017, 493, 228–240. [Google Scholar] [CrossRef]
  32. Hu, Z.; Li, X.; Tu, Z.; Wang, Y.; Dacres, O.D.; Sun, Y.; Yao, H. ‘Thermal dissolution carbon enrichment’ treatment of biomass wastes: Supercapacitor electrode preparation using the residue. Fuel Process. Technol. 2019, 205, 106430. [Google Scholar] [CrossRef]
  33. Wu, F.C.; Tseng, R.L.; Juang, R.S. Comparisons of porous and adsorption properties of carbons activated by steam and KOH. J. Colloid Interface Sci. 2005, 283, 49–56. [Google Scholar] [CrossRef]
  34. Nagaraju, G.; Lim, J.H.; Cha, S.M.; Yu, J.S. Three-dimensional activated porous carbon with meso/macropore structures derived from fallen pine cone flowers: A low-cost counter electrode material in dye-sensitized solar cells. J. Alloys Compd. 2017, 693, 1297–1304. [Google Scholar] [CrossRef]
  35. Guo, Y.; Tan, C.; Sun, J.; Li, W.; Zhang, J.; Zhao, C. Porous activated carbons derived from waste sugarcane bagasse for CO2 adsorption. Chem. Eng. J. 2020, 381, 122736. [Google Scholar] [CrossRef]
  36. Li, H.; Shi, F.; An, Q.; Zhai, S.; Wang, K.; Tong, Y. Three-dimensional hierarchical porous carbon derived from lignin for supercapacitors: Insight into the hydrothermal carbonization and activation. Int. J. Biol. Macromol. 2021, 166, 923–933. [Google Scholar] [CrossRef]
  37. Yang, L.; Feng, Y.; Cao, M.; Yao, J. Two-step preparation of hierarchical porous carbon from KOH-activated wood sawdust for supercapacitor. Mater. Chem. Phys. 2019, 238, 121956. [Google Scholar] [CrossRef]
  38. Wan, L.; Song, P.; Liu, J.; Chen, D.; Xiao, R.; Zhang, Y.; Chen, J.; Xie, M.; Du, C. Facile synthesis of nitrogen self-doped hierarchical porous carbon derived from pine pollen via MgCO3 activation for high-performance supercapacitors. J. Power Sources 2019, 438, 227013. [Google Scholar] [CrossRef]
  39. Mistar, E.M.; Alfatah, T.; Supardan, M.D. Synthesis and characterization of activated carbon from Bambusa vulgaris striata using two-step KOH activation. J. Mater. Res. Technol. 2020, 9, 6278–6286. [Google Scholar] [CrossRef]
  40. Herde, Z.D.; Dharmasena, R.; Sumanasekera, G.; Tumuluru, J.S.; Satyavolu, J. Impact of hydrolysis on surface area and energy storage applications of activated carbons produced from corn fiber and soy hulls. Carbon Resour. Convers. 2020, 3, 19–28. [Google Scholar] [CrossRef]
  41. Fu, J.; Zhang, J.; Jin, C.; Wang, Z.; Wang, T.; Cheng, X.; Ma, C. Effects of temperature, oxygen and steam on pore structure characteristics of coconut husk activated carbon powders prepared by one-step rapid pyrolysis activation process. Bioresour. Technol. 2020, 310, 123413. [Google Scholar] [CrossRef]
  42. Fu, P.; Hu, S.; Xiang, J.; Yi, W.; Bai, X.; Sun, L.; Su, S. Evolution of char structure during steam gasification of the chars produced from rapid pyrolysis of rice husk. Bioresour. Technol. 2012, 114, 691–697. [Google Scholar] [CrossRef]
  43. Norouzi, S.; Heidari, M.; Alipour, V.; Rahmanian, O.; Fazlzadeh, M.; Mohammadi-Moghadam, F.; Nourmoradi, H.; Goudarzi, B.; Dindarloo, K. Preparation, characterization and Cr(VI) adsorption evaluation of NaOH-activated carbon produced from Date Press Cake; an agro-industrial waste. Bioresour. Technol. 2018, 258, 48–56. [Google Scholar] [CrossRef]
  44. Ikuo, A. Production Methods of Activated Carbon. No. 225. 2006, pp. 378–381. Available online: chrome-extension://efaidnbmnnnibpcajpcglclefindmkaj/https://www.jstage.jst.go.jp/article/tanso1949/2006/225/2006_225_373/_pdf (accessed on 28 February 2022).
  45. Hayashi, J.; Hasegawa, I.; Hagihara, T.; Takara, T. Production of activated carbon with a large specific surface area from banana peel and its methane adsorption ability. Carbon 2021, 176, 656. [Google Scholar] [CrossRef]
  46. Li, Y.; Zhang, D.; Zhang, Y.; He, J.; Wang, Y.; Wang, K.; Xu, Y.; Li, H.; Wang, Y. Biomass-derived microporous carbon with large micropore size for high-performance supercapacitors. J. Power Sources 2020, 448, 227396. [Google Scholar] [CrossRef]
  47. Wang, Q.; Tuohedi, N. Polyurethane foams and bio-polyols from liquefied cotton stalk agricultural waste. Sustainability 2020, 12, 4214. [Google Scholar] [CrossRef]
  48. Chen, S.; Xia, Y.; Zhang, B.; Chen, H.; Chen, G.; Tang, S. Disassembly of lignocellulose into cellulose, hemicellulose, and lignin for preparation of porous carbon materials with enhanced performances. J. Hazard. Mater. 2020, 408, 124956. [Google Scholar] [CrossRef] [PubMed]
  49. Al Bahri, M.; Calvo, L.; Gilarranz, M.A.; Rodriguez, J.J. Activated carbon from grape seeds upon chemical activation with phosphoric acid: Application to the adsorption of diuron from water. Chem. Eng. J. 2012, 203, 348–356. [Google Scholar] [CrossRef]
  50. Qin, C.; Wang, S.; Wang, Z.; Ji, K.; Wang, S.; Zeng, X.; Liu, G. Hierarchical porous carbon derived from Gardenia jasminoides Ellis flowers for high performance supercapacitor. J. Energy Storage 2021, 33, 102061. [Google Scholar] [CrossRef]
  51. Byamba-Ochir, N.; Shim, W.G.; Balathanigaimani, M.S.; Moon, H. Highly porous activated carbons prepared from carbon rich Mongolian anthracite by direct NaOH activation. Appl. Surf. Sci. 2016, 379, 331–337. [Google Scholar] [CrossRef]
  52. Shi, M.; Xin, Y.; Chen, X.; Zou, K.; Jing, W.; Sun, J.; Liu, Y. Coal-derived porous activated carbon with ultrahigh specific surface area and excellent electrochemical performance for supercapacitors. J. Alloys Compd. 2021, 859, 157856. [Google Scholar] [CrossRef]
  53. Lu, W.; Cao, X.; Hao, L.; Zhou, Y.; Wang, Y. Activated carbon derived from pitaya peel for supercapacitor applications with high capacitance performance. Mater. Lett. 2020, 264, 127339. [Google Scholar] [CrossRef]
  54. Wan, L.; Chen, D.; Liu, J.; Zhang, Y.; Chen, J.; Du, C.; Xie, M. Facile preparation of porous carbons derived from orange peel via basic copper carbonate activation for supercapacitors. J. Alloys Compd. 2020, 823, 153747. [Google Scholar] [CrossRef]
Figure 1. Scanning electron microscopy images of (a,b) char carbonized at 900 °C and ACs after activation at (c) 500 °C, (d) 600 °C, (e) 700 °C, (f) 800 °C, (g) 900 °C and (h) 1000 °C.
Processes 10 01712 g001
Figure 2. N2 adsorption isotherms of KOH ACs prepared at different activation temperatures.
Processes 10 01712 g002
Figure 3. Correlation of activation temperature correlation of SBET with Vt, Vmic, Vmeso.
Processes 10 01712 g003
Figure 4. Correlation of activation temperature and mesopore volume evaluated by three methods.
Processes 10 01712 g004
Figure 5. Micropore and mesopore distribution of KOH activated carbon prepared at different temperatures.
Processes 10 01712 g005
Figure 6. FTIR spectra of KOH ACs prepared at different activation temperatures.
Processes 10 01712 g006
Figure 7. XRD patterns of ACs prepared at different activation temperatures.
Processes 10 01712 g007
Table 1. The result of analysis of Phyllostachys edulis (wt.%).
ParameterValue
Proximate analysisMoisture7.0
Volatile Matter81.0
Ash0.2
Fixed Carbon11.8
Ultimate analysisC49.0
H6.0
N0.3
O44.5
S0.0
Lignocellulosic analysisHolocellulose72.4
Lignin27.6
Table 2. The specific surface area, pore volumes of ACs with KOH prepared at different temperatures.
SBET (m2/g)Vt (cm3/g)Vmic (cm3/g)Vmeso (cm3/g)Vmic/Vt (%)dave (nm)
KOH-100011220.62030.5250.095484.632.16
KOH-90017910.88010.80340.076791.291.87
KOH-80011230.44790.40250.045489.861.51
KOH-700778.10.35420.31440.039888.761.67
KOH-600639.30.27950.25330.026290.631.78
KOH-500434.60.20890.18140.027586.832.02
Table 3. Comparison of pore texture characteristics and SBET of activated carbons.
Raw MaterialActivatorImpregnation RatioActivation Temperature (°C)Holding Time (h)SBETVt (cm3/g)References
(m2/g)
LigninKOH1:1800315040.757[36]
Pistachio shellsKOH1:1780110960.61[33]
PineconeKOH1:190021589-[34]
Wood sawdustKOH5 g 100 mL8001.511850.562[37]
5 wt.%
Pine pollenMgCO36:185021311.20.69[38]
Sugarcane bagasseNaOH30 wt.%8501.511491.73[35]
Bambusa vulgaris striataKOH3:180019800.559[39]
Moso bambooKOH1:190011790.80.88This study
Publisher’s Note: MDPI stays neutral with regard to jurisdictional claims in published maps and institutional affiliations.

