
Performance, Combustion, and Emission Comparisons of a High-Speed Diesel Engine Fueled with Biodiesel with Different Ethanol Addition Ratios Based on a Combined Kinetic Mechanism

Abstract
:1. Introduction
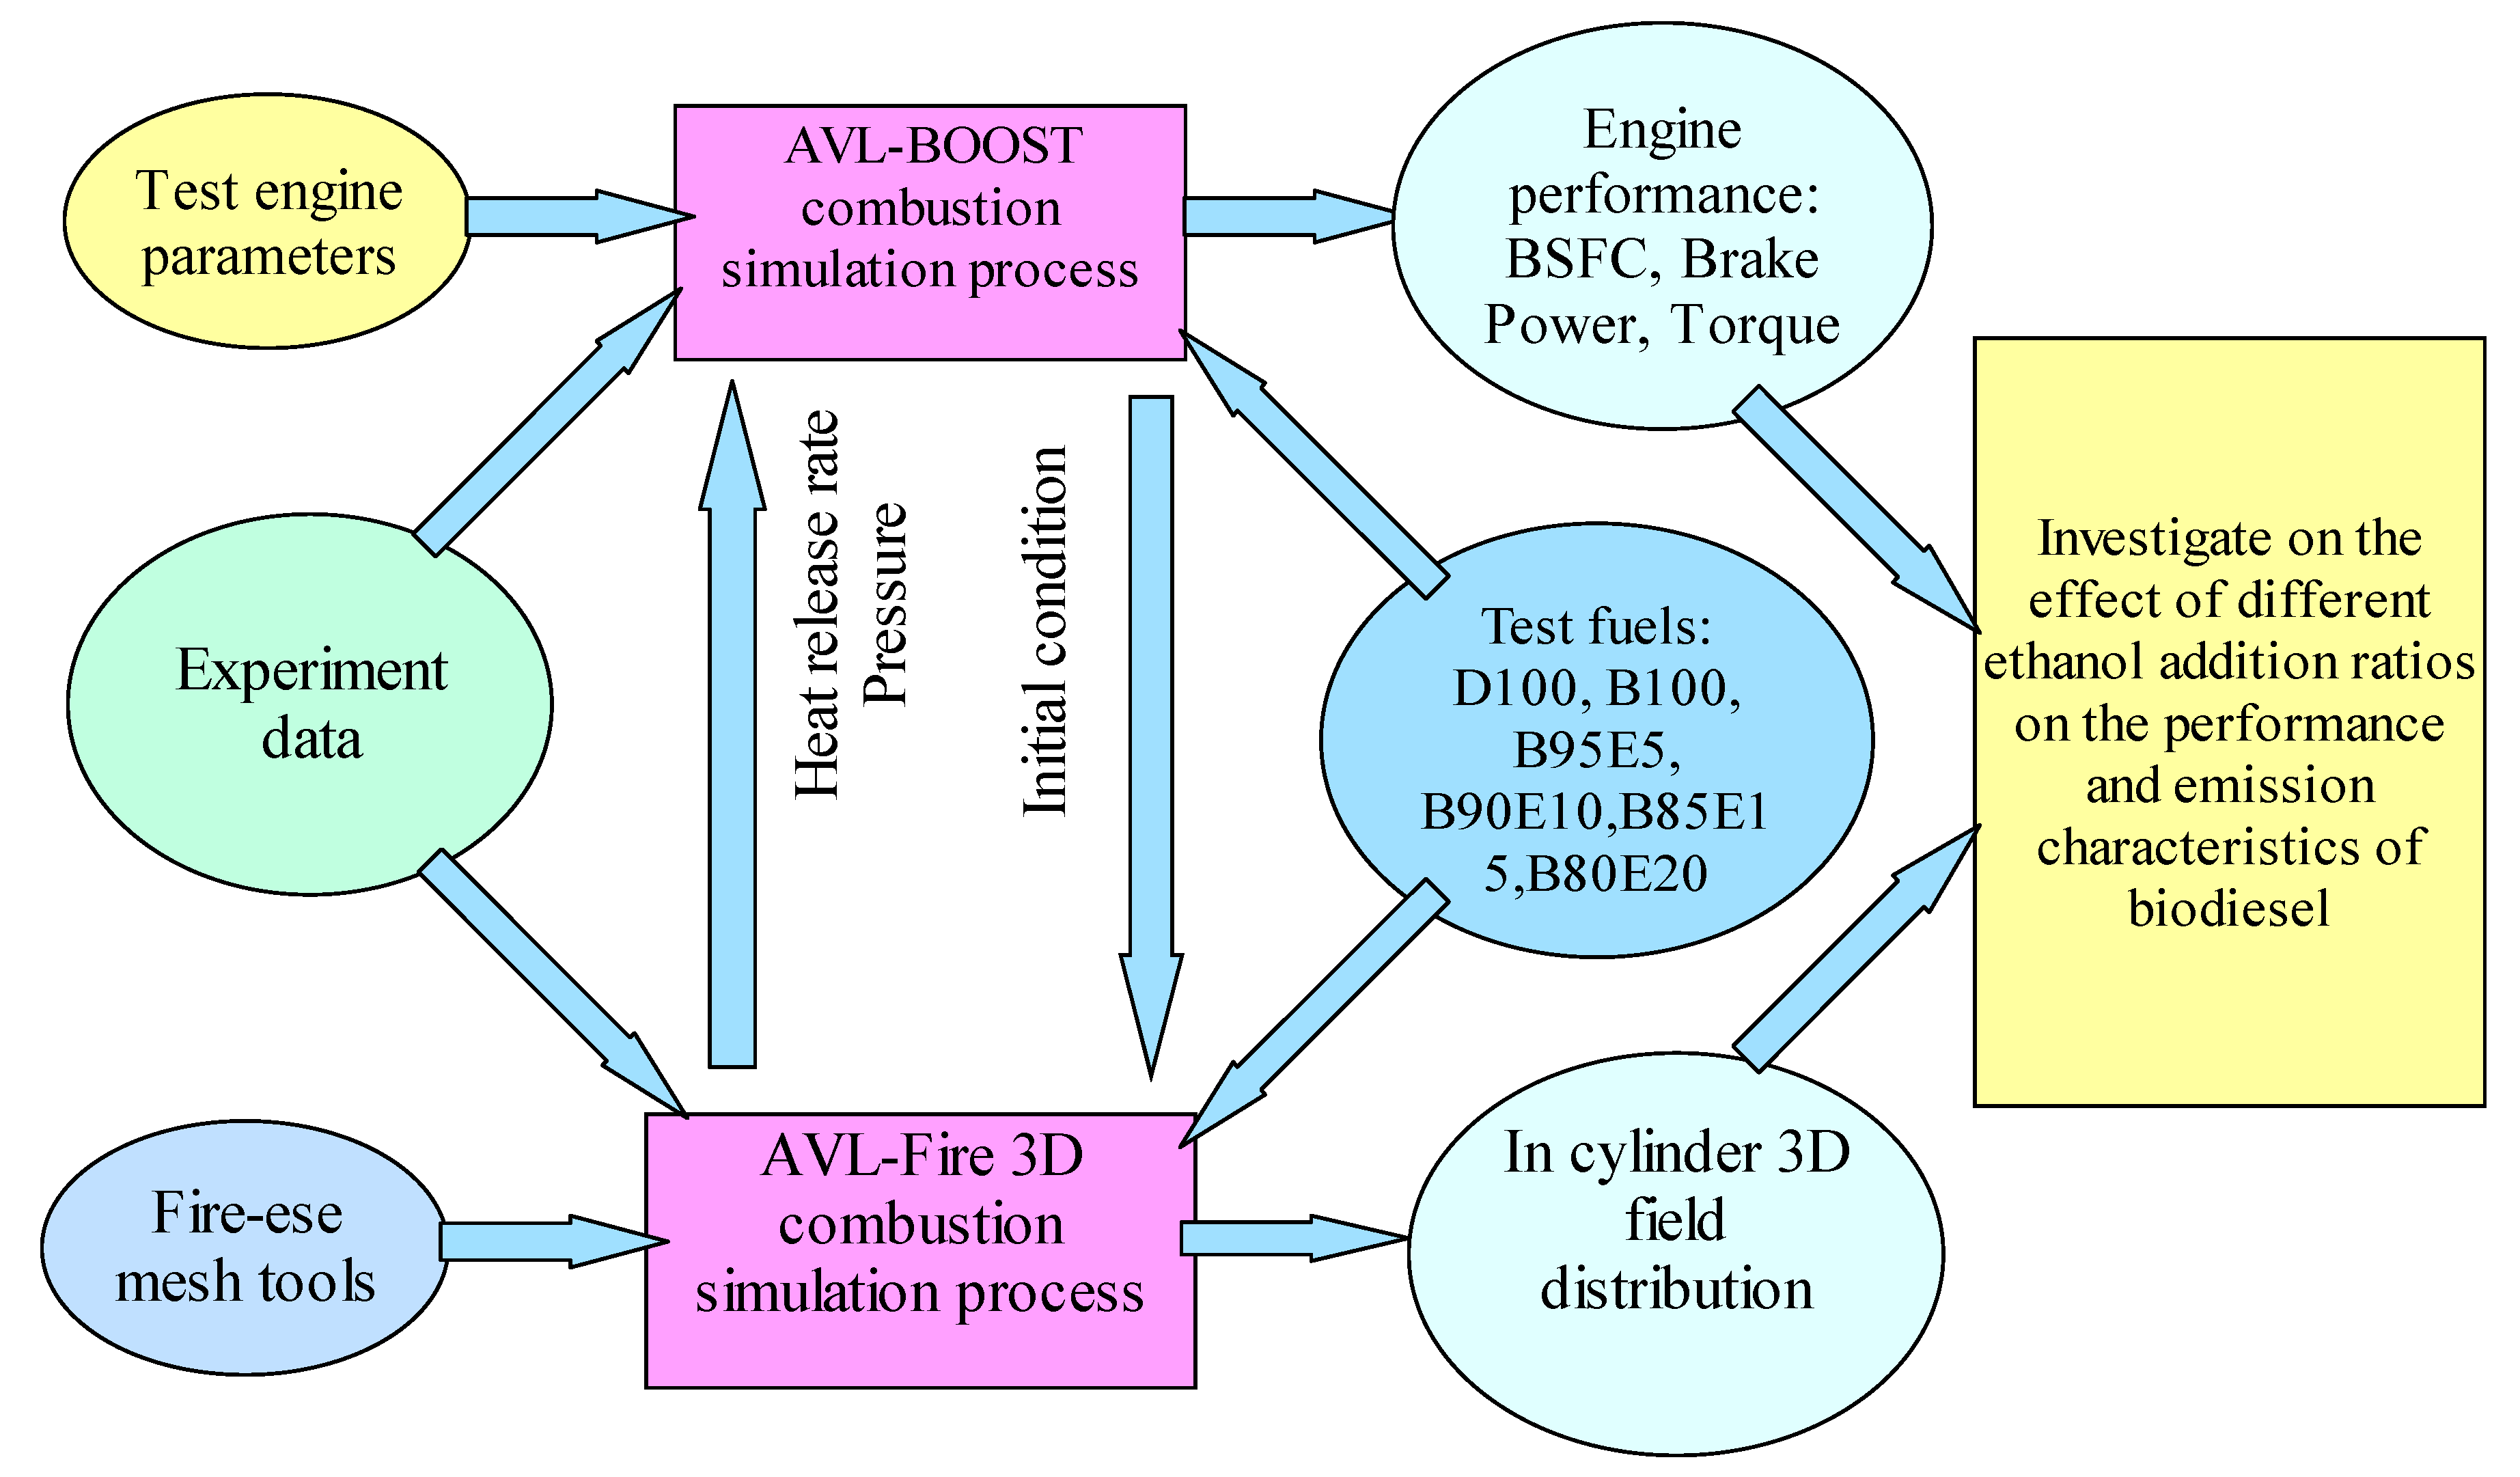
2. Numerical Approaches
2.1. Model Set-Up and Calibration
2.1.1. 1-D Simulation Model Validation and Calibration
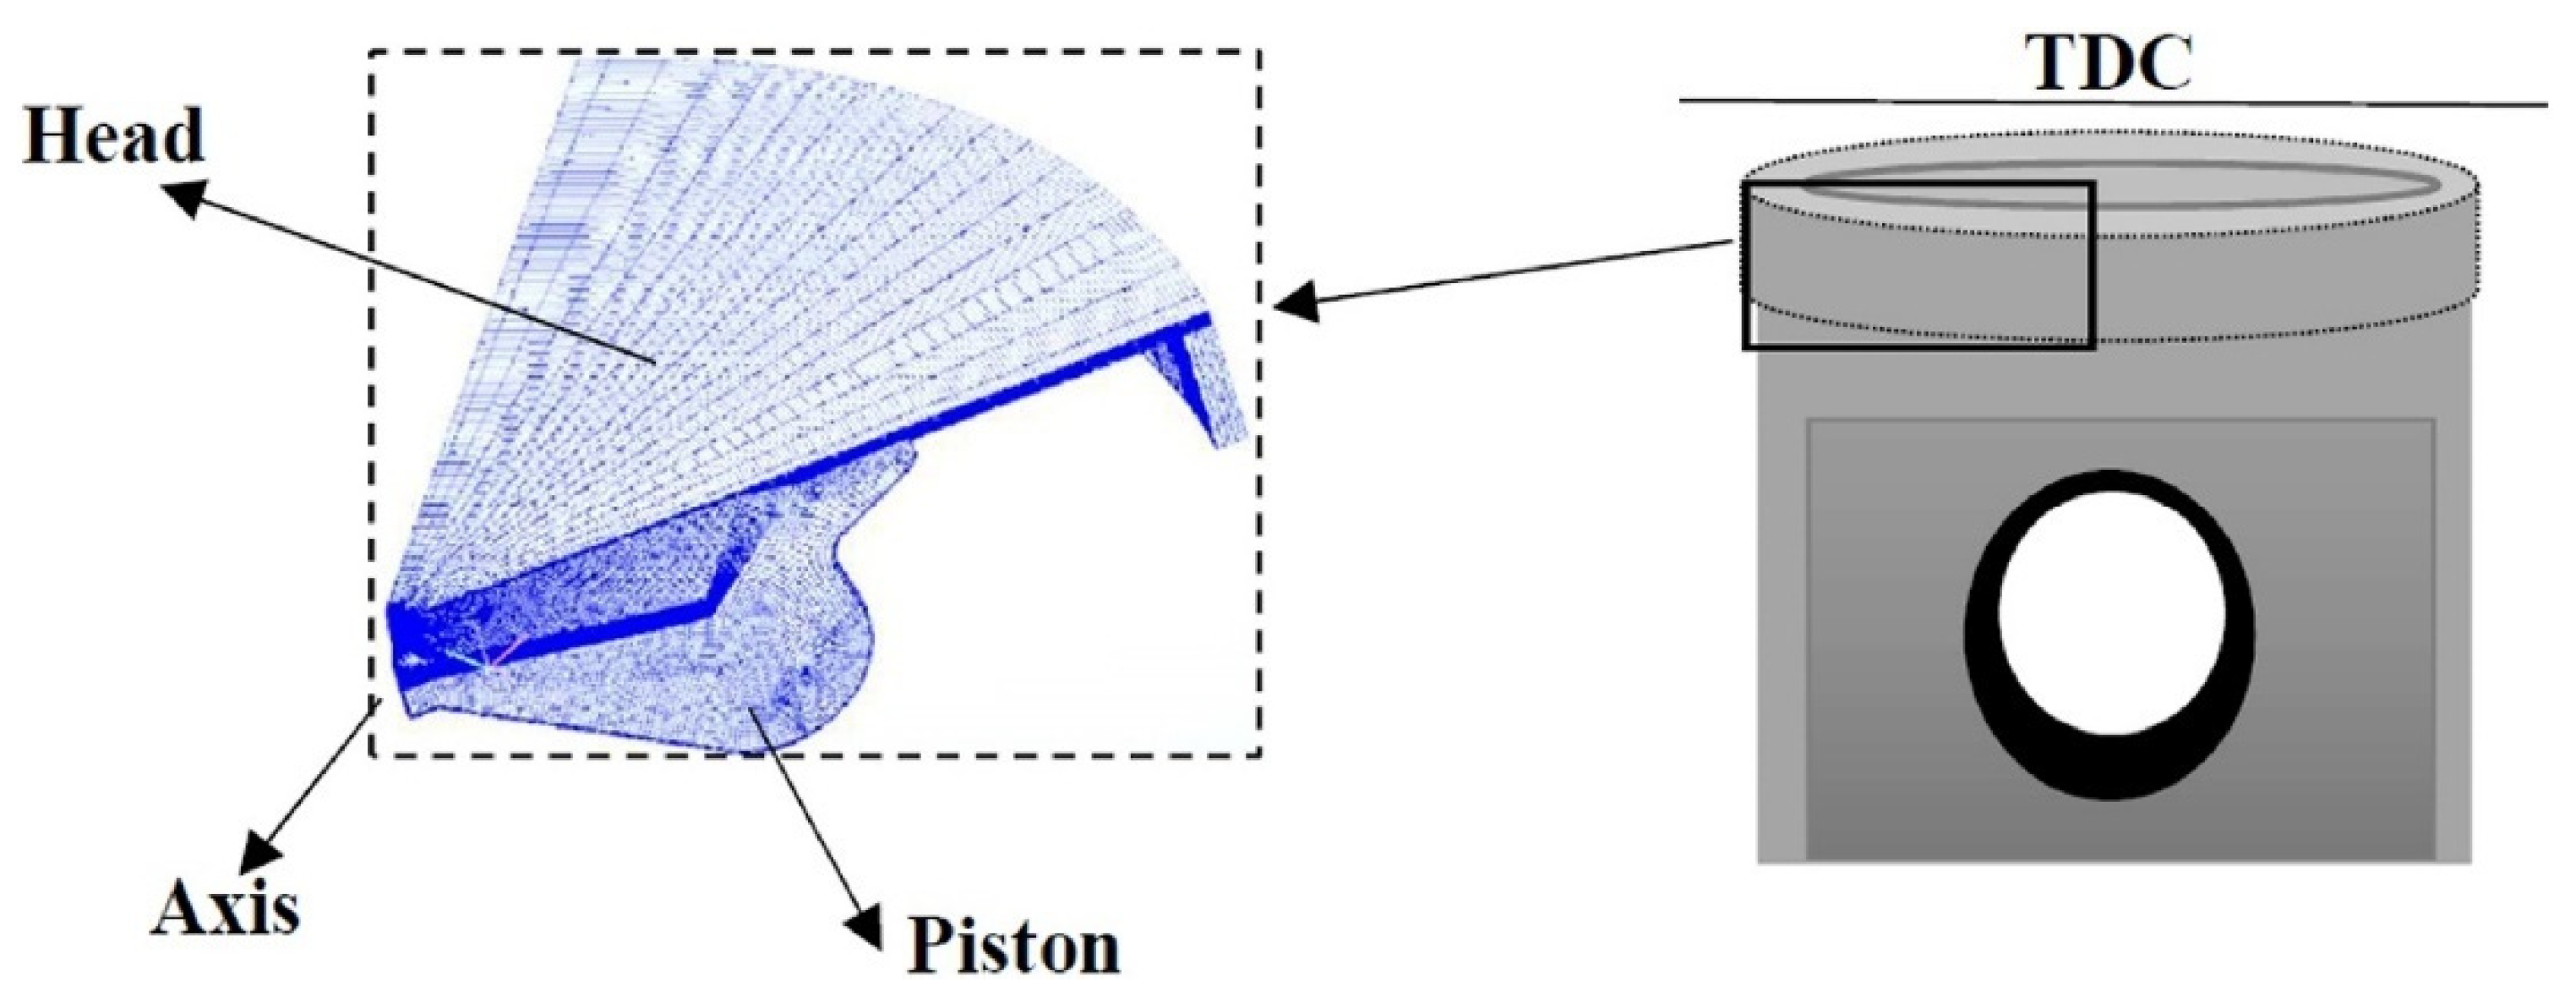
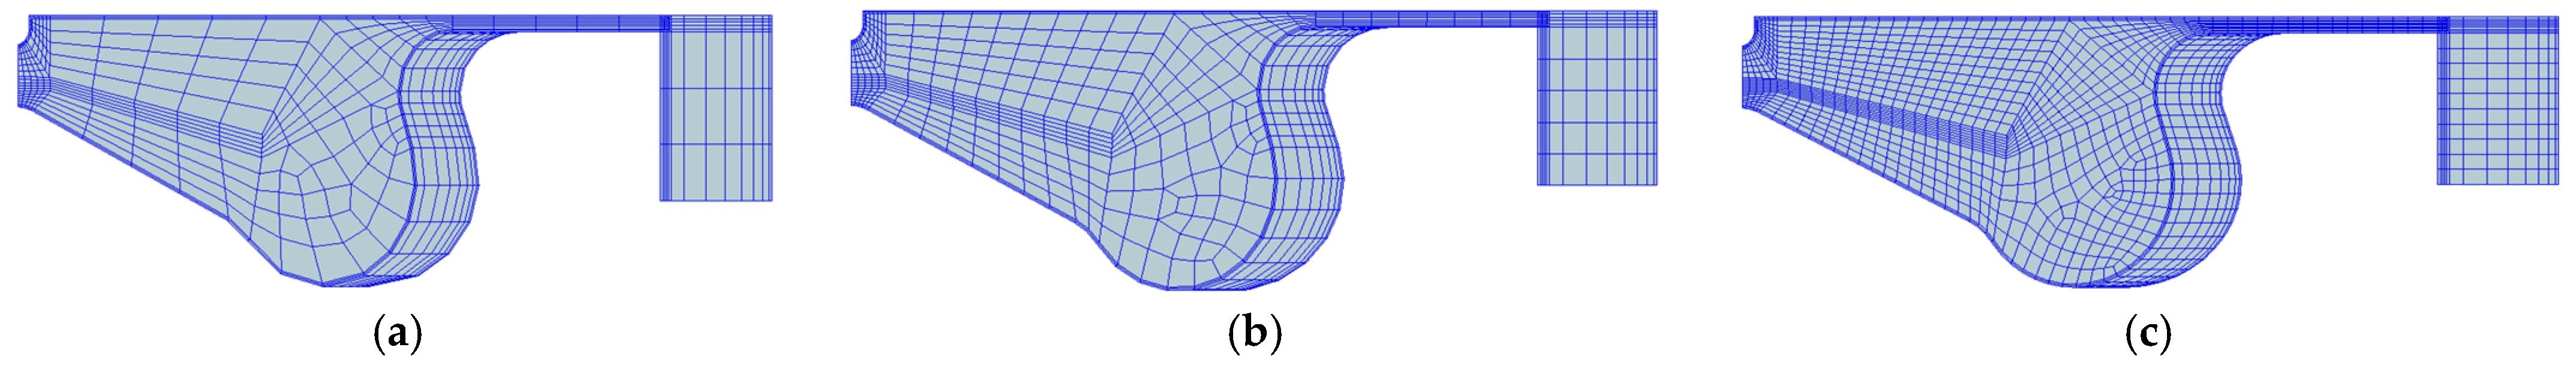
2.1.2. 3-D Simulation Model Validation and Calibration
- (1)
- Mass Conservation Equation
- (2)
- Momentum Conservation Equation
- (3)
- Energy Conservation Equation
- (4)
- Component Conservation Equation
2.2. Simulation Mathematical Model
2.2.1. Turbulence Model
2.2.2. Spray Model
- (1)
- Basic Momentum Equation
- (2)
- Spray sub model
- (3)
- Evaporation model
- (4)
- Wave break up model
2.2.3. Combustion Model
2.2.4. Emission Model
2.3. Ethanol and Biodiesel Mechanism
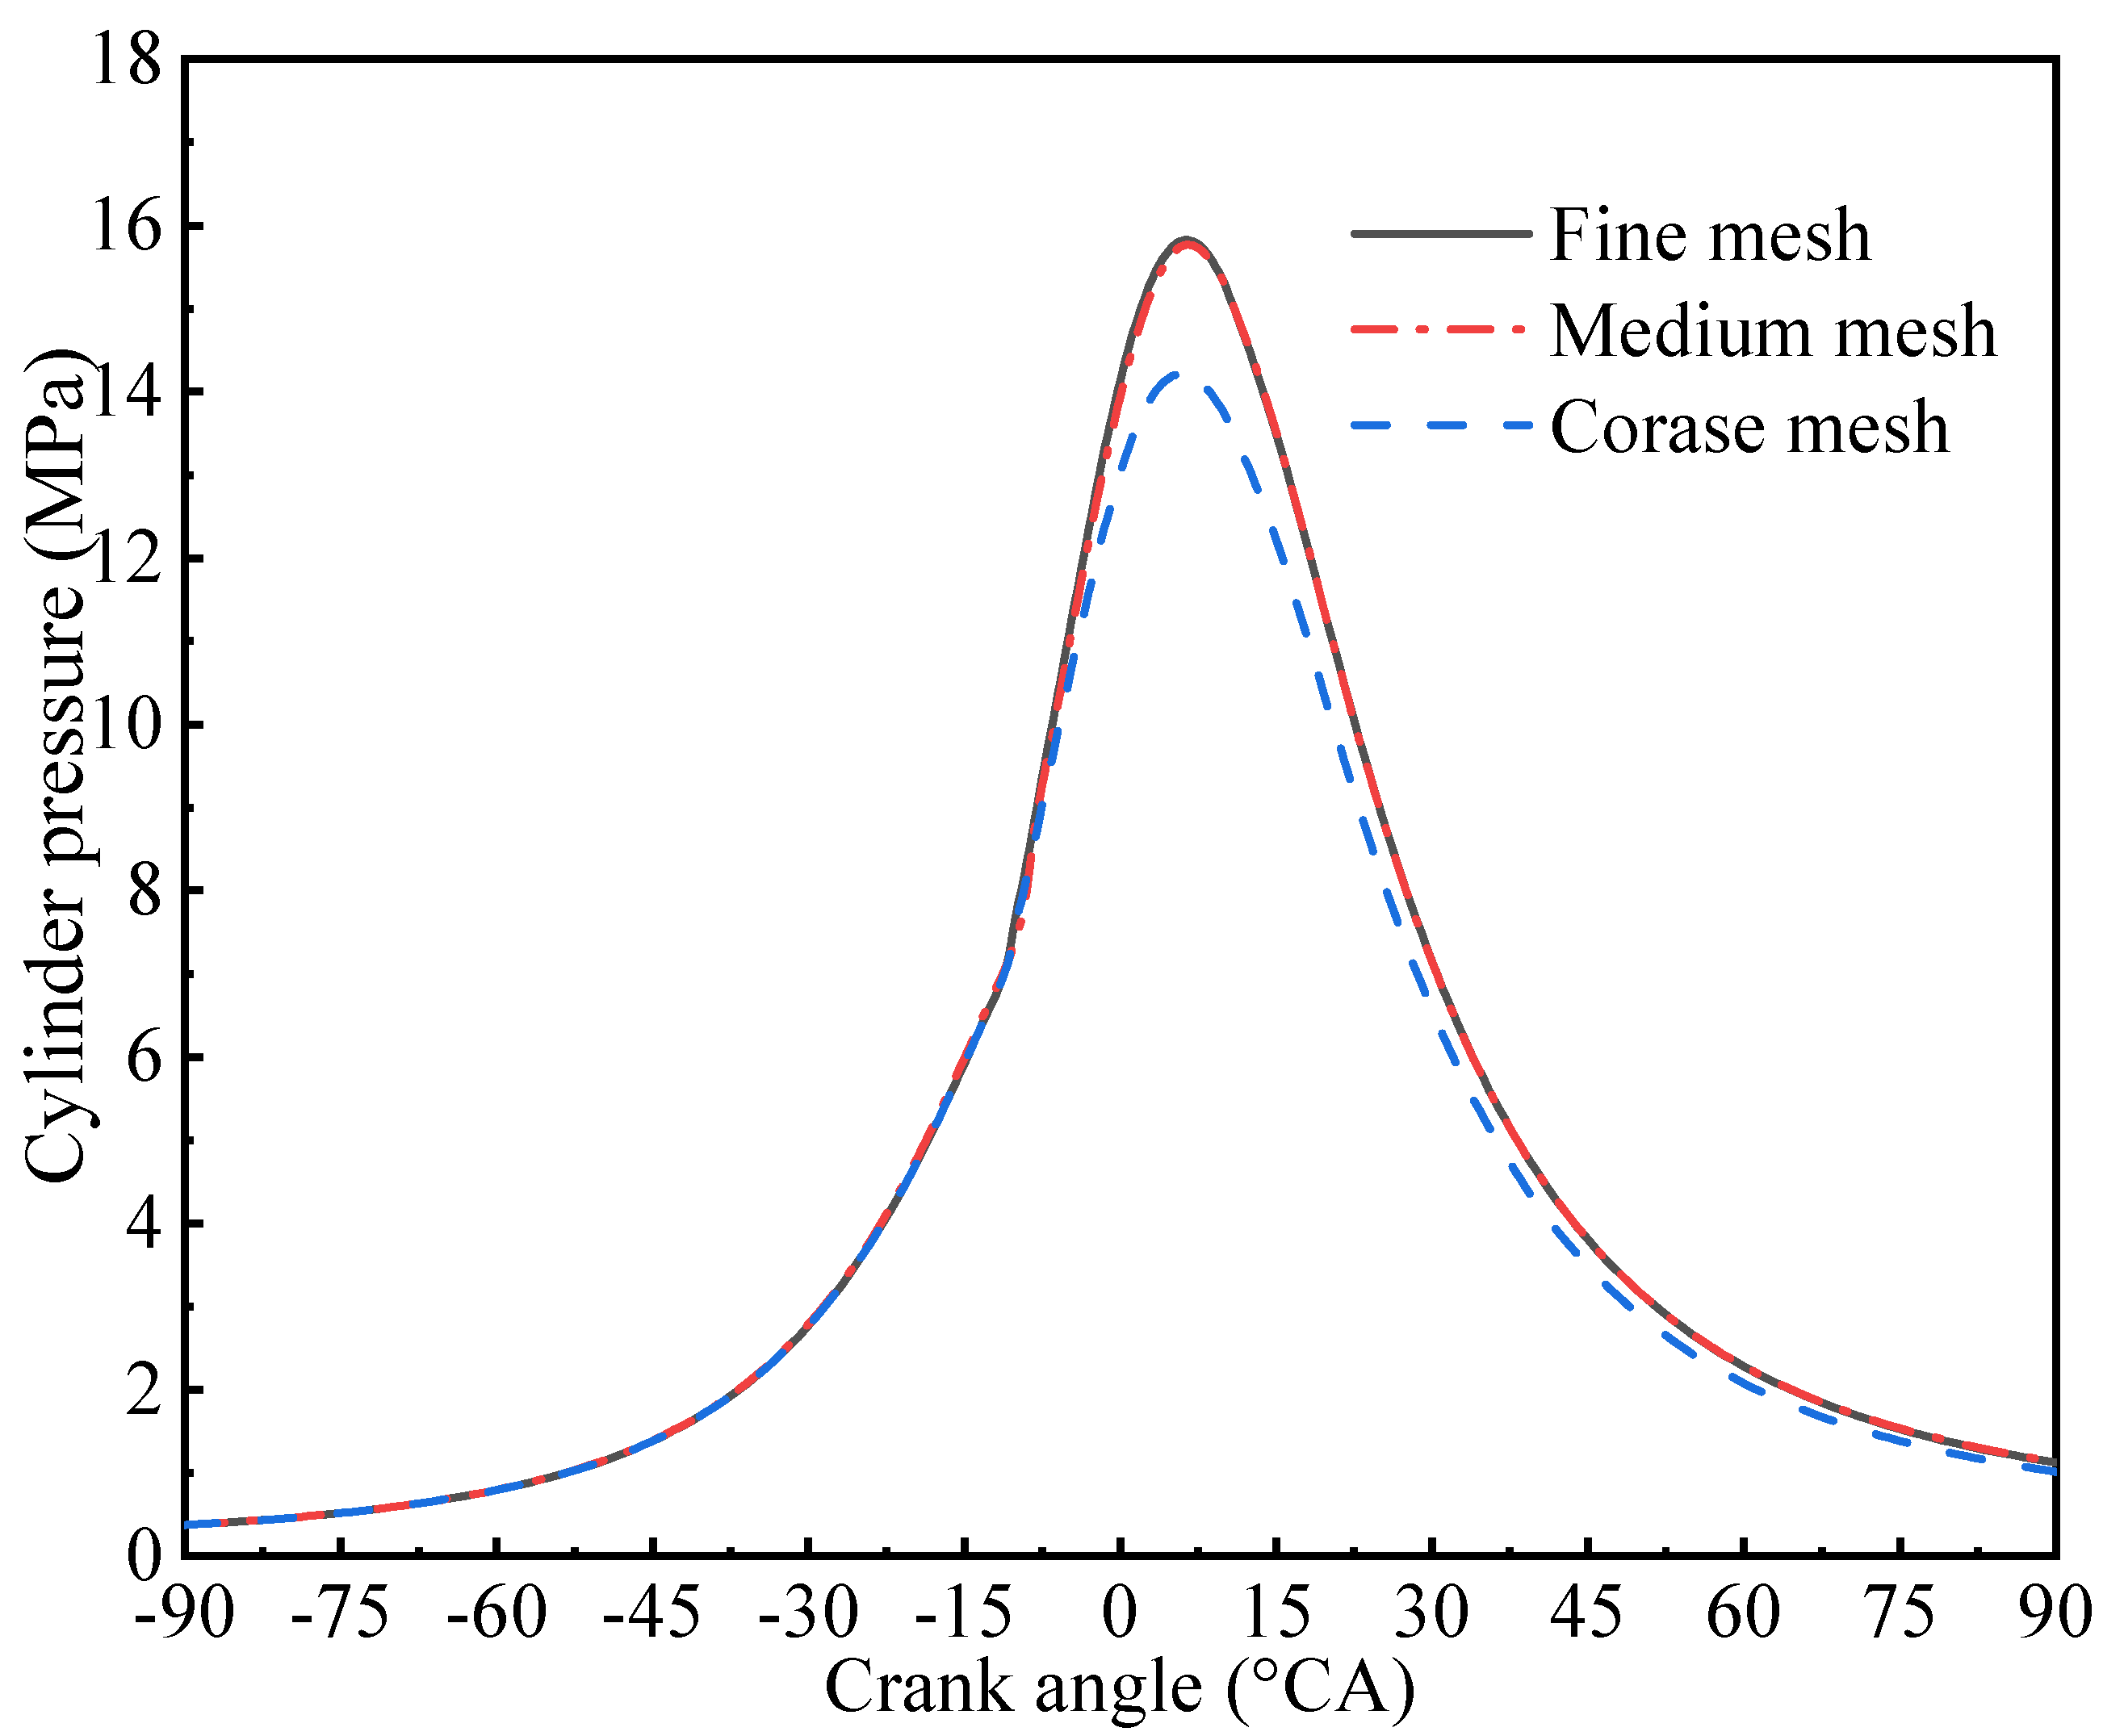
2.4. 3D-CFD Model and Computational Mesh
2.5. Fuel Blend Rates and Properties
2.6. Feasibility Test
2.7. Uncertainty Analysis
(uncertainty of exhaust gas temperature)2 + (uncertainty of brake power)2 + (uncertainty of air
flow mass)2 + (uncertainty of CO emission)2 + (uncertainty of Soot emission)2 + (uncertainty of
NOx emission)2 + (uncertainty of BSFC)2 + (uncertainty of crank angle encoder)2] = Square root
of [(0.5)2 + (0.25)2 + (0.03)2 + (0.5)2 + (0.32)2 + (2.8)2 + (0.56)2 + (1.5)2 + (0.3)2] = 3.340%
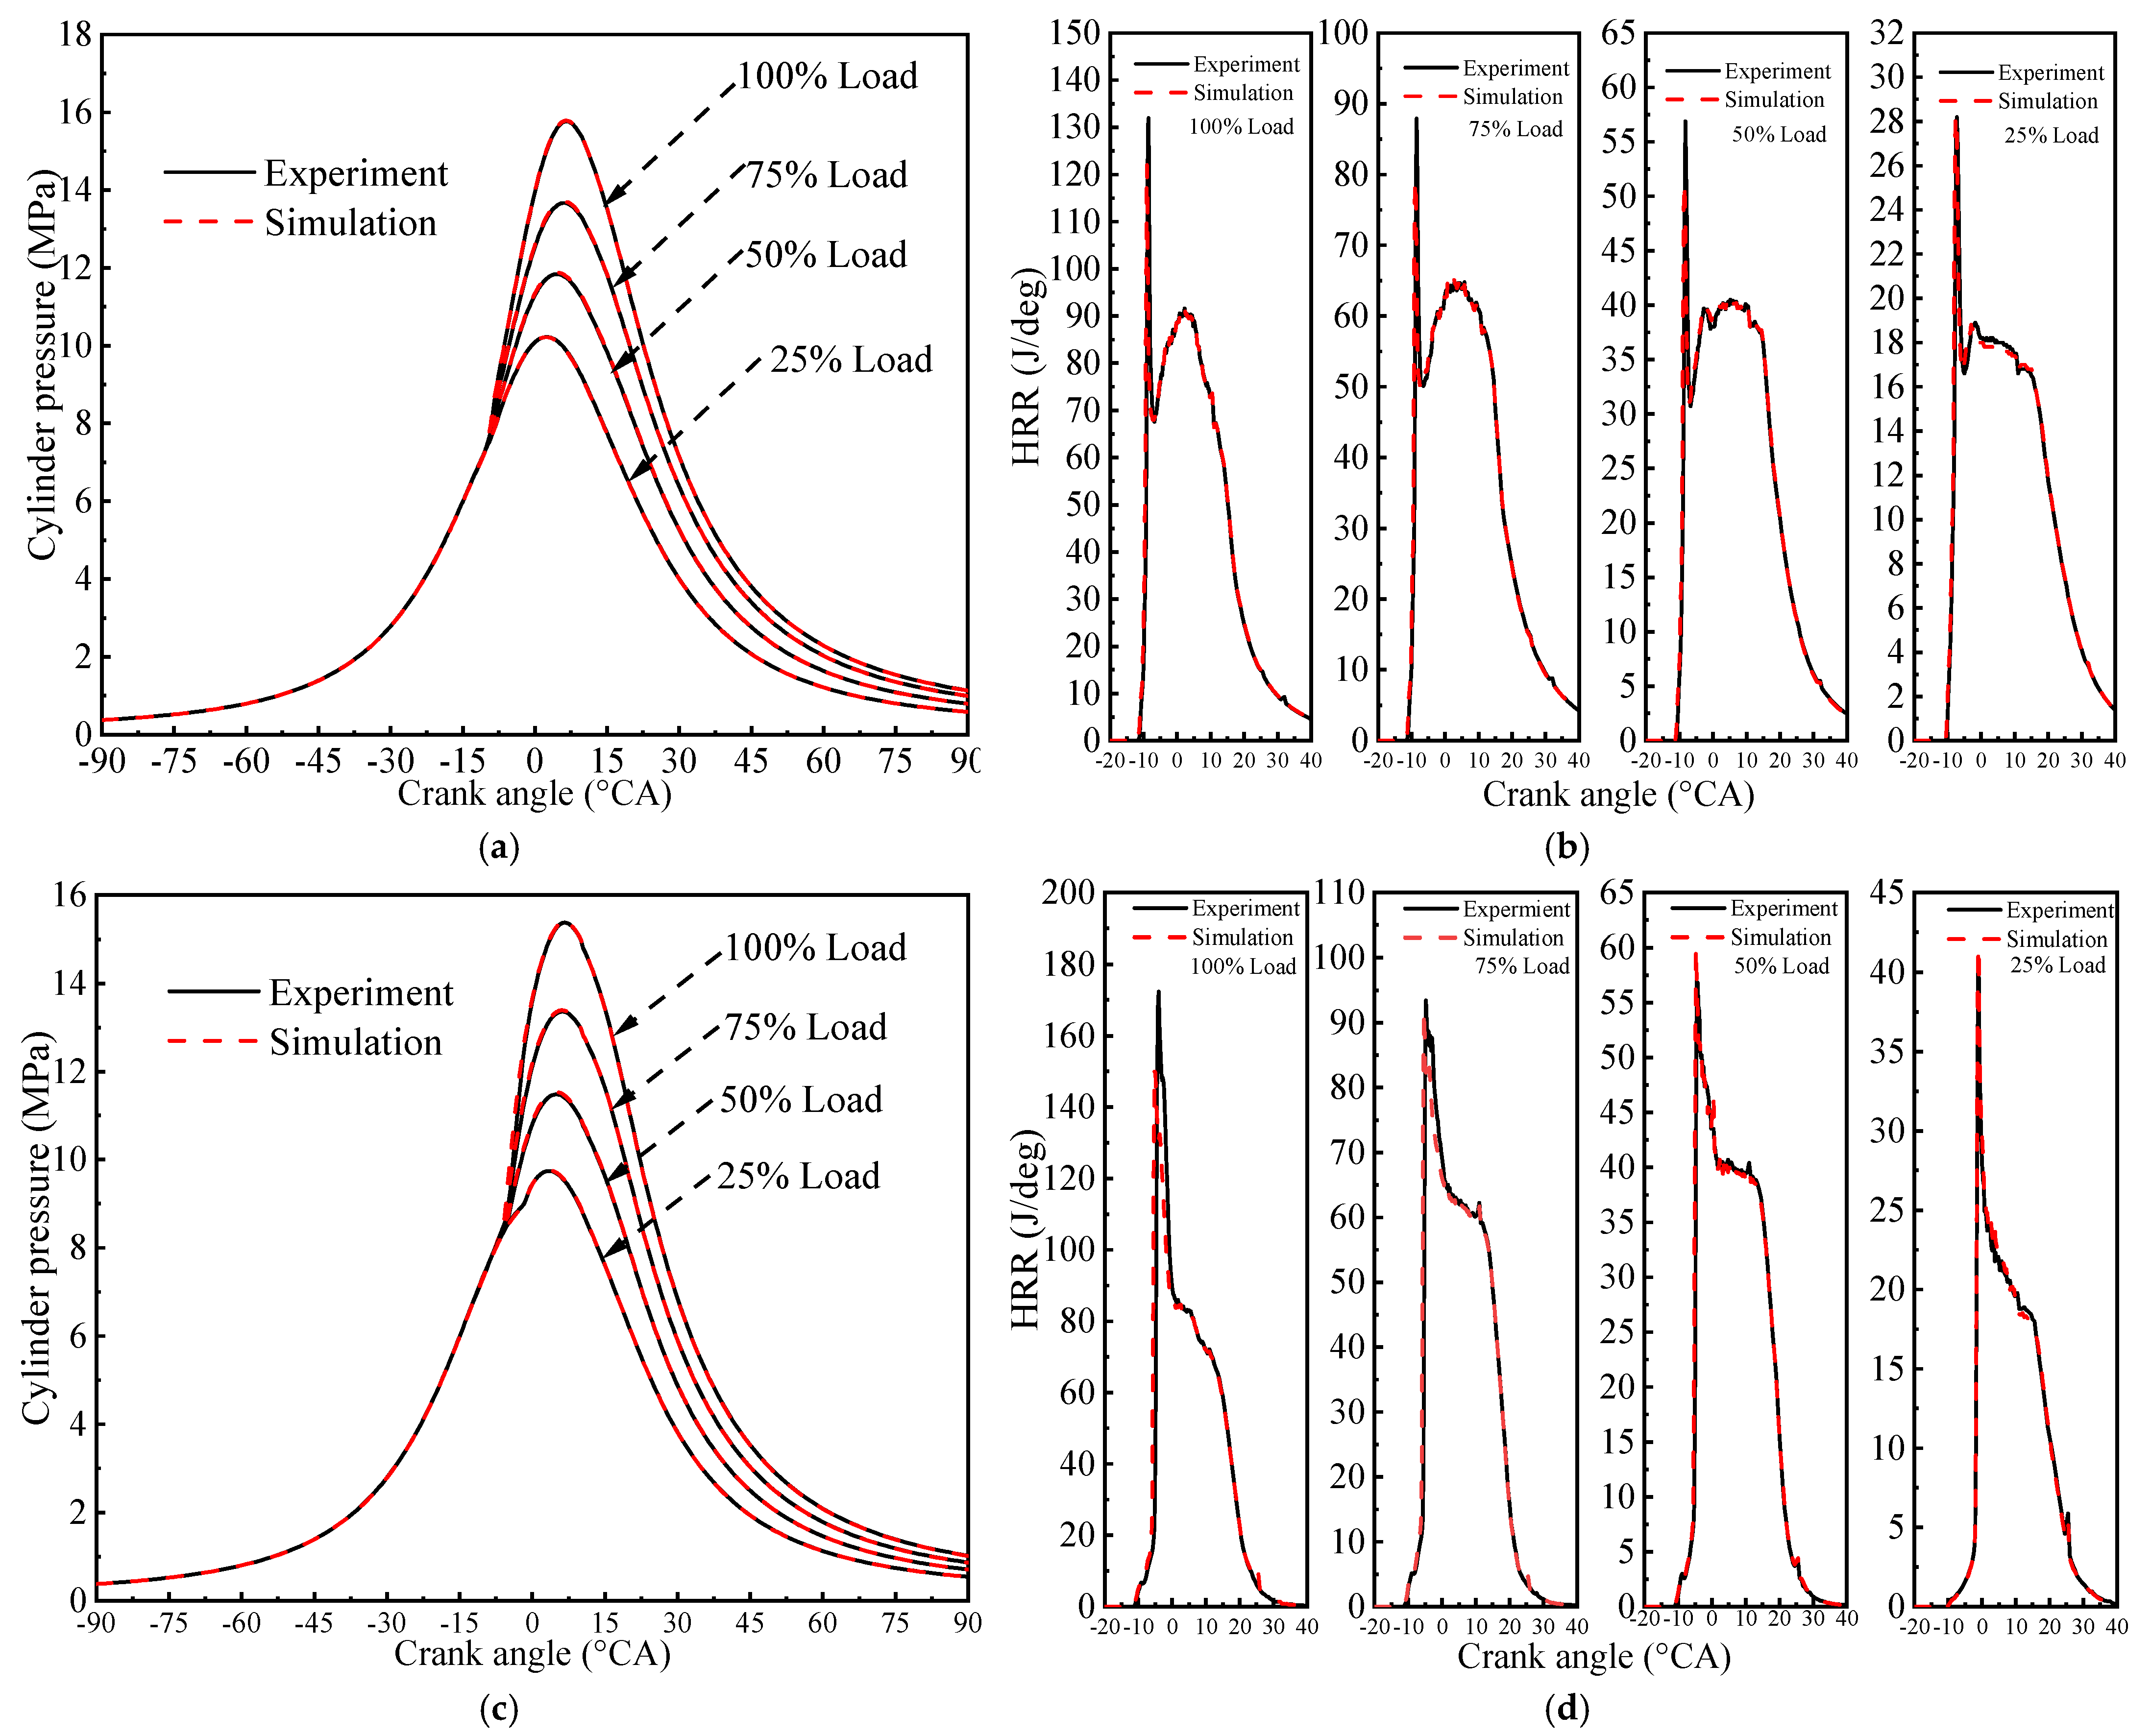
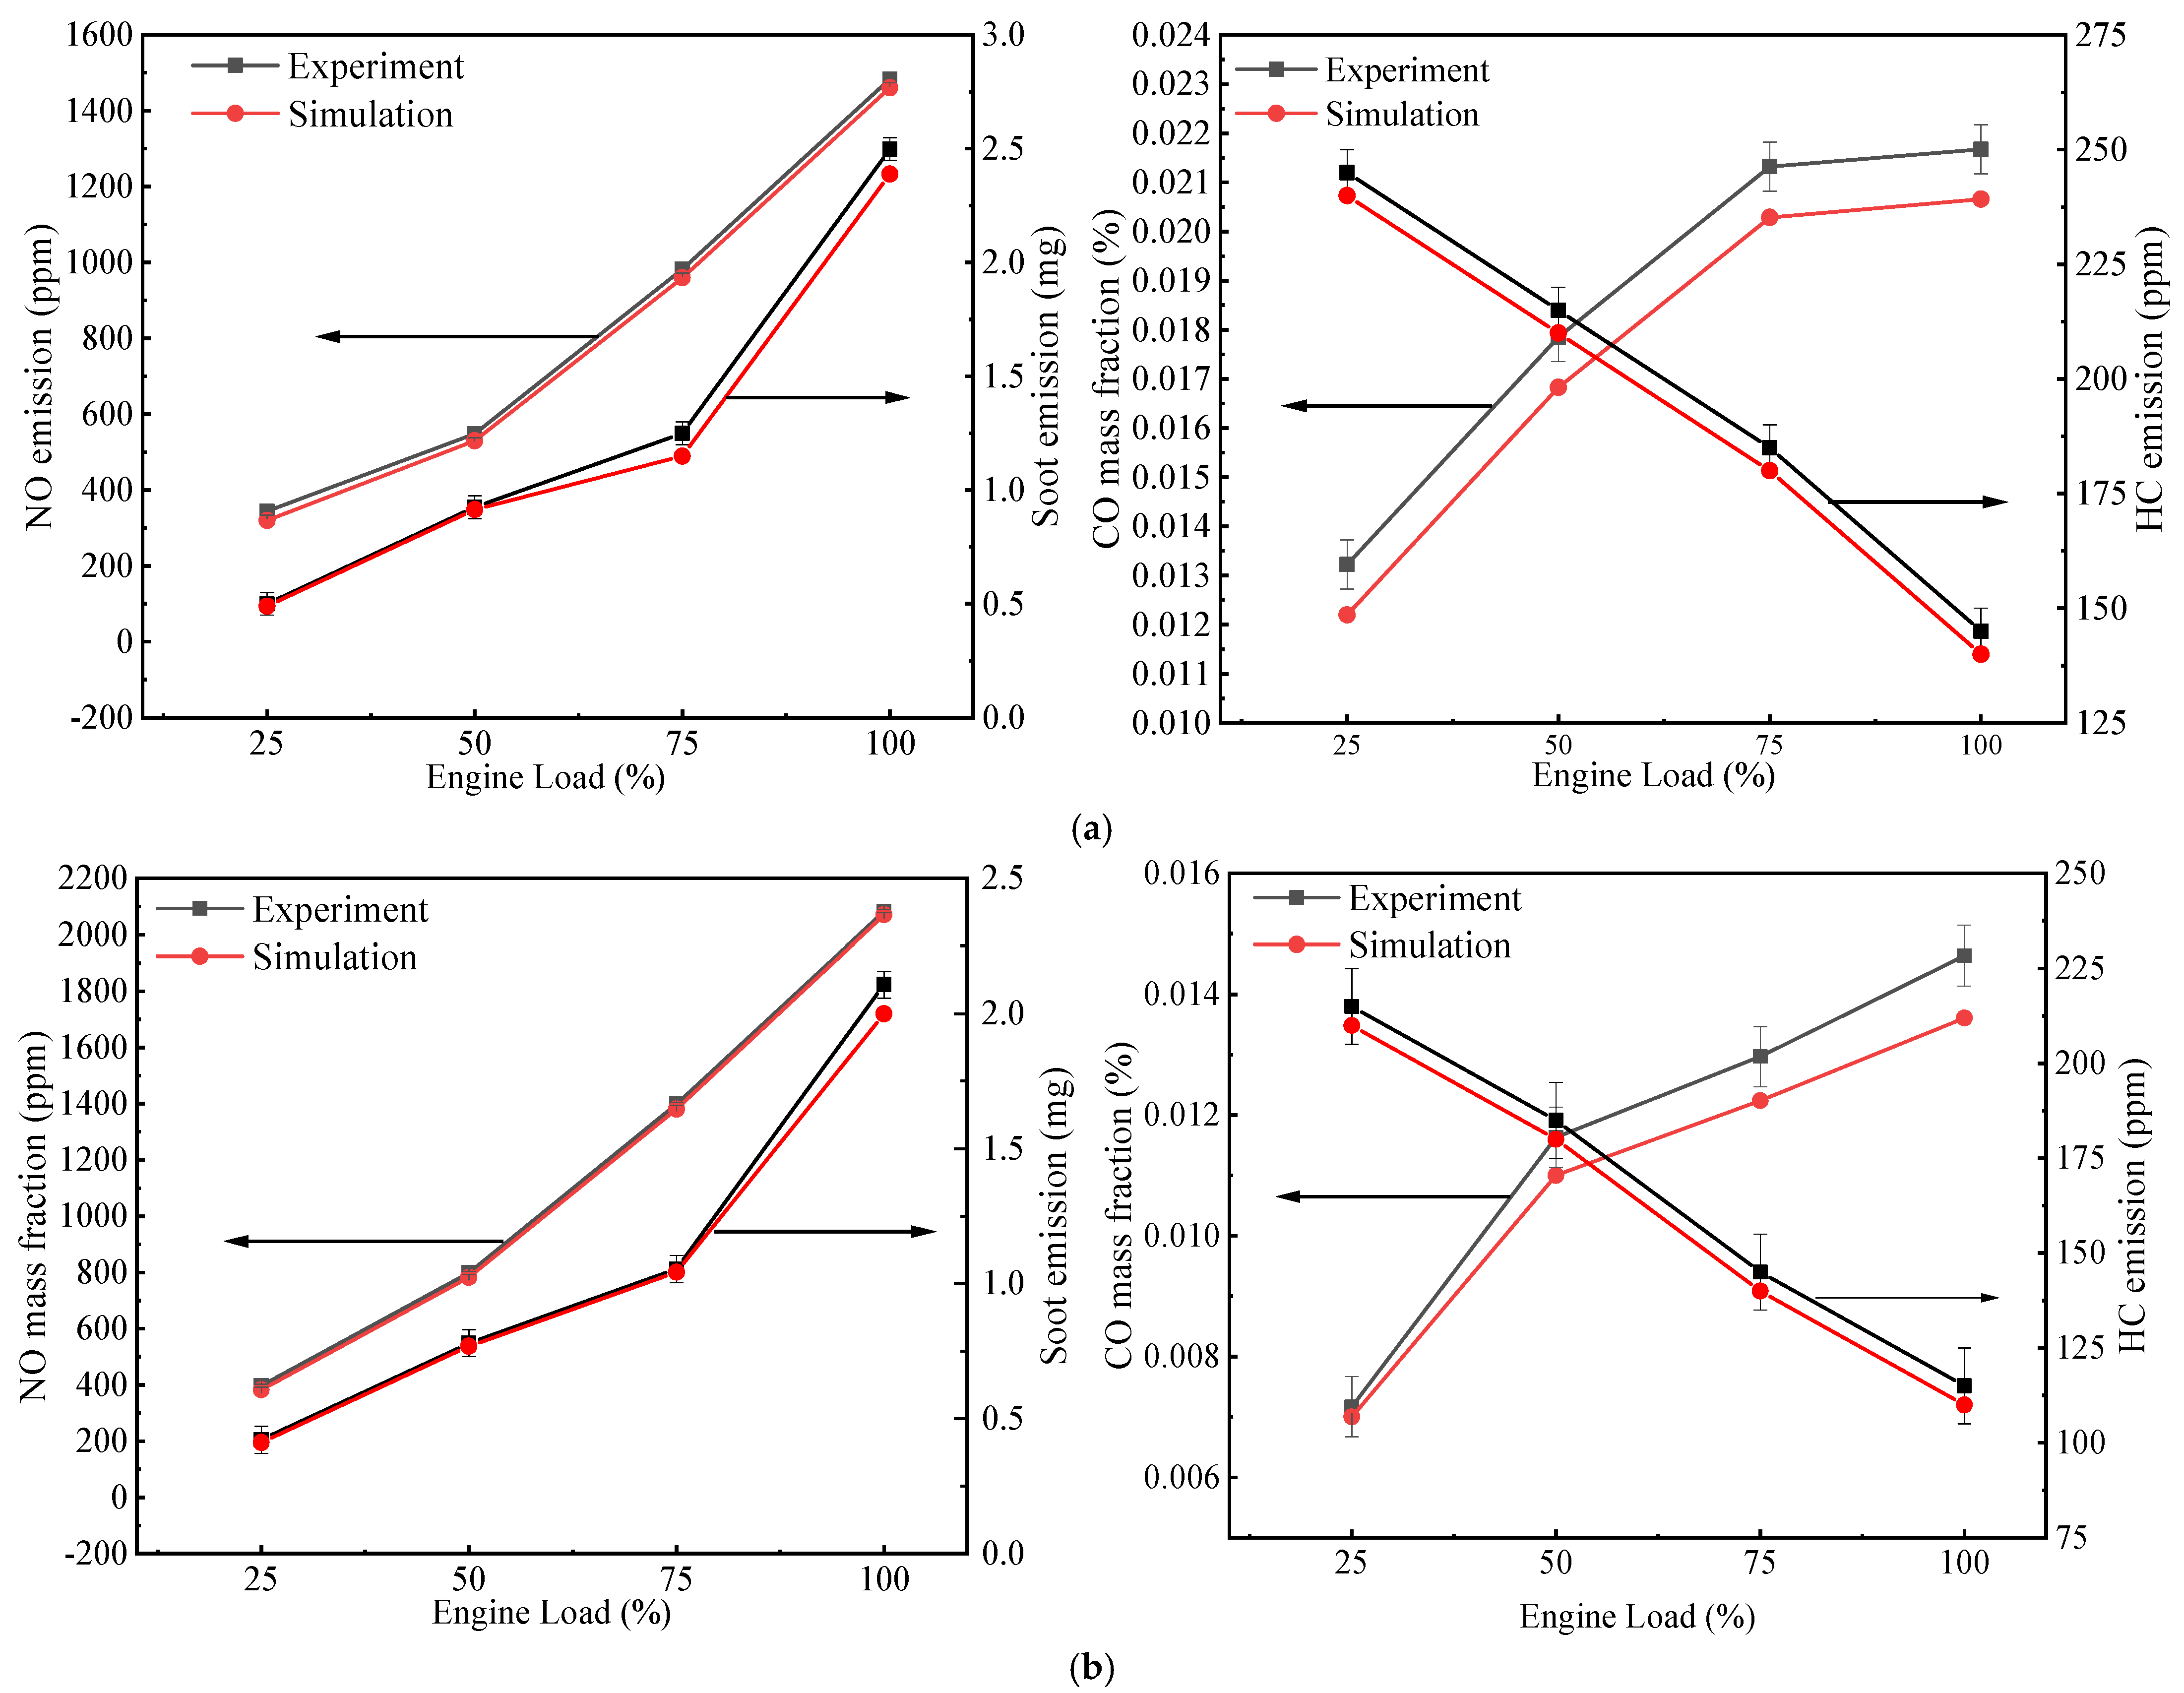
2.8. Model Validation
3. Results and Discussion
3.1. Engine Performance
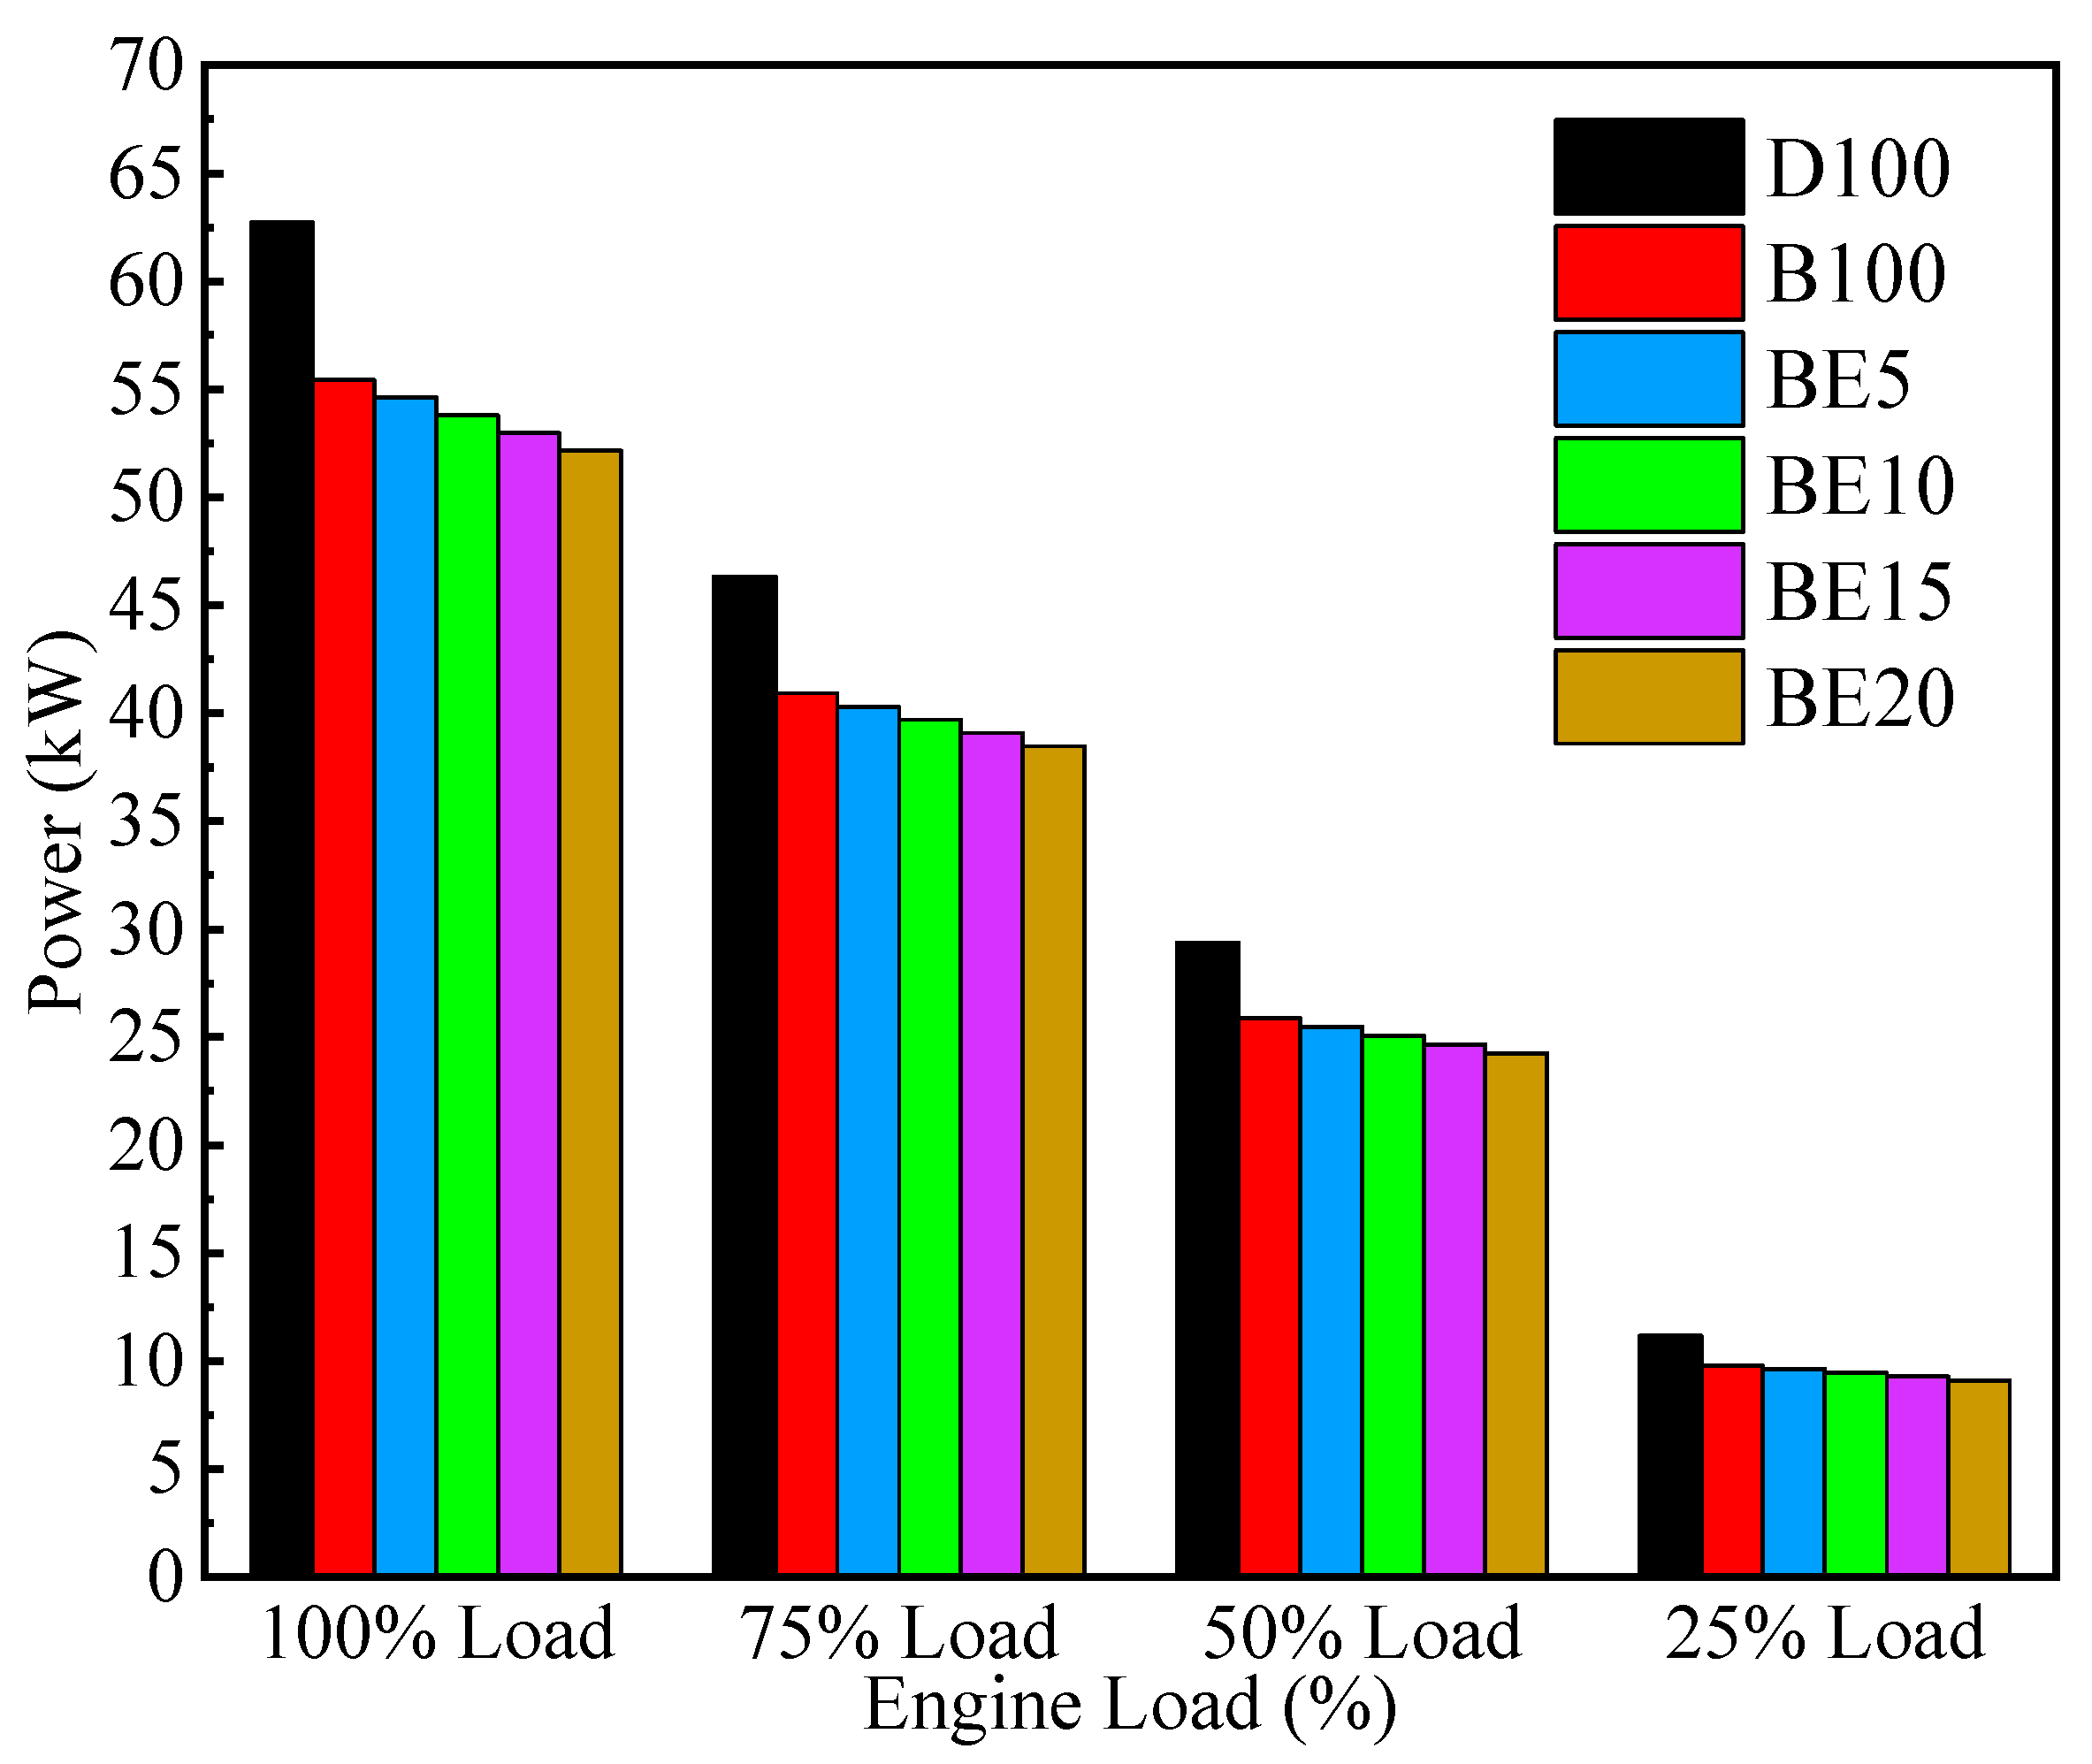
3.1.1. Brake Power
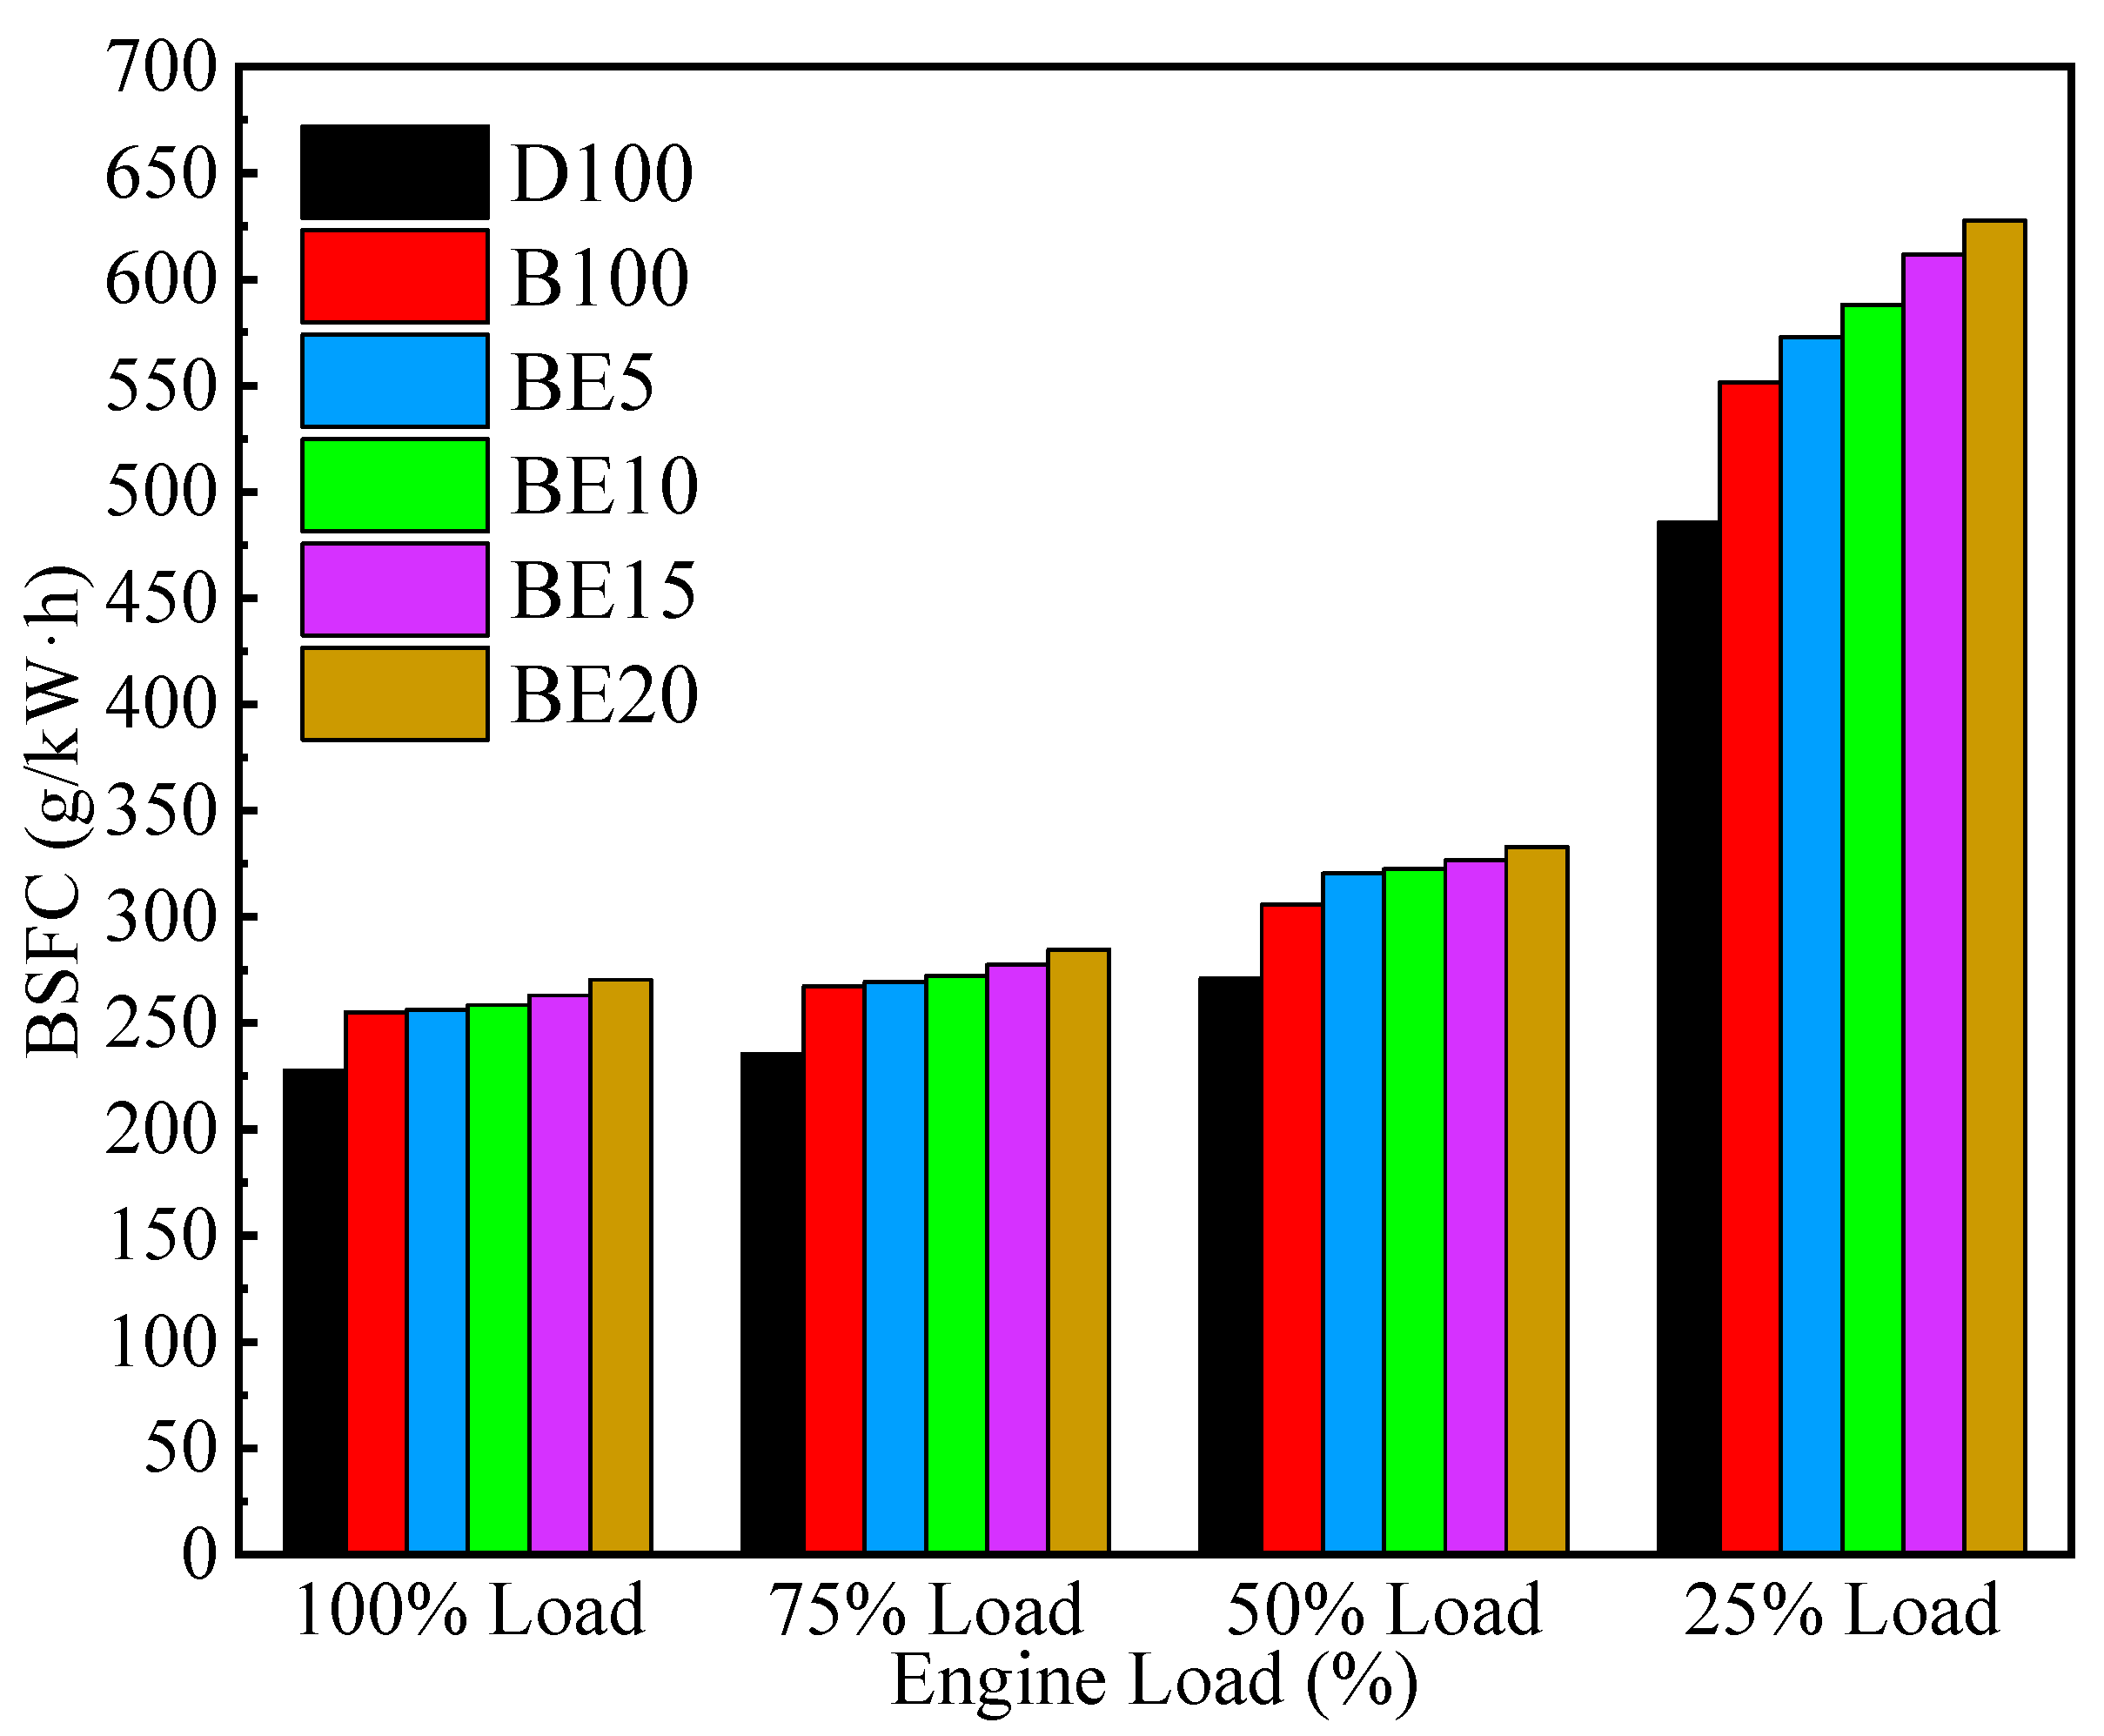
3.1.2. Brake Specific Fuel Consumption
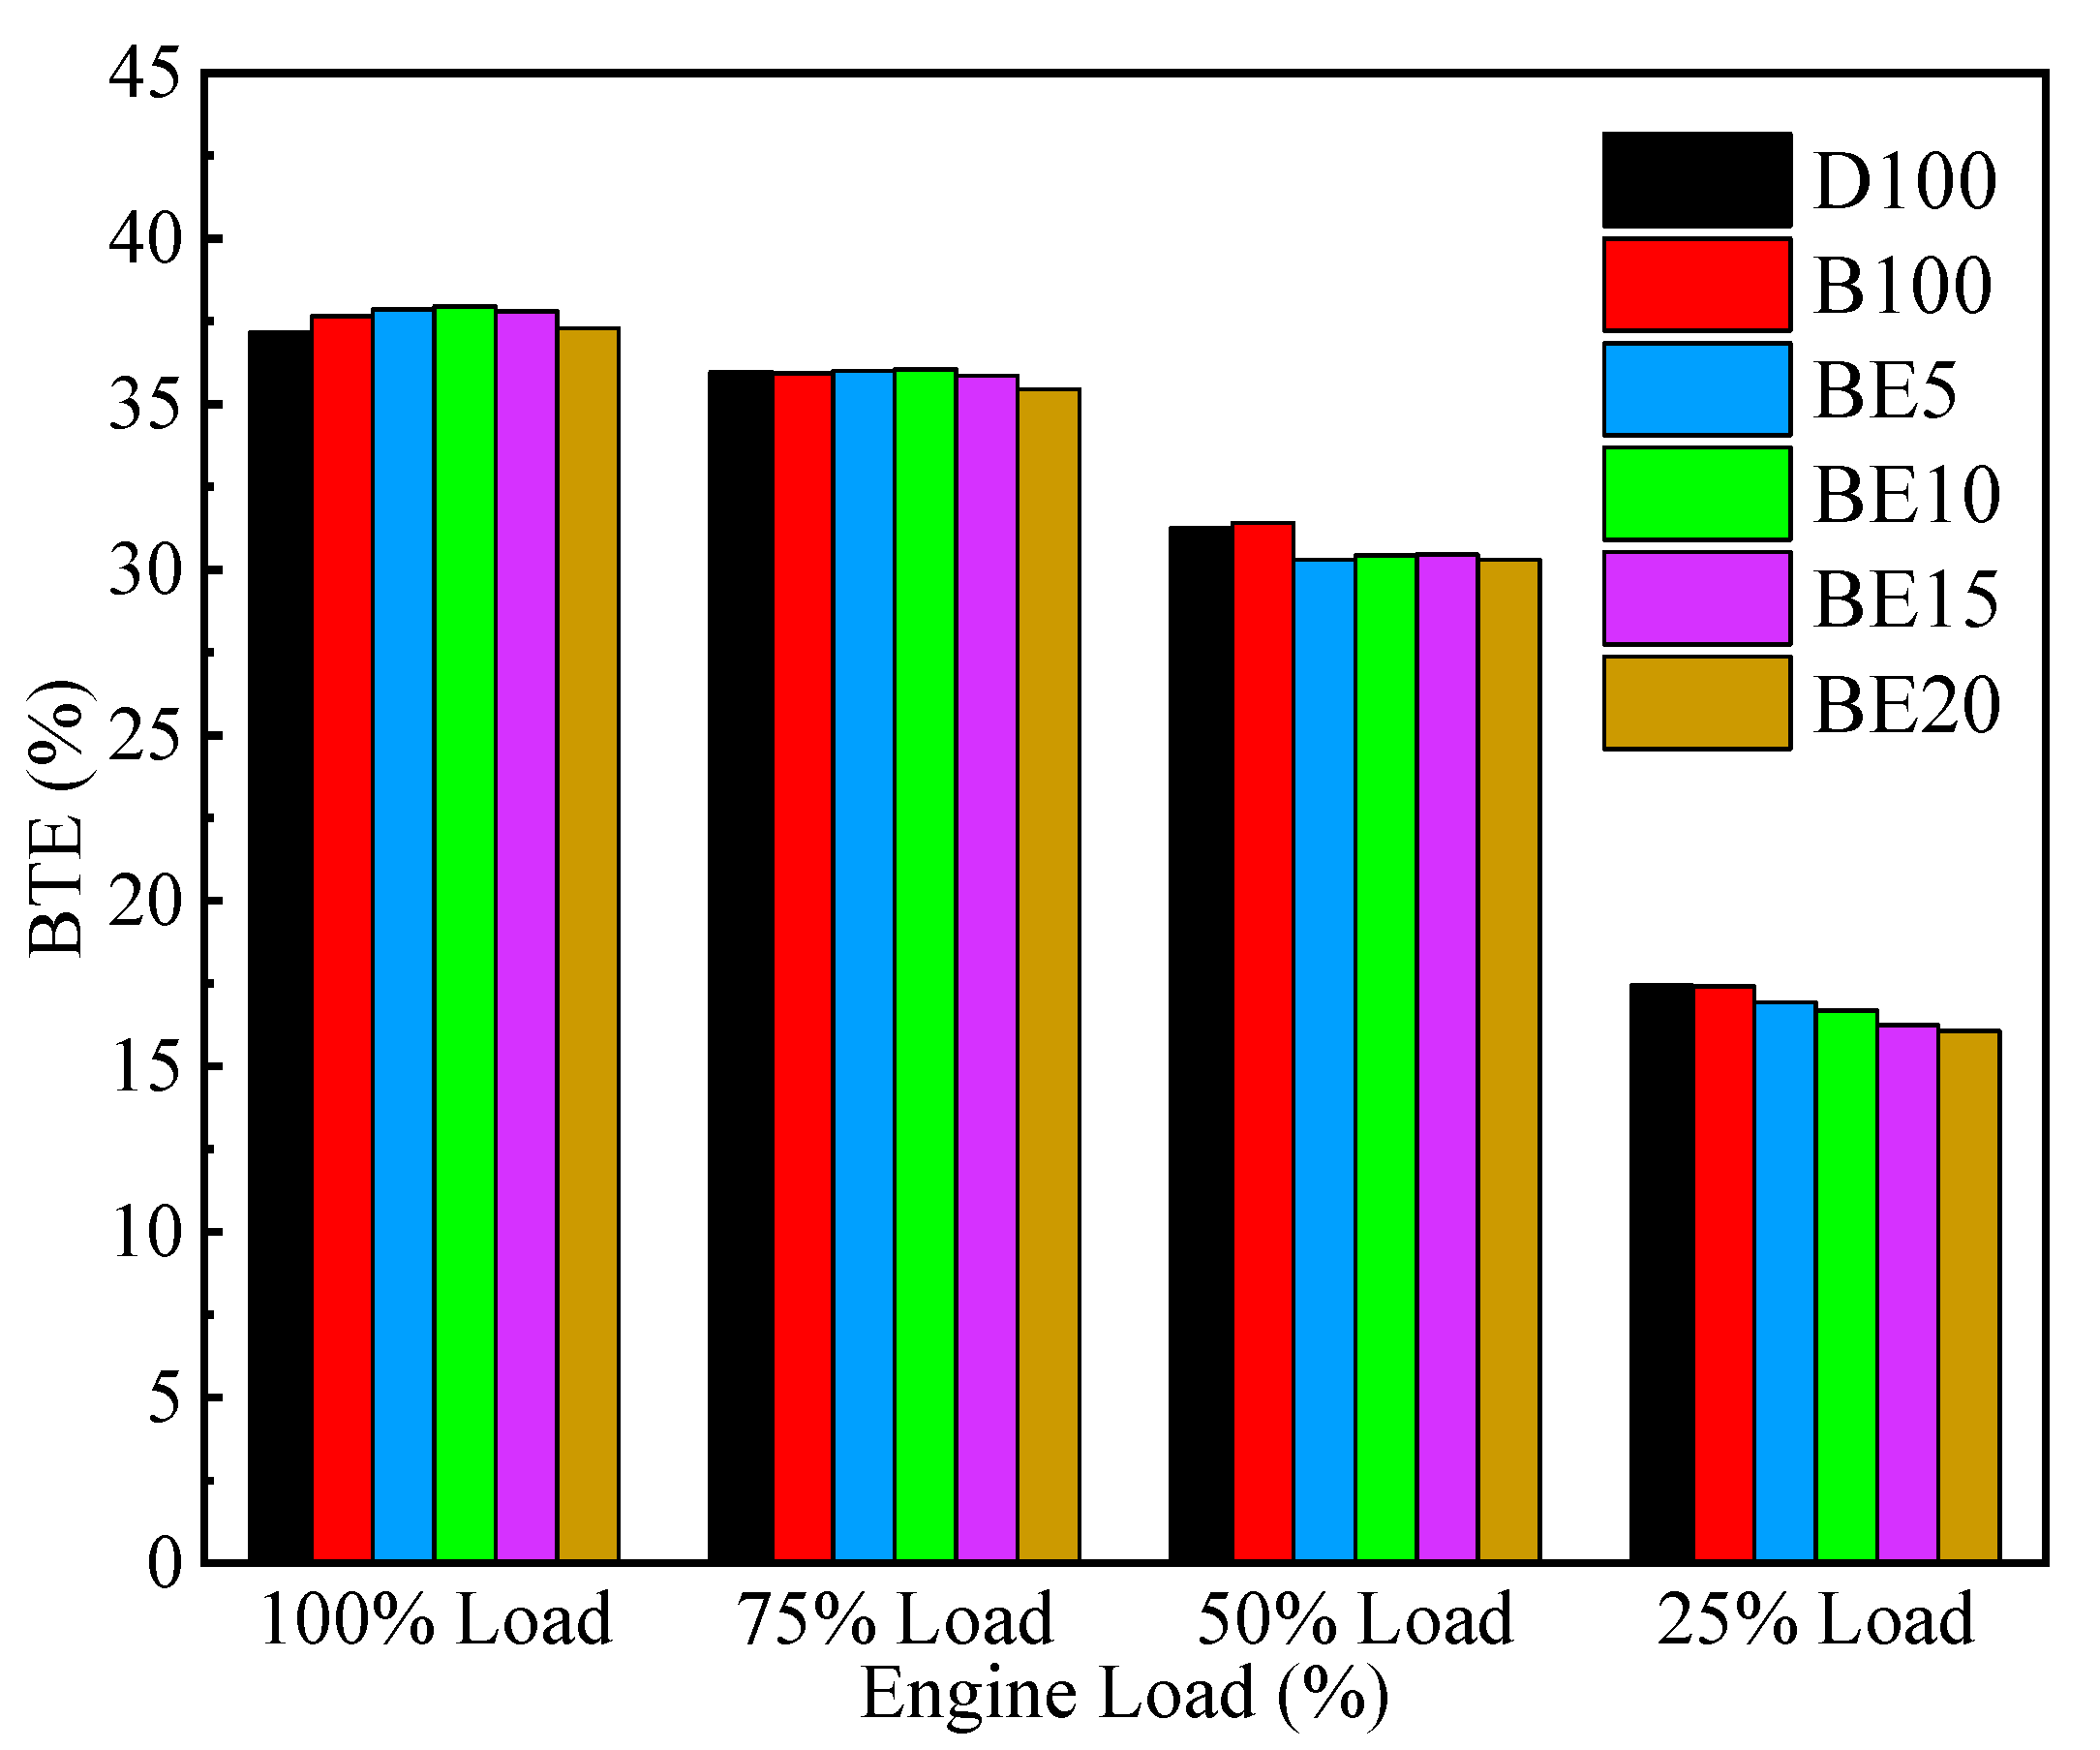
3.1.3. Brake Thermal Efficiency
3.2. Combustion Characteristics
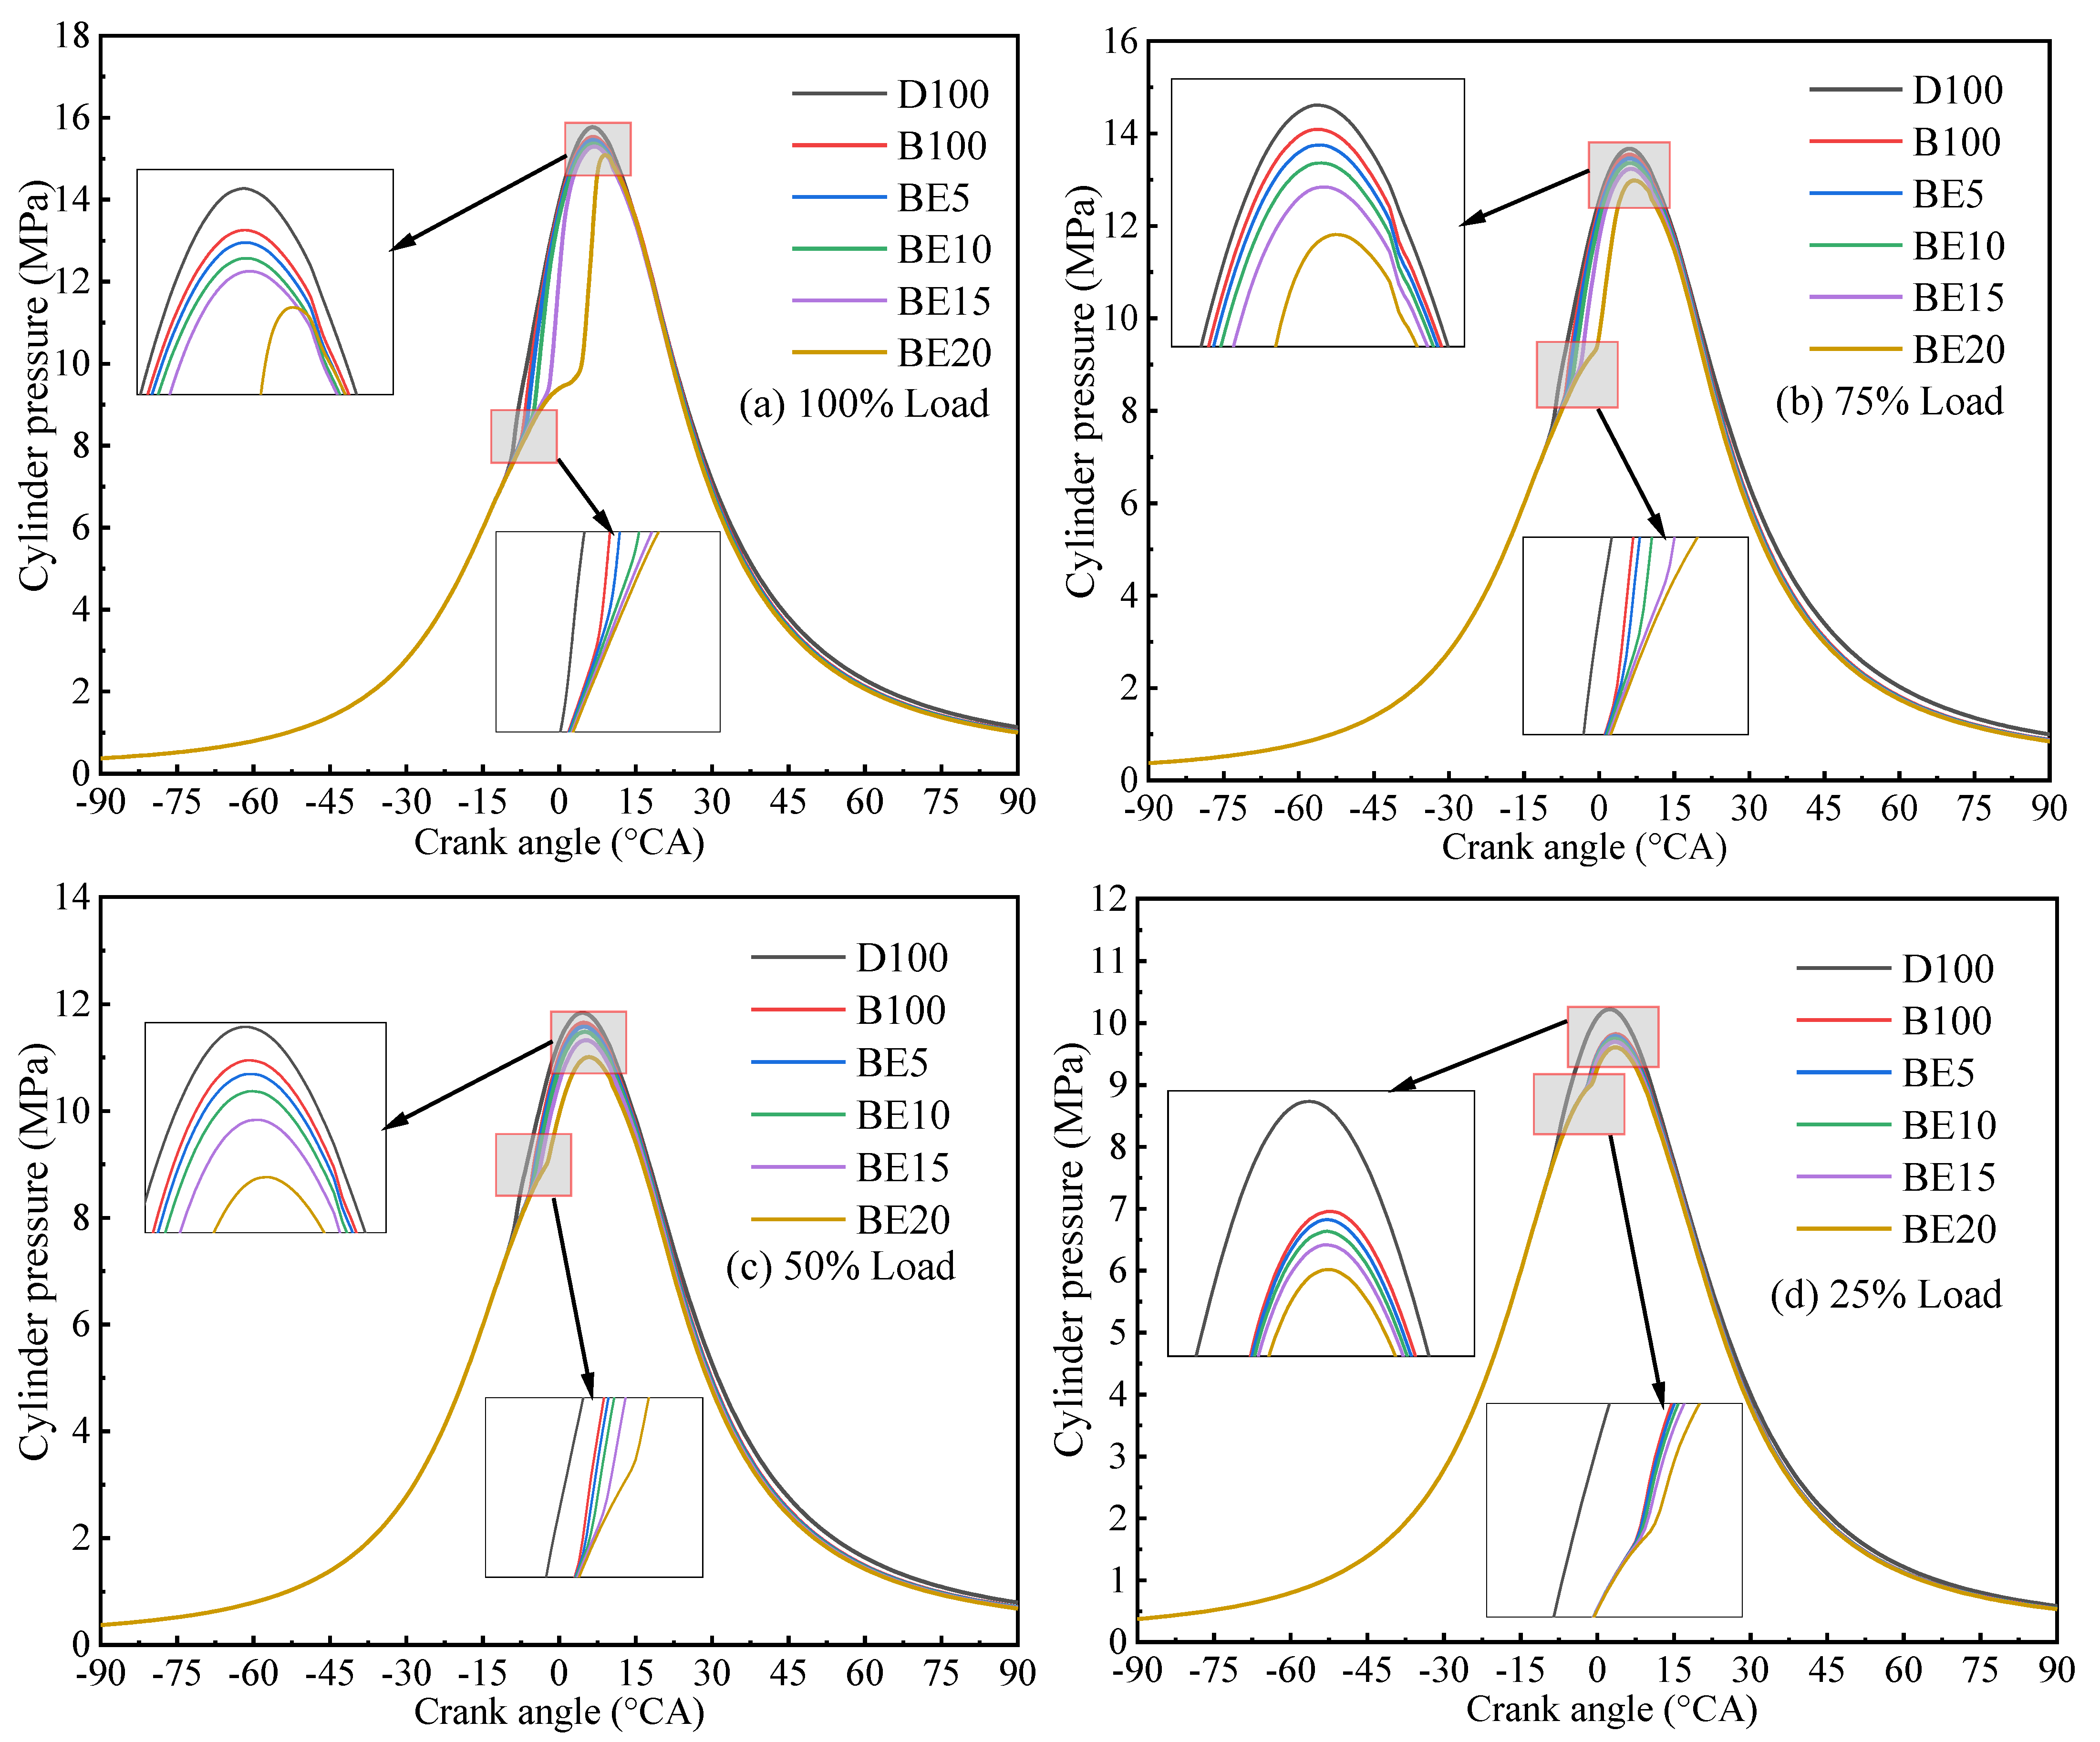
3.2.1. Cylinder Pressure
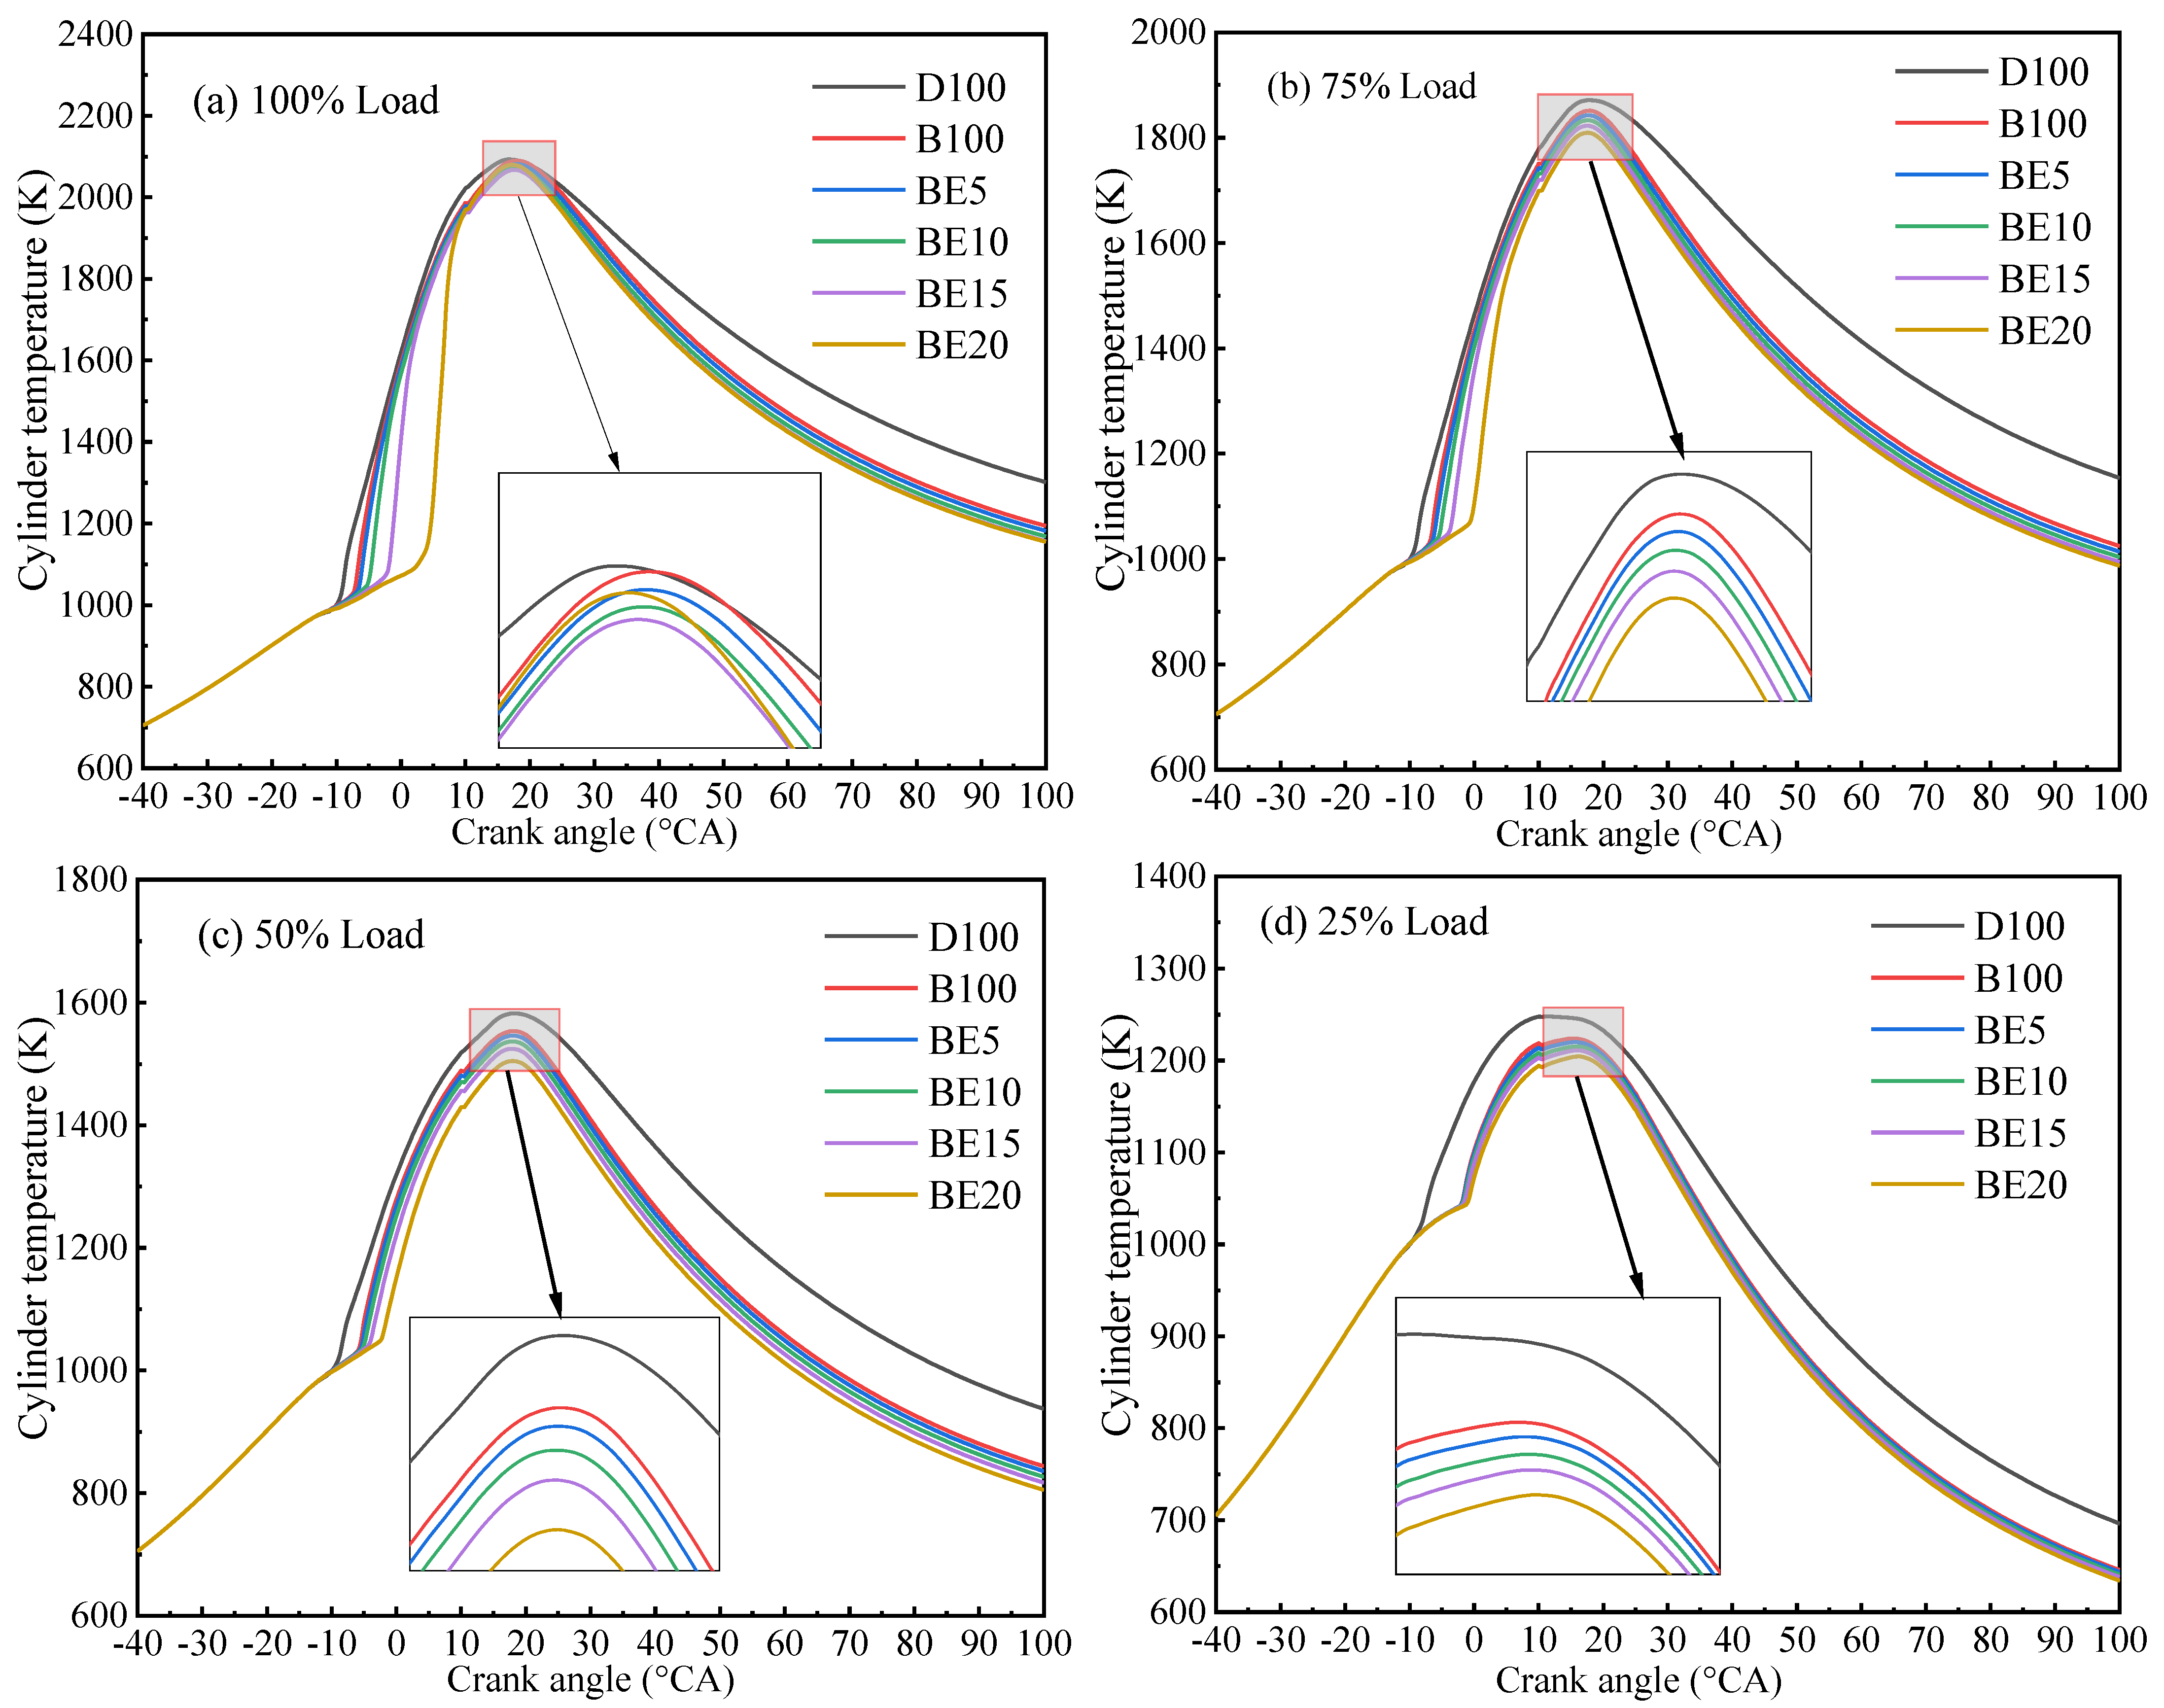
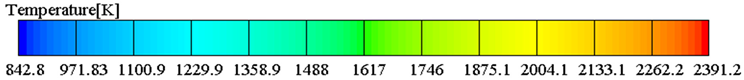
3.2.2. Cylinder Temperature
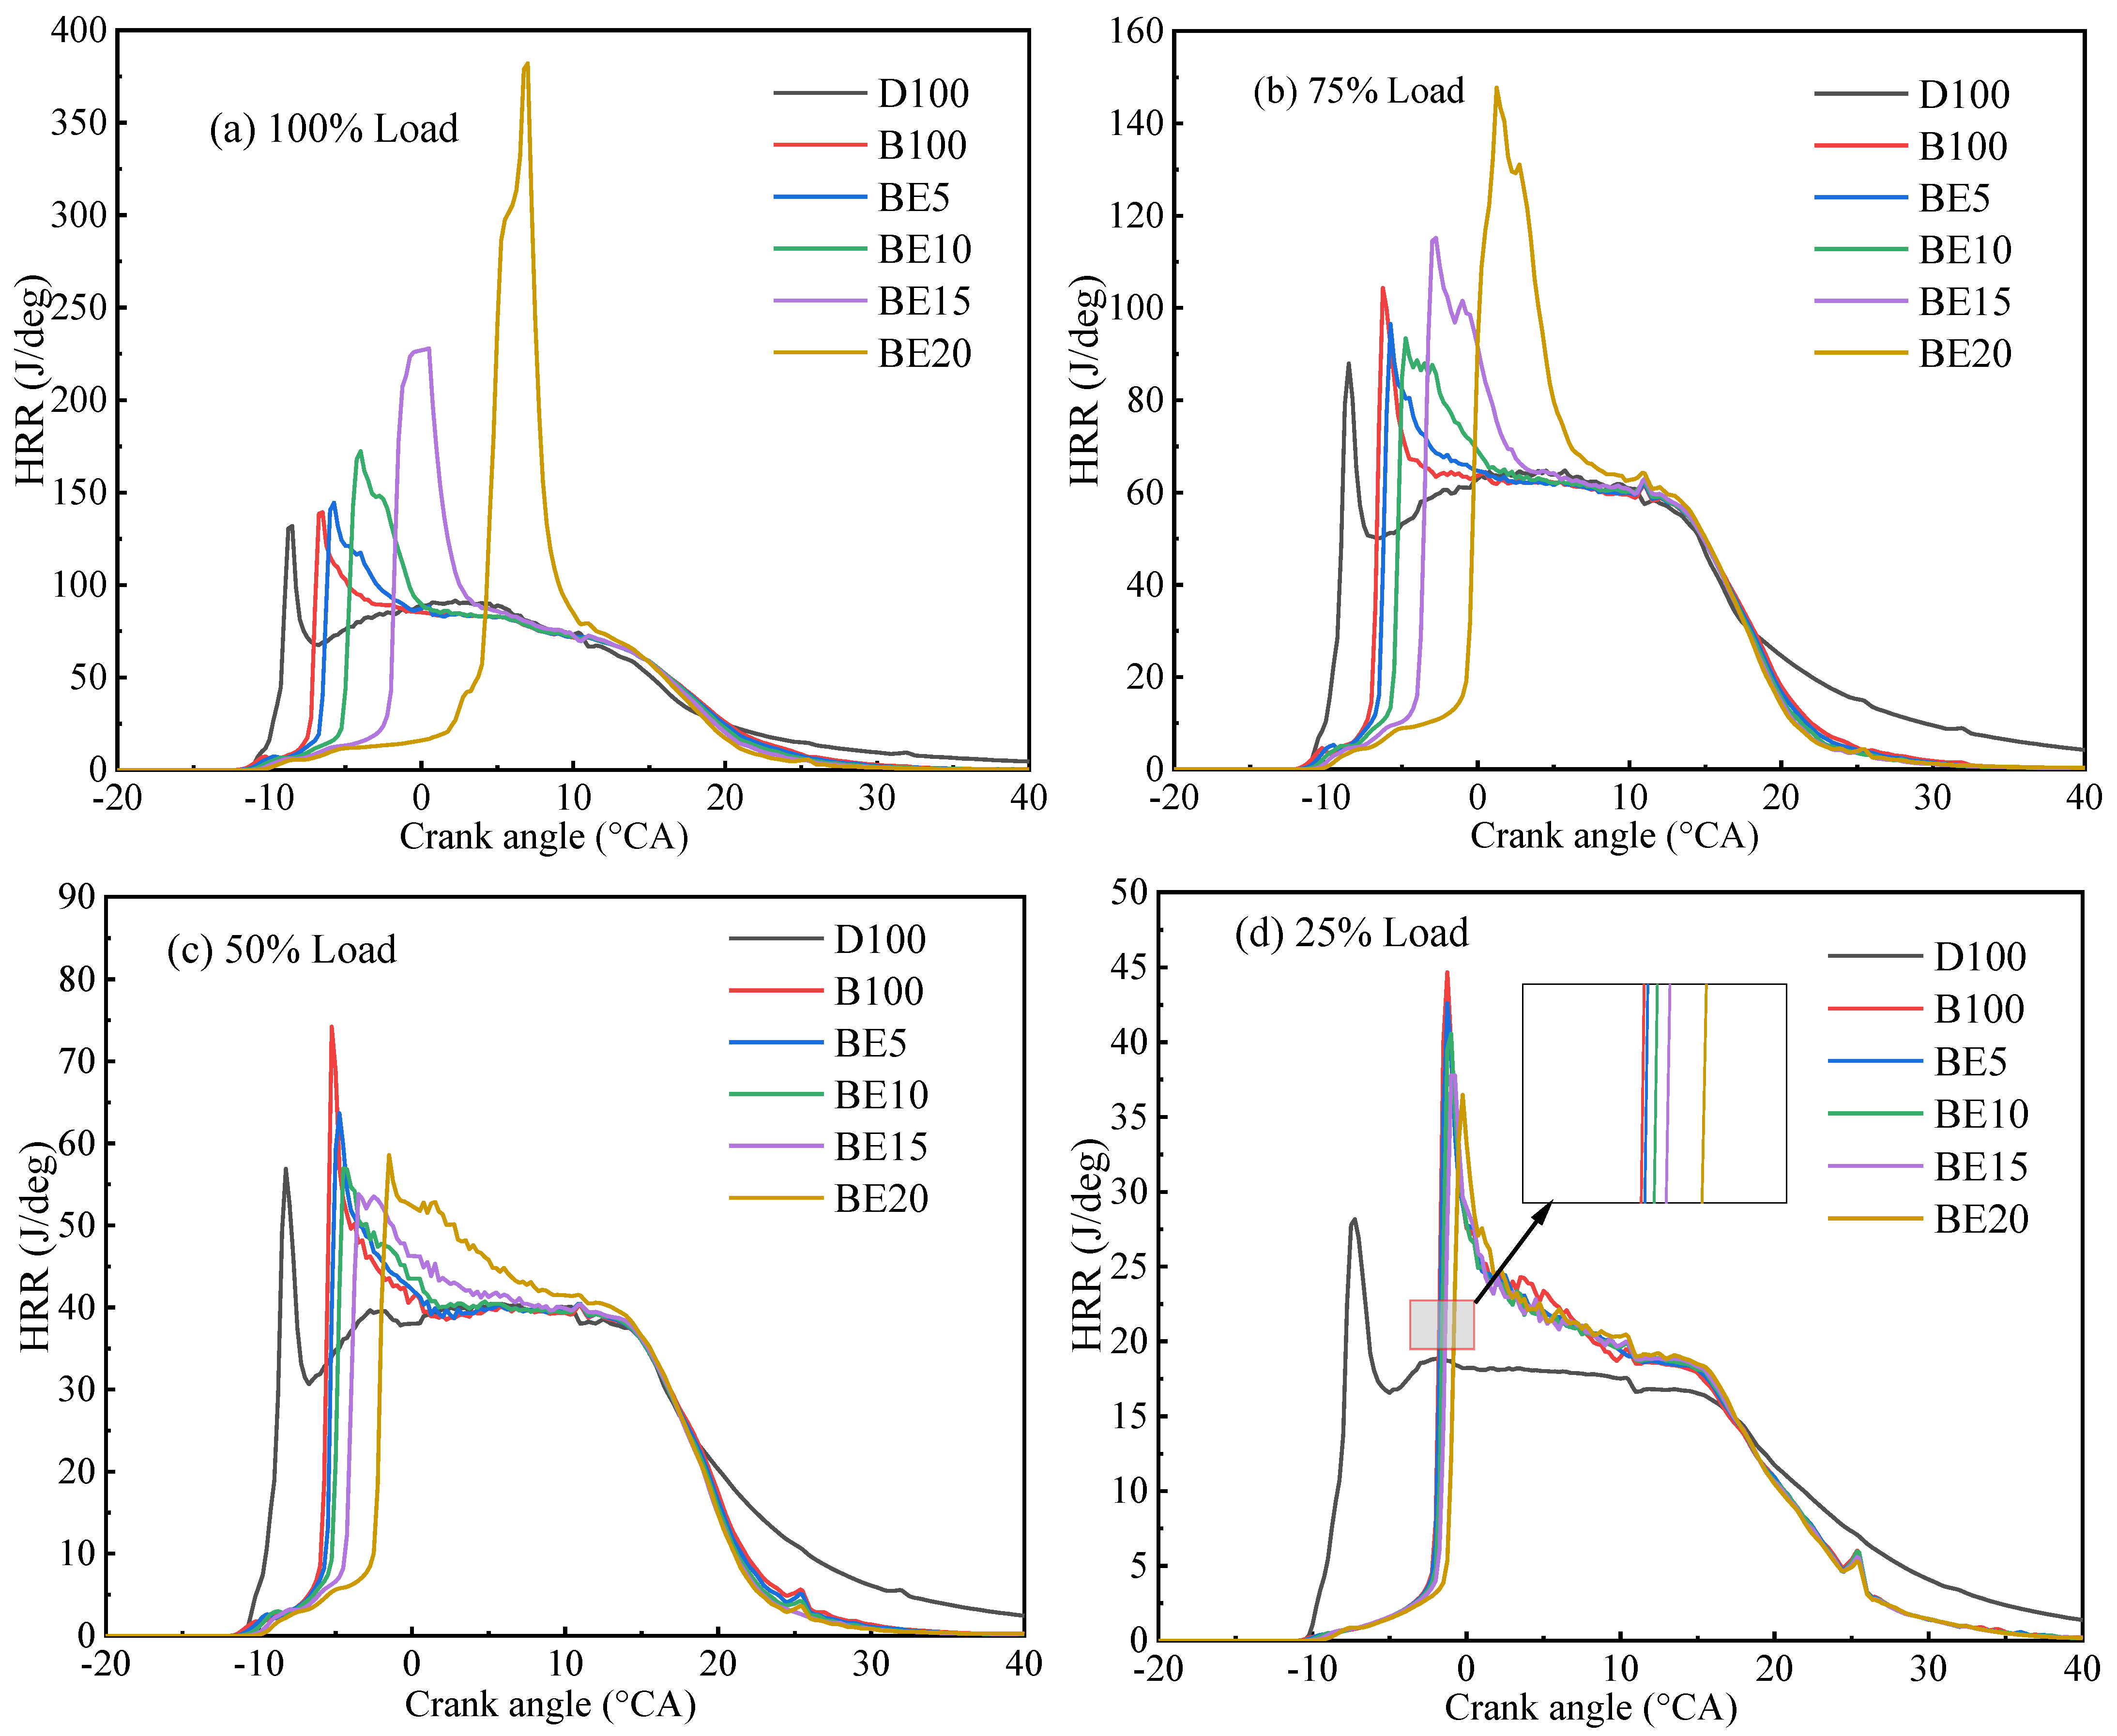
3.2.3. Heat Release Rate
3.3. Emission Characteristics
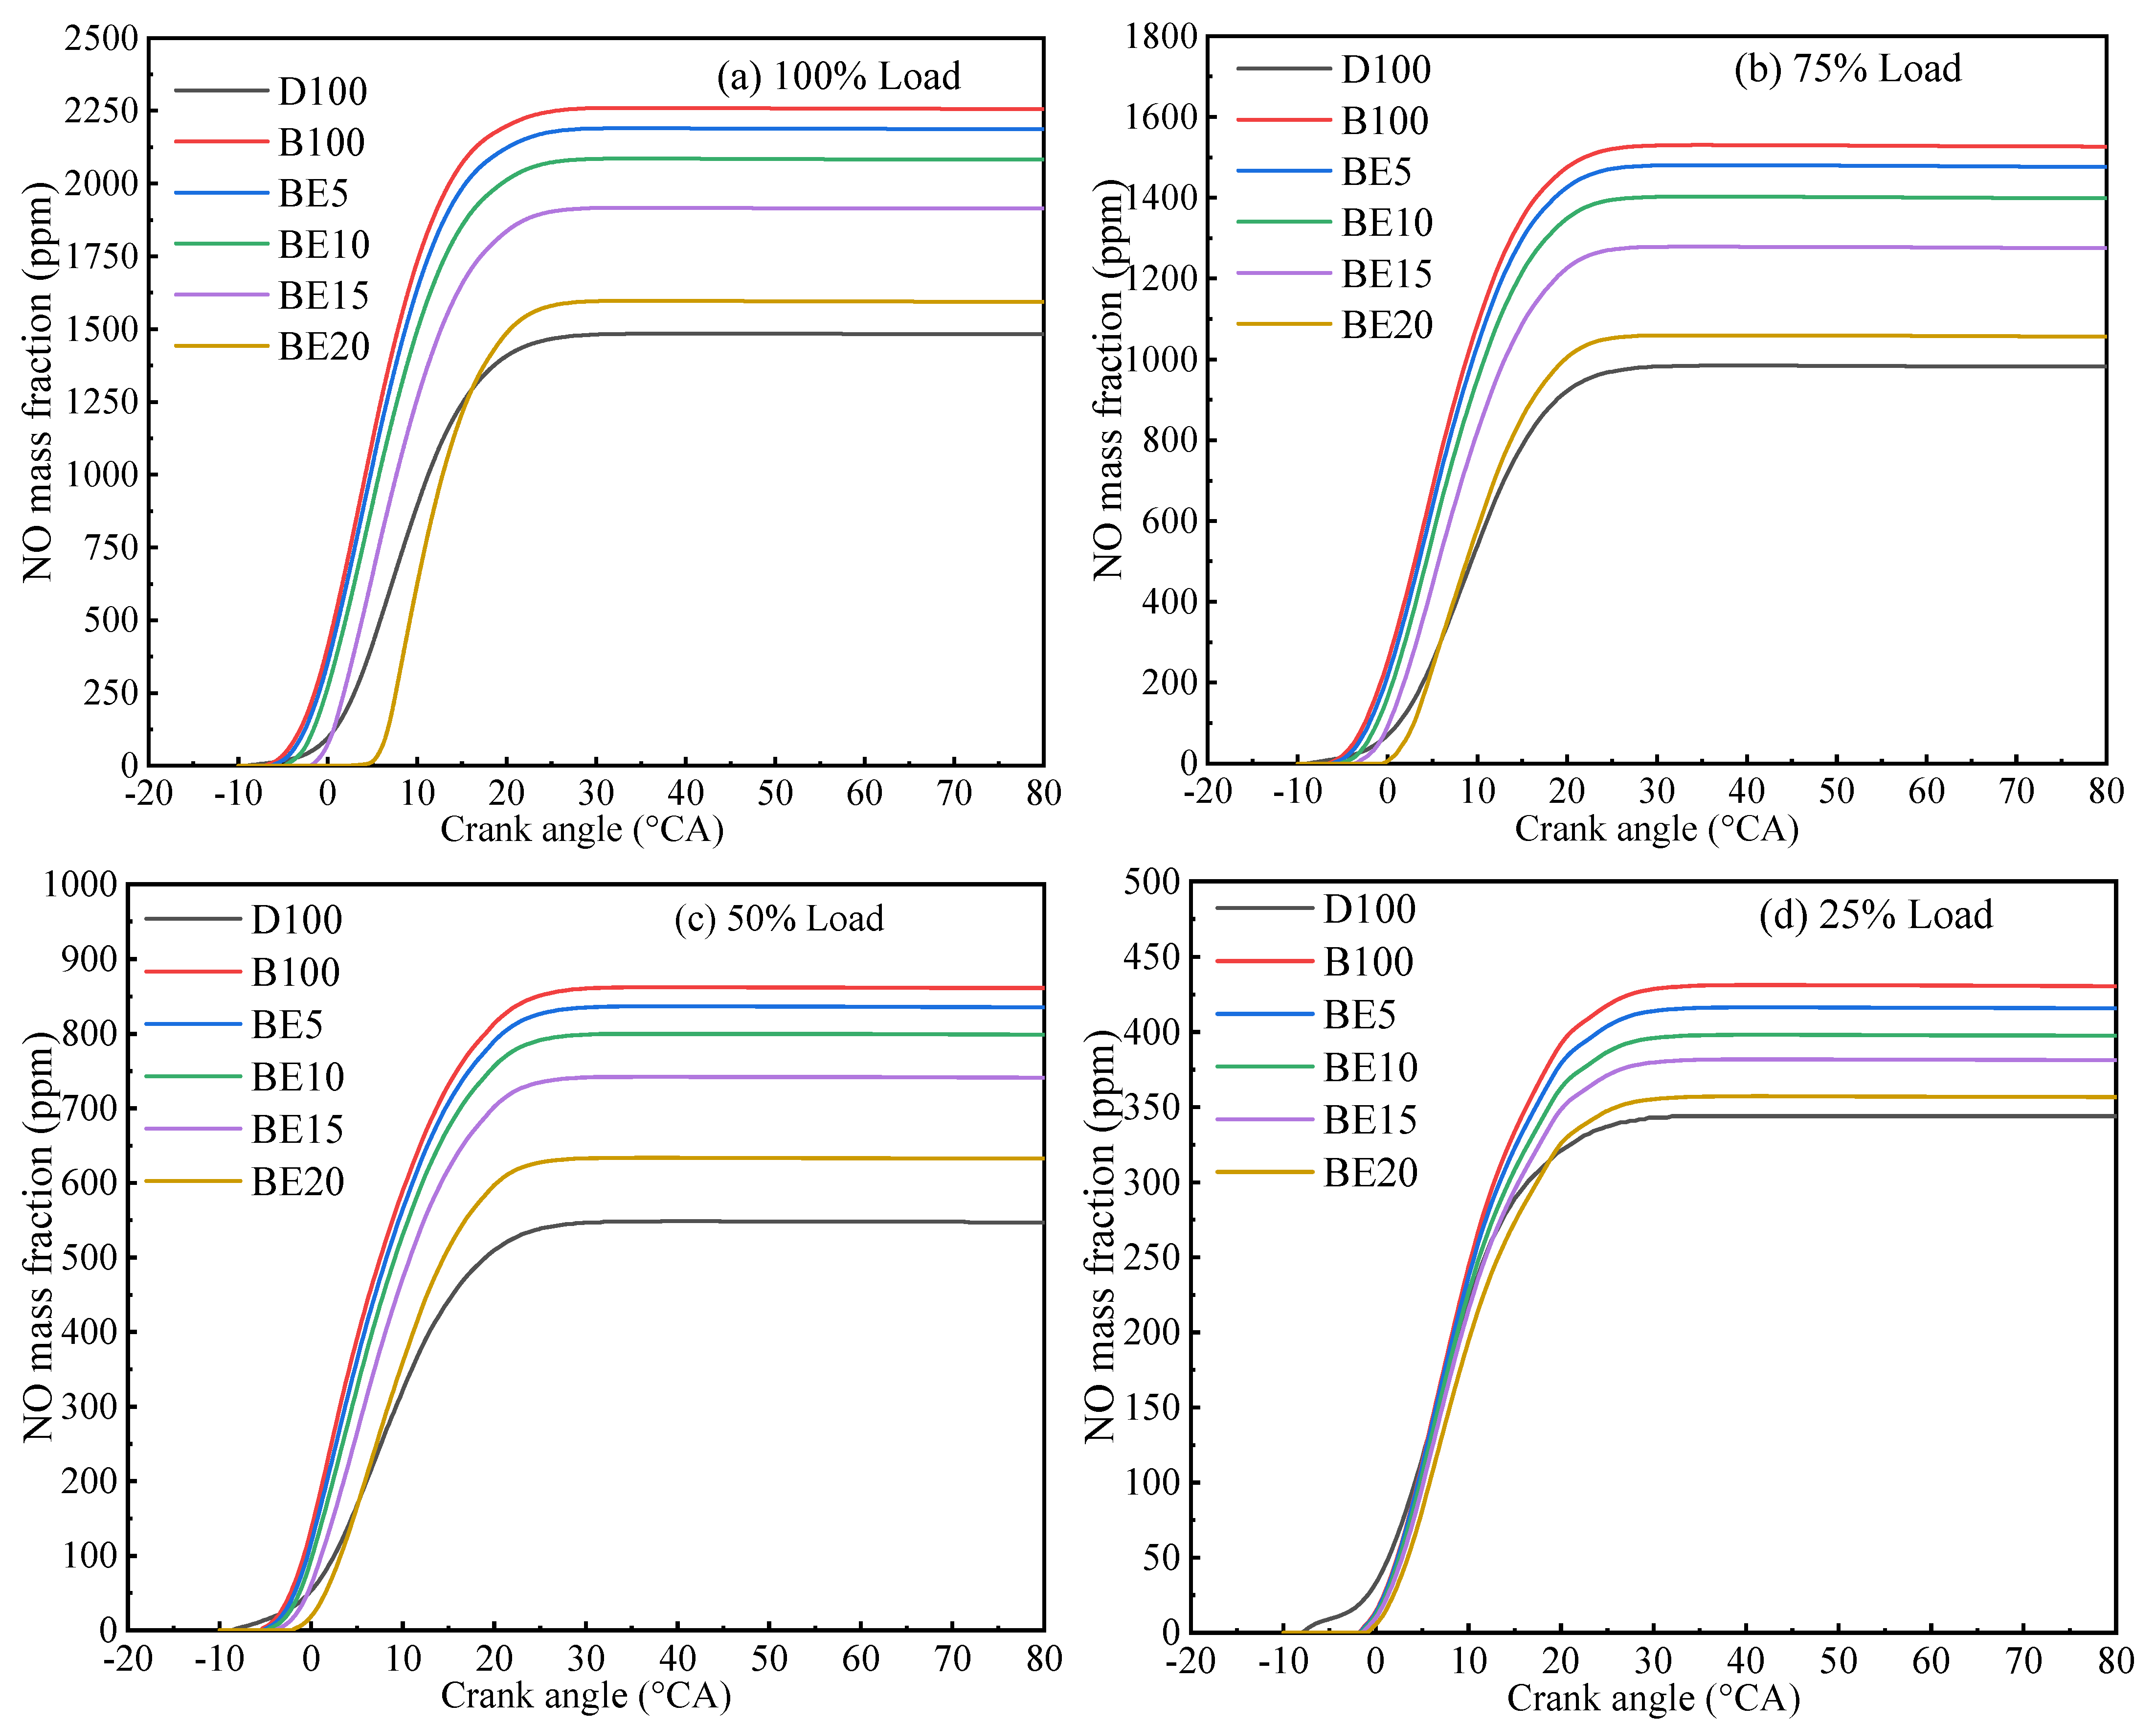
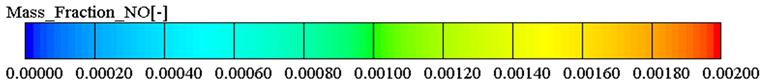
3.3.1. Nitrogen Oxide Emission
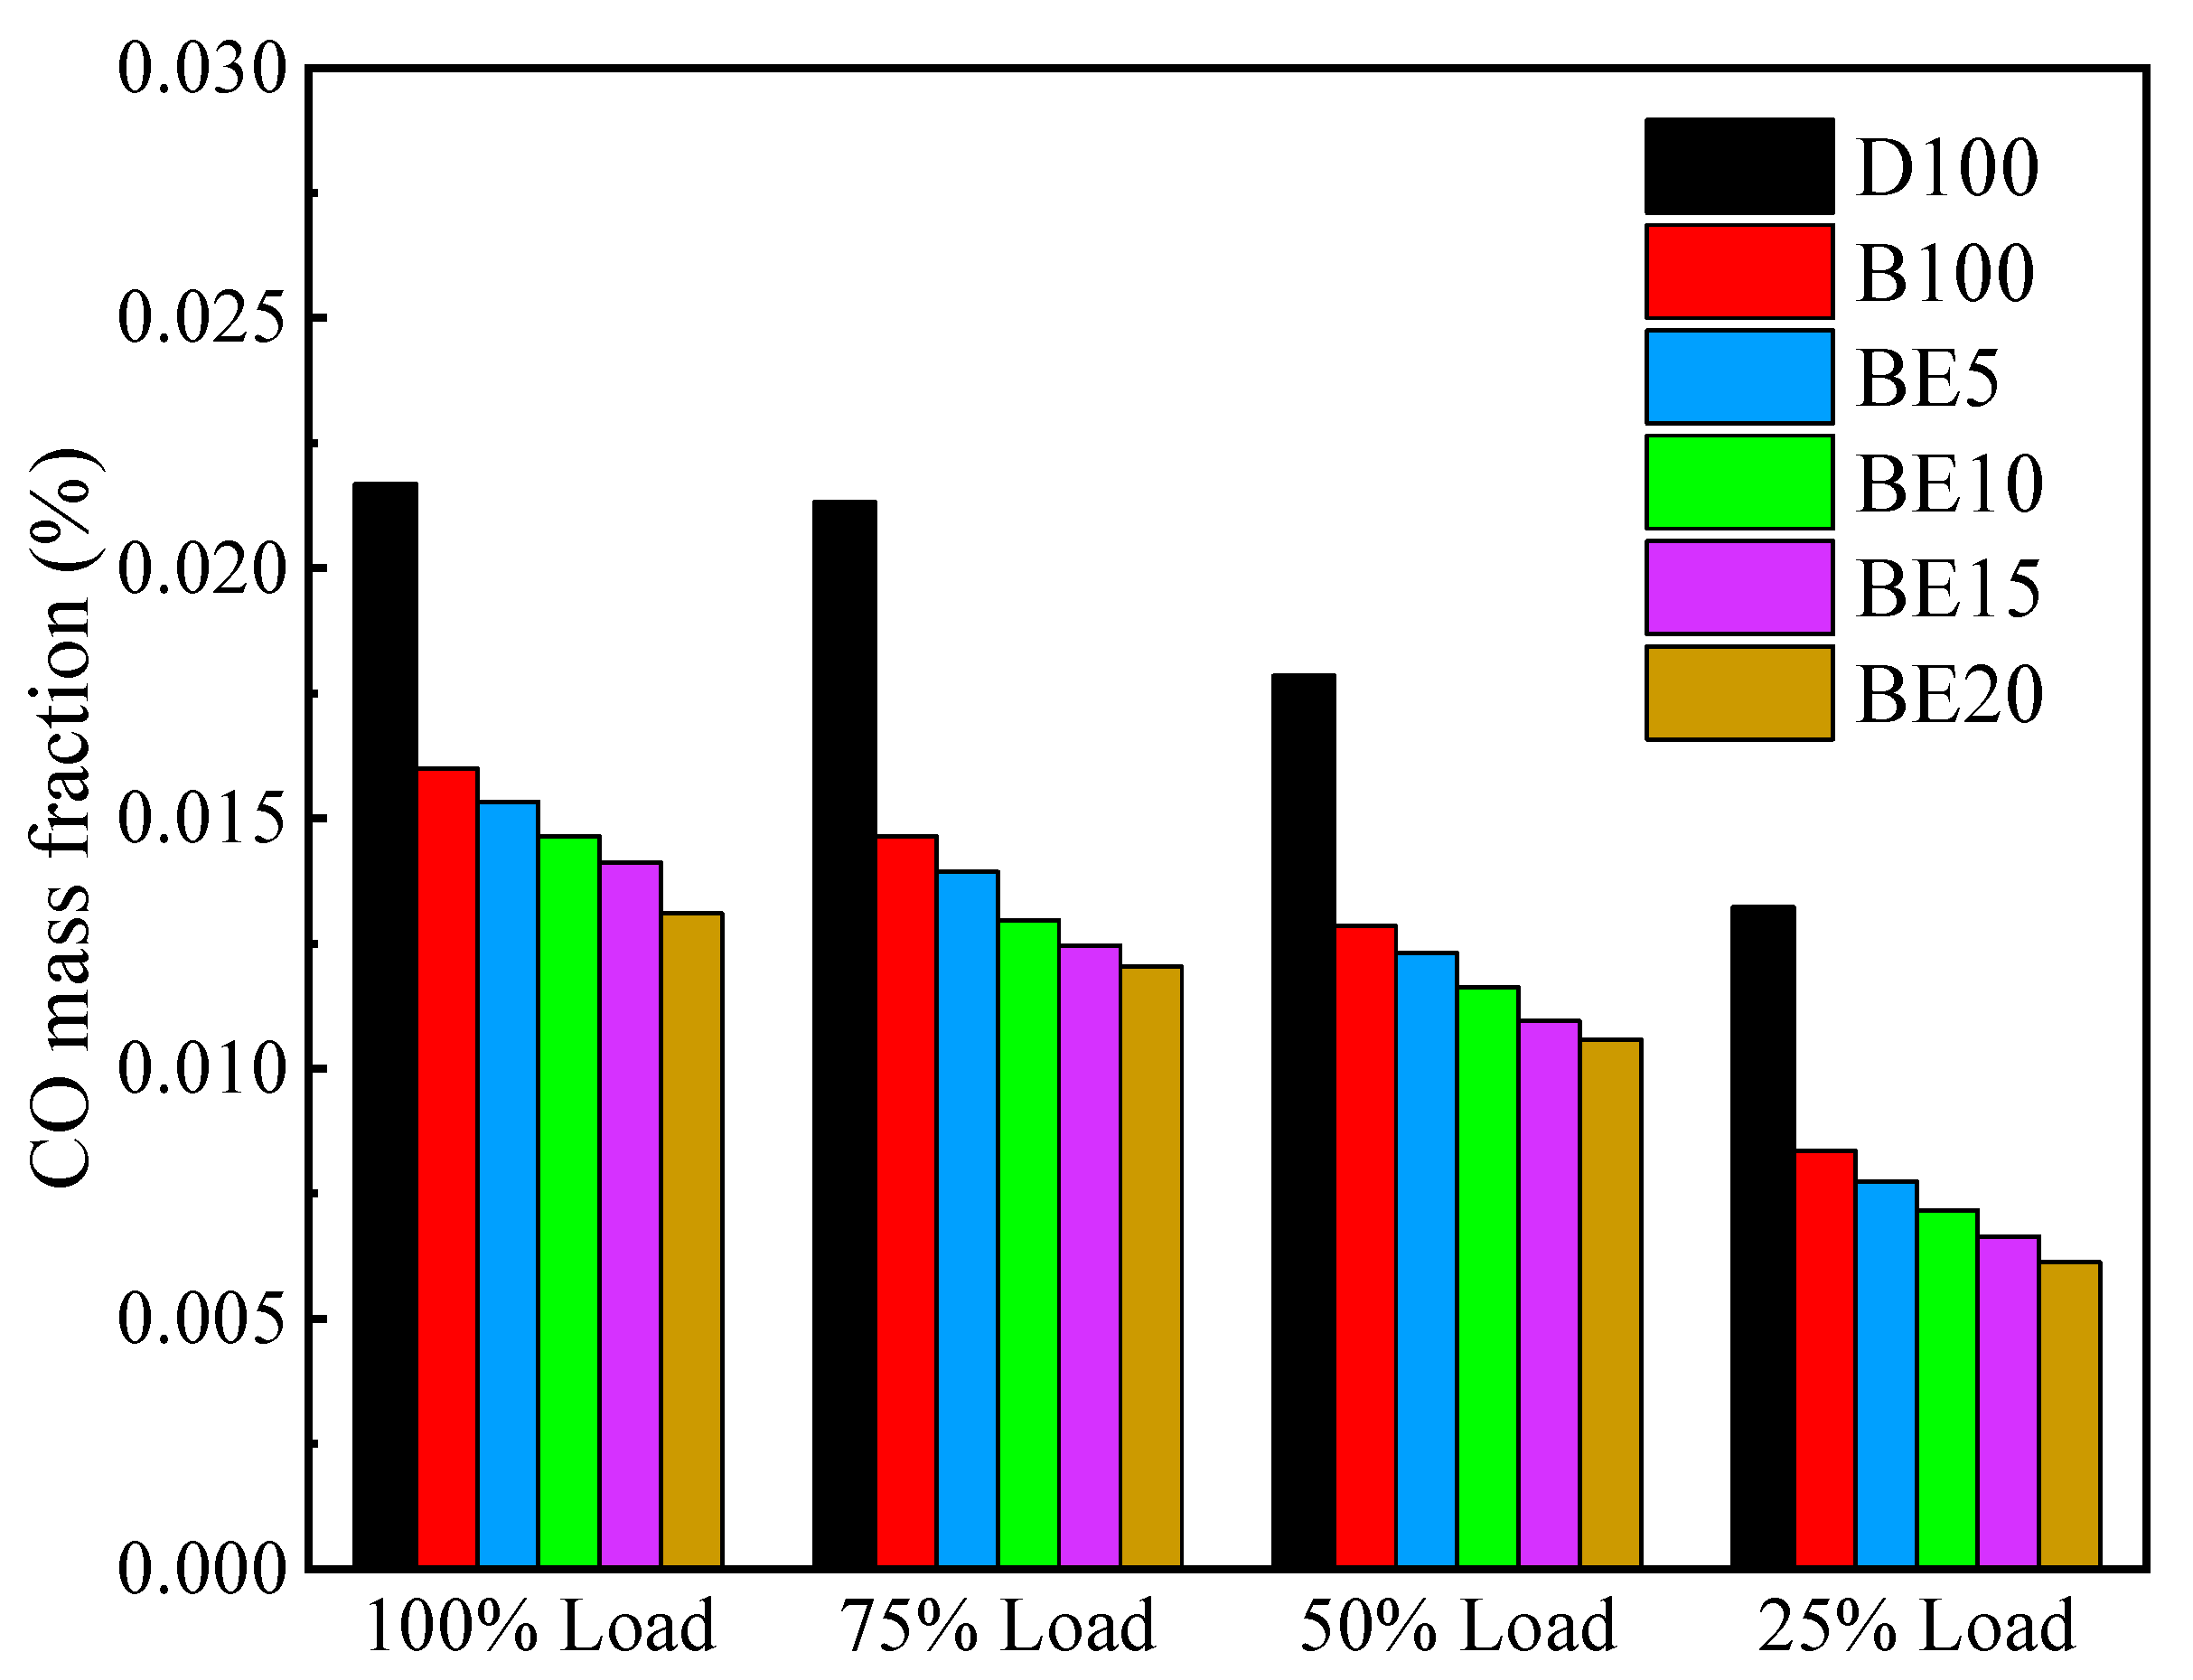
3.3.2. Carbon Monoxide Emission
3.3.3. Soot Emission
4. Conclusions
- (1)
- Ethanol addition ratios mainly influence the performance characteristic of the diesel engine at different loads. The engine’s brake power is reduced and the BSFC is increased due to the lower heating value of ethanol. However, the BTE value of the engine increases with the proportion of ethanol in the blended fuel. More specifically, the BTEs of B100, BE5, BE10, BE15, and BE20 increased by 1.32%, 1.86%, 2.09%, 1.70%, and 1.33%, compared with diesel at full engine load.
- (2)
- With increase in ethanol addition, the cylinder pressure and temperature are reduced. It is due to the lower heating value of ethanol. Specifically, the maximum cylinder pressure value and cylinder temperature reduction were observed in BE20 for 4.31% and BE15 for 1.23% compared with biodiesel, at full engine load.
- (3)
- Ethanol added to biodiesel can significantly decrease NOx, CO, and soot emissions compared with biodiesel. Specifically, the maximum reduction of NOx and CO emissions are 29.32% and 39.57% in BE20 at full engine load. Compared with biodiesel, the soot emission is reduced by 7.06%.
Author Contributions
Funding
Institutional Review Board Statement
Informed Consent Statement
Data Availability Statement
Conflicts of Interest
References
- Zhang, Z.; Tian, J.; Xie, G.; Li, J.; Xu, W.; Jiang, F.; Huang, Y.; Tan, D. Investigation on the combustion and emission characteristics of diesel engine fueled with diesel/methanol/n-butanol blends. Fuel 2022, 314, 123088. [Google Scholar] [CrossRef]
- Xie, B.; Peng, Q.; Yang, W.; Li, S.; E, J.; Li, Z.; Tao, M.; Zhang, A. Effect of pins and exit-step on thermal performance and energy efficiency of hydrogen-fueled combustion for micro-thermophotovoltaic. Energy 2022, 239, 122341. [Google Scholar] [CrossRef]
- Zhong, W.; Mahmoud, N.; Wang, Q. Experimental and modeling study of the autoignition characteristics of gasoline/hydrogenated catalytic biodiesel blends over low-to-intermediate temperature. Fuel 2022, 313, 122919. [Google Scholar] [CrossRef]
- Zhong, W.; Mahmoud, N.; Wang, Q. Numerical study of spray combustion and soot emission of gasoline–biodiesel fuel under gasoline compression ignition-relevant conditions. Fuel 2022, 310, 122293. [Google Scholar] [CrossRef]
- Zhang, Z.; E, J.; Deng, Y.; Pham, M.; Zuo, W.; Peng, Q.; Yin, Z. Effects of fatty acid methyl esters proportion on combustion and emission characteristics of a biodiesel fueled diesel engine. Energy Convers. Manag. 2018, 159, 244–253. [Google Scholar] [CrossRef]
- Zhang, Z.; E, J.; Chen, J.; Zhu, H.; Zhao, X.; Han, D.; Zuo, W.; Peng, Q.; Gong, J.; Yin, Z. Effects of low-level water addition on spray, combustion and emission characteristics of a medium speed diesel engine fueled with biodiesel fuel. Fuel 2019, 239, 245–262. [Google Scholar] [CrossRef]
- E, J.; Zhang, Z.; Chen, J.; Pham, M.; Zhao, X.; Peng, Q.; Zhang, B.; Yin, Z. Performance and emission evaluation of a marine diesel engine fueled by water biodiesel-diesel emulsion blends with a fuel additive of a cerium oxide nanoparticle. Energy Convers. Manag. 2018, 169, 194–205. [Google Scholar] [CrossRef]
- Zhong, W.; Pachiannan, T.; He, Z.; Xuan, T.; Wang, Q. Experimental study of ignition, lift-off length and emission characteristics of diesel/hydrogenated catalytic biodiesel blends. Appl. Energy 2019, 235, 641–652. [Google Scholar] [CrossRef]
- Peng, Q.; Xie, B.; Yang, W.; Tang, S.; Li, Z.; Zhou, P.; Luo, N. Effects of porosity and multilayers of porous medium on the hy-drogen-fueled combustion and micro-thermophotovoltaic. Renew. Energy 2021, 174, 391–402. [Google Scholar] [CrossRef]
- Zhang, B.; Li, X.; Zuo, Q.; Yin, Z.; Zhang, J.; Chen, W.; Lu, C.; Tan, D. Effects analysis on hydrocarbon light-off performance of a catalytic gasoline particulate filter during cold start. Environ. Sci. Pollut. Res. 2022. [Google Scholar] [CrossRef]
- Zhong, W.; He, Z.; Wang, Q.; Shao, Z.; Tao, X. Experimental study of combustion and emission characteristics of diesel engine with diesel/second-generation biodiesel blending fuels. Energy Convers. Manag. 2016, 121, 241–250. [Google Scholar] [CrossRef]
- E, J.; Liu, G.; Zhang, Z.; Han, D.; Chen, J.; Wei, K.; Gong, J.; Yin, Z. Effect analysis on cold starting performance enhancement of a diesel engine fueled with biodiesel fuel based on an improved thermodynamic model. Appl. Energy. 2019, 243, 321–335. [Google Scholar] [CrossRef]
- Peng, Q.; Wei, J.; Yang, W.; E, J. Study on combustion characteristic of premixed H2/C3H8/air and working performance in the micro combustor with block. Fuel 2022, 318, 123676. [Google Scholar] [CrossRef]
- Zhang, B.; E, J.; Gong, J.; Zhao, X.; Hu, W. Influence of structural and operating factors on performance degradation of the diesel particulate filter based on composite regeneration. Appl. Therm. Eng. 2017, 121, 838–852. [Google Scholar] [CrossRef]
- Aydin, H.; İlkılıç, C. Effect of ethanol blending with biodiesel on engine performance and exhaust emissions in a CI engine. Appl. Therm. Eng. 2010, 30, 1199–1204. [Google Scholar] [CrossRef]
- Zhang, B.; Zuo, H.; Huang, Z.; Tan, J.; Zuo, Q. Endpoint forecast of different diesel-biodiesel soot filtration process in diesel particulate filters considering ash deposition. Fuel 2020, 272, 117678. [Google Scholar] [CrossRef]
- Zhang, Z.; Ye, J.; Tan, D.; Feng, Z.; Luo, J.; Tan, Y.; Huang, Y. The effects of Fe2O3 based DOC and SCR catalyst on the combustion and emission characteristics of a diesel engine fueled with biodiesel. Fuel 2021, 290, 120039. [Google Scholar] [CrossRef]
- Zhang, Z.; Ye, J.; Lv, J.; Xu, W.; Tan, D.; Jiang, F.; Huang, H. Investigation on the effects of non-uniform porosity catalyst on SCR characteristic based on the field synergy analysis. J. Environ. Chem. Eng. 2022, 10, 107056. [Google Scholar] [CrossRef]
- Biswas, S.; Kakati, D.; Chakraborti, P.; Banerjee, R. Assessing the potential of ethanol in the transition of biodiesel combustion to RCCI regimes under varying injection phasing strategies: A performance-emission-stability and tribological perspective. Fuel 2021, 304, 121346. [Google Scholar] [CrossRef]
- Zhu, L.; Cheung, C.S.; Zhang, W.G.; Huang, Z. Combustion, performance and emission characteristics of a DI diesel engine fueled with ethanol–biodiesel blends. Fuel 2011, 90, 1743–1750. [Google Scholar] [CrossRef]
- Wu, G.; Ge, J.C.; Choi, N.J. Effect of Ethanol Additives on Combustion and Emissions of a Diesel Engine Fueled by Palm Oil Biodiesel at Idling Speed. Energies 2021, 14, 1428. [Google Scholar] [CrossRef]
- Gawale, G.R.; Naga Srinivasulu, G. Experimental investigation of ethanol/diesel and ethanol/biodiesel on dual fuel mode HCCI engine for different engine load conditions. Fuel 2020, 263, 116725. [Google Scholar] [CrossRef]
- Jiang, Z.; Gan, Y.; Ju, Y.; Liang, J.; Zhou, Y. Experimental study on the electrospray and combustion characteristics of biodiesel-ethanol blends in a meso-scale combustor. Energy 2019, 179, 843–849. [Google Scholar] [CrossRef]
- Zhang, Z.; Lv, J.; Xie, G.; Wang, S.; Ye, Y.; Huang, G.; Tan, D. Effect of assisted hydrogen on combustion and emission charac-teristics of a diesel engine fueled with biodiesel. Energy 2022, 254, 124269. [Google Scholar] [CrossRef]
- Zhang, Z.; Li, J.; Tian, J.; Zhong, Y.; Zou, Z.; Dong, R.; Gao, S.; Xu, W.; Tan, D. The effects of Mn-based catalysts on the selective catalytic reduction of NOx with NH3 at low temperature: A review. Fuel Process. Technol. 2022, 230, 107213. [Google Scholar] [CrossRef]
- An, H.; Yang, W.M.; Li, J. Numerical modeling on a diesel engine fueled by biodiesel–methanol blends. Energy Convers. Manag. 2015, 93, 100–108. [Google Scholar] [CrossRef]
- An, H.; Yang, W.M.; Li, J. Effects of ethanol addition on biodiesel combustion: A modeling study. Appl. Energy. 2015, 143, 176–188. [Google Scholar] [CrossRef]
- Yilmaz, N. Performance and emission characteristics of a diesel engine fuelled with biodiesel–ethanol and biodiesel–methanol blends at elevated air temperatures. Fuel 2012, 94, 440–443. [Google Scholar] [CrossRef]
- Datta, A.; Mandal, B.K. Engine performance, combustion and emission characteristics of a compression ignition engine operating on different biodiesel-alcohol blends. Energy 2017, 125, 470–483. [Google Scholar] [CrossRef]
- Asadi, A.; Kadijani, O.N.; Doranehgard, M.H.; Bozorg, M.V.; Xiong, Q.; Shadloo, M.S.; Li, L.K.B. Numerical study on the application of biodiesel and bioethanol in a multiple injection diesel engine. Renew. Energy 2020, 150, 1019–1029. [Google Scholar] [CrossRef]
- Li, J.; Zhang, Z.; Ye, Y.; Li, W.; Yuan, T.; Wang, H.; Li, Y.; Tan, D.; Zhang, C. Effects of different injection timing on the performance, combustion and emission characteristics of diesel/ethanol/n-butanol blended diesel engine based on multi-objective optimization theory. Energy 2022, 260, 125056. [Google Scholar] [CrossRef]
- Jurić, F.; Petranović, Z.; Vujanović, M.; Katrašnik, T.; Vihar, R.; Wang, X.; Duić, N. Experimental and numerical investigation of injection timing and rail pressure impact on combustion characteristics of a diesel engine. Energy Convers. Manag. 2019, 185, 730–739. [Google Scholar] [CrossRef]
- Zhang, Z.; Li, J.; Tian, J.; Dong, R.; Zou, Z.; Gao, S.; Tan, D. Performance, combustion and emission characteristics investigations on a diesel engine fueled with diesel/ethanol/n-butanol blends. Energy 2022, 249, 123733. [Google Scholar] [CrossRef]
- Luo, Z.; Plomer, M.; Lu, T.; Som, S.; Longman, D.E.; Sarathy, S.M.; Pitz, W.J. A reduced mechanism for biodiesel surrogates for compression ignition engine applications. Fuel 2012, 99, 143–153. [Google Scholar] [CrossRef]
- Li, X.; Yao, X.; Shen, T. Combustion Reaction Mechanism Construction by Two-parameter Rate Constant Method. Chem. J. Chin. Univ. 2020, 41, 512–520. [Google Scholar]
- Shojae, K.; Mahdavian, M.; Khoshandam, B.; Karimi-Maleh, H. Improving of CI engine performance using three different types of biodiesel. Process Saf. Environ. Prot. 2021, 149, 977–993. [Google Scholar] [CrossRef]
- Zhang, Z.; Lv, J.; Li, W.; Long, J.; Wang, S.; Tan, D.; Yin, Z. Performance and emission evaluation of a marine diesel engine fueled with natural gas ignited by biodiesel-diesel blended fuel. Energy 2022, 256, 124662. [Google Scholar] [CrossRef]
- Shirneshan, A.; Bagherzadeh, S.A.; Najafi, G.; Mamat, R.; Mazlan, M. Optimization and investigation the effects of using biodiesel-ethanol blends on the performance and emission characteristics of a diesel engine by genetic algorithm. Fuel 2021, 289, 119753. [Google Scholar] [CrossRef]
- Yesilyurt, M.K.; Aydin, M. Experimental investigation on the performance, combustion and exhaust emission characteristics of a compression-ignition engine fueled with cottonseed oil biodiesel/diethyl ether/diesel fuel blends. Energy Convers. Manag. 2020, 205, 112355. [Google Scholar] [CrossRef]
- Wei, L.; Cheung, C.S.; Ning, Z. Effects of biodiesel-ethanol and biodiesel-butanol blends on the combustion, performance and emissions of a diesel engine. Energy 2018, 155, 957–970. [Google Scholar] [CrossRef]
- Zhang, Z.; Tian, J.; Li, J.; Lv, J.; Wang, S.; Zhong, Y.; Dong, R.; Gao, S.; Cao, C.; Tan, D. Investigation on combustion, performance and emission characteristics of a diesel engine fueled with diesel/alcohol/n-butanol blended fuels. Fuel 2022, 320, 123975. [Google Scholar] [CrossRef]
- Tutak, W.; Jamrozik, A.; Pyrc, M.; Sobiepański, M. A comparative study of co-combustion process of diesel-ethanol and biodiesel-ethanol blends in the direct injection diesel engine. Appl. Therm. Eng. 2017, 117, 155–163. [Google Scholar] [CrossRef]
- Zuo, L.; Wang, J.; Mei, D.; Dai, S.; Adu-Mensah, D. Experimental investigation on combustion and (regulated and unregulated) emissions performance of a common-rail diesel engine using partially hydrogenated biodiesel-ethanol-diesel ternary blend. Renew. Energy. 2022, 185, 1272–1283. [Google Scholar] [CrossRef]
- Tongroon, M.; Saisirirat, P.; Suebwong, A.; Aunchaisri, J.; Kananont, M.; Chollacoop, N. Combustion and emission characteristics investigation of diesel-ethanol-biodiesel blended fuels in a compression-ignition engine and benefit analysis. Fuel 2019, 255, 115728. [Google Scholar] [CrossRef]
- Ma, Q.; Zhang, Q.; Zheng, Z. An experimental assessment on low temperature combustion using diesel/biodiesel/C2, C5 alcohol blends in a diesel engine. Fuel 2021, 288, 119832. [Google Scholar] [CrossRef]
- Zhang, Q.; Chen, G.; Zheng, Z.; Liu, H.; Xu, J.; Yao, M. Combustion and emissions of 2, 5-dimethylfuran addition on a diesel engine with low temperature combustion. Fuel 2013, 103, 730–735. [Google Scholar] [CrossRef]
- Gowrishankar, S.; Krishnasamy, A. A relative assessment of emulsification and water injection methods to mitigate higher oxides of nitrogen emissions from biodiesel fueled light-duty diesel engine. Fuel 2022, 308, 121926. [Google Scholar] [CrossRef]
- Rajesh, K.; Natarajan, M.P.; Devan, P.K.; Ponnuvel, S. Coconut fatty acid distillate as novel feedstock for biodiesel production and its characterization as a fuel for diesel engine. Renew. Energy 2021, 164, 1424–1435. [Google Scholar] [CrossRef]
- Qi, D.; Ma, L.; Chen, R.; Jin, X.; Xie, M. Effects of EGR rate on the combustion and emission characteristics of diesel-palm oil-ethanol ternary blends used in a CRDI diesel engine with double injection strategy. Appl. Therm. Eng. 2021, 199, 117530. [Google Scholar] [CrossRef]
- Kodate, S.V.; Raju, P.S.; Yadav, A.K.; Kumar, G.N. Effect of fuel preheating on performance, emission and combustion characteristics of a diesel engine fuelled with Vateria indica methyl ester blends at various loads. J. Environ. Manag. 2022, 304, 114284. [Google Scholar] [CrossRef]
- Sathish, T.; Mohanavel, V.; Arunkumar, M.; Rajan, K.; Soudagar, M.E.M.; Mujtaba, M.A.; Salmen, S.H.; Al Obaid, S.; Fayaz, H.; Sivakumar, S. Utilization of Azadirachta indica biodiesel, ethanol and diesel blends for diesel engine applications with engine emission profile. Fuel 2022, 319, 123798. [Google Scholar] [CrossRef]
- Fan, L.; Cheng, F.; Zhang, T.; Liu, G.; Yuan, J.; Mao, P. Visible-light photoredox-promoted desilylative allylation of α-silylamines: An efficient route to synthesis of homoallylic amines. Tetrahedron Lett. 2021, 81, 153357. [Google Scholar] [CrossRef]
- Tan, D.; Chen, Z.; Li, J.; Luo, J.; Yang, D.; Cui, S.; Zhang, Z. Effects of Swirl and Boiling Heat Transfer on the Performance Enhancement and Emission Reduction for a Medium Diesel Engine Fueled with Biodiesel. Processes 2021, 9, 568. [Google Scholar] [CrossRef]
- Zhang, Z.; Tian, J.; Li, J.; Cao, C.; Wang, S.; Lv, J.; Zheng, W.; Tan, D. The development of diesel oxidation catalysts and the effect of sulfur dioxide on catalysts of metal-based diesel oxidation catalysts: A review. Fuel Process. Technol. 2022, 233, 107317. [Google Scholar]


| Performance Index | Unit | Value or Description |
|---|---|---|
| Engine type | - | Four-cylinder, turbocharged, |
| Bore × stroke | mm | 93 × 102 |
| Number of cylinders | - | 4 |
| Engine speed | rpm | 1800 |
| Rating power output | kW | 72 |
| Nozzle orifice diameter | mm | 0.23 |
| Fuel injection holes | - | 6 |
| Connecting rod | mm | 168 |
| Compression ratio | - | 18 |
| Type | Kinetic Viscosity (mm2/s) (at 40 °C) | Density (g/cm3) (at 20 °C) | Molecular Weight (g/mol) | Higher Calorific Value (MJ/kg) | SME (%) |
|---|---|---|---|---|---|
| C18:3 | 3.11 | 0.899 | 292 | 39.43 | 6.19 |
| C18:2 | 3.79 | 0.887 | 294 | 39.68 | 55.19 |
| C18:1 | 4.60 | 0.875 | 296 | 39.93 | 23.43 |
| C18:0 | 5.59 | 0.863 | 298 | 40.18 | 3.22 |
| C16:0 | 4.37 | 0.864 | 270 | 39.56 | 11.98 |
| Property | Diesel | Biodiesel | Ethanol | BE5 | BE10 | BE15 | BE20 |
|---|---|---|---|---|---|---|---|
| Cetane number | 50 | 53 | 6 | - | - | - | - |
| Lower heating value (MJ/kg) | 42.5 | 37.5 | 28.4 | 37.1 | 36.7 | 36.2 | 35.7 |
| Density (kg/m3) @ 20 °C | 840 | 871 | 786 | 867 | 862 | 858 | 854 |
| Viscosity (mm2/s) @ 40 °C | 2.86 | 5.28 | 1.2 | - | - | - | - |
| Heat of evaporation (kJ/kg) | 250–290 | 300 | 840 | 324.5 | 349.2 | 374.2 | 408 |
| Carbon content (% mass) | 86.6 | 77.1 | 52.2 | 76.0 | 74.8 | 73.7 | 72.1 |
| Hydrogen content (% mass) | 13.4 | 12.1 | 13 | 12.1 | 12.2 | 12.2 | 12.3 |
| Oxygen content (% mass) | 0 | 10.8 | 34.8 | 11.9 | 13.0 | 14.1 | 15.6 |
| Sulfur content (mg/kg) | 10 | 10 | 0 | - | - | - | - |
| Measurements | Measuring Range | Accuracy | Uncertainty (%) |
|---|---|---|---|
| Cylinder pressure | 0–25 MPa | ±10 kPa | ±0.5 |
| Exhaust gas temperature | 0–1000 °C | ±1 °C | ±0.25 |
| Brake power | - | ±0.03 kW | ±0.03 |
| Air flow mass | 0–33.3 kg/min | ±1% | ±0.5 |
| Engine speed | 1–2000 rpm | ±10 rpm | ±0.24 |
| Fuel flow measurement | 0.5–100 L/h | ±0.04 L/h | ±0.5 |
| CO emission | 0–16%vol | ±0.03% | ±0.32 |
| Soot emission | 0–9 FSN | ±0.1 FSN | ±2.8 |
| NOx emission | 0–5000 ppm | ±10 ppm | ±0.56 |
| BSFC | - | ±5 g/kW·h | ±1.5 |
| Crank angle encoder | 0–720 °CA | ±0.2 °CA | ±0.3 |
| −8 °CA | 0 °CA | 8 °CA | |
|---|---|---|---|
| D100 |  |  |  |
| B100 |  |  |  |
| BE5 |  |  |  |
| BE10 |  |  | 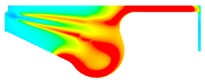 |
| BE15 |  |  |  |
| BE20 |  |  |  |
 | |||
| −8 °CA | 0 °CA | 8 °CA | |
|---|---|---|---|
| D100 |  |  | 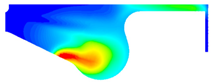 |
| B100 |  | 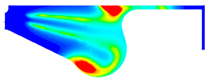 | 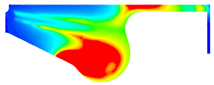 |
| BE5 |  | 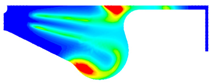 | 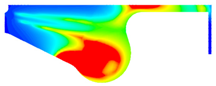 |
| BE10 |  | 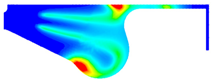 | 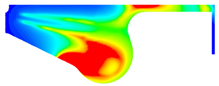 |
| BE15 |  |  |  |
| BE20 |  |  |  |
 | |||
Publisher’s Note: MDPI stays neutral with regard to jurisdictional claims in published maps and institutional affiliations. |
© 2022 by the authors. Licensee MDPI, Basel, Switzerland. This article is an open access article distributed under the terms and conditions of the Creative Commons Attribution (CC BY) license (https://creativecommons.org/licenses/by/4.0/).
Share and Cite
Zhong, Y.; Zhang, Y.; Mao, C.; Ukaew, A. Performance, Combustion, and Emission Comparisons of a High-Speed Diesel Engine Fueled with Biodiesel with Different Ethanol Addition Ratios Based on a Combined Kinetic Mechanism. Processes 2022, 10, 1689. https://doi.org/10.3390/pr10091689
Zhong Y, Zhang Y, Mao C, Ukaew A. Performance, Combustion, and Emission Comparisons of a High-Speed Diesel Engine Fueled with Biodiesel with Different Ethanol Addition Ratios Based on a Combined Kinetic Mechanism. Processes. 2022; 10(9):1689. https://doi.org/10.3390/pr10091689
Chicago/Turabian StyleZhong, Yunhao, Yanhui Zhang, Chengfang Mao, and Ananchai Ukaew. 2022. "Performance, Combustion, and Emission Comparisons of a High-Speed Diesel Engine Fueled with Biodiesel with Different Ethanol Addition Ratios Based on a Combined Kinetic Mechanism" Processes 10, no. 9: 1689. https://doi.org/10.3390/pr10091689
APA StyleZhong, Y., Zhang, Y., Mao, C., & Ukaew, A. (2022). Performance, Combustion, and Emission Comparisons of a High-Speed Diesel Engine Fueled with Biodiesel with Different Ethanol Addition Ratios Based on a Combined Kinetic Mechanism. Processes, 10(9), 1689. https://doi.org/10.3390/pr10091689