
Fault Diagnosis of Permanent Magnet Synchronous Motor of Coal Mine Belt Conveyor Based on Digital Twin and ISSA-RF


Abstract
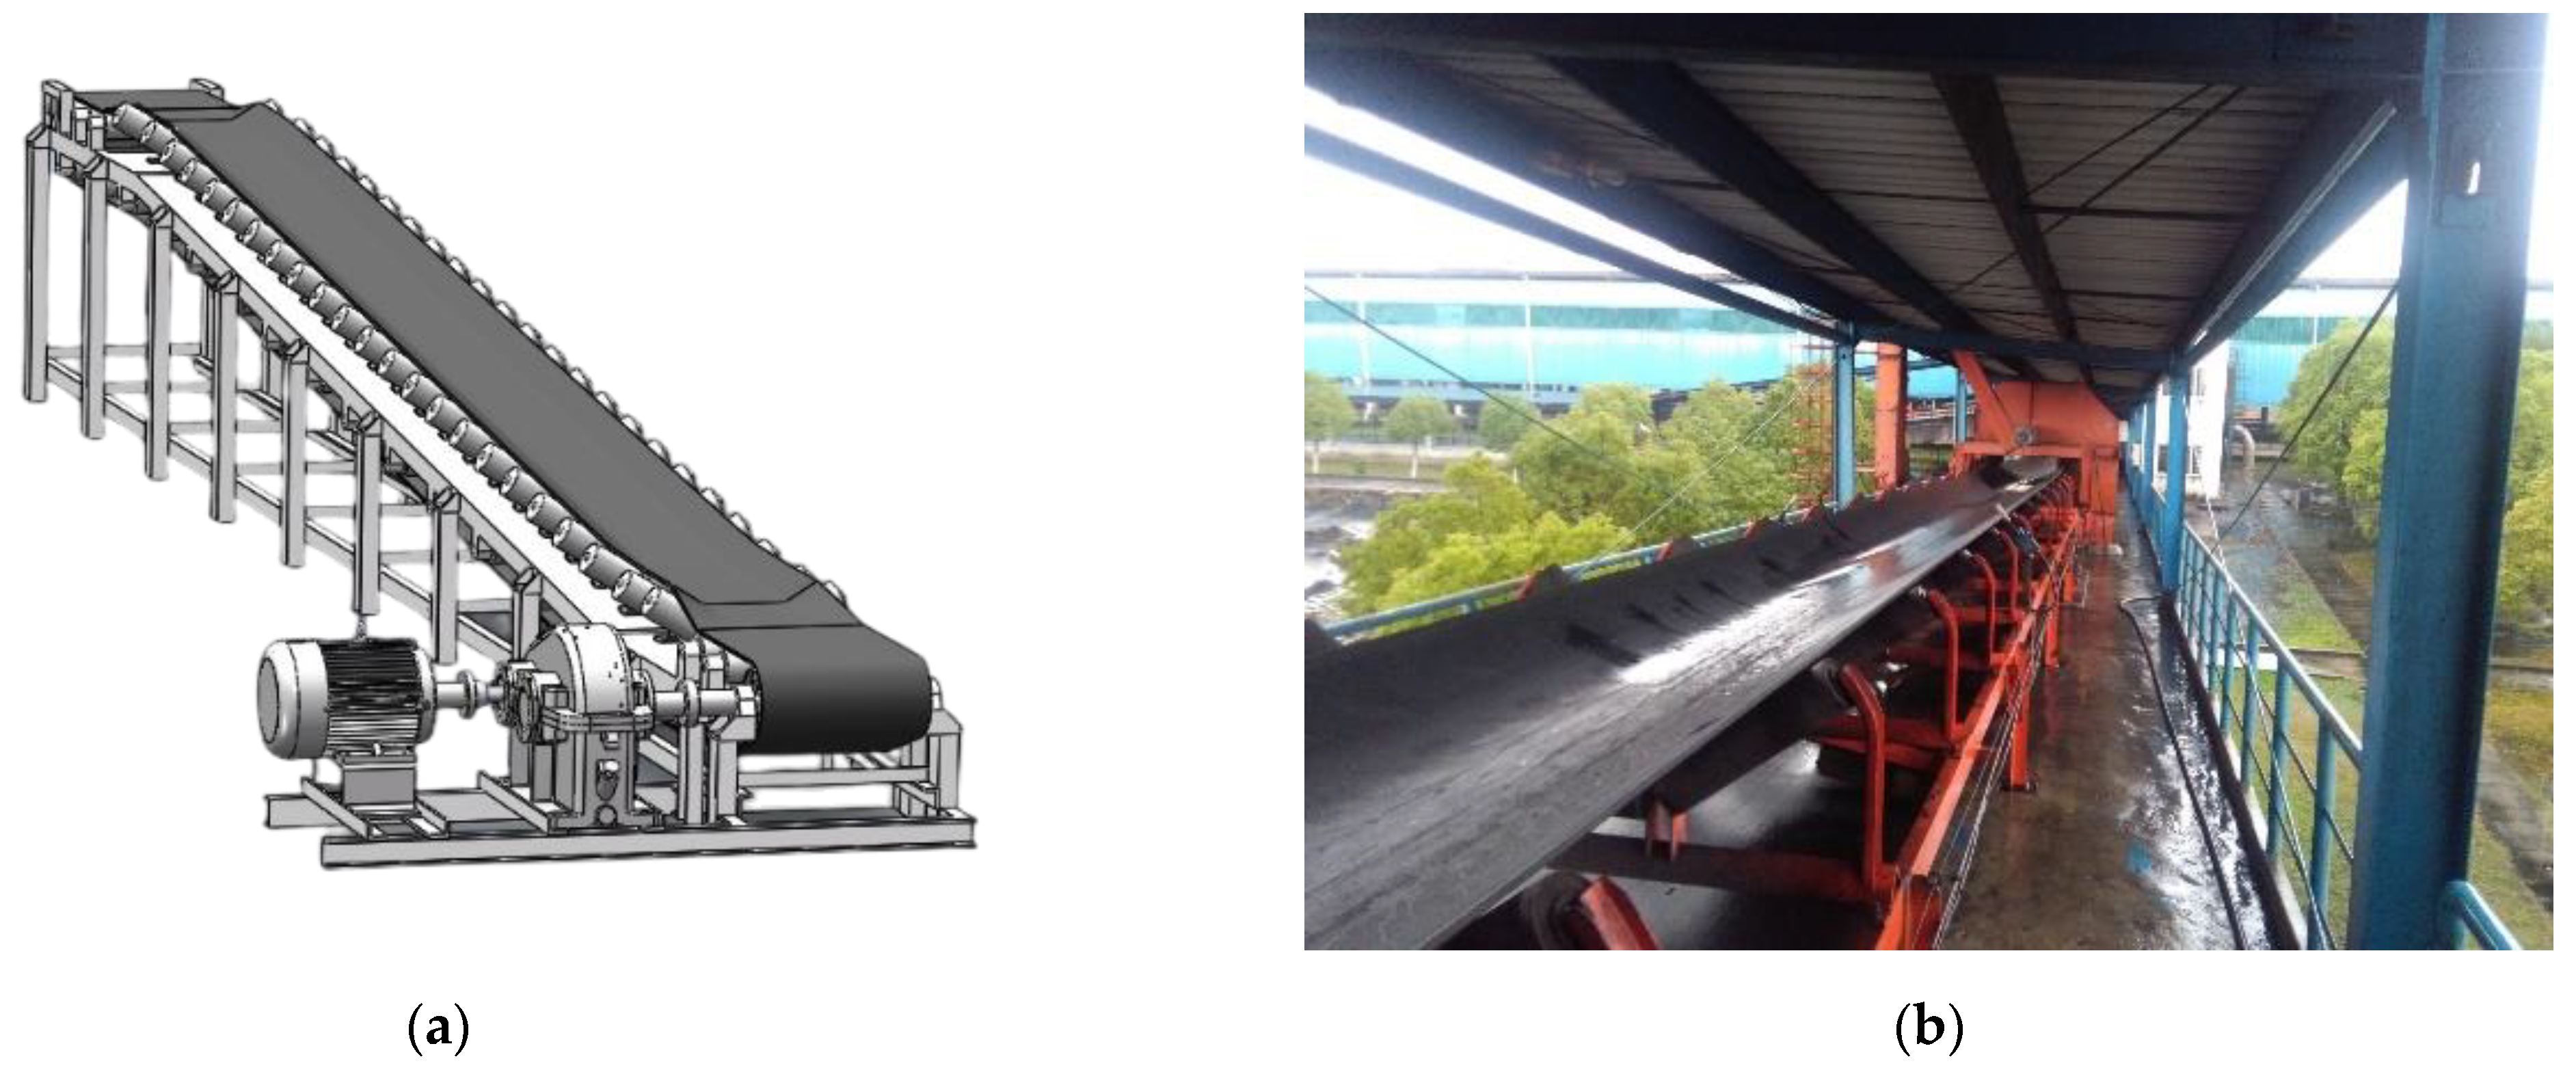
:1. Introduction
2. Digital Twin Model of PMSM
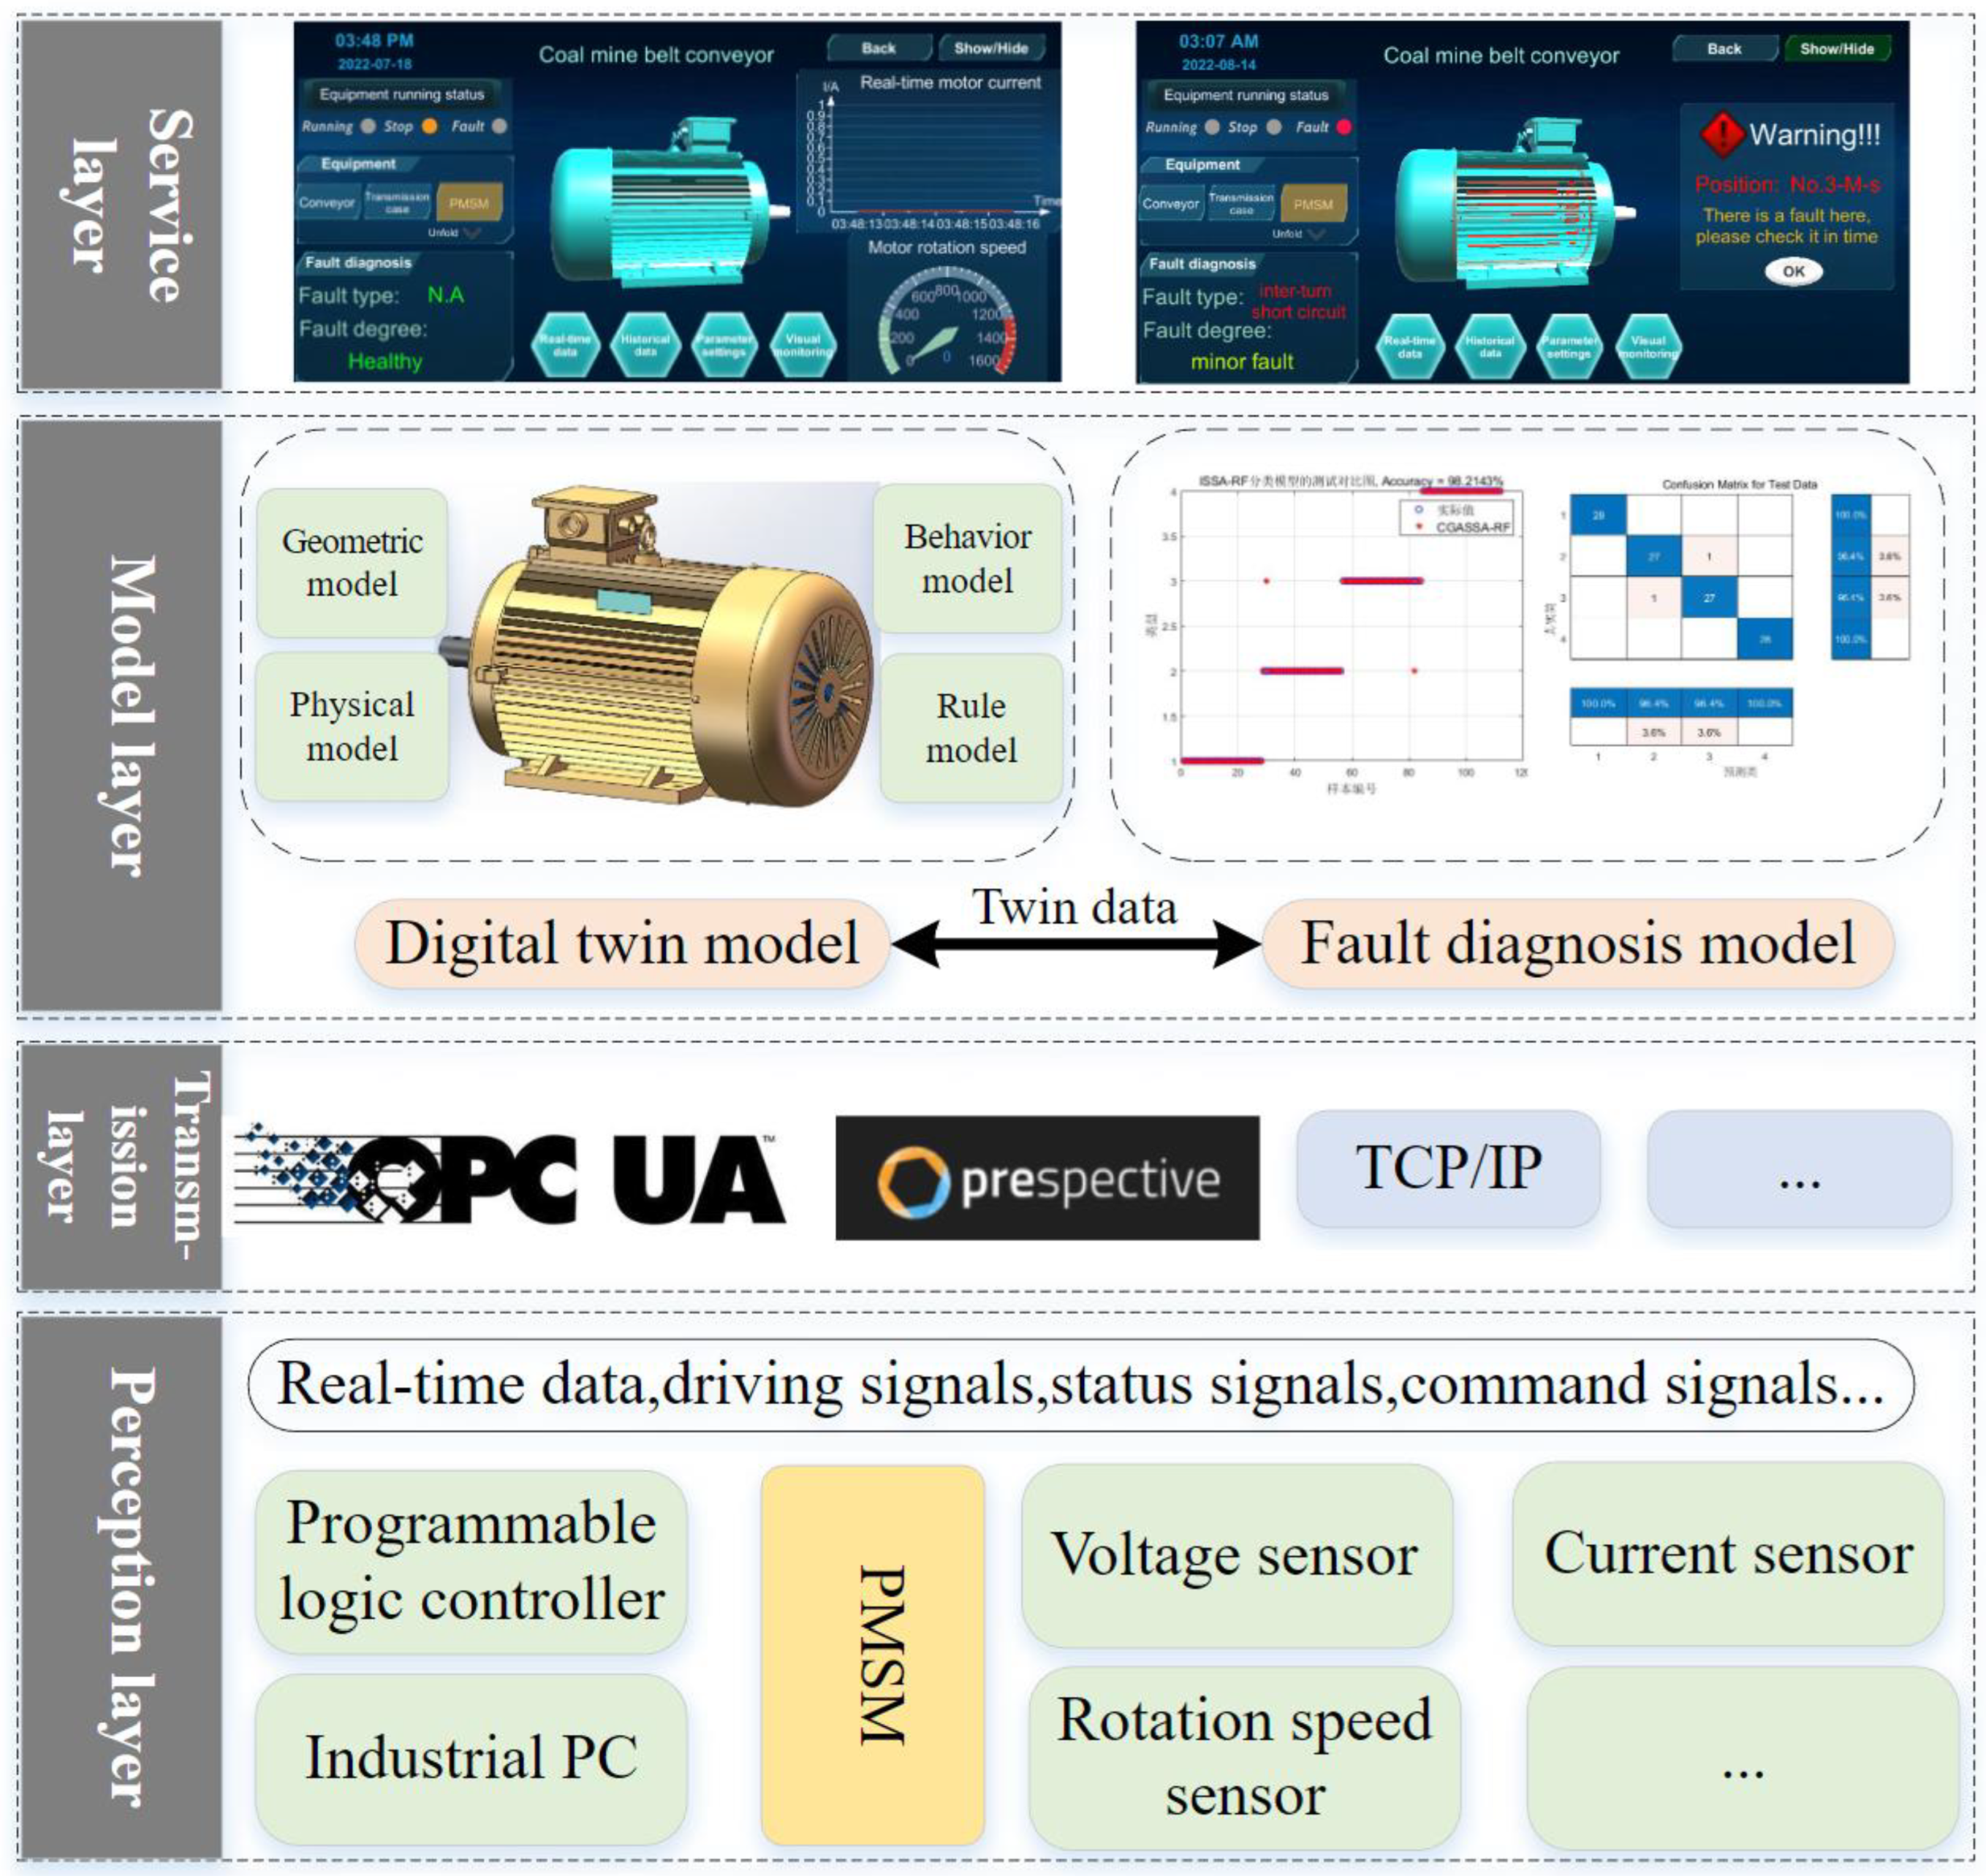
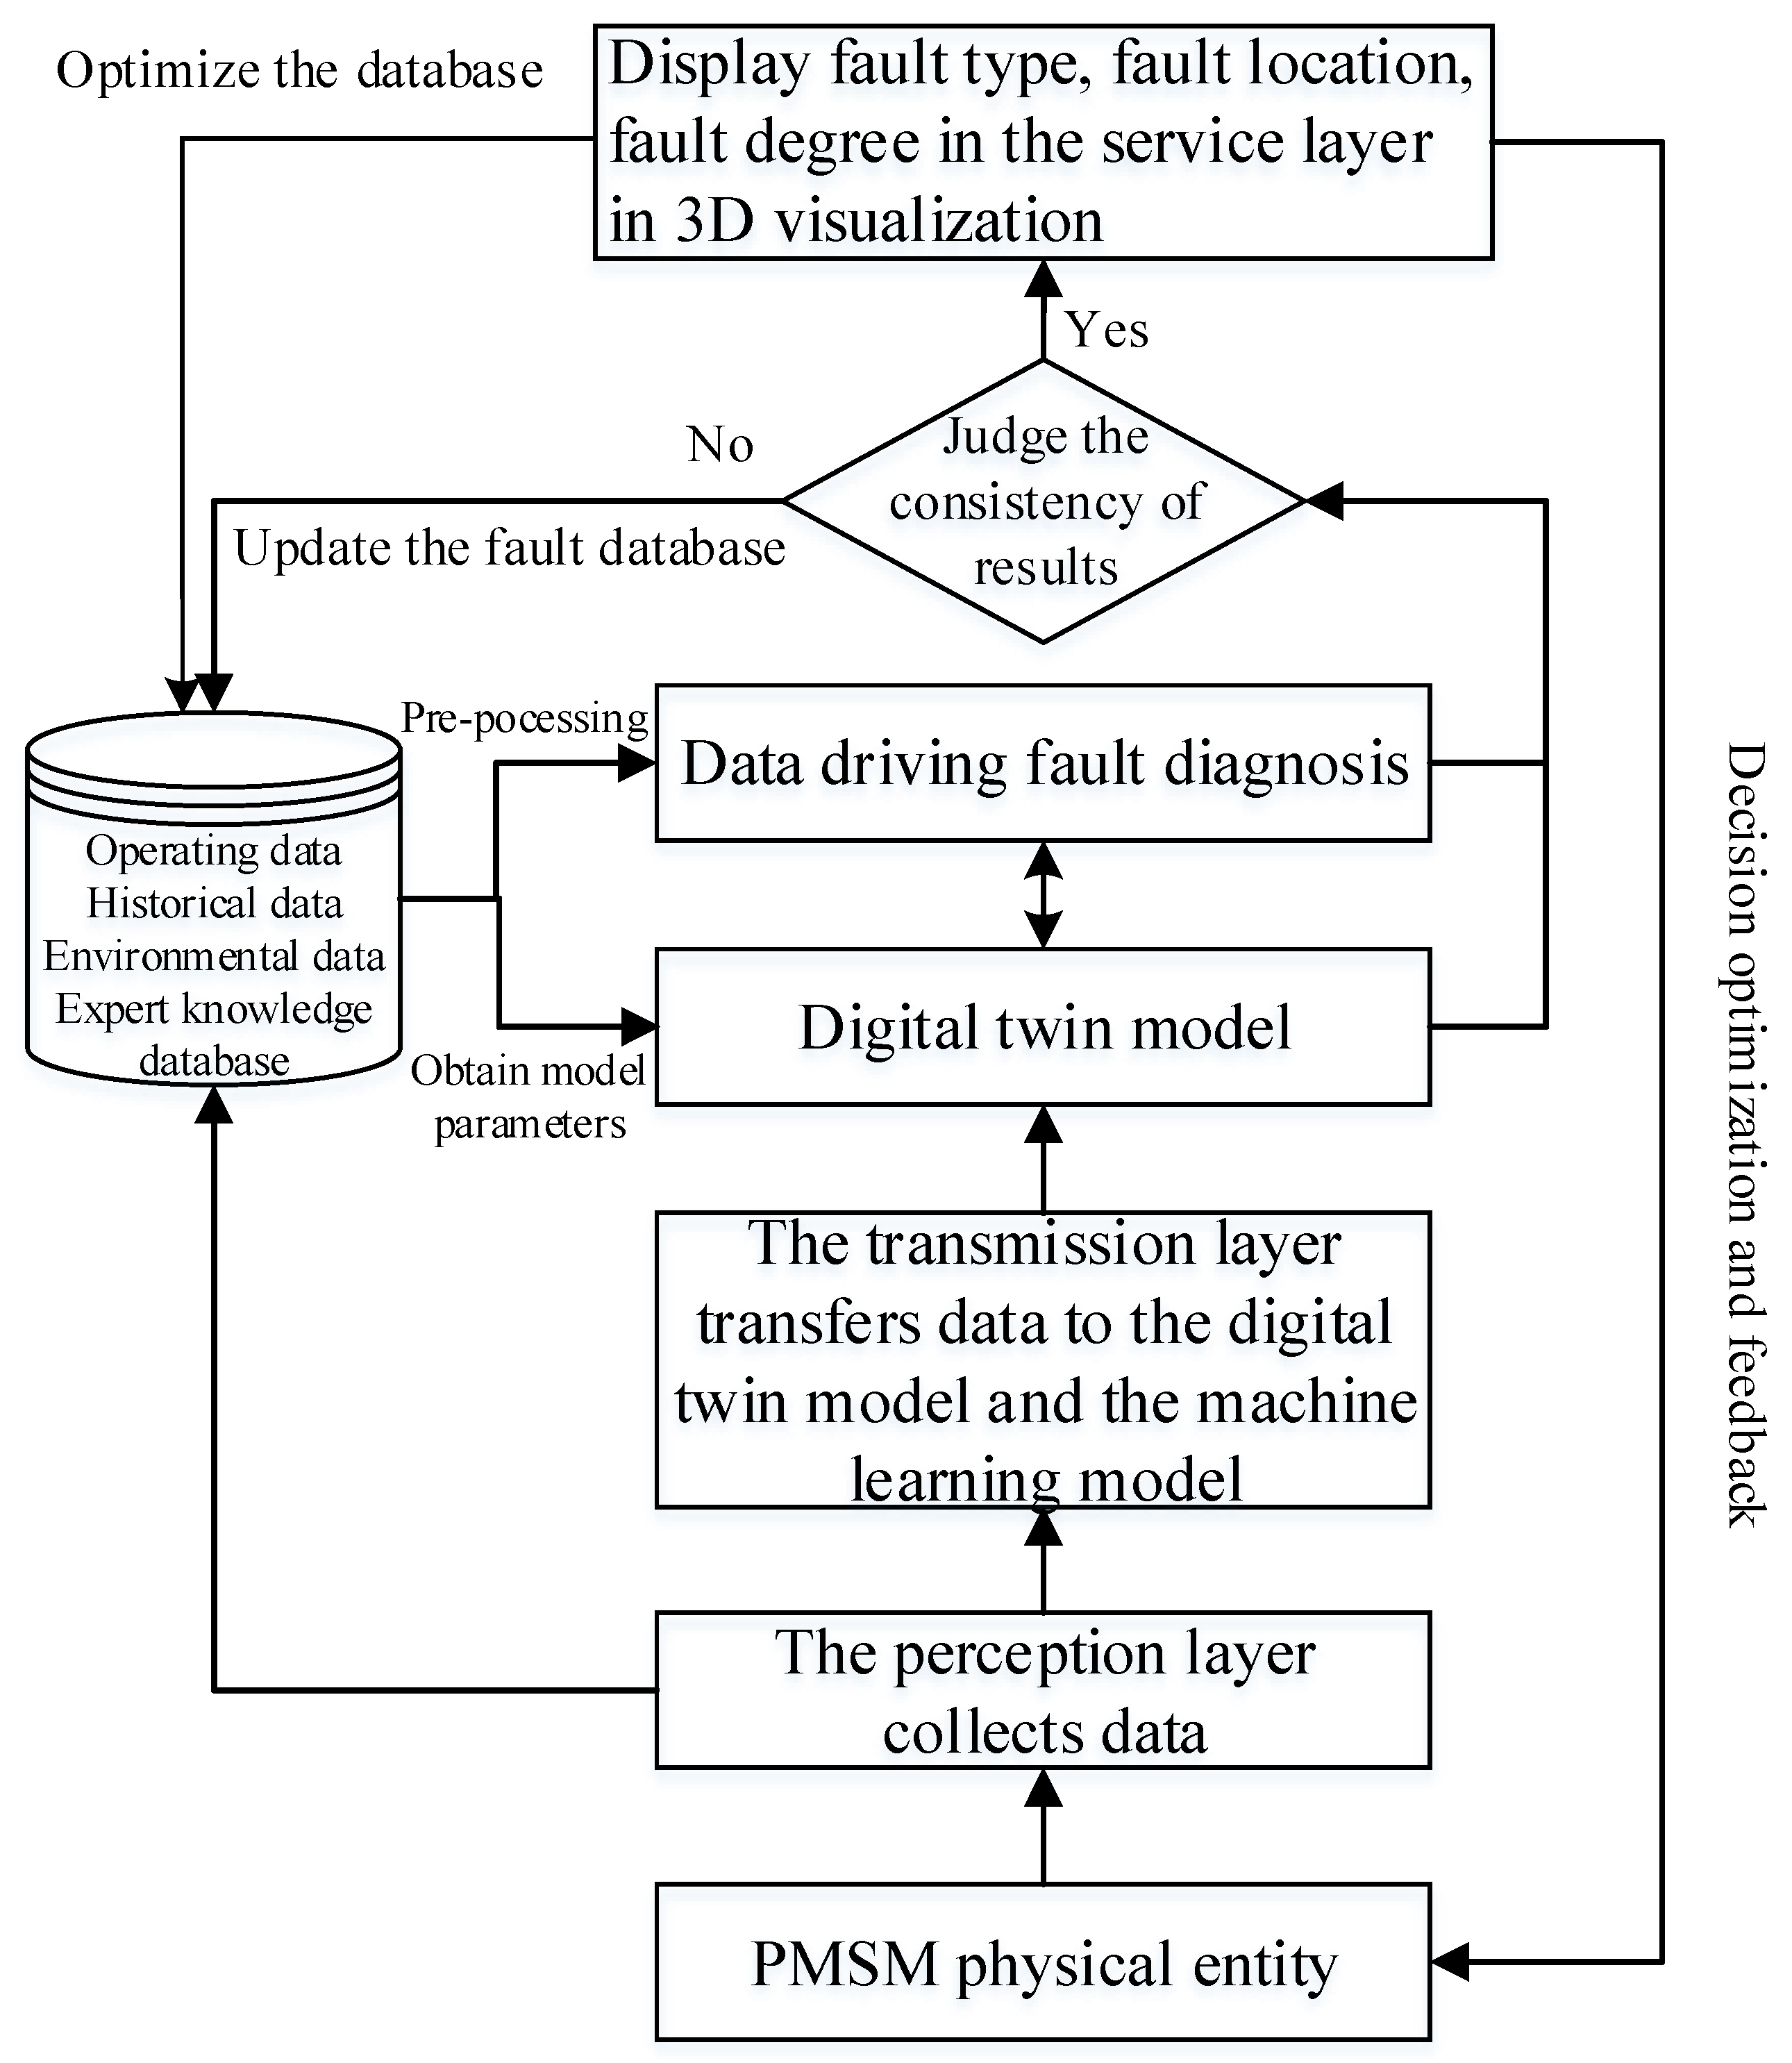
2.1. Digital Twin Fault Diagnosis Framework
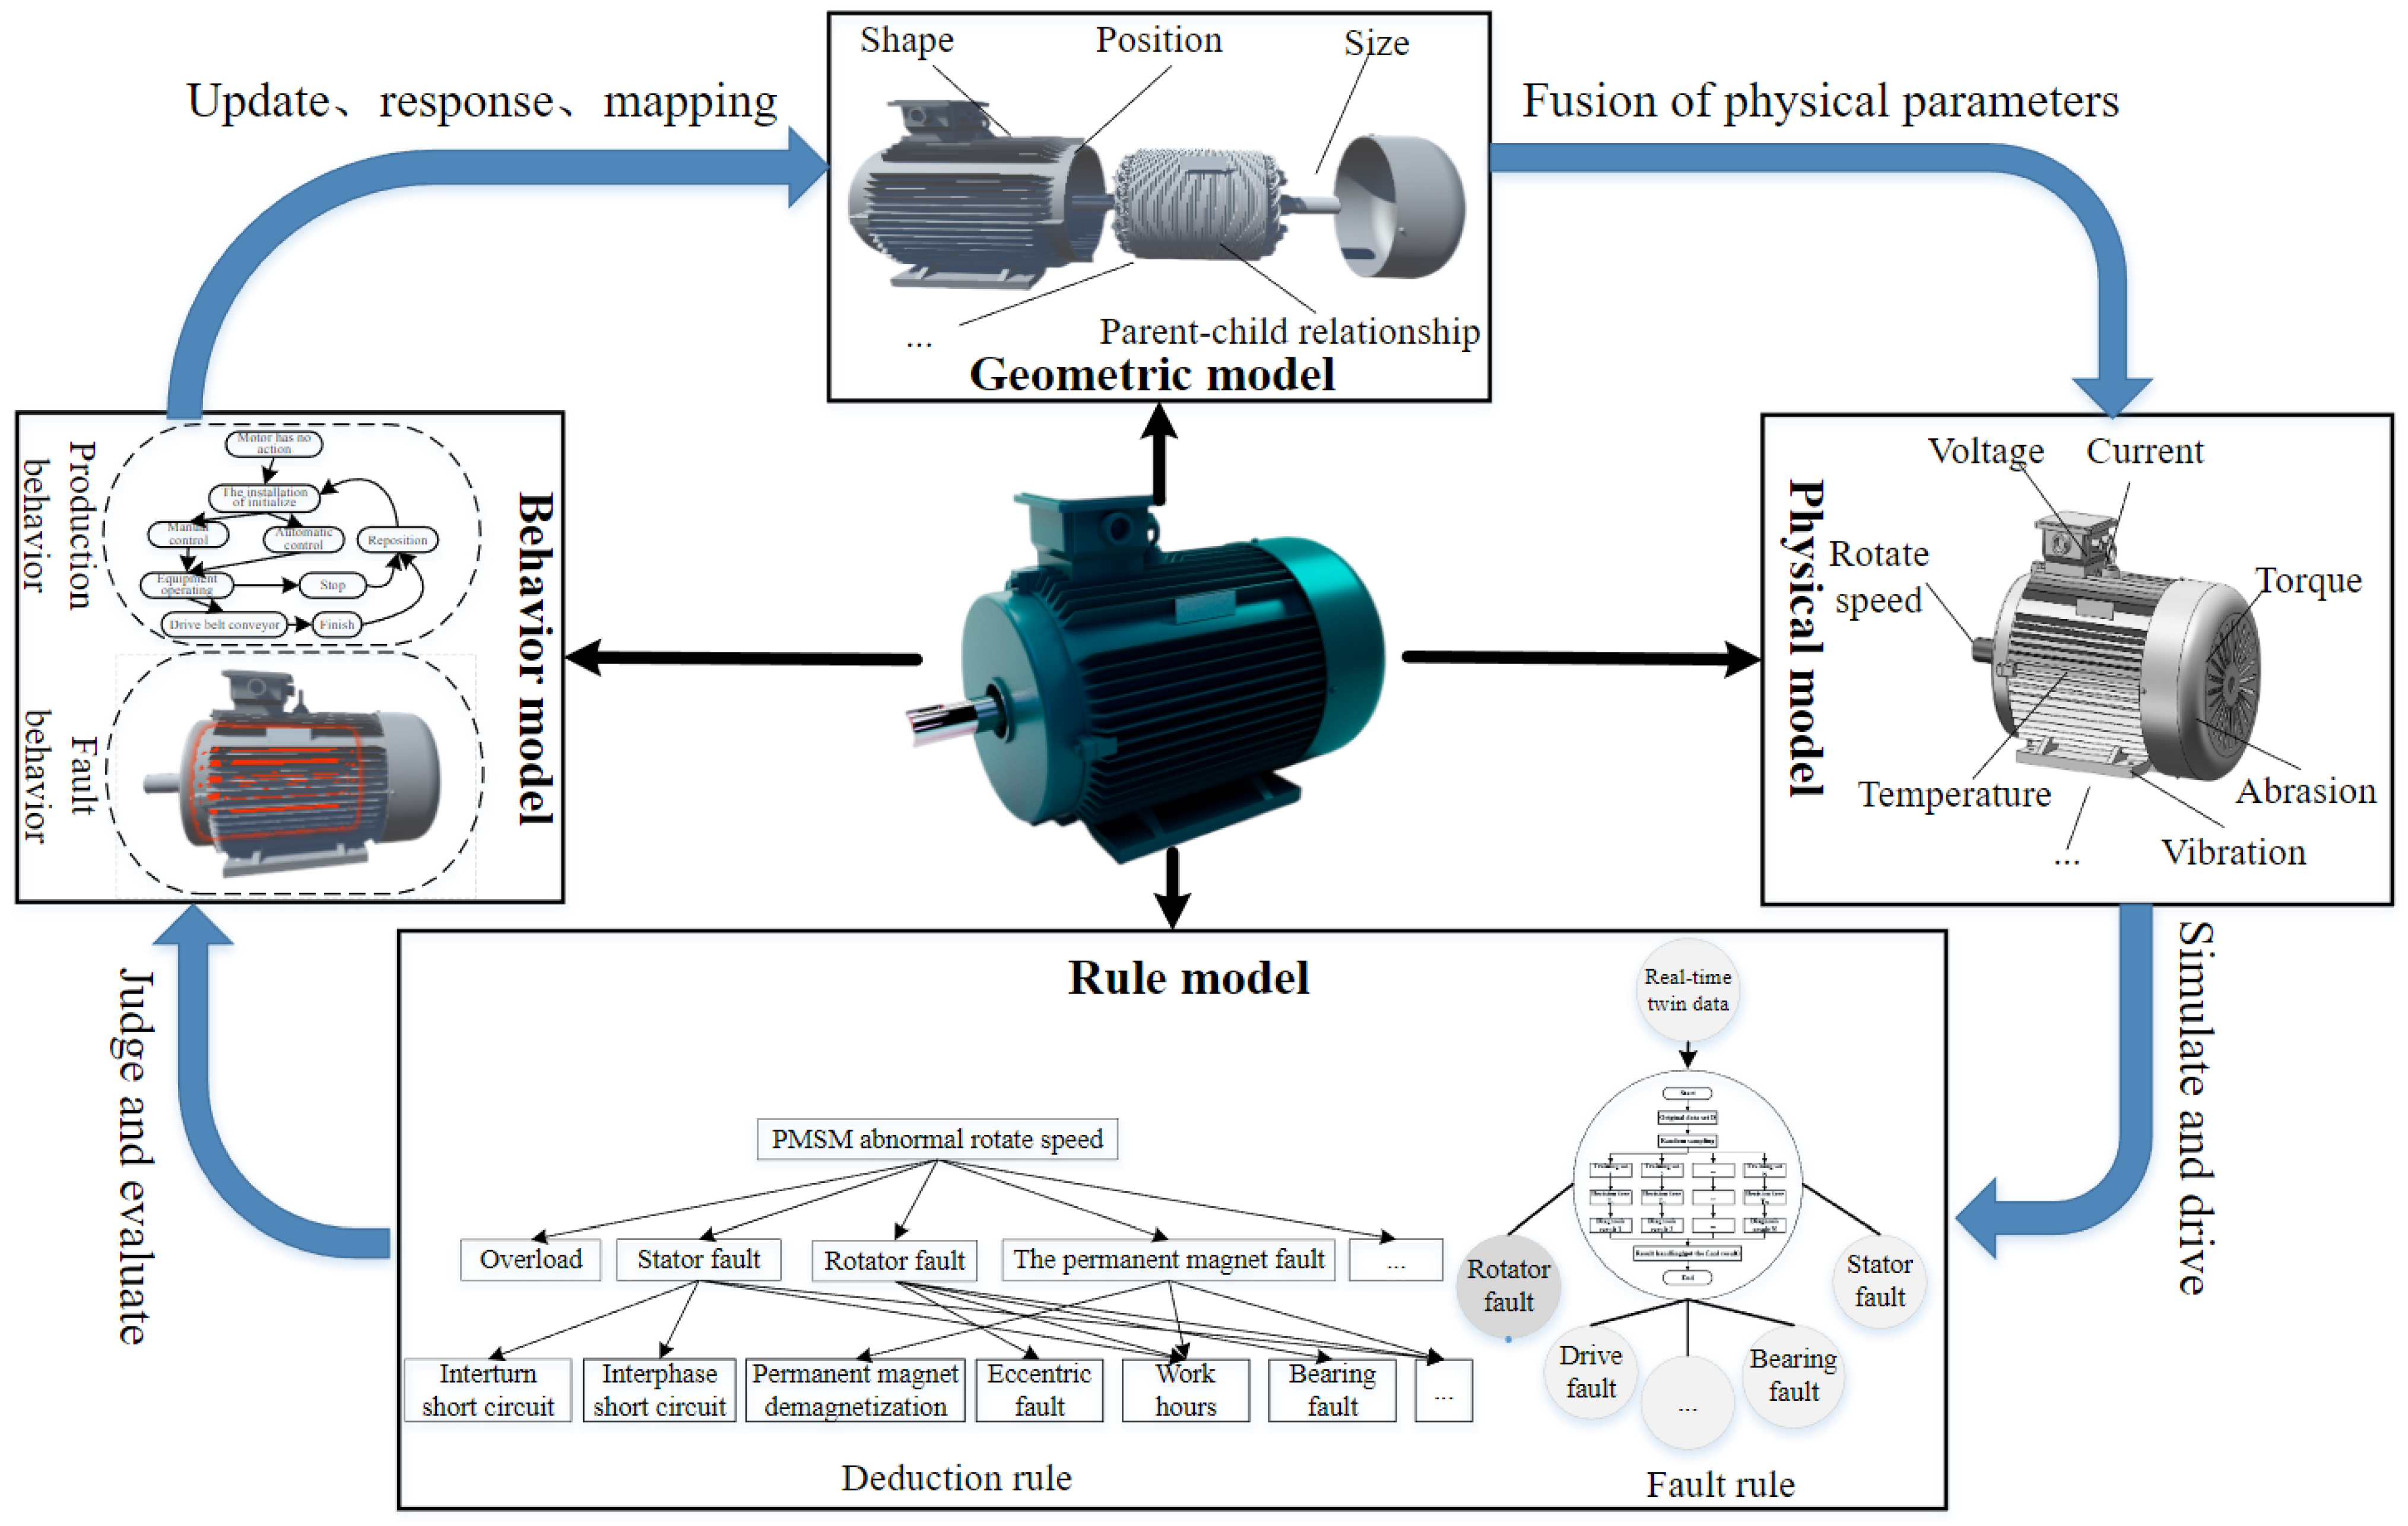
2.2. Construction of Twin Model of PMSM
2.2.1. Geometric Model
2.2.2. Physical Model
2.2.3. Rule Model
2.2.4. Behavior Model
2.3. PMSM Fault Diagnosis Based on the Fusion of Data Driving and Twin Model
2.4. Equivalent Model of PMSM Inter-Turn Short Circuit Fault
3. Fault Diagnosis Method Based on ISSA-RF Permanent Magnet Synchronous Motor
3.1. Random Forest Algorithm
- N (N < n) training subsets were randomly sampled from the original data set D by the bootstrap sampling method;
- m features were randomly selected from M features (m < M) to generate a decision tree model;
- The above steps were repeated to generate N decision trees to form a Random Forest classification model.
- The Random Forest classification model was used to classify and diagnose the test data set, and the result of each decision tree is calculated by means of ensemble voting to get the final diagnosis result. The final result is decided by majority vote:
3.2. Strategy to Improve the Sparrow Search Algorithm
3.2.1. Sparrow Search Algorithm
3.2.2. Strategy to Improve the SSA
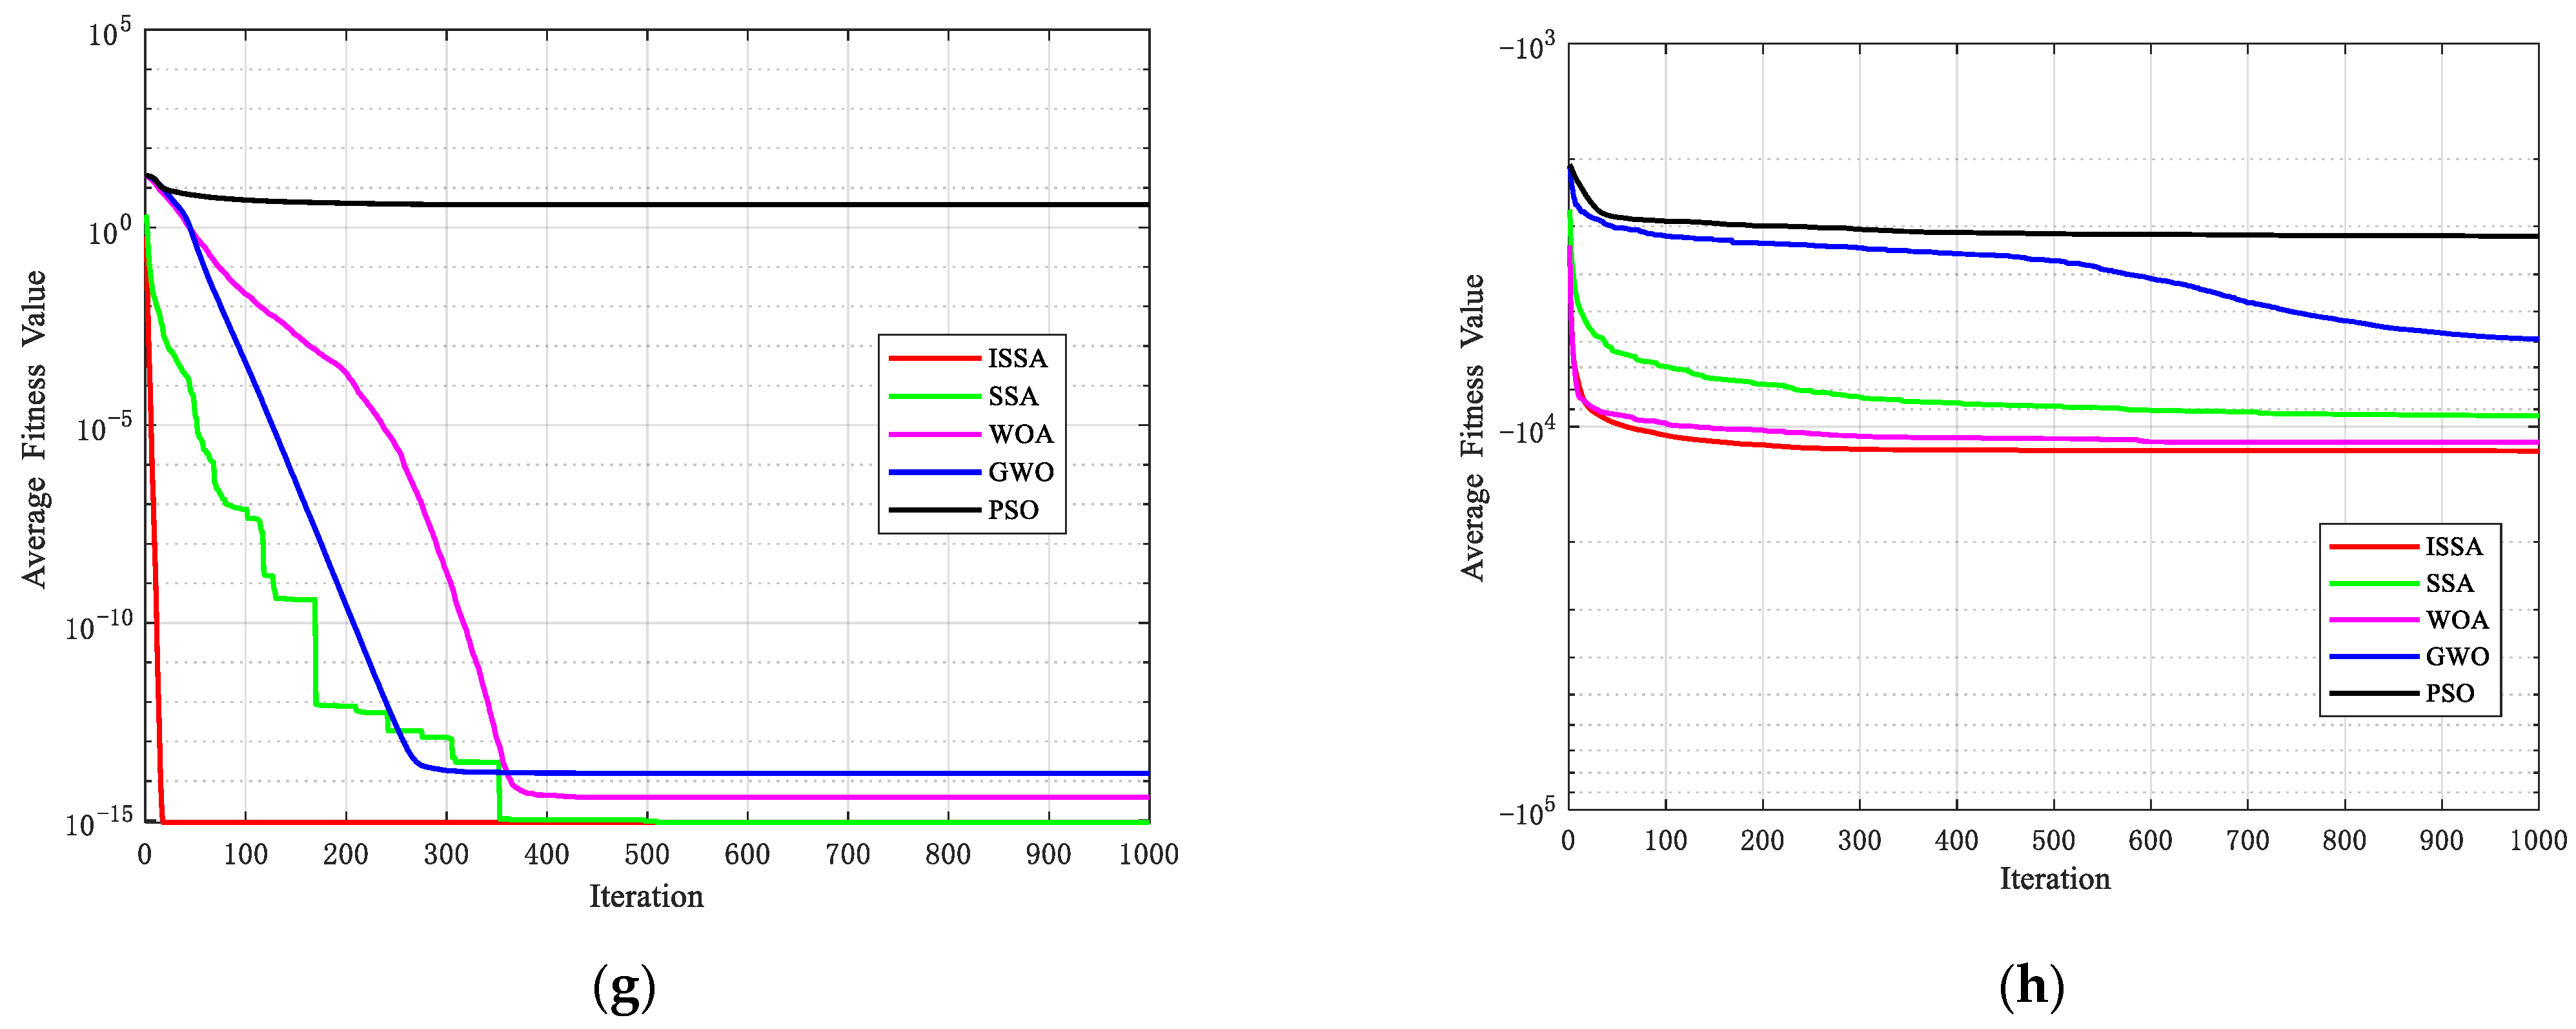
3.2.3. Improved Sparrow Search Algorithm Test
3.3. Fault Diagnosis Process of ISSA-RF
| Algorithm: ISSA-RF. |
| 1. Normalize data and divide training set (Ci-train, Yj-train) and test set (Ci-test, Yj-test) |
| 2. Input: set the initial algorithm parameters N: Population size |
| PD: Proportion of the discoverer SD: Proportion of the vigilante |
| Iter-max: Maximum iteration number |
| 3. Training period Step 1: introduce the Tent mapping initial sparrow population according to Formulae (9); Step 2: update locations according to Formulae (4)–(6) and get the optimal population X; Step 3: obtain the population pop1 according to the crossover and mutation in the genetic ideas; Step 4: obtain the population pop2 according to the T-distribution; Step 5: obtain the population pop3 according to the simulated annealing; Step 6: new X = [X pop1 pop2 pop3]; Step 7: calculate the fitness value of new population f1, then sort (f1); Step 8: select N sparrows with higher fitness values and update the global optimal individuals, and then carry out iteration; Step 9: check whether the stop conditions are met. If yes, exit and output the best parameters. Otherwise, perform Steps 1 to 8 again; Step 10: train the RF classifier as per the acquired optimal parameters mtry and ntree; Testing Period: Step 11: test data set Ci-test 4. Output: label of the test data set Yj-test |
4. Experiment and Discussion
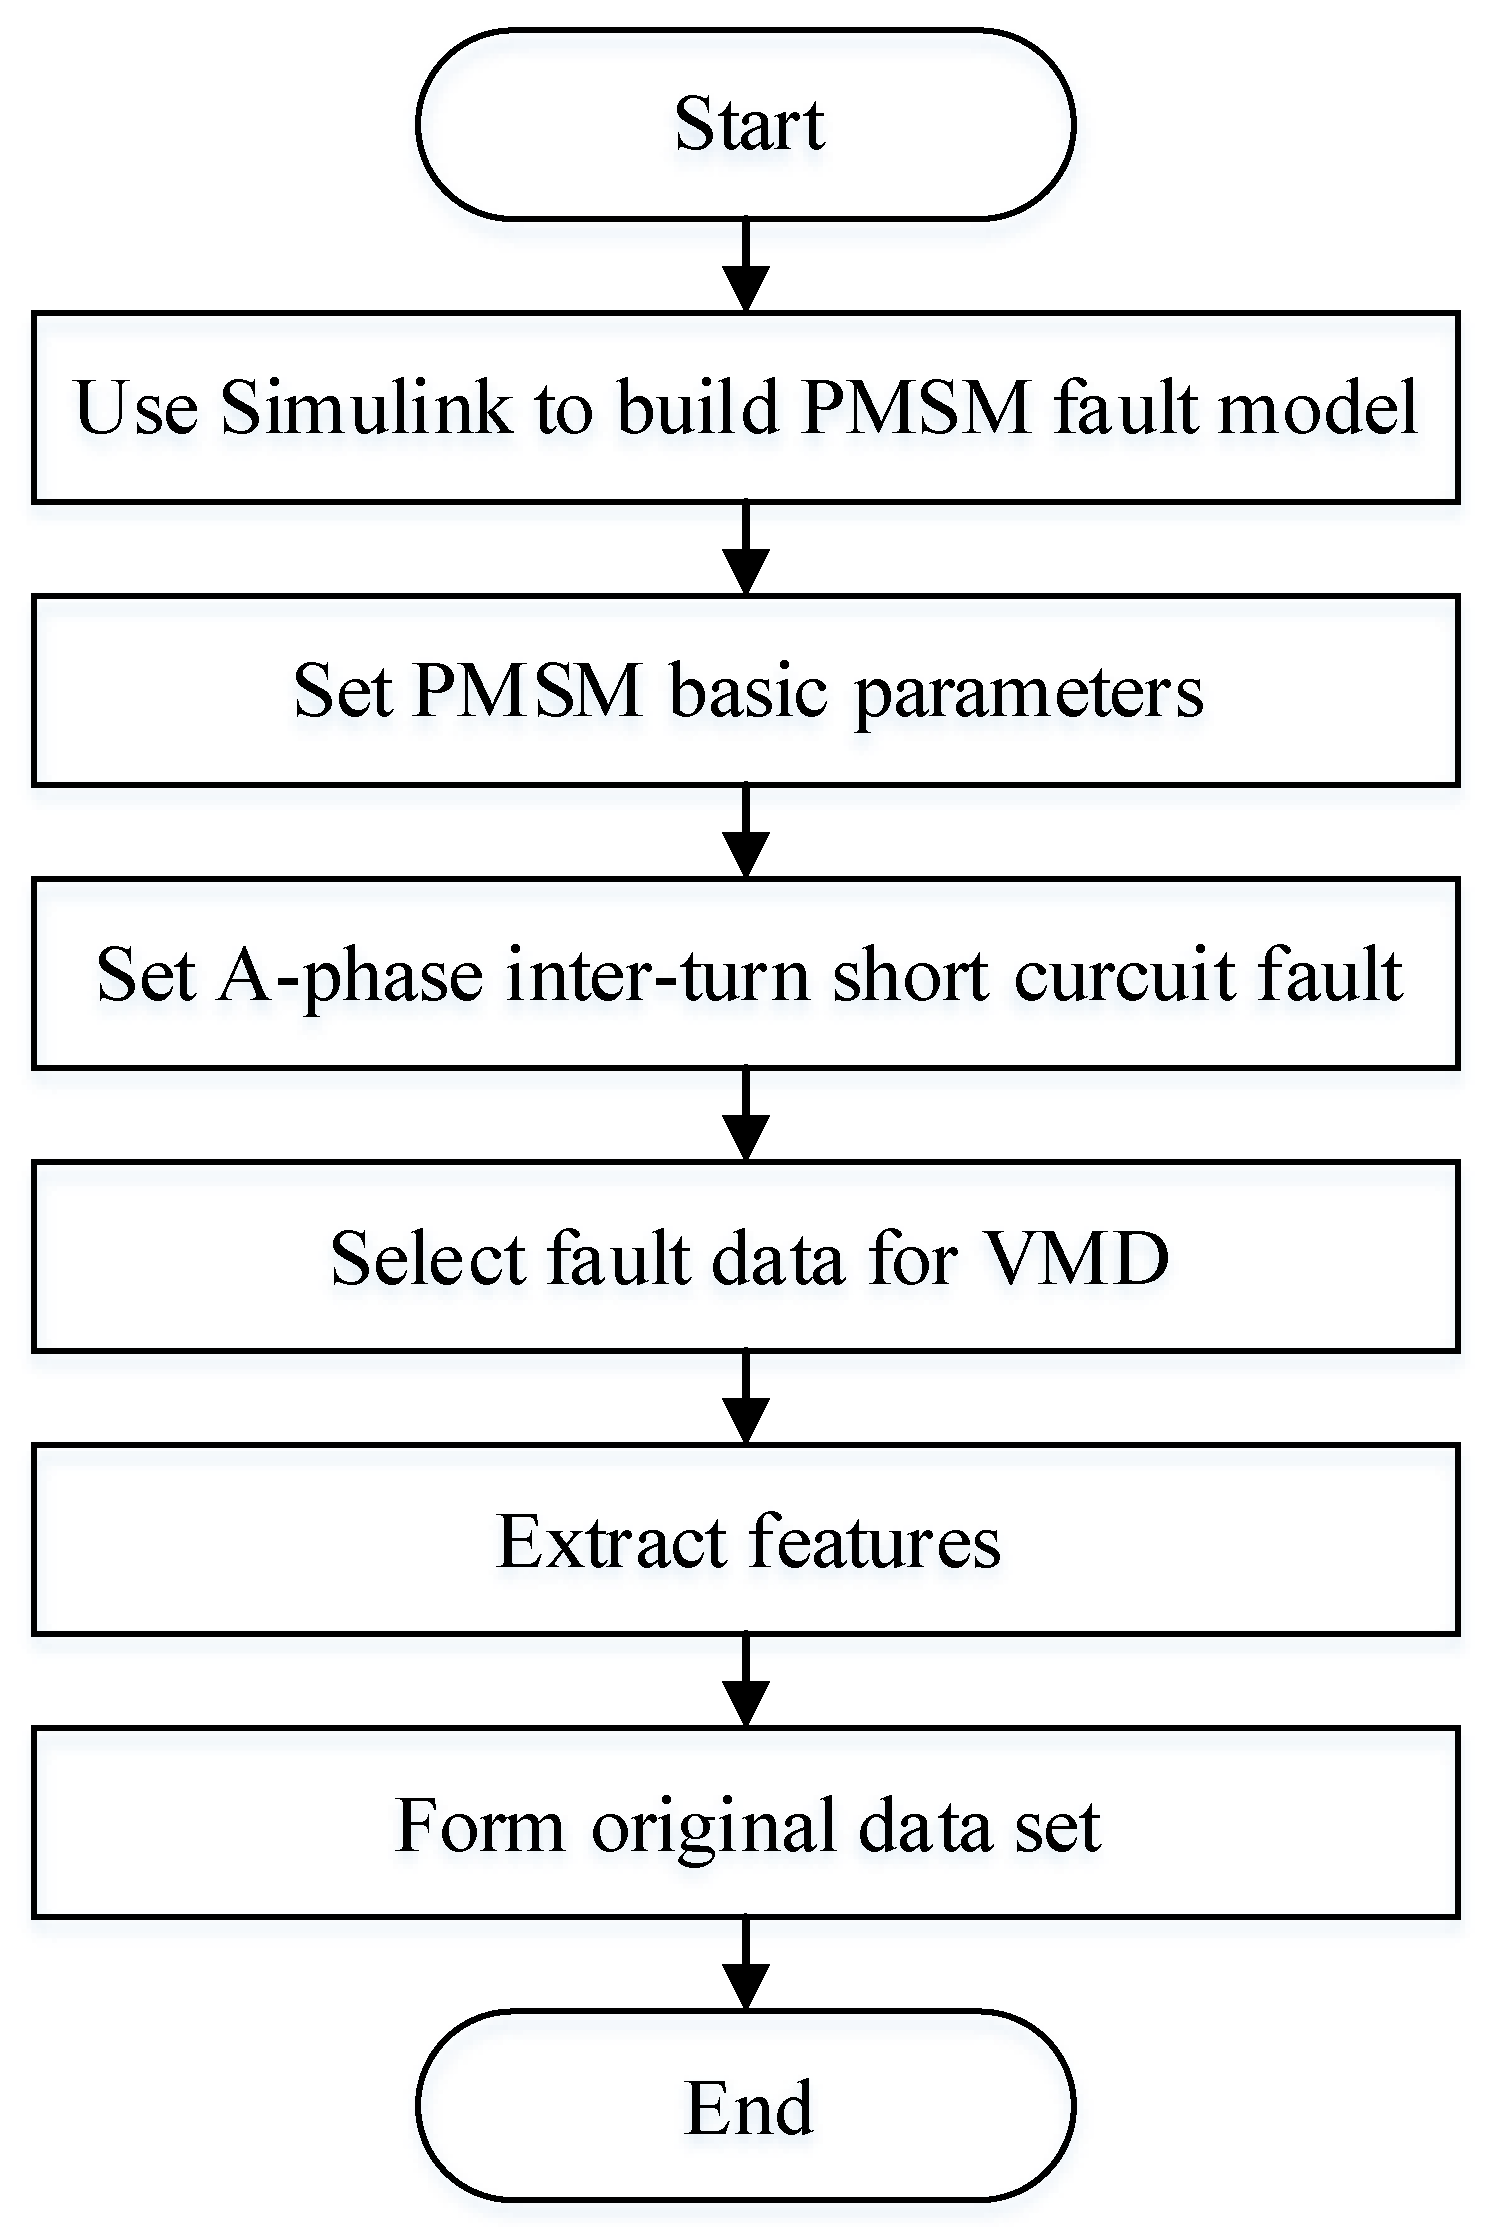
4.1. Simulation Experimental Data
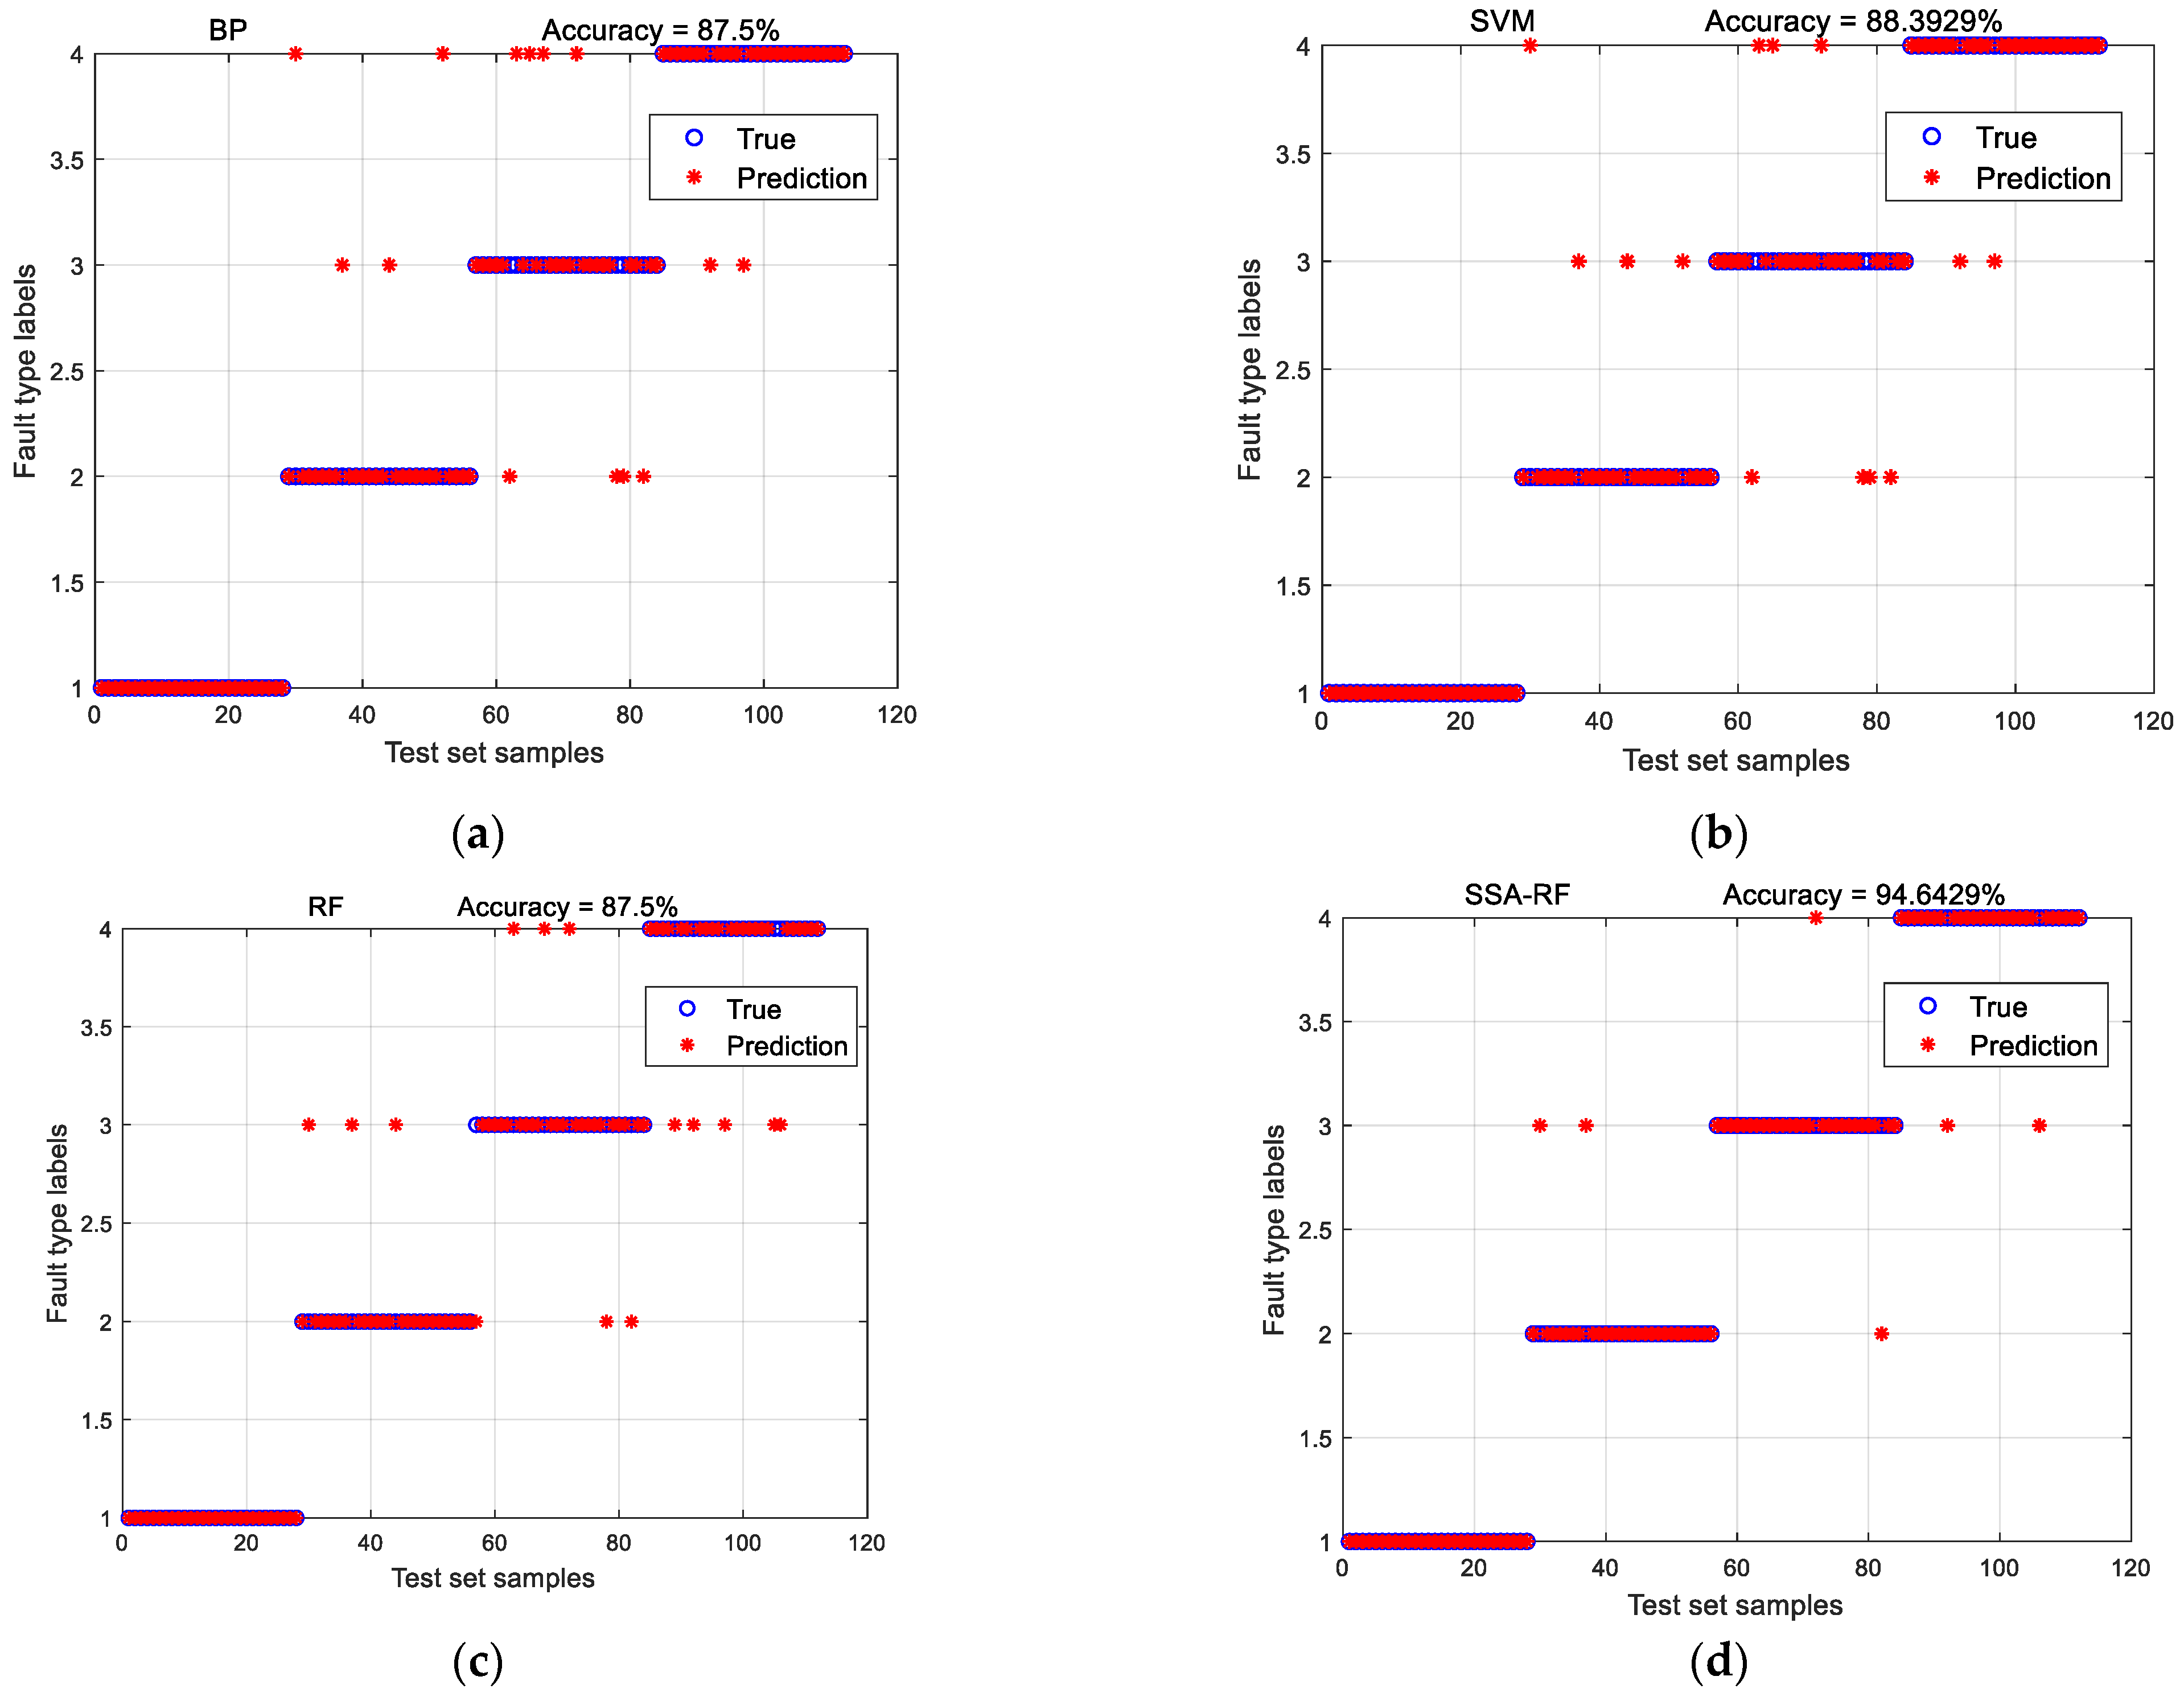
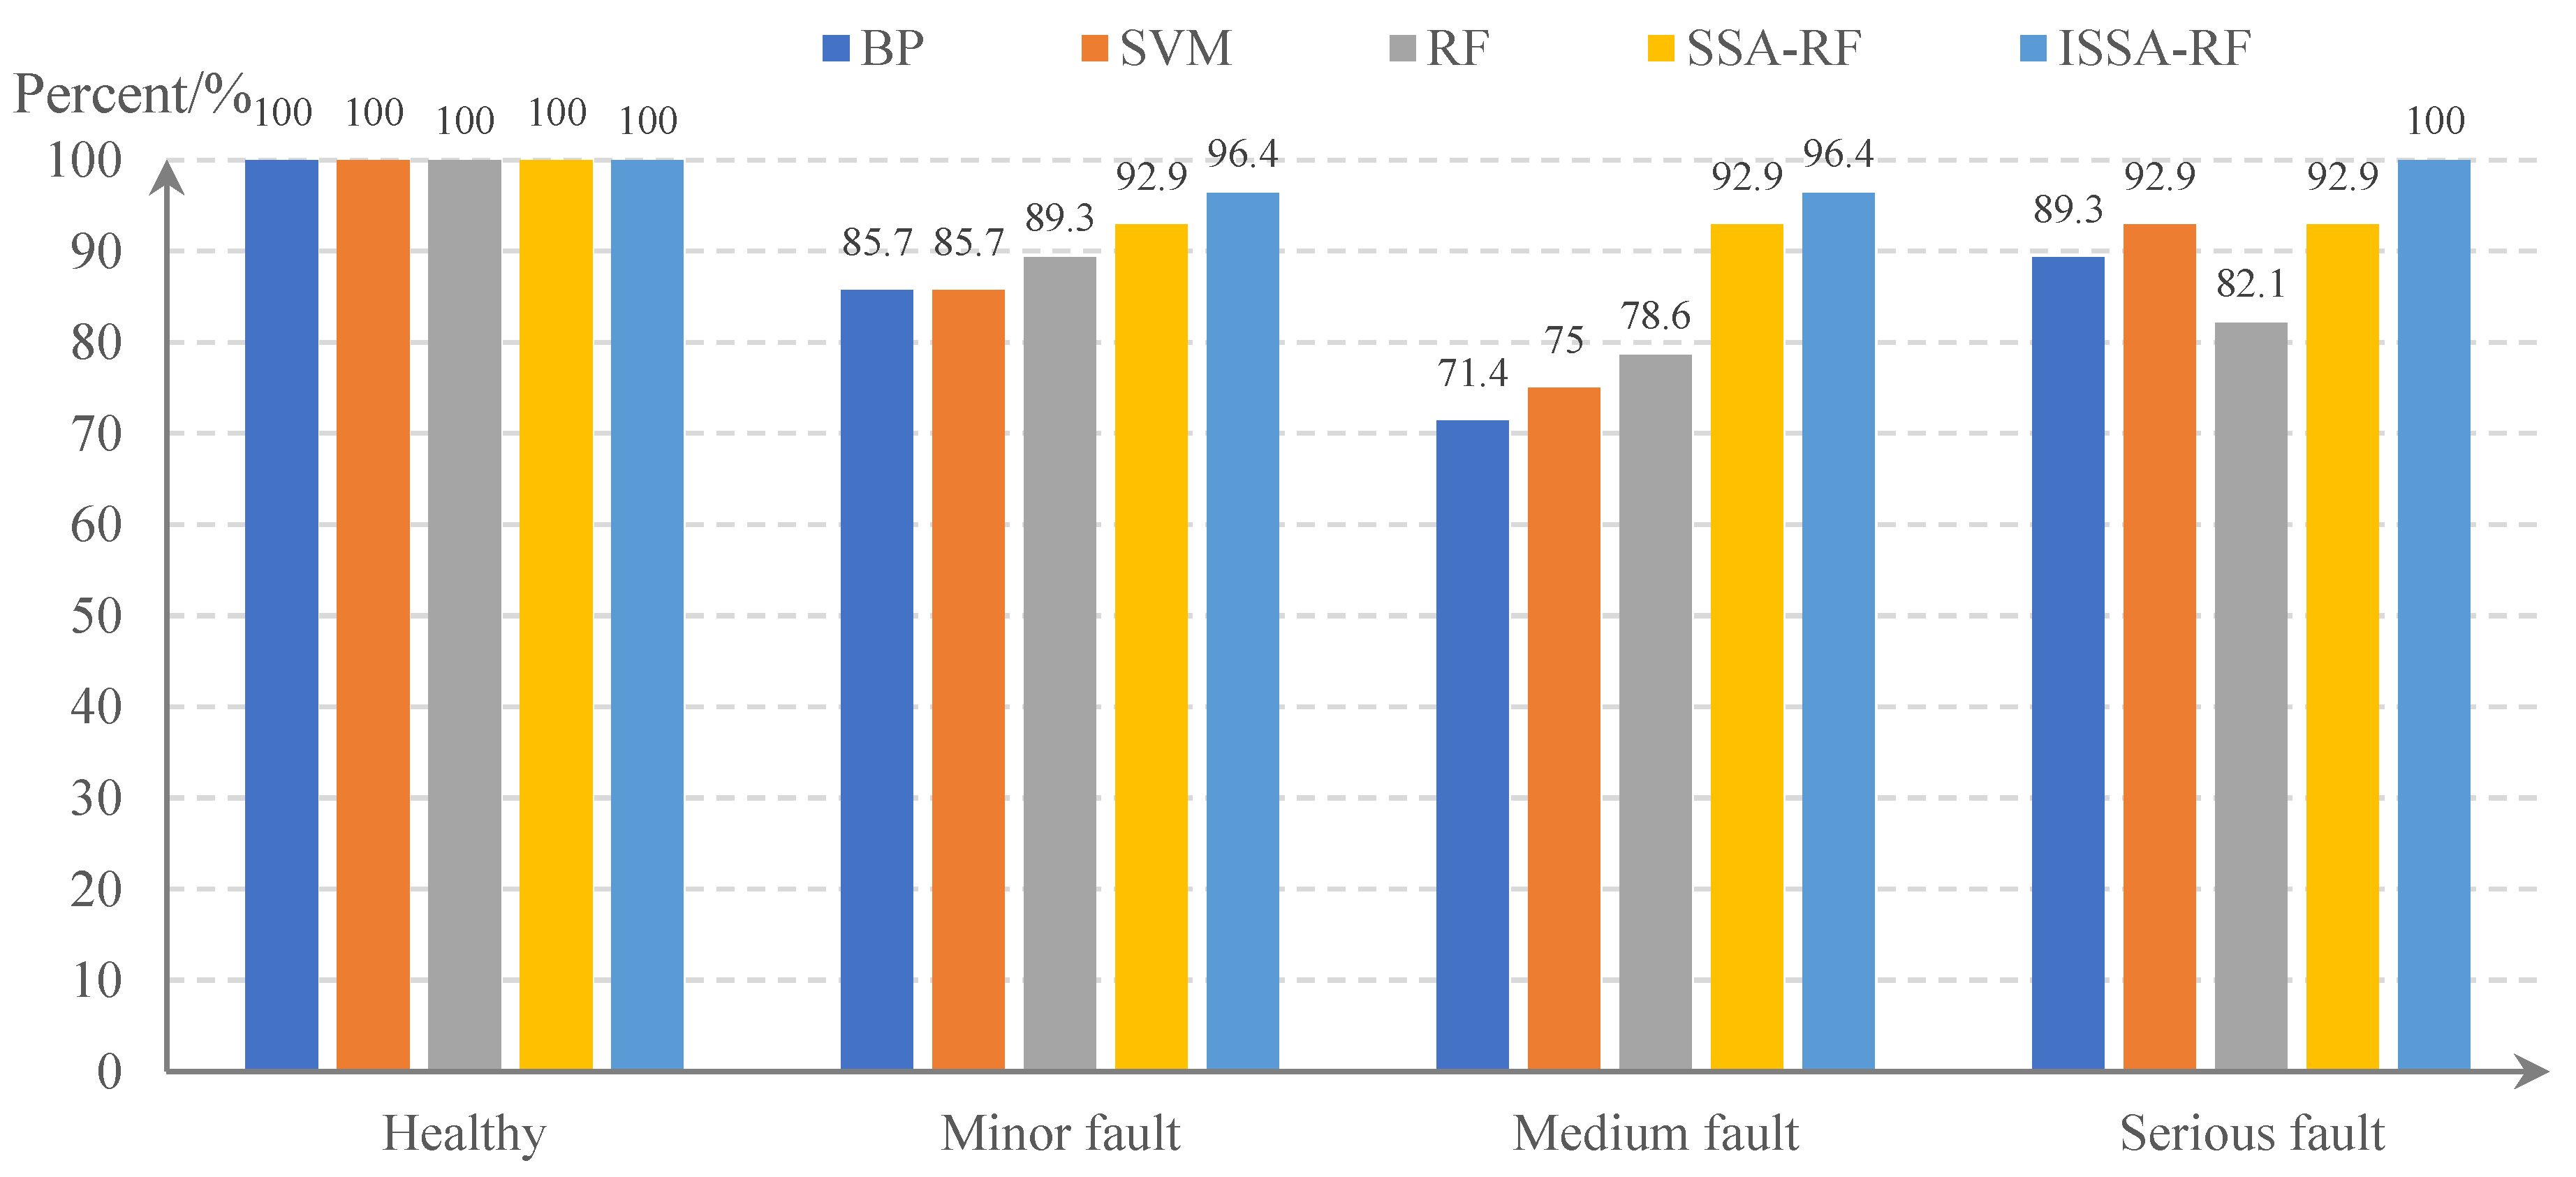
4.2. Results Validation
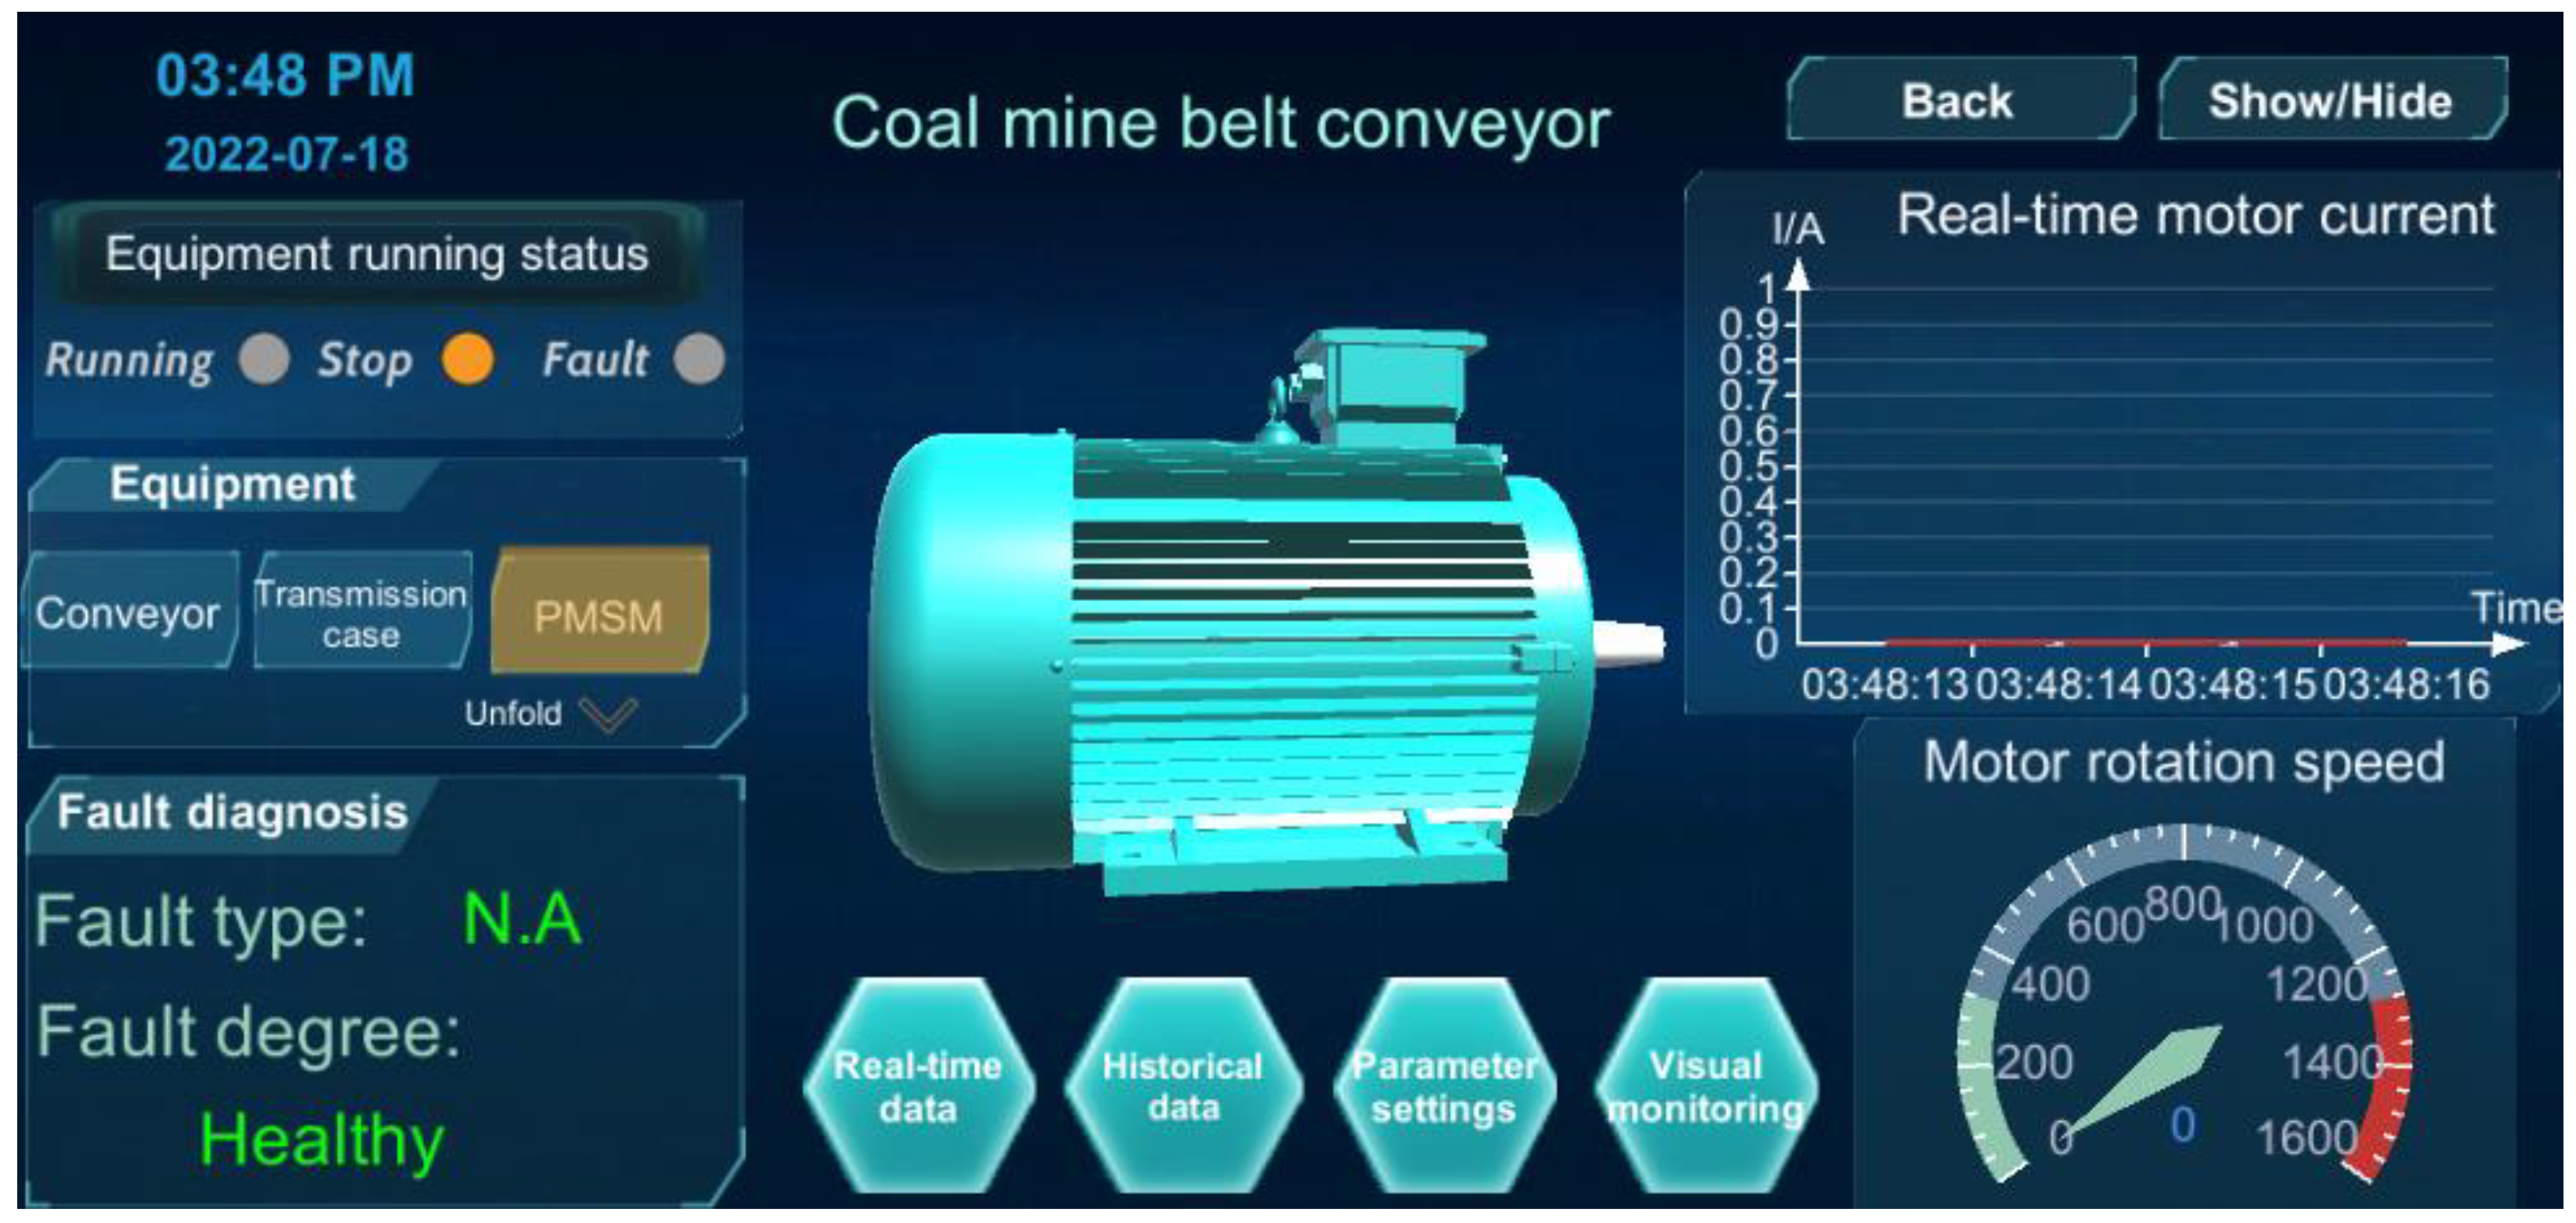
4.3. Digital Twin Visualization Interface
5. Conclusions
Author Contributions
Funding
Institutional Review Board Statement
Informed Consent Statement
Data Availability Statement
Acknowledgments
Conflicts of Interest
Abbreviations
| Abbreviations | English Full Name |
| PMSM | Permanent Magnet Synchronous Motor |
| SSA | Sparrow Search Algorithm |
| ISSA-RF | Improved Sparrow Search Algorithm Optimized Random Forest |
| RF | Random Forest |
| BP | Back Propagation |
| SVM | Support Vector Machine |
| AC | Alternating Current |
| VGG | Visual Geometry Group |
| EMD | Empirical Mode Decomposition |
| VMD | Variational Mode Decomposition |
| LSTM | Long Short-Term Memory |
| WOA | Whale Optimization Algorithm |
| GWO | Grey Wolf Optimization Algorithm |
| PSO | Particle Swarm Optimization |
| MQTT | Message Queuing Telemetry Transport |
| OPC | OLE for Process Control |
| OPC UA | OPC Unified Architecture |
| Bf | Fault Behavior |
| tf | Fault Type |
| df | Fault Degree |
| pf | Fault Position |
| mf | Fault Model |
| MTPMSM | Permanent Magnet Synchronous Motor Twin Model |
| Gm | Geometric Model |
| Pm | Physical Model |
| Rm | Rule Model, |
| Bm | Behavior Model |
References
- Hou, C.; Qiao, T.; Zhang, H.; Pang, Y.; Xiong, X. Multispectral visual detection method for conveyor belt longitudinal tear. Measurement 2019, 143, 246–257. [Google Scholar] [CrossRef]
- Feng, Y.; Zhang, M.; Li, G.; Meng, G. Dynamic characteristic analysis and startup optimization design of an intermediate drive belt conveyor with non-uniform load. Sci. Prog. 2020, 103, 0036850419881089. [Google Scholar] [CrossRef] [PubMed] [Green Version]
- Rodriguez, J.; Pontt, J.; Becker, N.; Weinstein, A. Regenerative drives in the megawatt range for high performance downhill belt conveyors. IEEE Trans. Ind. Appl. 2002, 38, 203–210. [Google Scholar] [CrossRef]
- Song, Y.; Zhang, Z.; Yu, S.; Zhang, F.; Zhang, Y. Analysis and reduction of cogging torque in direct-drive external-rotor permanent magnet synchronous motor for belt conveyor application. IET Electr. Power Appl. 2021, 15, 668–680. [Google Scholar] [CrossRef]
- TOrlowska-Kowalska Wolkiewicz, M.; Pietrzak, P.; Skowron, M.; Ewert, P.; Tarchala, G.; Krzysztofiak, M.; TKowalski, C. Fault Diagnosis and Fault-Tolerant Control of PMSM Drives–State of the Art and Future Challenges. IEEE Access 2022, 10, 59979–60024. [Google Scholar] [CrossRef]
- Yang, C.; Bu, L.; Chen, B. Energy modeling and online parameter identification for permanent magnet synchronous motor driven belt conveyors. Measurement 2021, 178, 109342. [Google Scholar] [CrossRef]
- Li, S.; Zhou, X. Sensorless Energy Conservation Control for Permanent Magnet Synchronous Motors Based on a Novel Hybrid Observer Applied in Coal Conveyer Systems. Energies 2018, 11, 2554. [Google Scholar] [CrossRef] [Green Version]
- Lu, E.; Li, W.; Yang, X.; Xu, S. Composite Sliding Mode Control of a Permanent Magnet Direct-Driven System for a Mining Scraper Conveyor. IEEE Access 2017, 5, 22399–22408. [Google Scholar] [CrossRef]
- MA, S.H. Study on the application of permanent magnet synchronous motors in underground belt conveyors. IOP Conf. Ser. Mater. Sci. Eng. 2017, 283, 012006. [Google Scholar] [CrossRef] [Green Version]
- Feng, G.H.; Yu, J.Y.; Zhang, B.Y.; Wang, B.; Sun, H. Study on belt conveyor direct driven by external-rotor PMSM. Adv. Mater. Res. 2013, 619, 14–17. [Google Scholar] [CrossRef]
- Leboeuf, N.; Boileau, T.; Nahid-Mobarakeh, B.; Clerc, G.; Meibody-Tabar, F. Real-Time Detection of Interturn Faults in PM Drives Using Back-EMF Estimation and Residual Analysis. IEEE Trans. Ind. Appl. 2011, 47, 2402–2412. [Google Scholar] [CrossRef]
- Faiz, J.; Nejadi-Koti, H.; Exiri, A.H. Inductance-based inter-turn fault detection in permanent magnet synchronous machine using magnetic equivalent circuit model. Electr. Power Compon. Syst. 2017, 45, 1016–1030. [Google Scholar] [CrossRef]
- Aubert, B.; Régnier, J.; Caux, S.; Alejo, D. Kalman-Filter-Based Indicator for Online Interturn Short Circuits Detection in Permanent-Magnet Synchronous Generators. IEEE Trans. Ind. Electron. 2015, 62, 1921–1930. [Google Scholar] [CrossRef]
- Jokic, S.; Cincar, N.; Novakovic, B. The analysis of vibration measurement and current signature in motor drive faults detection. In Proceedings of the 2018 17th International Symposium INFOTEH-JAHORINA (INFOTEH), East Sarajevo, Bosnia and Herzegovina, 21–23 March 2018; pp. 1–6. [Google Scholar] [CrossRef]
- Elbouchikhi, E.; Choqueuse, V.; Auger, F.; Benbouzid, M.E.H. Motor Current Signal Analysis Based on a Matched Subspace Detector. IEEE Trans. Instrum. Meas. 2017, 66, 3260–3270. [Google Scholar] [CrossRef] [Green Version]
- Heydarzadeh, M.; Zafarani, M.; Nourani, M.; Akin, B. A wavelet-based fault diagnosis approach for permanent magnet synchronous motors. IEEE Trans. Energy Convers. 2018, 34, 761–772. [Google Scholar] [CrossRef]
- Li, Y.; Wang, Y.; Zhang, Y.; Zhang, J. Diagnosis of Inter-turn Short Circuit of Permanent Magnet Synchronous Motor Based on Deep learning and Small Fault Samples. Neurocomputing 2021, 442, 348–358. [Google Scholar] [CrossRef]
- Wang, C.S.; Kao, I.H.; Perng, J.W. Fault diagnosis and fault frequency determination of permanent magnet synchronous motor based on deep learning. Sensors 2021, 21, 3608. [Google Scholar] [CrossRef]
- Haddad, R.Z.; Strangas, E.G. On the Accuracy of Fault Detection and Separation in Permanent Magnet Synchronous Machines Using MCSA/MVSA and LDA. IEEE Trans. Energy Convers. 2016, 31, 924–934. [Google Scholar] [CrossRef]
- Arellano-Padilla, J.; Sumner, M.; Gerada, C. Winding condition monitoring scheme for a permanent magnet machine using high-frequency injection. IET Electr. Power Appl. 2011, 5, 89–99. [Google Scholar] [CrossRef]
- Alameh, K.; Cité, N.; Hoblos, G.; Barakat, G. Feature extraction for vibration-based fault detection in Permanent Magnet Synchronous Motors. In Proceedings of the 2015 Third International Conference on Technological Advances in Electrical, Electronics and Computer Engineering (TAEECE), Beirut, Lebanon, 29 April –1 May 2015; pp. 163–168. [Google Scholar] [CrossRef]
- Alvarez-Gonzalez, F.; Griffo, A.; Wang, B. Permanent magnet synchronous machine stator windings fault detection by Hilbert–Huang transform. J. Eng. 2019, 2019, 3505–3509. [Google Scholar] [CrossRef]
- Ullah, Z.; Lodhi, B.A.; Hur, J. Detection and Identification of Demagnetization and Bearing Faults in PMSM Using Transfer Learning-Based VGG. Energies 2020, 13, 3834. [Google Scholar] [CrossRef]
- DOĞAN, Z.; SELÇUK, R. A Diagnosis of Stator Winding Fault Based on Empirical Mode Decomposition in PMSMs. Balk. J. Electr. Comput. Eng. 2020, 8, 73–80. [Google Scholar]
- Zhang, K.; Kang, L.; Chen, X.; He, M.; Zhu, C.; Li, D. A Review of Intelligent Unmanned Mining Current Situation and Development Trend. Energies 2022, 15, 513. [Google Scholar] [CrossRef]
- Tao, F.; Zhang, M. Digital Twin Shop-Floor: A New Shop-Floor Paradigm Towards Smart Manufacturing. IEEE Access 2017, 5, 20418–20427. [Google Scholar] [CrossRef]
- Qi, Q.; Tao, F. Digital Twin and Big Data Towards Smart Manufacturing and Industry 4.0: 360 Degree Comparison. IEEE Access 2018, 6, 3585–3593. [Google Scholar] [CrossRef]
- Qi, Q.; Tao, F.; Hu, T.; Anwer, N.; Liu, A.; Wei, Y.; Wang, L.; Nee, A.Y.C. Enabling technologies and tools for digital twin. J. Manuf. Syst. 2021, 58, 3–21. [Google Scholar] [CrossRef]
- Kazała, R.; Luściński, S.; Strączyński, P.; Taneva, A. An Enabling Open-Source Technology for Development and Prototyping of Production Systems by Applying Digital Twinning. Processes 2022, 10, 21. [Google Scholar] [CrossRef]
- Liu, S.; Bao, J.; Lu, Y.; Li, J.; Lu, S.; Sun, X. Digital twin modeling method based on biomimicry for machining aerospace compo-nents. J. Manuf. Syst. 2021, 58, 180–195. [Google Scholar] [CrossRef]
- Wang, K.; Hu, Q.; Liu, J. Digital Twin-Driven Approach for Process Management and Traceability towards Ship Industry. Processes 2022, 10, 1083. [Google Scholar] [CrossRef]
- Lu, Y.; Liu, C.; Kevin, I.; Wang, K.; Huang, H.; Xu, X. Digital Twin-driven smart manufacturing: Connotation, reference model, appli-cations and research issues. Robot. Comput. -Integr. Manuf. 2020, 61, 101837. [Google Scholar] [CrossRef]
- Nejad, R.M.; Rizi, P.N.; Zoei, M.S.; Aliakbari, K.; Ghasemi, H. Failure Analysis of a Working Roll Under the Influence of the Stress Field Due to Hot Rolling Process. J. Fail. Anal. Prev. 2021, 21, 870–879. [Google Scholar] [CrossRef]
- Aliakbari, K.; Nejad, R.M.; Mamaghani, T.A.; Pouryamout, P.; Asiabaraki, H.R. Failure analysis of ductile iron crankshaft in compact pickup truck diesel engine[C]//Structures. Elsevier 2022, 36, 482–492. [Google Scholar]
- Liu, X.; Jiang, D.; Tao, B.; Jiang, G.; Sun, Y.; Kong, J.; Tong, X.; Zhao, G.; Chen, B. Genetic Algorithm-Based Trajectory Optimization for Digital Twin Robots. Front. Bioeng. Biotechnol. 2022, 9, 793782. [Google Scholar] [CrossRef] [PubMed]
- Tao, F.; Zhang, M.; Liu, Y.; Nee, A.Y.C. Digital twin driven prognostics and health management for complex equipment. Cirp Ann. 2018, 67, 169–172. [Google Scholar] [CrossRef]
- Tao, F.; Qi, Q. New IT driven service-oriented smart manufacturing: Framework and characteristics. IEEE Trans Syst. Man. Cybern Syst. 2019, 49, 81–91. [Google Scholar] [CrossRef]
- Da Silva Mendonça, R.; de Oliveira Lins, S.; de Bessa, I.V.; de Carvalho Ayres, F.A.J.; de Medeiros, R.L.P.; de Lucena, V.F.J. Digital Twin Applications: A Survey of Recent Advances and Challenges. Processes 2022, 10, 744. [Google Scholar] [CrossRef]
- Yan, X.; Duan, G. The Real-Time Prediction of Product Quality Based on the Equipment Parameters in a Smart Factory. Processes 2022, 10, 967. [Google Scholar] [CrossRef]
- Wan, Z.; Dong, Y.; Yu, Z.; Lv, H.; Lv, Z. Semi-supervised support vector machine for digital twins based brain image fusion. Front. Neurosci. 2021, 15, 705323. [Google Scholar] [CrossRef]
- Maanani, Y.; Menacer, A. Modeling and Diagnosis of the Inter-Turn Short Circuit Fault for the Sensorless Input-Output Linearization Control of the PMSM. Period. Polytech. Electr. Eng. Comput. Sci. 2019, 63, 159–168. [Google Scholar] [CrossRef]
- Breiman, L. Random forests. Mach. Learn. 2001, 45, 5–32. [Google Scholar] [CrossRef] [Green Version]
- Guo, K.; Wan, X.; Liu, L.; Liu, L.; Gao, Z.; Yang, M. Fault diagnosis of intelligent production line based on digital twin and improved random forest. Appl. Sci. 2021, 11, 7733. [Google Scholar] [CrossRef]
- Xue, J.; Shen, B. A novel swarm intelligence optimization approach: Sparrow search algorithm. Syst. Sci. Control. Eng. 2020, 8, 22–34. [Google Scholar] [CrossRef]
- Jianhua, L.; Zhiheng, W. A hybrid sparrow search algorithm based on constructing similarity. IEEE Access 2021, 9, 117581–117595. [Google Scholar] [CrossRef]
- Ling, G.; Wang, Z.; Shi, Y.; Wang, J.; Lu, Y.; Li, L. Membrane Fouling Prediction Based on Tent-SSA-BP. Membranes 2022, 12, 691. [Google Scholar] [CrossRef] [PubMed]
- Chen, S.; Wang, S. An optimization method for an integrated energy system scheduling process based on NSGA-II improved by tent mapping chaotic algorithms. Processes 2020, 8, 426. [Google Scholar] [CrossRef] [Green Version]
- Tang, Y.; Li, C.; Li, S.; Cao, B.; Chen, C. A fusion crossover mutation sparrow search algorithm. Math. Probl. Eng. 2021, 2021, 9952606. [Google Scholar] [CrossRef]
- Xiong, J.; Liang, W.; Liang, X.; Yao, J. Intelligent quantification of natural gas pipeline defects using improved sparrow search algorithm and deep extreme learning machine. Chem. Eng. Res. Des. 2022, 183, 567–579. [Google Scholar] [CrossRef]
- Kassaymeh, S.; Al-Laham, M.; Al-Betar, M.A.; Alweshah, M.; Abdullah, S.; Makhadmeh, S. Backpropagation Neural Network optimization and software defect estimation modelling using a hybrid Salp Swarm optimizer-based Simulated Annealing Algorithm. Knowl.-Based Syst. 2022, 244, 108511. [Google Scholar] [CrossRef]
- Liu, C.; Vengayil, H.; Lu, Y.; Xu, X. A cyber-physical machine tools platform using OPC UA and MTConnect. J. Manuf. Syst. 2019, 51, 61–74. [Google Scholar] [CrossRef]


| Function Type | Function Formula | Dimension | Range | The Optimum |
|---|---|---|---|---|
| Unimodal | 30 | [−100, 100] | 0 | |
| Unimodal | 30 | [−30, 30] | 0 | |
| Unimodal | 30 | [−100, 100] | 0 | |
| Unimodal | 30 | [−10, 10] | 0 | |
| Multimodal | 6 | [0, 1] | −3.32 | |
| Multimodal | 2 | [−65, 65] | 1 | |
| Multimodal | 30 | [−32, 32] | 0 | |
| Multimodal | 30 | [−500, 500] | −12,569.487 |
| Function | Algorithm | The Worst Value | The Optimal Value | The Mean Value | Standard Deviation |
|---|---|---|---|---|---|
| F1 | WOA | 1.1026E−150 | 3.7848E−170 | 3.4927E−152 | 1.739E−151 |
| GWO | 7.8671E−58 | 1.2739E−61 | 5.768E−59 | 1.2134E−58 | |
| PSO | 1.5351 | 0.28415 | 0.80961 | 0.29399 | |
| SSA | 1.5731E−39 | 0.00E+00 | 3.1461E−41 | 2.2246E−40 | |
| ISSA | 0.00E+00 | 0.00E+00 | 0.00E+00 | 0.00E+00 | |
| F2 | WOA | 28.7271 | 26.1422 | 27.0898 | 0.48525 |
| GWO | 28.5395 | 25.1895 | 26.9658 | 0.73291 | |
| PSO | 1759.8402 | 90.1762 | 329.1056 | 338.0528 | |
| SSA | 0.00087056 | 1.9429E−10 | 2.6087E−05 | 0.00012261 | |
| ISSA | 0.000128 | 1.394E−11 | 1.6906E−05 | 2.8937E−05 | |
| F3 | WOA | 0.51245 | 0.0096724 | 0.11545 | 0.1205 |
| GWO | 1.4982 | 1.4252E−05 | 0.6006 | 0.3716 | |
| PSO | 2.2191 | 0.19723 | 0.99605 | 0.40937 | |
| SSA | 2.4322E−06 | 1.5397E−12 | 2.1759E−07 | 4.9544E−07 | |
| ISSA | 6.5149E−08 | 9.7579E−15 | 8.2053E−09 | 1.4792E−08 | |
| F4 | WOA | 4.2731E−101 | 5.6882E−117 | 9.3139E−103 | 6.0485E−102 |
| GWO | 6.381E−34 | 5.7026E−36 | 1.1818E−34 | 1.3682E−34 | |
| PSO | 8.5704 | 1.3881 | 5.2468 | 1.72 | |
| SSA | 4.8452E−21 | 0.00E+00 | 9.7027E−23 | 6.852E−22 | |
| ISSA | 0.00E+00 | 0.00E+00 | 0.00E+00 | 0.00E+00 | |
| F5 | WOA | −2.6381 | −3.322 | −3.2193 | 0.13087 |
| GWO | −3.0204 | −3.322 | −3.2575 | 0.083307 | |
| PSO | −2.6381 | −3.322 | −3.1448 | 0.1741 | |
| SSA | −3.1354 | −3.322 | −3.2633 | 0.071025 | |
| ISSA | −3.2031 | −3.322 | −3.2459 | 0.057648 | |
| F6 | WOA | 10.7632 | 0.998 | 2.1992 | 2.3476 |
| GWO | 12.6705 | 0.998 | 4.3642 | 4.29 | |
| PSO | 5.9288 | 0.998 | 1.7324 | 0.91169 | |
| SSA | 12.6705 | 0.998 | 9.8475 | 4.6552 | |
| ISSA | 0.998 | 0.998 | 0.998 | 1.2285E−16 | |
| F7 | WOA | 7.9936E−15 | 8.8818E−16 | 3.8725E−15 | 2.1959E−15 |
| GWO | 2.2204E−14 | 1.1546E−14 | 1.581E−14 | 2.4864E−15 | |
| PSO | 7.5458 | 2.429 | 3.704 | 0.8883 | |
| SSA | 8.8818E−16 | 8.8818E−16 | 8.8818E−16 | 0.00E+00 | |
| ISSA | 8.8818E−16 | 8.8818E−16 | 8.8818E−16 | 0.00E+00 | |
| F8 | WOA | −7676.802 | −12,569.3926 | −10,984.6355 | 1683.268 |
| GWO | −3322.8588 | −7398.1366 | −5900.4489 | 837.2153 | |
| PSO | −2411.375 | −4956.3865 | −3179.2495 | 511.3516 | |
| SSA | −5410.3787 | −12569.4857 | −9368.4539 | 2448.4265 | |
| ISSA | −10,102.0186 | −12,569.4866 | −11,565.6683 | 786.8091 |
| Variable | Value |
|---|---|
| D-axis inductance/H | 0.835 × 10⁻³ |
| Q-axis inductance/H | 0.835 × 10⁻³ |
| Permanent magnet flux linkage/Wb | 0.152 |
| Moment of inertia/ | 0.036 |
| Number of pole pairs | 3 |
| Label | Fault Type | Training Sample Size | Test Sample Number |
|---|---|---|---|
| 1 | Healthy | 112 | 28 |
| 2 | Minor fault | 112 | 28 |
| 3 | Medium fault | 112 | 28 |
| 4 | Serious fault | 112 | 28 |
| Algorithm | Test Sample Quantity | Number of Misdiagnosis | Accuracy/% |
|---|---|---|---|
| BP | 112 | 14 | 87.5 |
| SVM | 112 | 13 | 88.3929 |
| RF | 112 | 14 | 87.5 |
| SSA-RF | 112 | 6 | 94.6429 |
| ISSA-RF | 112 | 2 | 98.2143 |
Publisher’s Note: MDPI stays neutral with regard to jurisdictional claims in published maps and institutional affiliations. |
© 2022 by the authors. Licensee MDPI, Basel, Switzerland. This article is an open access article distributed under the terms and conditions of the Creative Commons Attribution (CC BY) license (https://creativecommons.org/licenses/by/4.0/).
Share and Cite
Huang, Y.; Yuan, B.; Xu, S.; Han, T. Fault Diagnosis of Permanent Magnet Synchronous Motor of Coal Mine Belt Conveyor Based on Digital Twin and ISSA-RF. Processes 2022, 10, 1679. https://doi.org/10.3390/pr10091679
Huang Y, Yuan B, Xu S, Han T. Fault Diagnosis of Permanent Magnet Synchronous Motor of Coal Mine Belt Conveyor Based on Digital Twin and ISSA-RF. Processes. 2022; 10(9):1679. https://doi.org/10.3390/pr10091679
Chicago/Turabian StyleHuang, Yourui, Biao Yuan, Shanyong Xu, and Tao Han. 2022. "Fault Diagnosis of Permanent Magnet Synchronous Motor of Coal Mine Belt Conveyor Based on Digital Twin and ISSA-RF" Processes 10, no. 9: 1679. https://doi.org/10.3390/pr10091679
APA StyleHuang, Y., Yuan, B., Xu, S., & Han, T. (2022). Fault Diagnosis of Permanent Magnet Synchronous Motor of Coal Mine Belt Conveyor Based on Digital Twin and ISSA-RF. Processes, 10(9), 1679. https://doi.org/10.3390/pr10091679