
Research on Energy Loss Characteristics of Pump-Turbine during Abnormal Shutdown

Abstract
:1. Introduction
2. Numerical Model
2.1. Computational Method
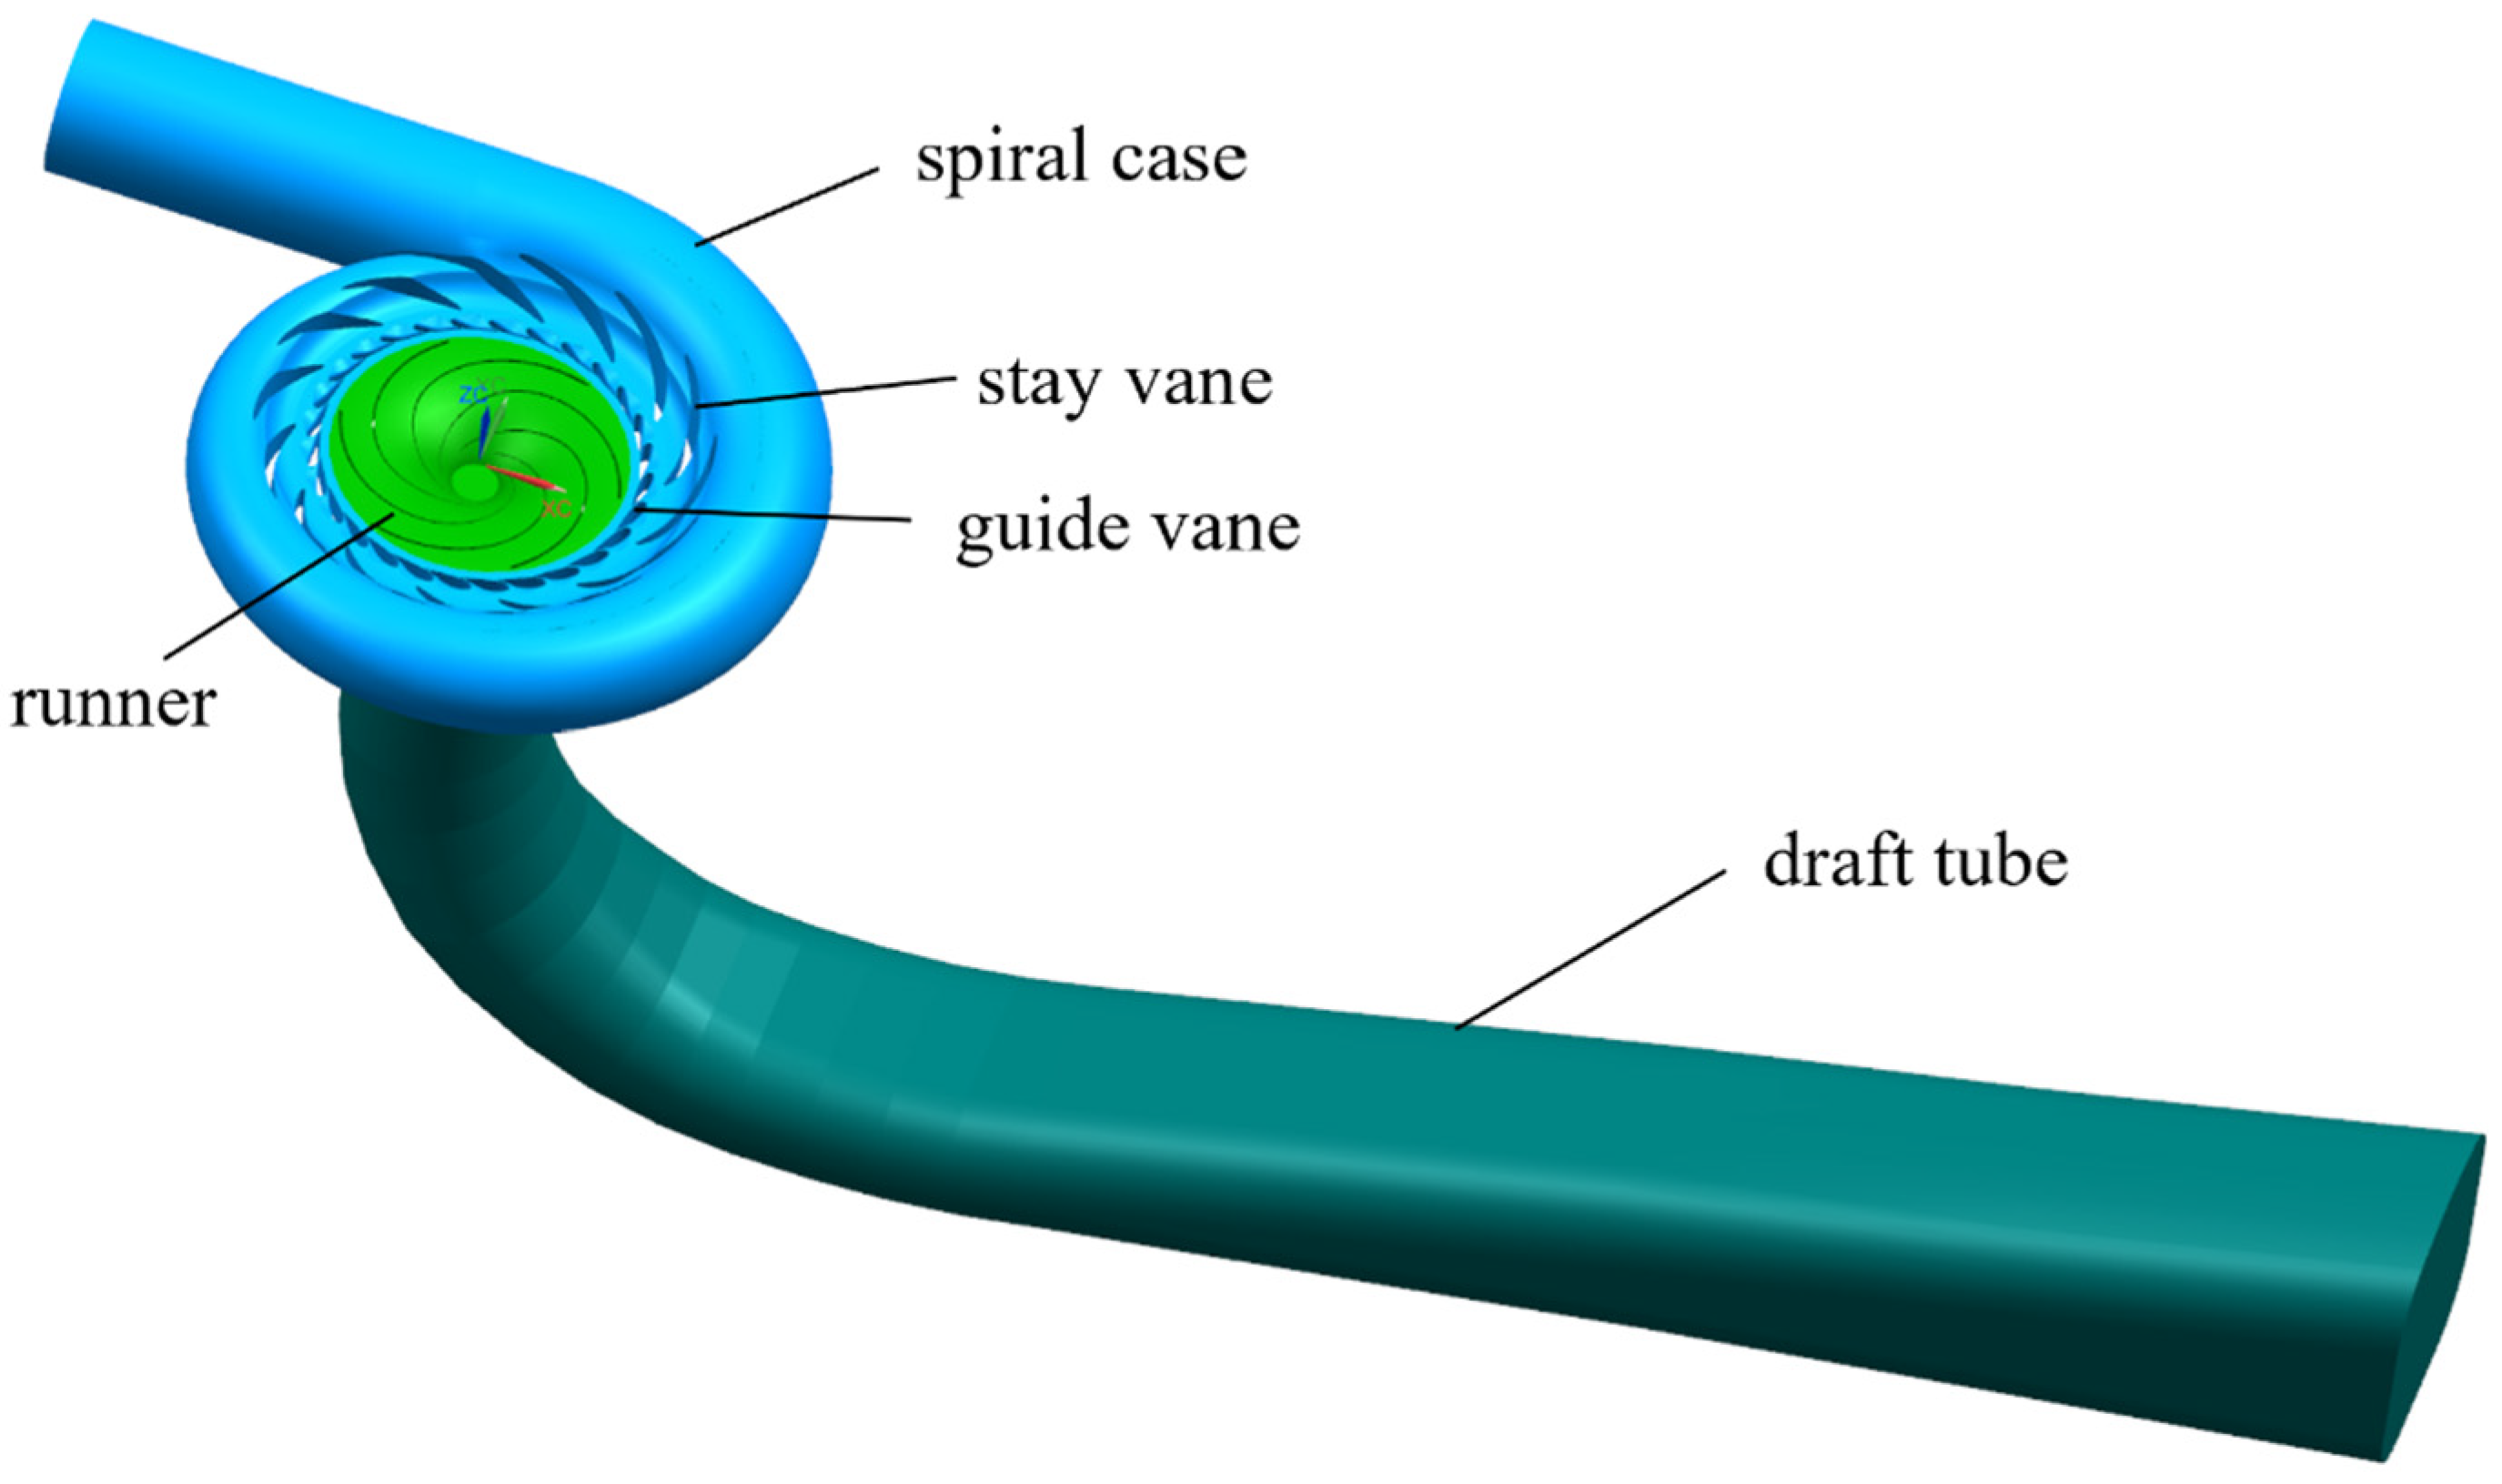
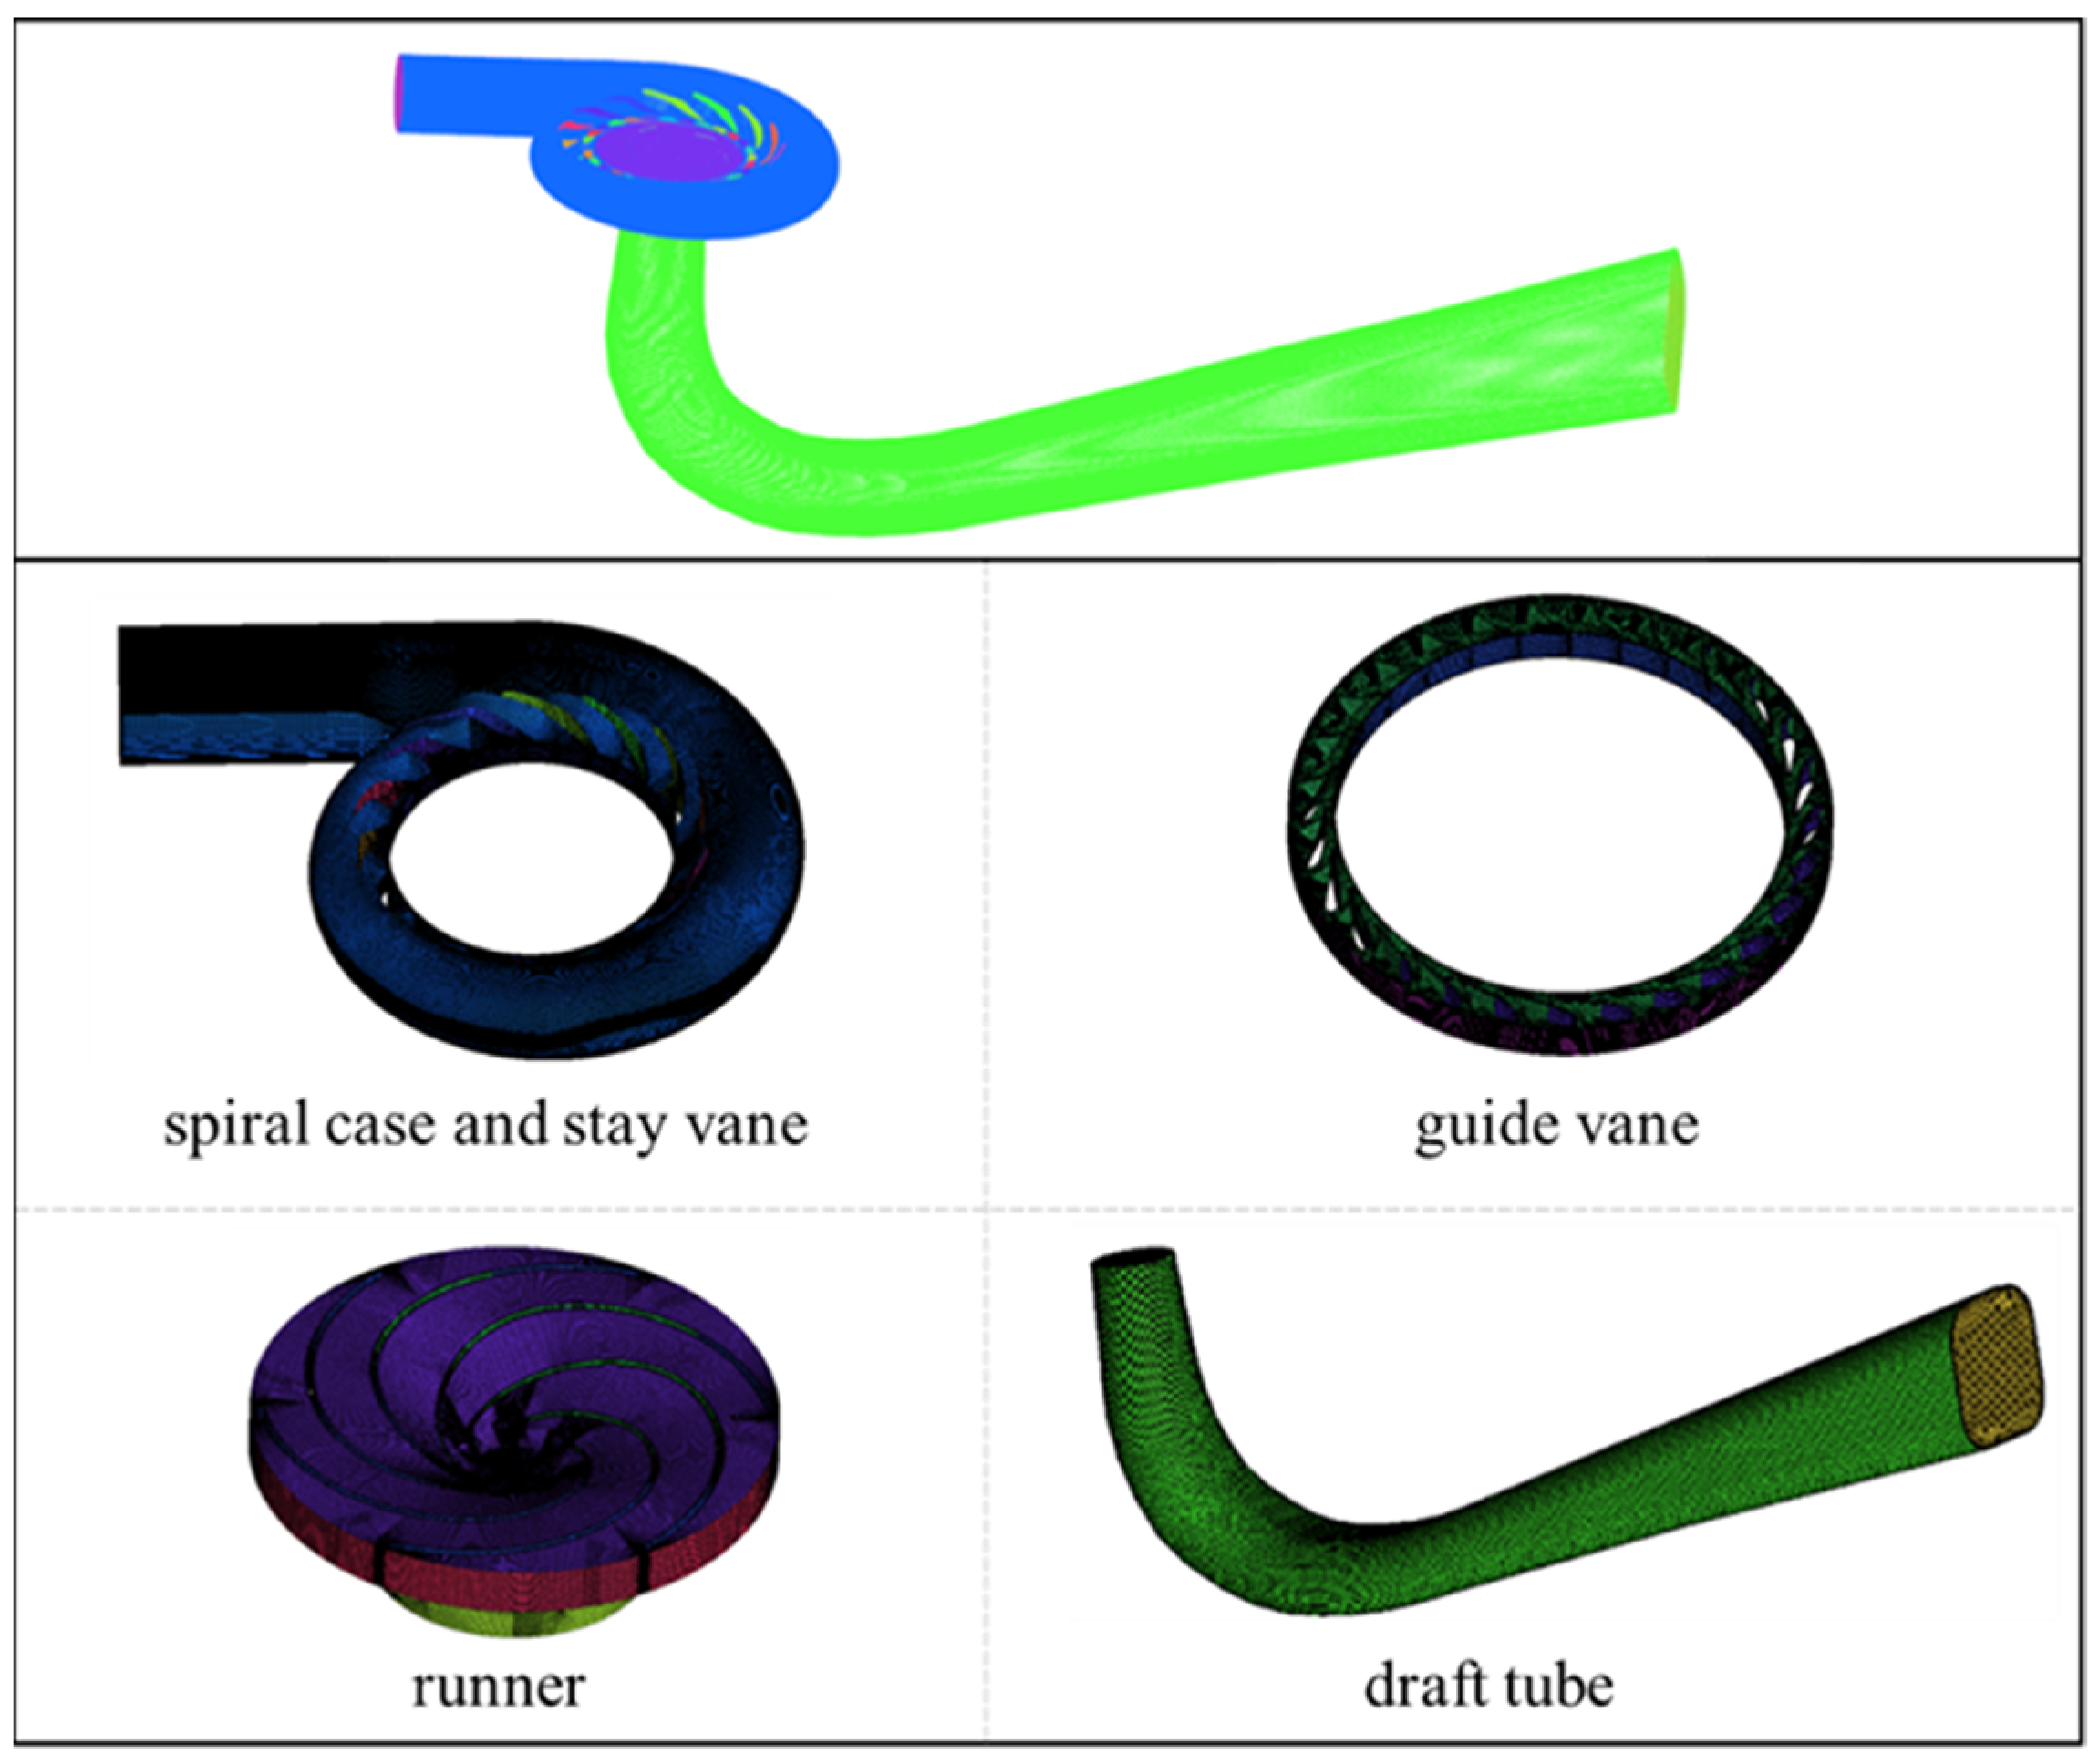
2.2. Computational Model
2.3. Boundary Conditions and Setting
3. Results and Discussion
3.1. Energy Loss Analysis
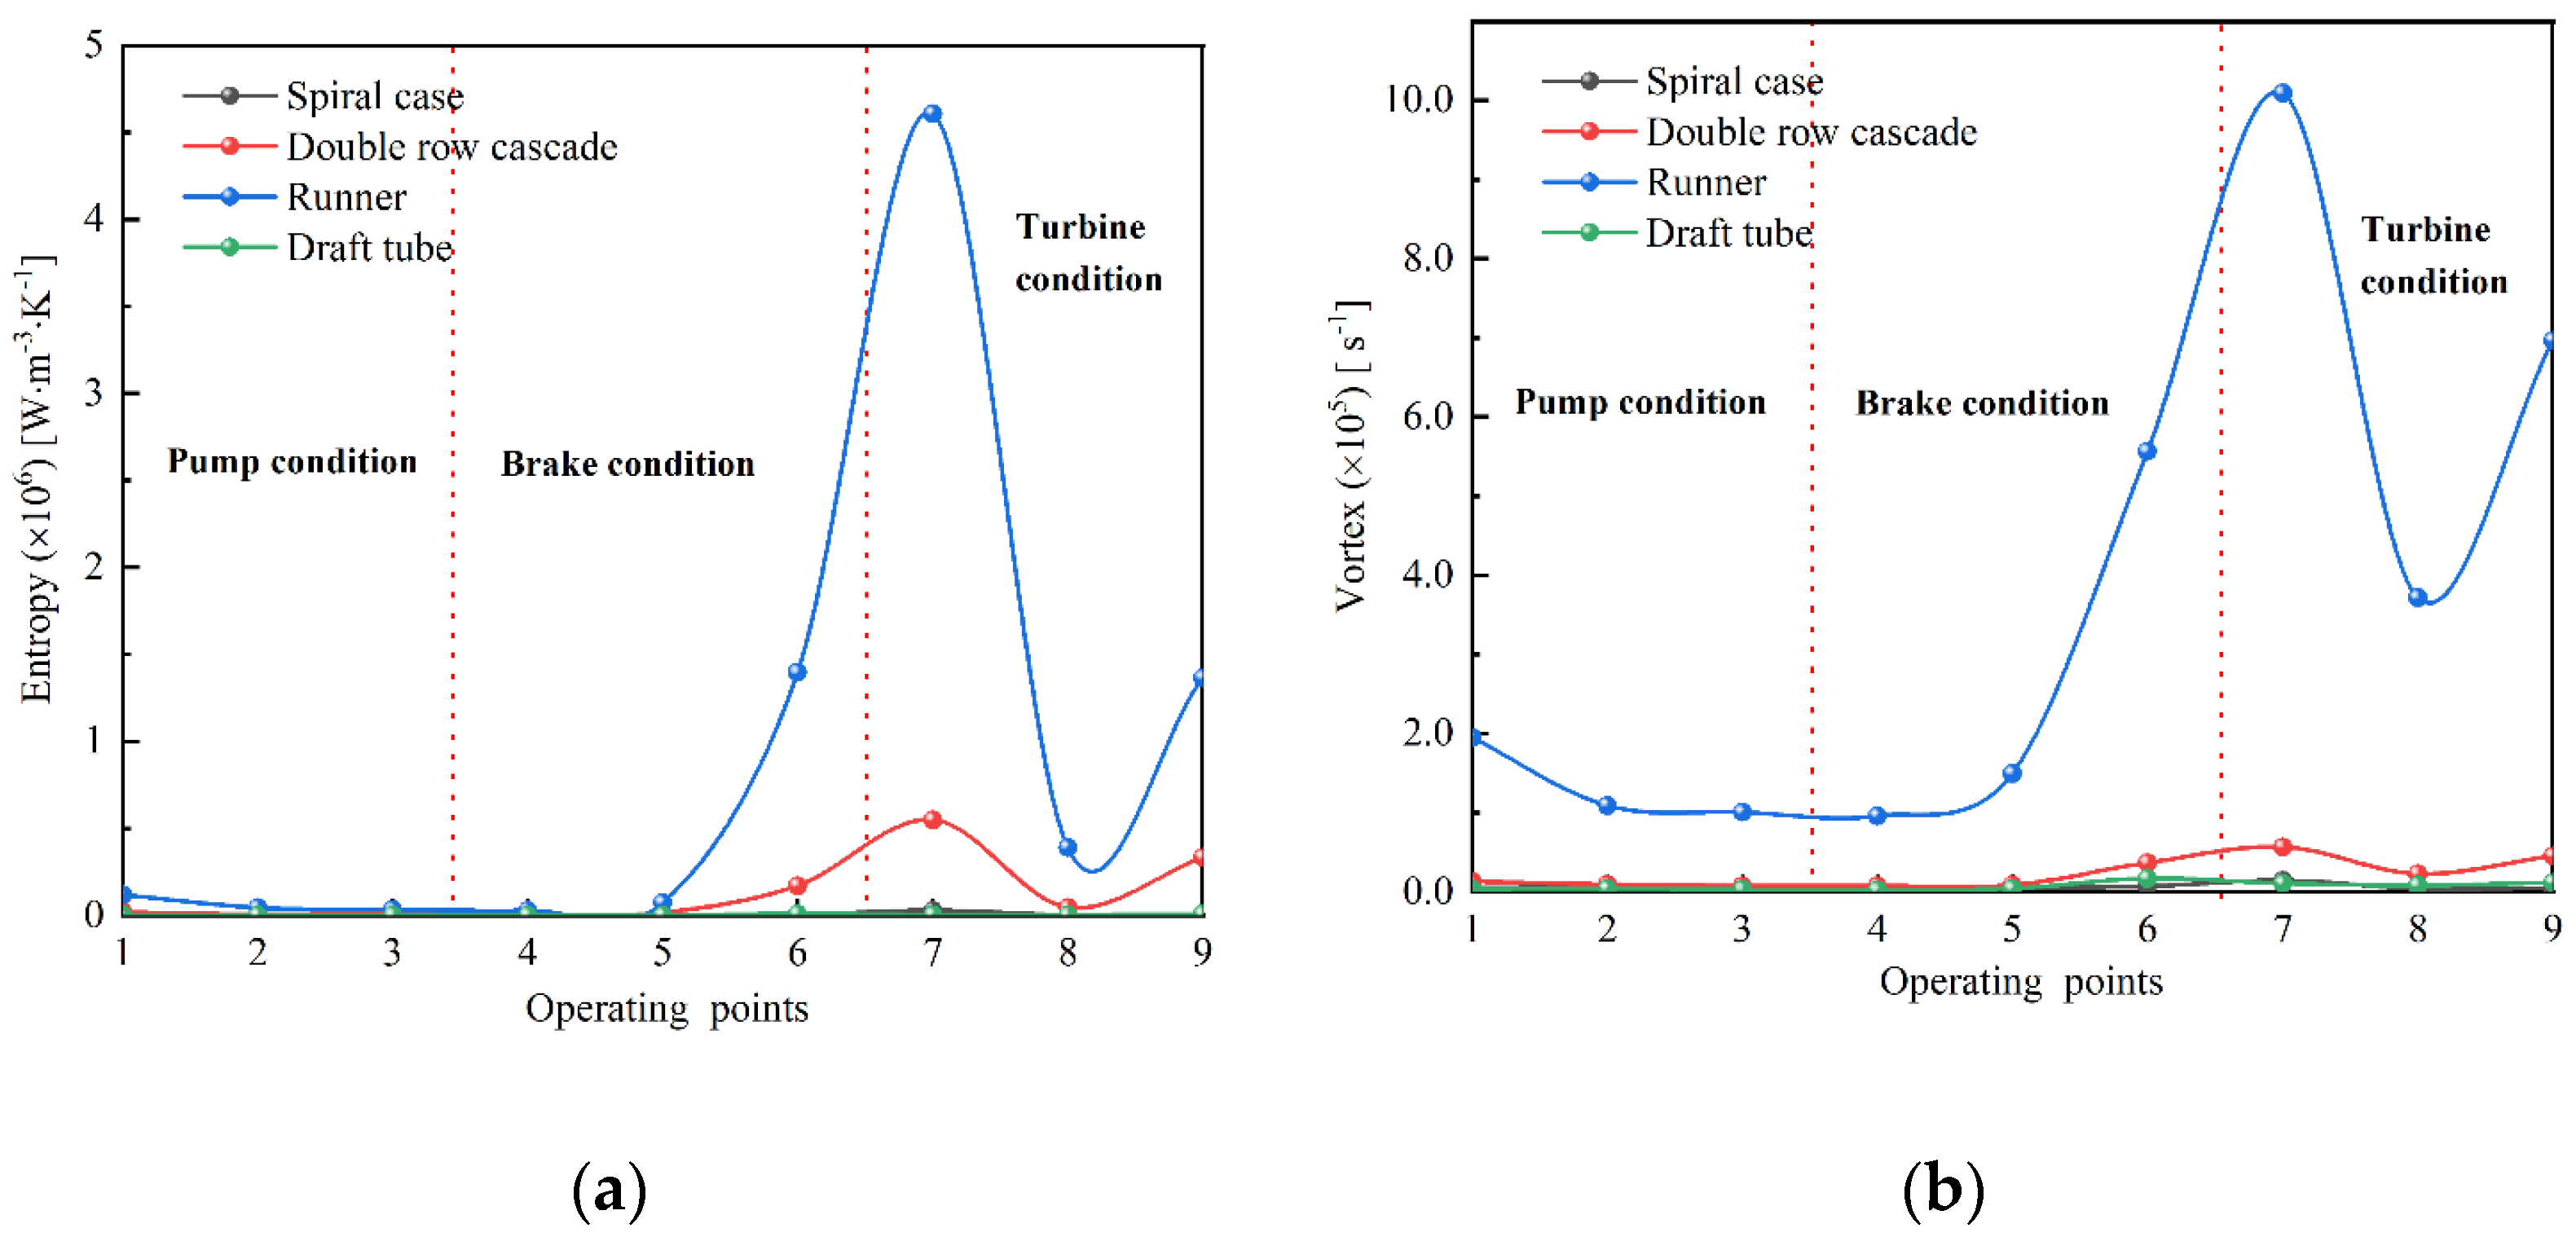
3.1.1. Entropy Production Analysis
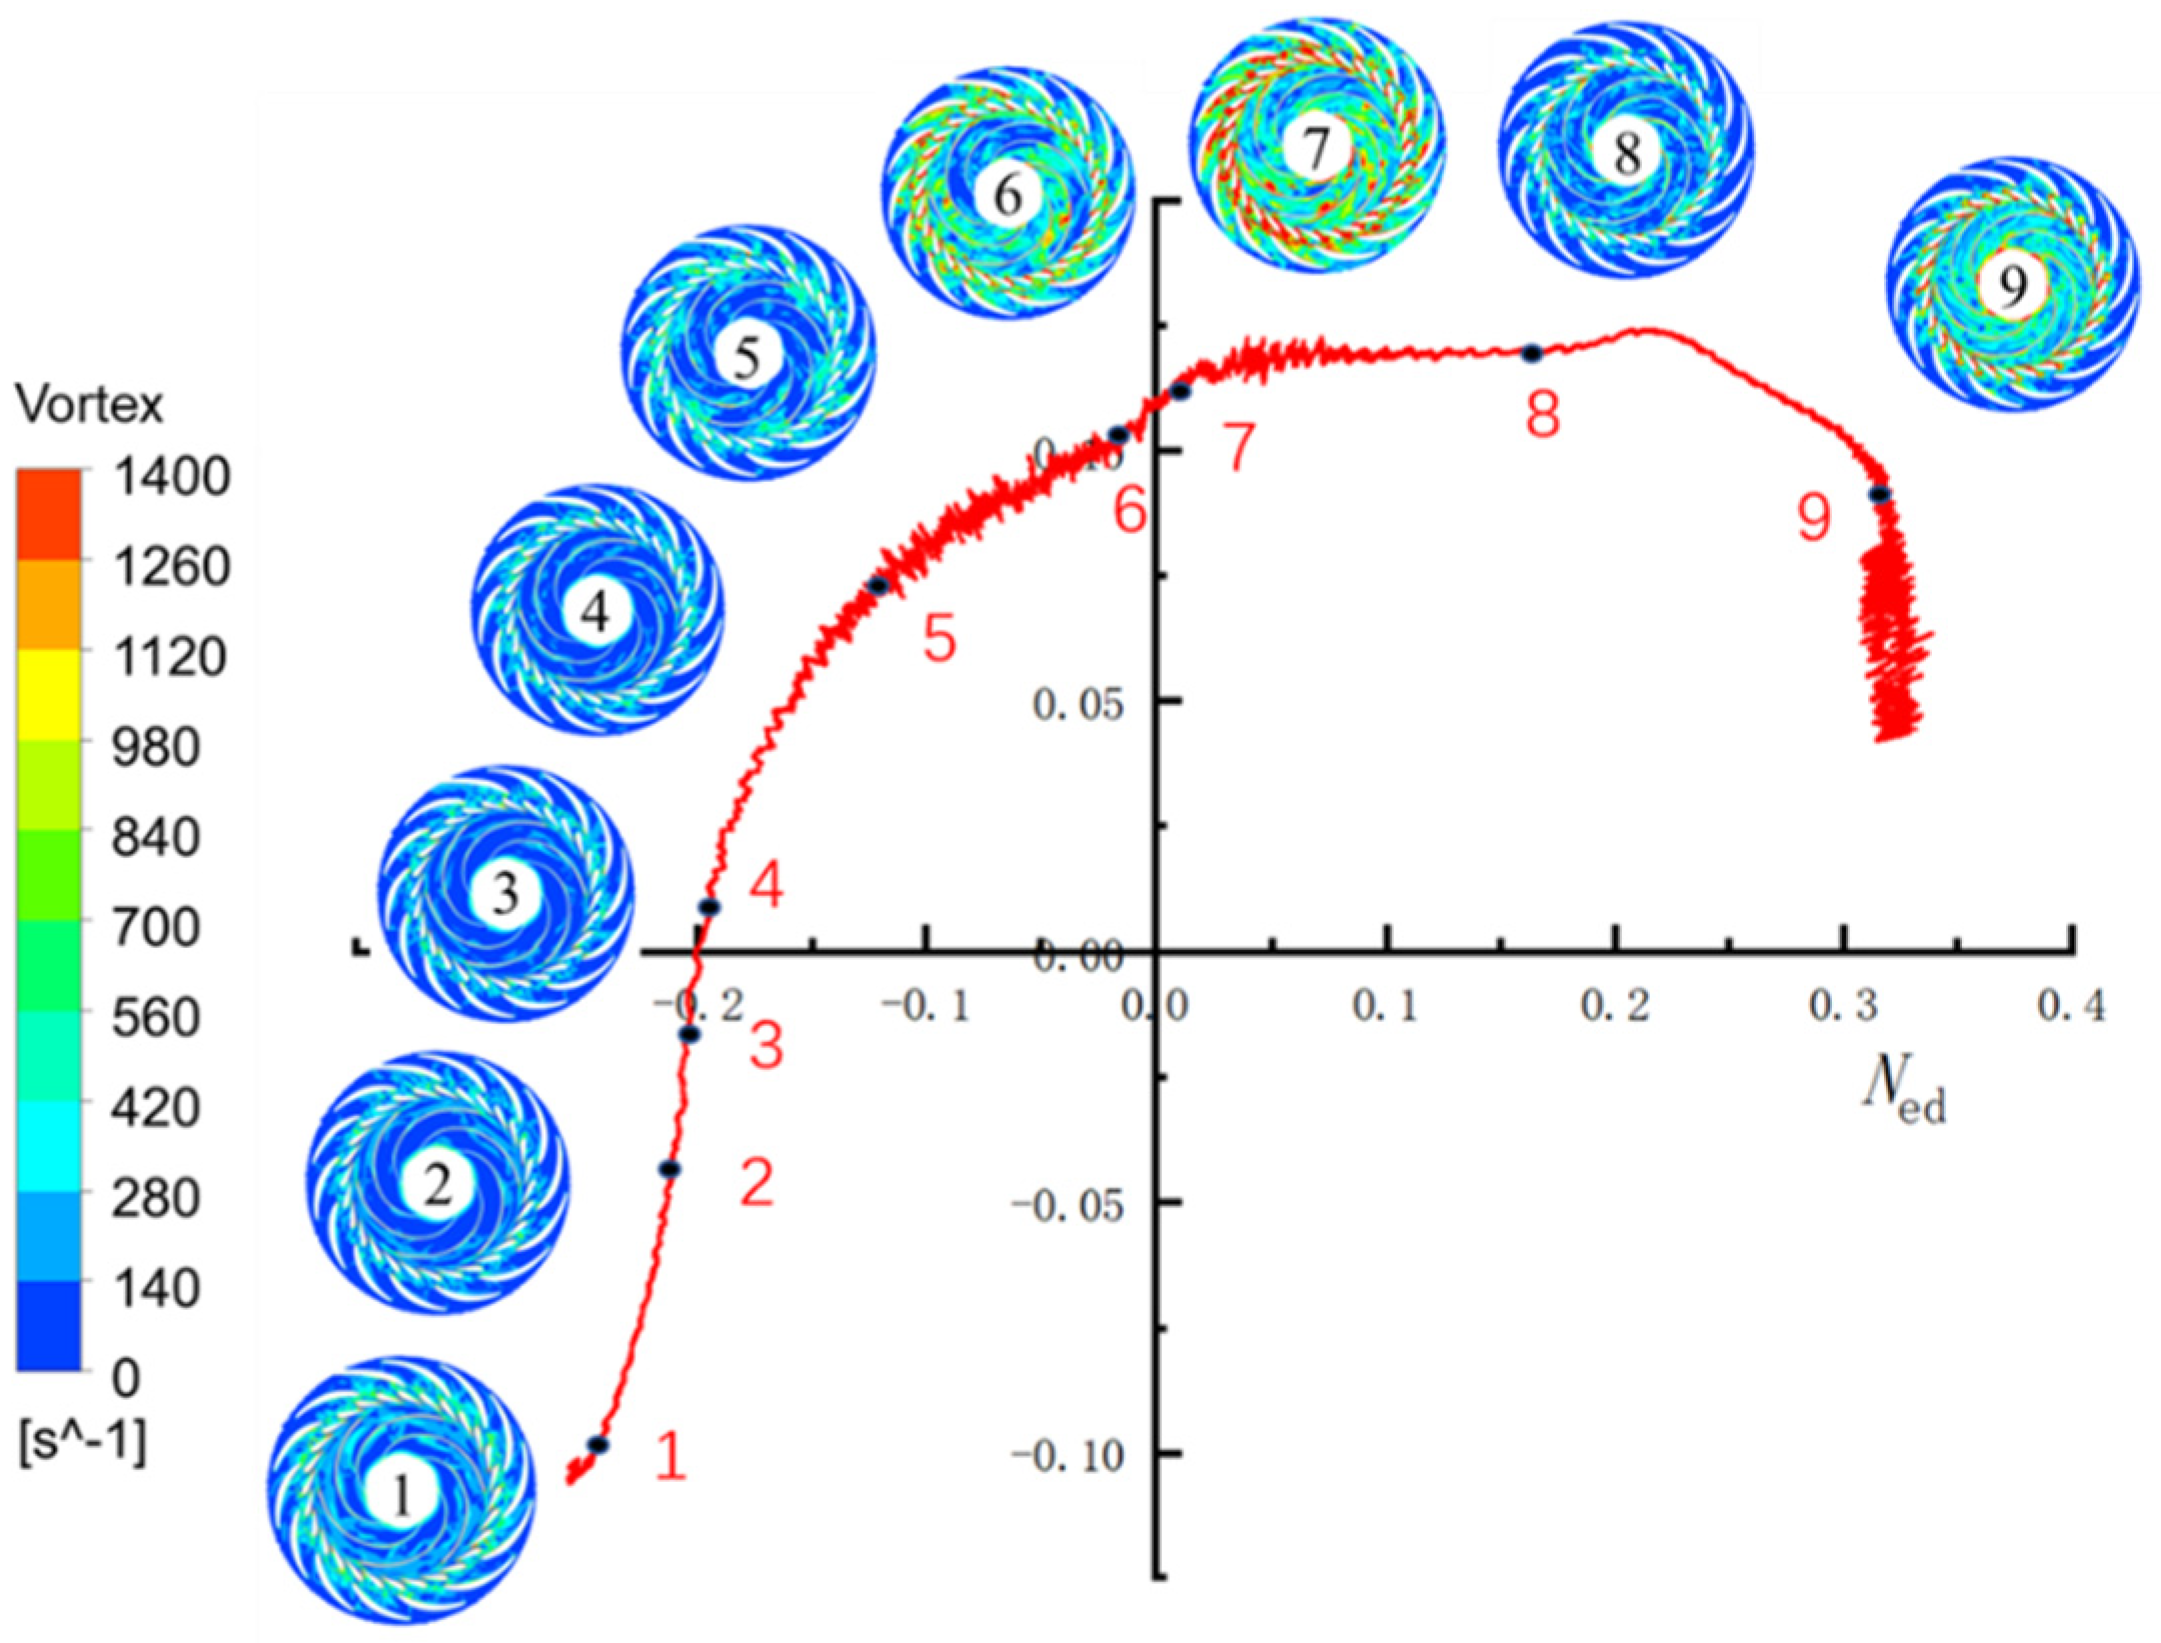
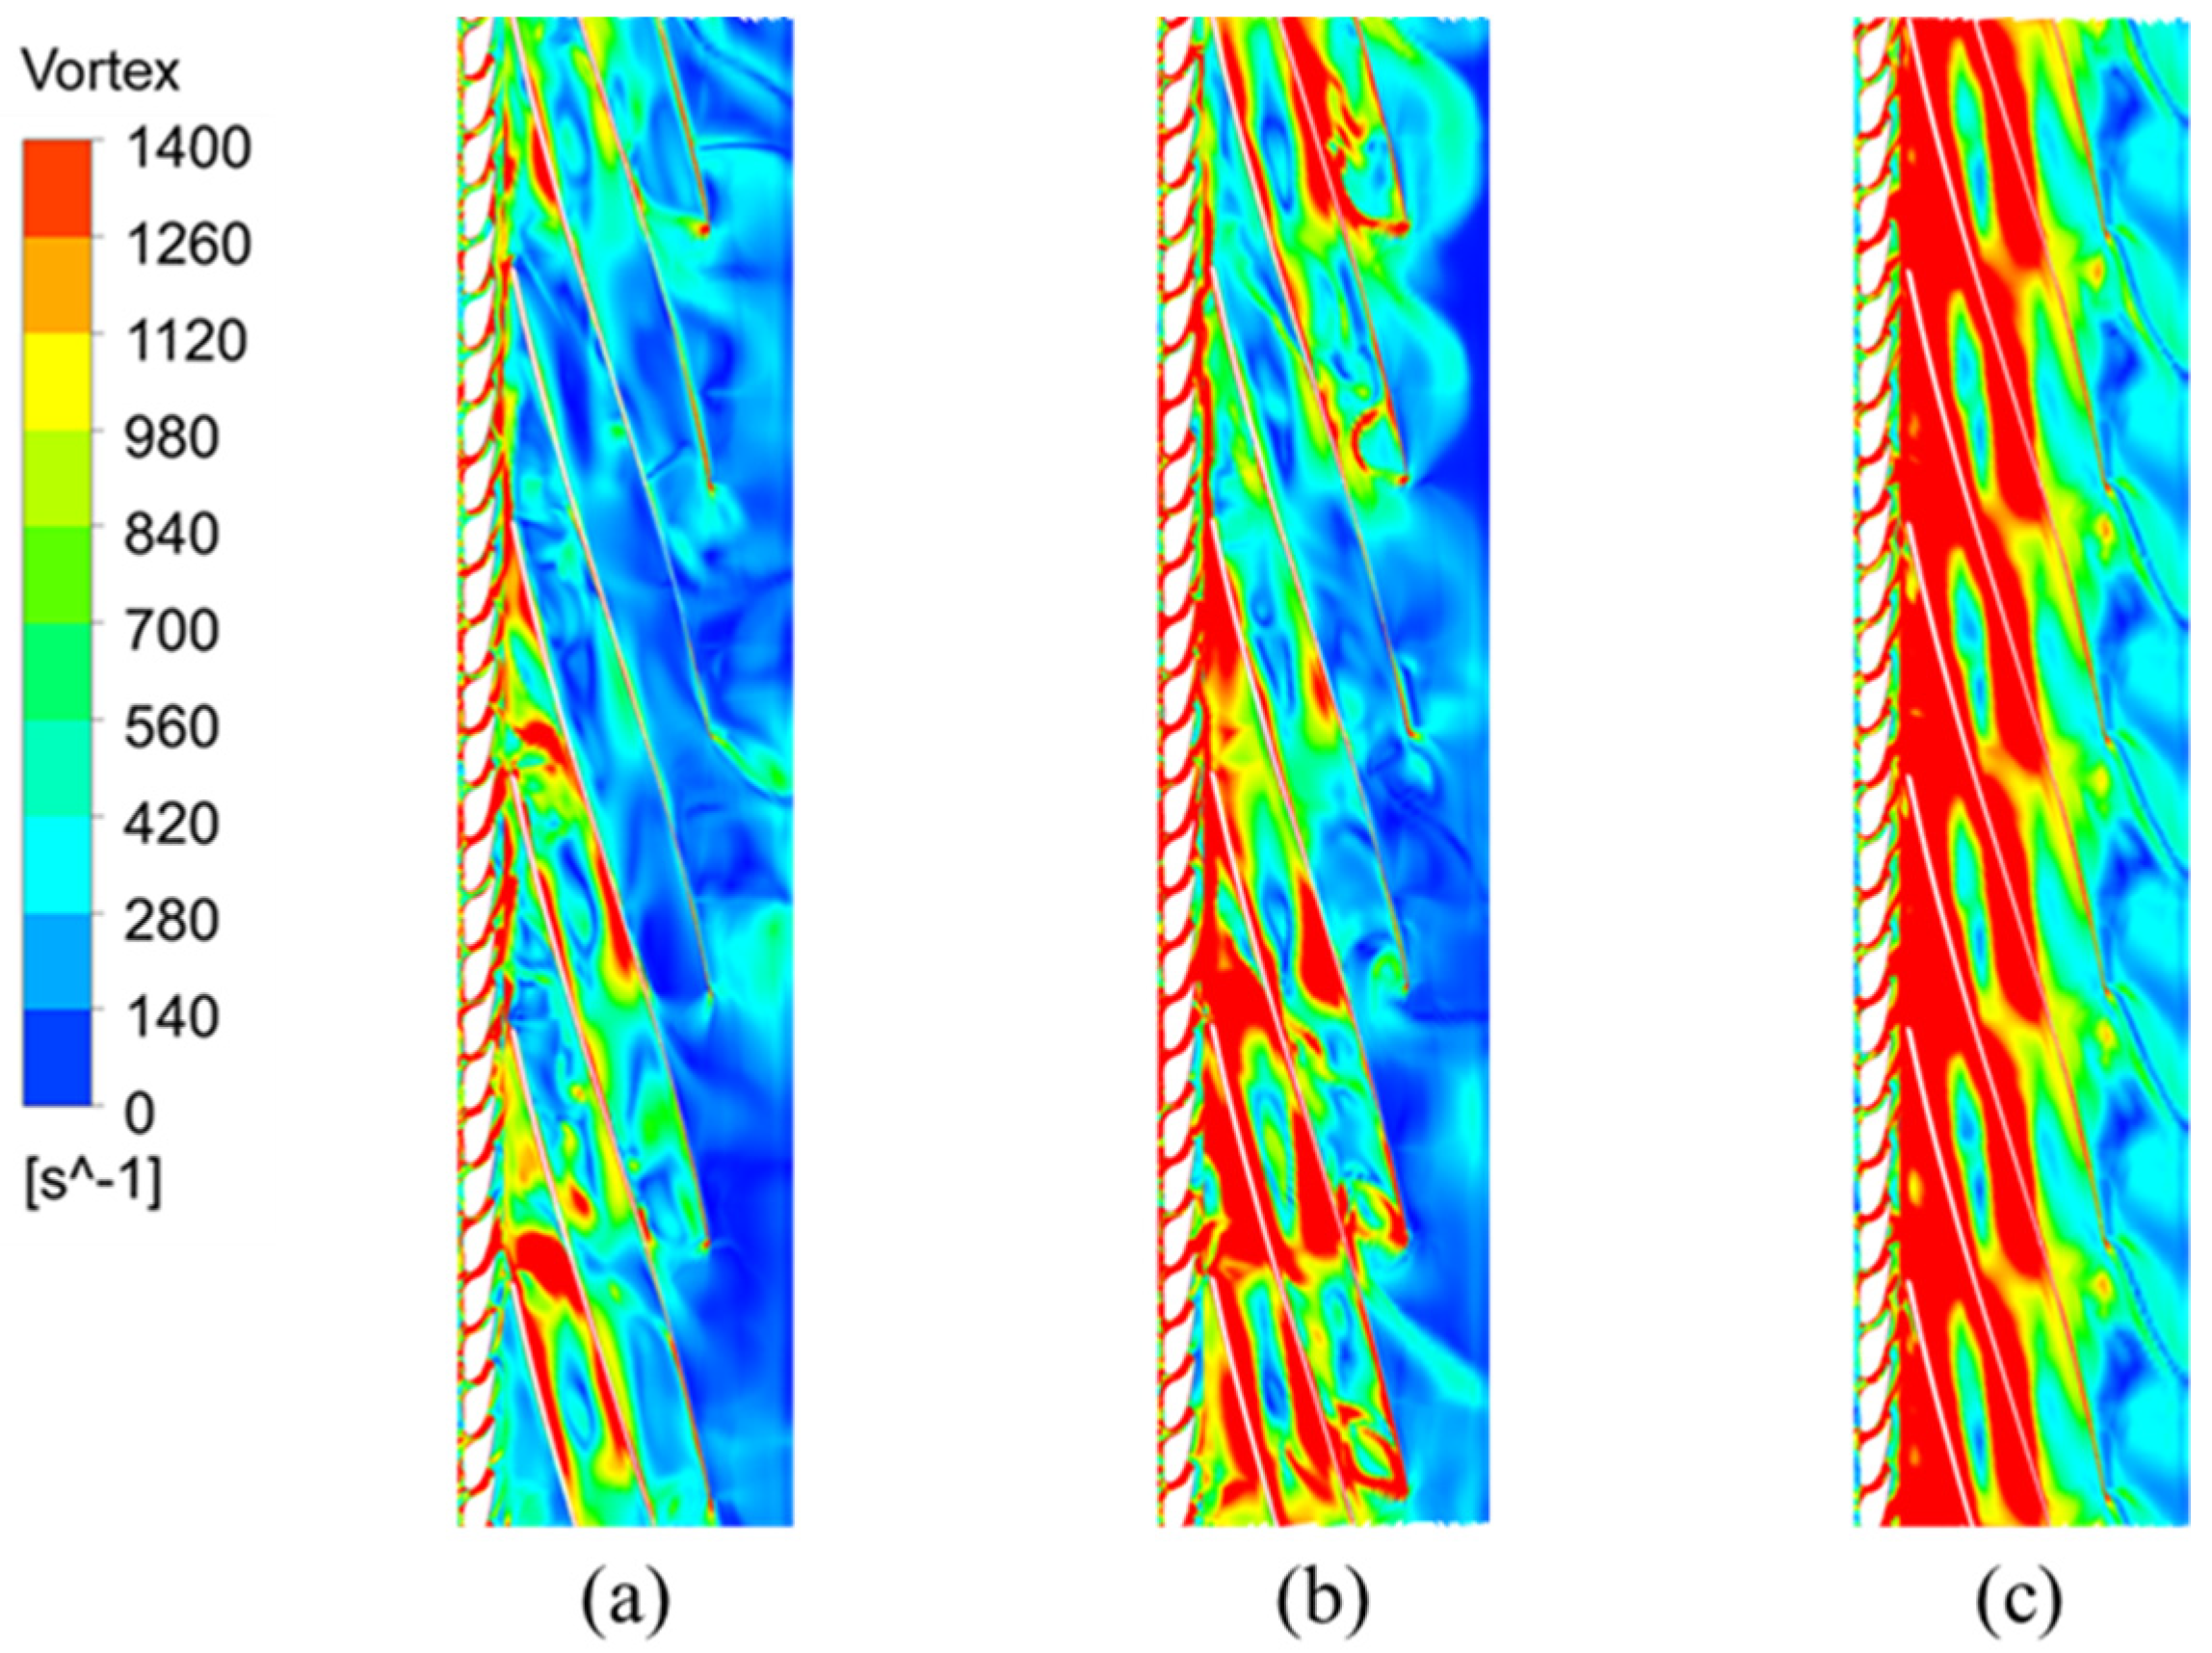
3.1.2. Vorticity Analysis
3.2. Distribution Law Analysis
4. Conclusions
Author Contributions
Funding
Institutional Review Board Statement
Informed Consent Statement
Data Availability Statement
Acknowledgments
Conflicts of Interest
References
- Zhang, W.; Feng, D.; Qi, W.; Han, Z.; Guan, Y.; Sun, W.; Wang, W. Research on Peak Shaving Power Source Planning for Receiving-End Grid Considering High Proportion of New Energy and Large-Scale Outer Power. IOP Conf. Ser. Earth Environ. Sci. 2019, 267, 062009. [Google Scholar] [CrossRef]
- Kong, Y.; Kong, Z.; Liu, Z.; Wei, C.; Zhang, J.; An, G. Pumped Storage Power Stations in China: The past, the Present, and the Future. Renew. Sustain. Energy Rev. 2017, 71, 720–731. [Google Scholar] [CrossRef]
- He, Y.; Liu, Y.; Li, M.; Zhang, Y. Benefit Evaluation and Mechanism Design of Pumped Storage Plants under the Background of Power Market Reform—A Case Study of China. Renew. Energ. 2022, 191, 796–806. [Google Scholar] [CrossRef]
- Kusakana, K. Optimal Scheduling for Distributed Hybrid System with Pumped Hydro Storage. Energy Convers. Manag. 2016, 111, 253–260. [Google Scholar] [CrossRef]
- Yu, A.; Li, L.; Ji, J.; Tang, Q. Numerical Study on the Energy Evaluation Characteristics in a Pump Turbine Based on the Thermodynamic Entropy Theory. Renew. Energ. 2022, 195, 766–779. [Google Scholar] [CrossRef]
- Liu, D.M.; Zheng, J.S.; Wen, G.Z.; Zhao, Y.Z.; Shi, Q.H. Numerical Simulation on the “S” Characteristics and Pressure Fluctuation of Reduced Pump-Turbine at Start-Up Condition. IOP Conf. Ser. Earth Environ. Sci. 2012, 15, 062034. [Google Scholar] [CrossRef]
- Yao, Z.; Bi, H.L.; Huang, Q.S.; Li, Z.J.; Wang, Z.W. Analysis on Influence of Guide Vanes Closure Laws of Pump-Turbine on Load Rejection Transient Process. IOP Conf. Ser. Mater. Sci. Eng. 2013, 52, 072004. [Google Scholar] [CrossRef]
- Walseth, E.; Nielsen, T.; Svingen, B. Measuring the Dynamic Characteristics of a Low Specific Speed Pump-Turbine Model. Energies 2016, 9, 199. [Google Scholar] [CrossRef]
- Zhang, L.G.; Zhou, D.Q. CFD Research on Runaway Transient of Pumped Storage Power Station Caused by Pumping Power Failure. IOP Conf. Ser. Mater. Sci. Eng. 2013, 52, 052027. [Google Scholar] [CrossRef]
- Jintao, L.; Shuhong, L.; Yuekun, S.; Yulin, W.; Leqin, W. Three Dimensional Flow Simulation of Load Rejection of a Prototype Pump-Turbine. Eng. Comput. 2013, 29, 417–426. [Google Scholar] [CrossRef]
- Liu, J.; Liu, S.; Sun, Y.; Jiao, L.; Wu, Y.; Wang, L. Three-Dimensional Flow Simulation of Transient Power Interruption Process of a Prototype Pump-Turbine at Pump Mode. J. Mech. Sci. Technol. 2013, 27, 1305–1312. [Google Scholar] [CrossRef]
- Mao, X.; Chen, X.; Lu, J.; Liu, P.; Zhang, Z. Improving Internal Fluid Stability of Pump Turbine in Load Rejection Process by Co-adjusting Inlet Valve and Guide Vane. J. Energy Storage. 2022, 50, 104623. [Google Scholar] [CrossRef]
- Xia, L.; Cheng, Y.; Yang, Z.; You, J.; Yang, J.; Qian, Z. Evolutions of Pressure Fluctuations and Runner Loads during Runaway Processes of a Pump-Turbine. J. Fluids Eng. 2017, 139, 091101. [Google Scholar] [CrossRef]
- Li, D.; Wang, H.; Li, Z.; Nielsen, T.K.; Goyal, R.; Wei, X.; Qin, D. Transient Characteristics during the Closure of Guide Vanes in a Pump-Turbine in Pump Mode. Renew. Energy 2018, 118, 973–983. [Google Scholar] [CrossRef]
- Zhang, X.; Zeng, W.; Cheng, Y.; Yang, Z.; Chen, Q.; Yang, J. Mechanism of Fast Transition of Pressure Pulsations in the Vaneless Space of a Model Pump-Turbine during Runaway. J. Fluids Eng. 2019, 141, 121104. [Google Scholar] [CrossRef]
- Yang, Z.; Cheng, Y.; Xia, L.; Meng, W.; Liu, K.; Zhang, X. Evolutions of Flow Patterns and Pressure Fluctuations in a Prototype Pump-Turbine during the Runaway Transient Process after Pump-Trip. Renew. Energy 2020, 152, 1149–1159. [Google Scholar] [CrossRef]
- Yang, Z.; Liu, Z.; Cheng, Y.; Zhang, X.; Liu, K.; Xia, L. Differences of Flow Patterns and Pressure Pulsations in Four Prototype Pump-Turbines during Runaway Transient Processes. Energies 2020, 13, 5269. [Google Scholar] [CrossRef]
- Zhao, Z.; Chen, D.; Li, H.; Wei, H. Performance Analysis of Pumped-Storage Plant from Condenser Mode to Generating Process. J. Energy Storage 2020, 29, 101286. [Google Scholar] [CrossRef]
- Yang, J.; Lv, Y.; Liu, D.; Wang, Z. Pressure Analysis in the Draft Tube of a Pump-Turbine under Steady and Transient Conditions. Energies 2021, 14, 4732. [Google Scholar] [CrossRef]
- Gong, R.; Wang, H.; Chen, L.; Li, D.; Zhang, H.; Wei, X. Application of Entropy Production Theory to Hydro-turbine Hydraulic Analysis. Sci. China Technol. Sci. 2013, 56, 1636–1643. [Google Scholar] [CrossRef]
- Li, D.; Gong, R.; Wang, H.; Xiang, G.; Wei, X.; Qin, D. Entropy Production Analysis for Hump Characteristics of a Pump Turbine Model. Chin. J. Mech. Eng. 2016, 29, 803–812. [Google Scholar] [CrossRef]
- Li, D.; Wang, H.; Qin, Y.; Han, L.; Wei, X.; Qin, D. Entropy Production Analysis of Hysteresis Characteristic of a Pump-Turbine Model. Energy Convers. Manag. 2017, 149, 175–191. [Google Scholar] [CrossRef]
- Fu, X.; Li, D.; Wang, H.; Zhang, G.; Li, Z.; Wei, X.; Qin, D. Energy Analysis in a Pump-Turbine during the Load Rejection Process. J. Fluids Eng. 2018, 140, 101107. [Google Scholar] [CrossRef]
- Li, F.; Fan, H.; Wang, Z.; Chen, N. Coupled Design and Optimization for Runner Blades of a Tubular Turbine Based on the Boundary Vorticity Dynamics Theory. In Proceedings of the Fluids Engineering Division Summer Meeting, Toronto, ON, Canada, 3–5 August 2022; pp. 603–609. [Google Scholar]
- Li, D.; Gong, R.; Wang, H.; Han, L.; Wei, X.; Qin, D. Analysis of Vorticity Dynamics for Hump Characteristics of a Pump Turbine Model. J. Mech. Sci. Technol. 2016, 30, 3641–3650. [Google Scholar] [CrossRef]
- Li, X.; Li, Z.; Zhu, B.; Wang, W. Effect of Tip Clearance Size on Tubular Turbine Leakage Characteristics. Processes 2021, 9, 1418. [Google Scholar] [CrossRef]
- Kock, F.; Herwig, H. Local Entropy Production in Turbulent Shear Flows: A High-Reynolds Number Model with Wall Functions. Int. J. Heat Mass Transf. 2004, 47, 2205–2215. [Google Scholar] [CrossRef]


| Parameter | Symbol | Unit | Value |
|---|---|---|---|
| Nominal diameter | D | mm | 349 |
| Number of runner blades | Z0 | (-) | 6 |
| Number of guide vanes | Z1 | (-) | 28 |
| Number of stay vanes | Z2 | (-) | 14 |
| Rated flow rate | Qd | m3/s | 0.203 |
| Optimal guide vane opening | α | ° | 10 |
| Optimal efficiency | E | % | 92.61 |
| Rated head | H | m | 12 |
| Part | Nodes (Million) | Quality | ||||
|---|---|---|---|---|---|---|
| 1 | 2 | 3 | 4 | 5 | ||
| Spiral case and Stay vane | 1.58 | 2.05 | 3.78 | 4.82 | 8.36 | 0.30 |
| Guide vane | 0.76 | 0.94 | 1.09 | 1.83 | 2.48 | 0.42 |
| Runner | 2.11 | 2.11 | 2.11 | 2.11 | 2.11 | 0.33 |
| Draft tube | 0.75 | 1.00 | 1.41 | 1.89 | 2.70 | 0.38 |
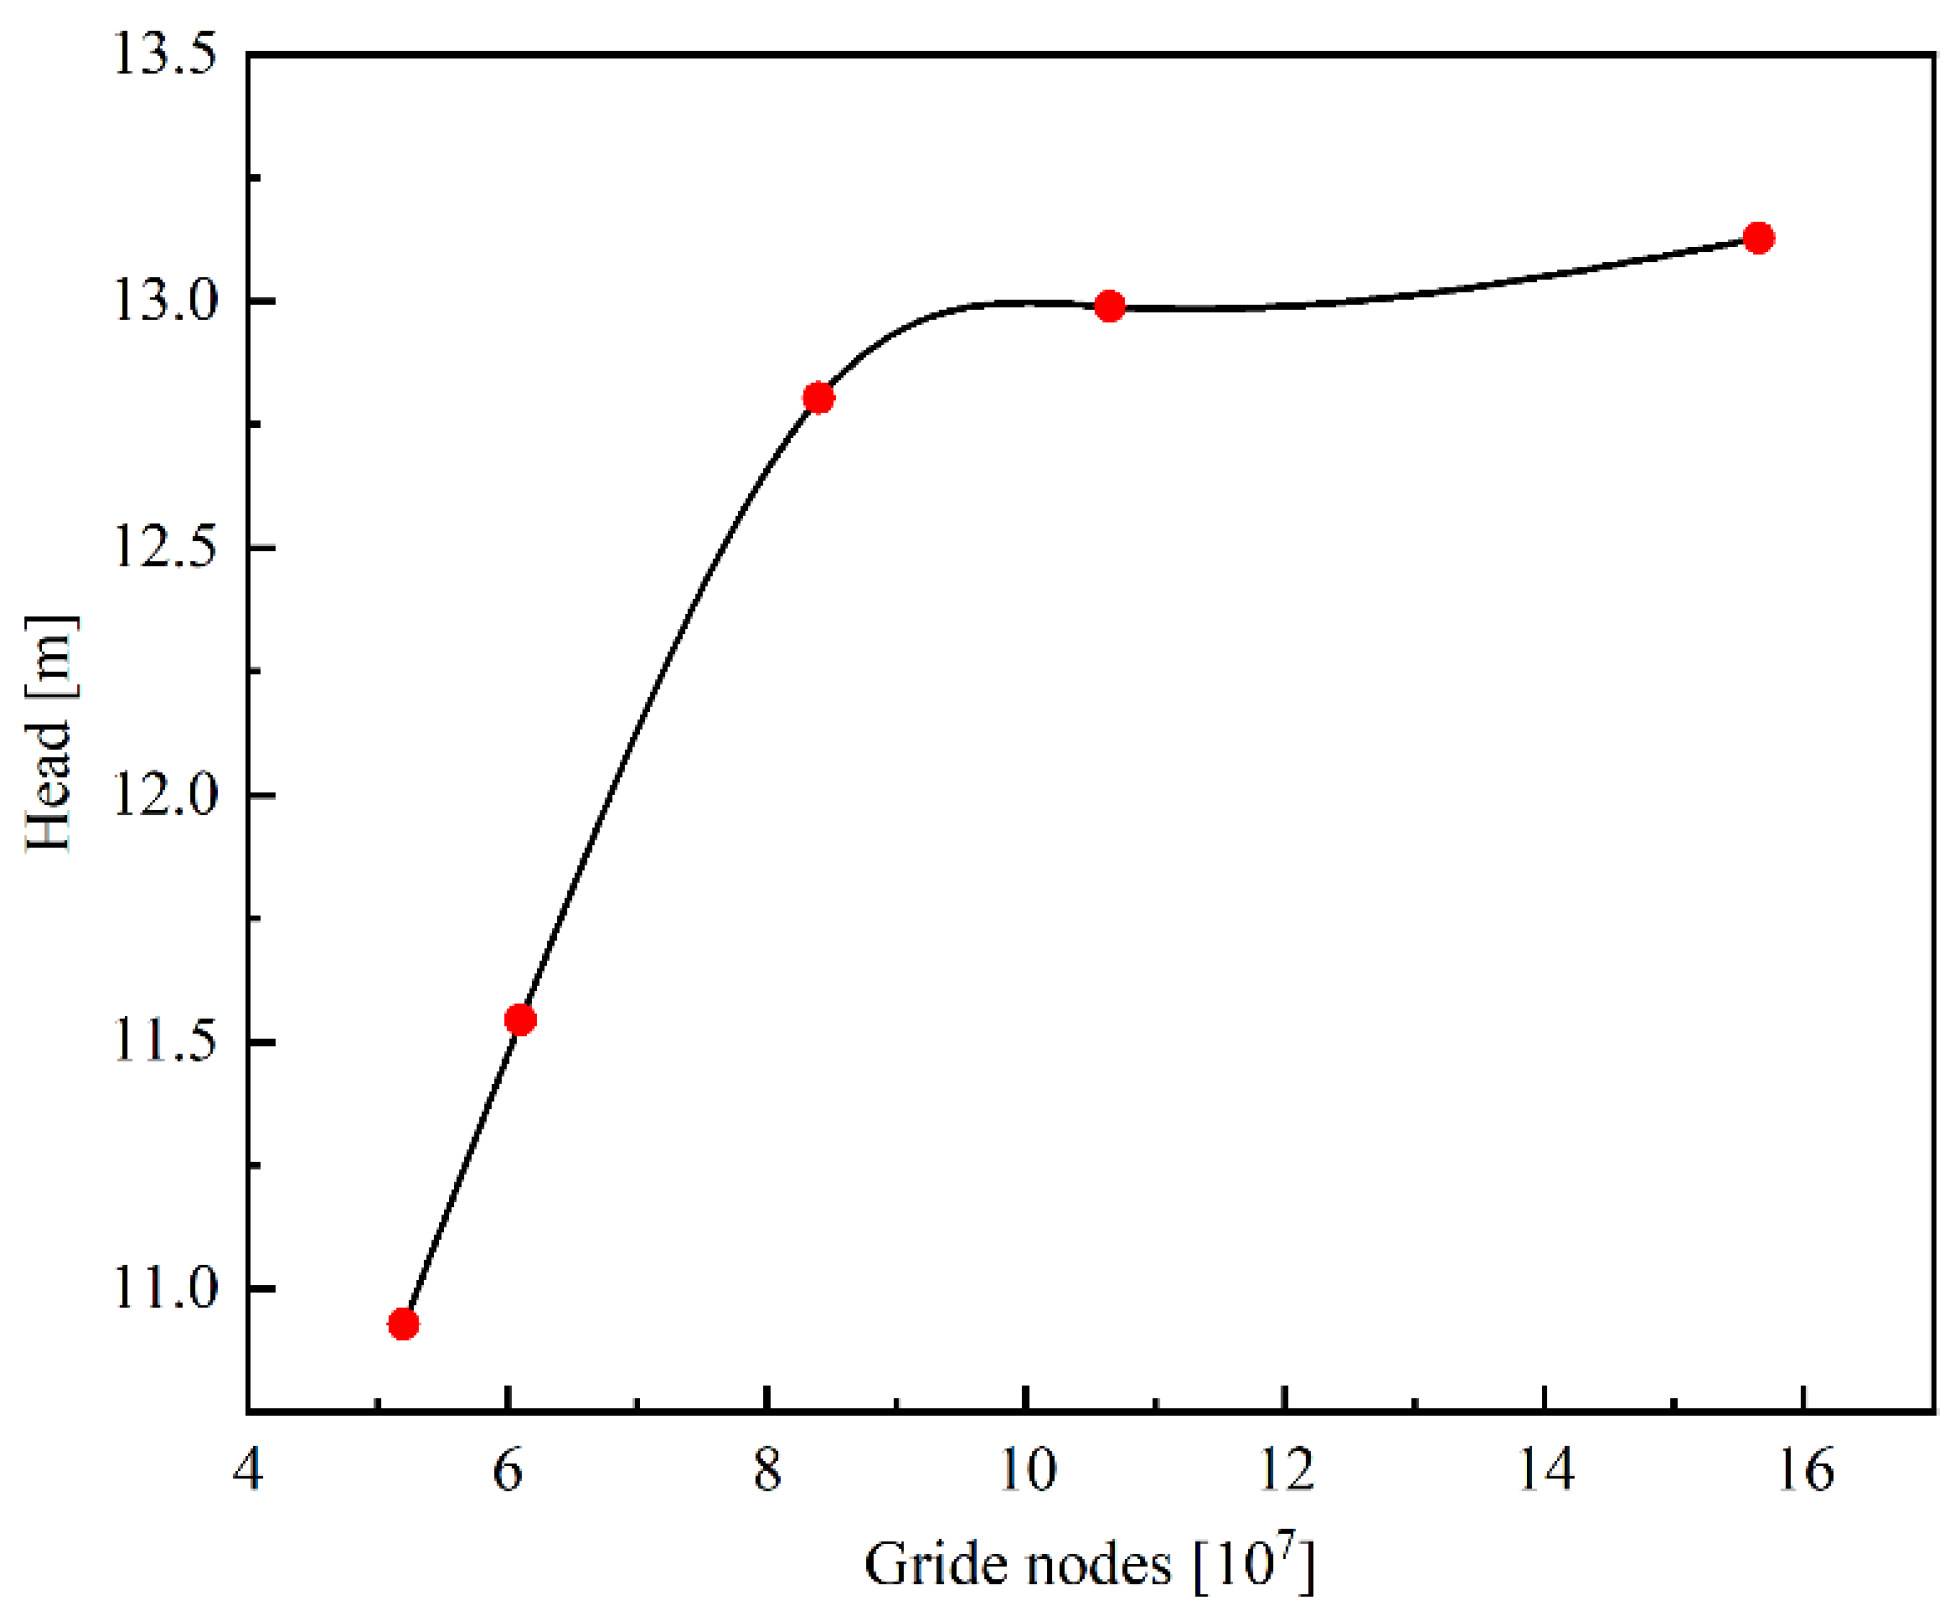
| Sum | 5.20 | 6.10 | 8.40 | 10.65 | 15.65 | — |
| Operating Point | Inlet(kPa) | Outlet (kPa) | Rotate Speed (rpm) | Turbulence Intensity | Time Step (s) | |
|---|---|---|---|---|---|---|
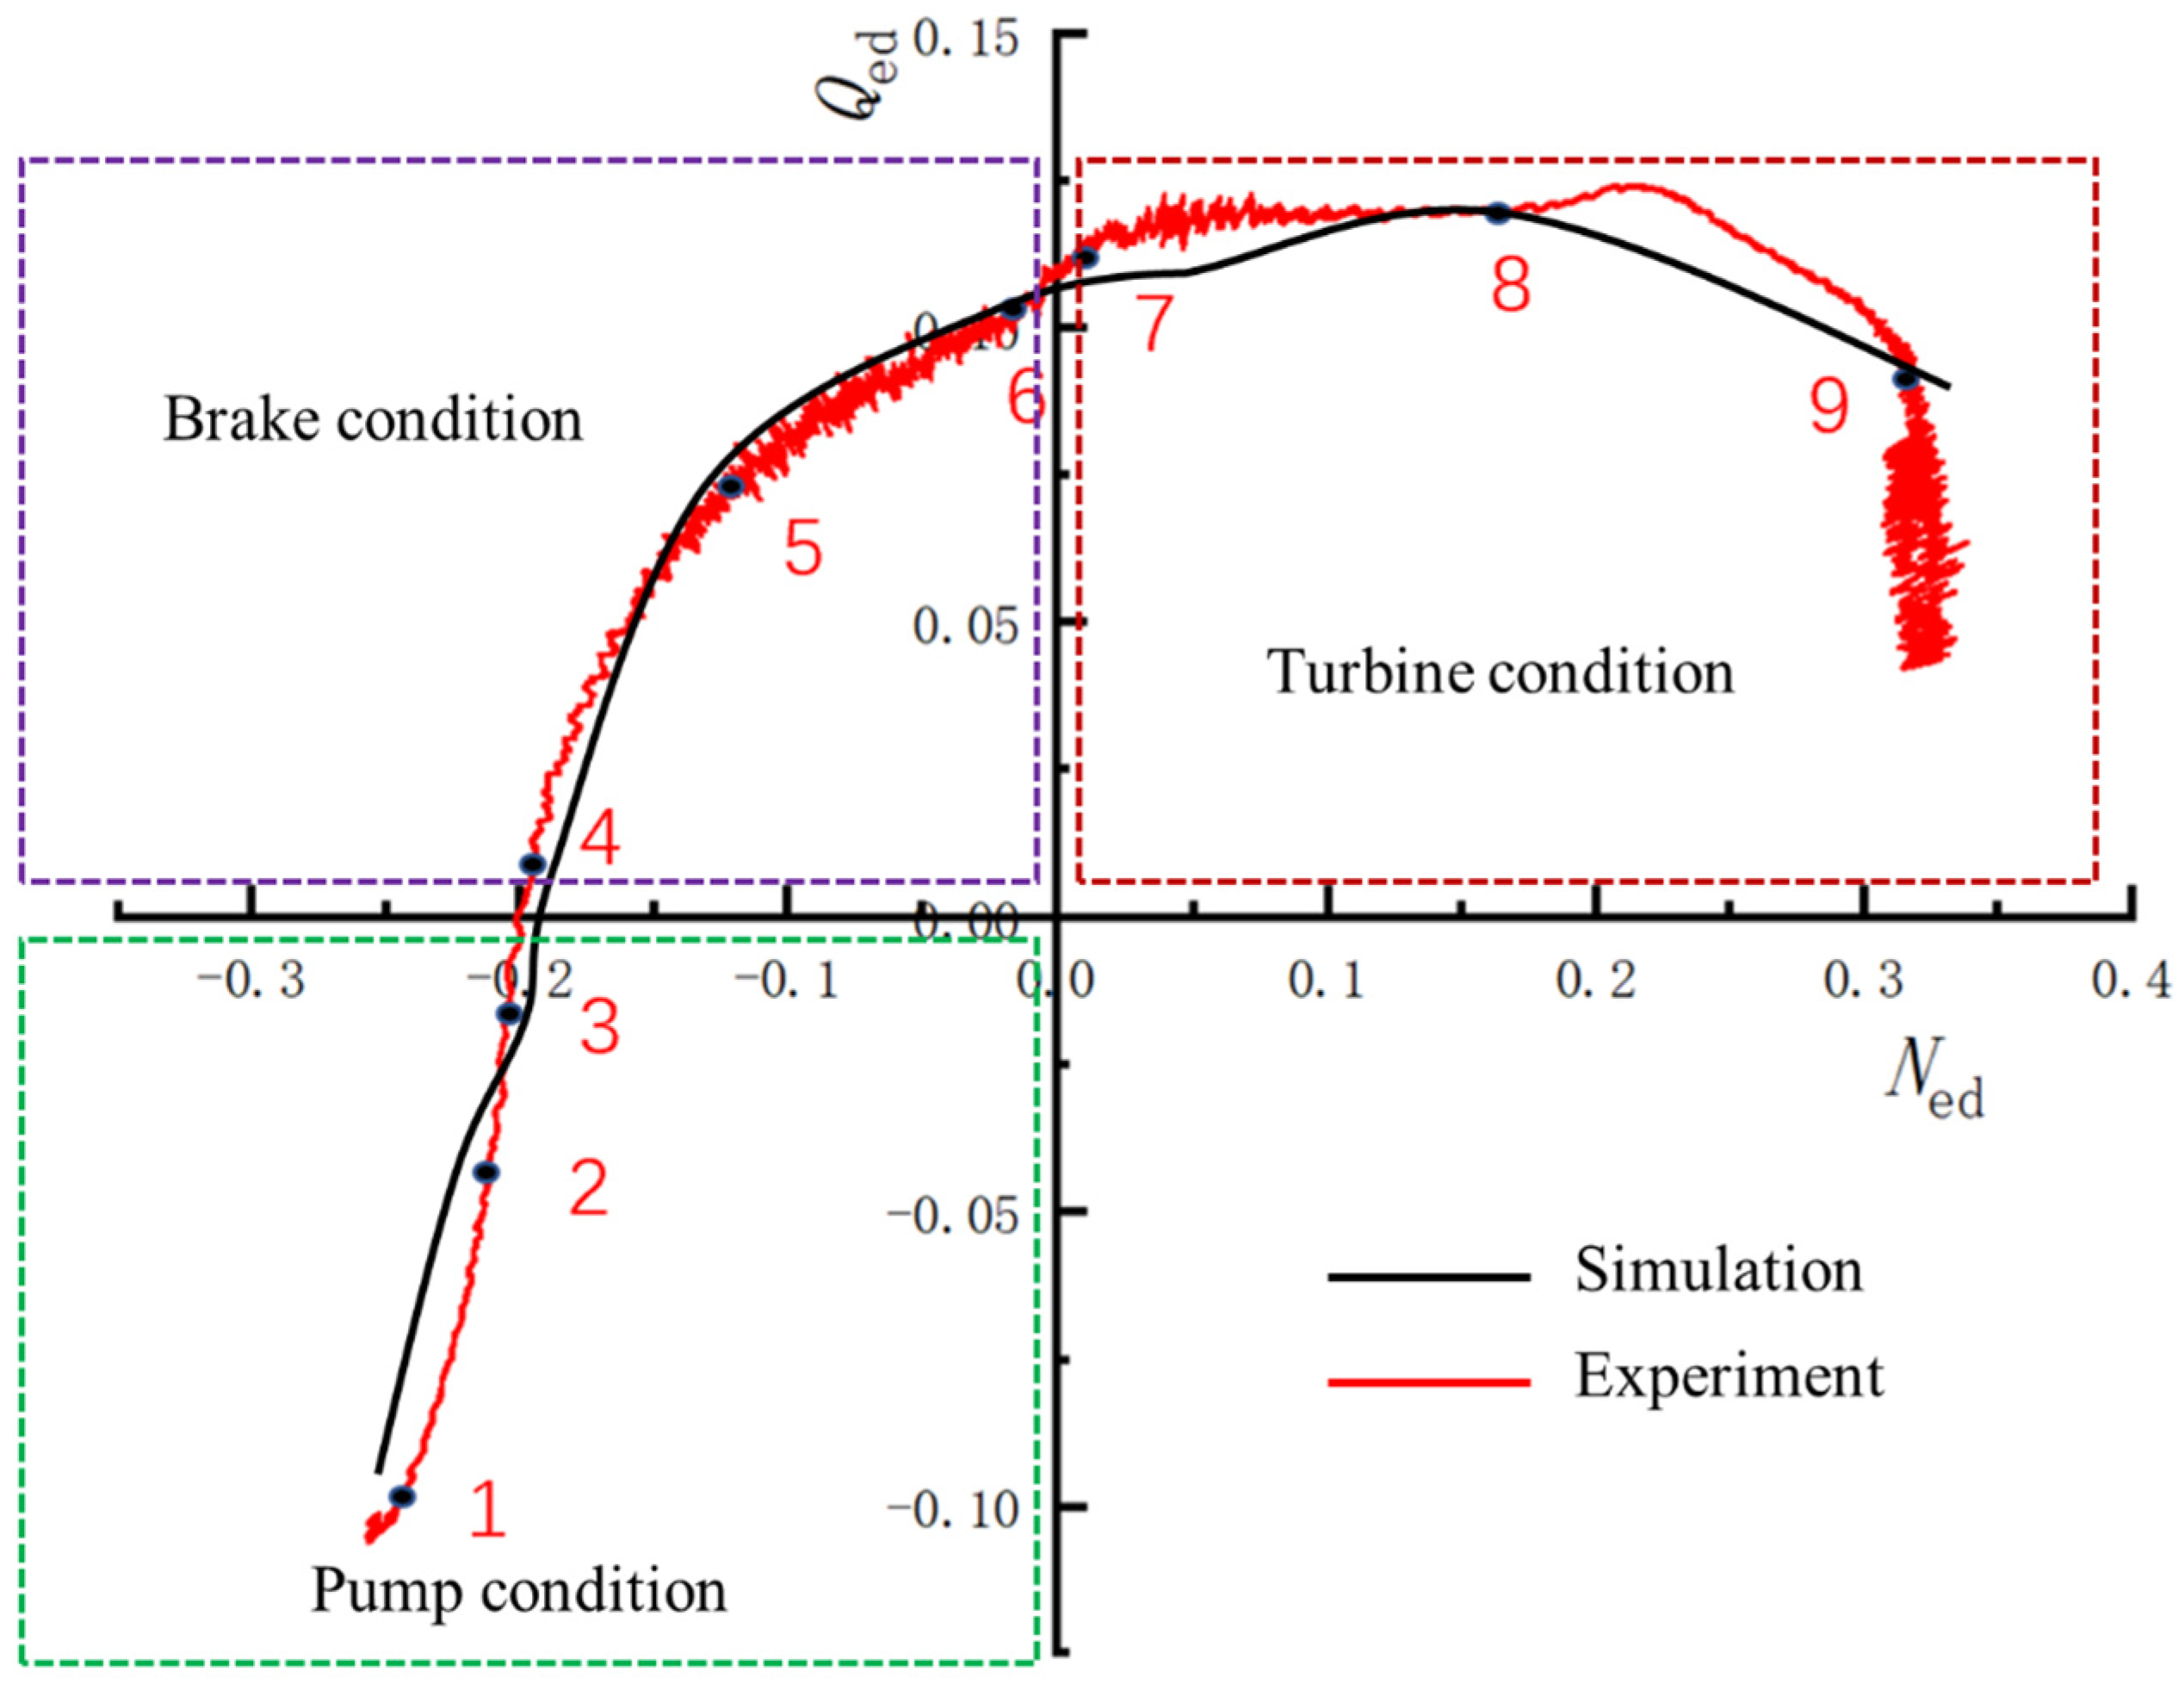
| 1 | Pump condition | 218.1 | 123.7 | −461.7 | 5% | −0.00014 |
| 2 | 193.7 | 125.5 | −355.3 | −0.00019 | ||
| 3 | 182.0 | 125.3 | −319.0 | −0.00021 | ||
| 4 | Brake condition | 181.5 | 125.3 | −315.9 | −0.00021 | |
| 5 | 184.0 | 124.6 | −211.9 | −0.00031 | ||
| 6 | 194.8 | 124.9 | −18.8 | −0.00355 | ||
| 7 | Turbine condition | 190.8 | 124.9 | 16.6 | 0.00402 | |
| 8 | 218.4 | 125.4 | 339.0 | 0.00020 | ||
| 9 | 229.3 | 126.6 | 600.2 | 0.00011 | ||
Publisher’s Note: MDPI stays neutral with regard to jurisdictional claims in published maps and institutional affiliations. |
© 2022 by the authors. Licensee MDPI, Basel, Switzerland. This article is an open access article distributed under the terms and conditions of the Creative Commons Attribution (CC BY) license (https://creativecommons.org/licenses/by/4.0/).
Share and Cite
Deng, Y.; Xu, J.; Li, Y.; Zhang, Y.; Kuang, C. Research on Energy Loss Characteristics of Pump-Turbine during Abnormal Shutdown. Processes 2022, 10, 1628. https://doi.org/10.3390/pr10081628
Deng Y, Xu J, Li Y, Zhang Y, Kuang C. Research on Energy Loss Characteristics of Pump-Turbine during Abnormal Shutdown. Processes. 2022; 10(8):1628. https://doi.org/10.3390/pr10081628
Chicago/Turabian StyleDeng, Yuxuan, Jing Xu, Yanna Li, Yanli Zhang, and Chunyan Kuang. 2022. "Research on Energy Loss Characteristics of Pump-Turbine during Abnormal Shutdown" Processes 10, no. 8: 1628. https://doi.org/10.3390/pr10081628
APA StyleDeng, Y., Xu, J., Li, Y., Zhang, Y., & Kuang, C. (2022). Research on Energy Loss Characteristics of Pump-Turbine during Abnormal Shutdown. Processes, 10(8), 1628. https://doi.org/10.3390/pr10081628