
Investigating Aluminum Tri-Hydroxide Production from Sodium Aluminate Solutions in the Pedersen Process

 and
and
Abstract
:1. Introduction
2. Materials and Methods
2.1. Materials
2.2. Methods
2.2.1. Leaching Tests
2.2.2. Desilication Tests
2.2.3. Precipitation Tests
3. Results and Discussion
3.1. Leaching
3.1.1. Leaching Behaviour of the Slag
3.1.2. Solution Concentration
3.1.3. NaOH Addition
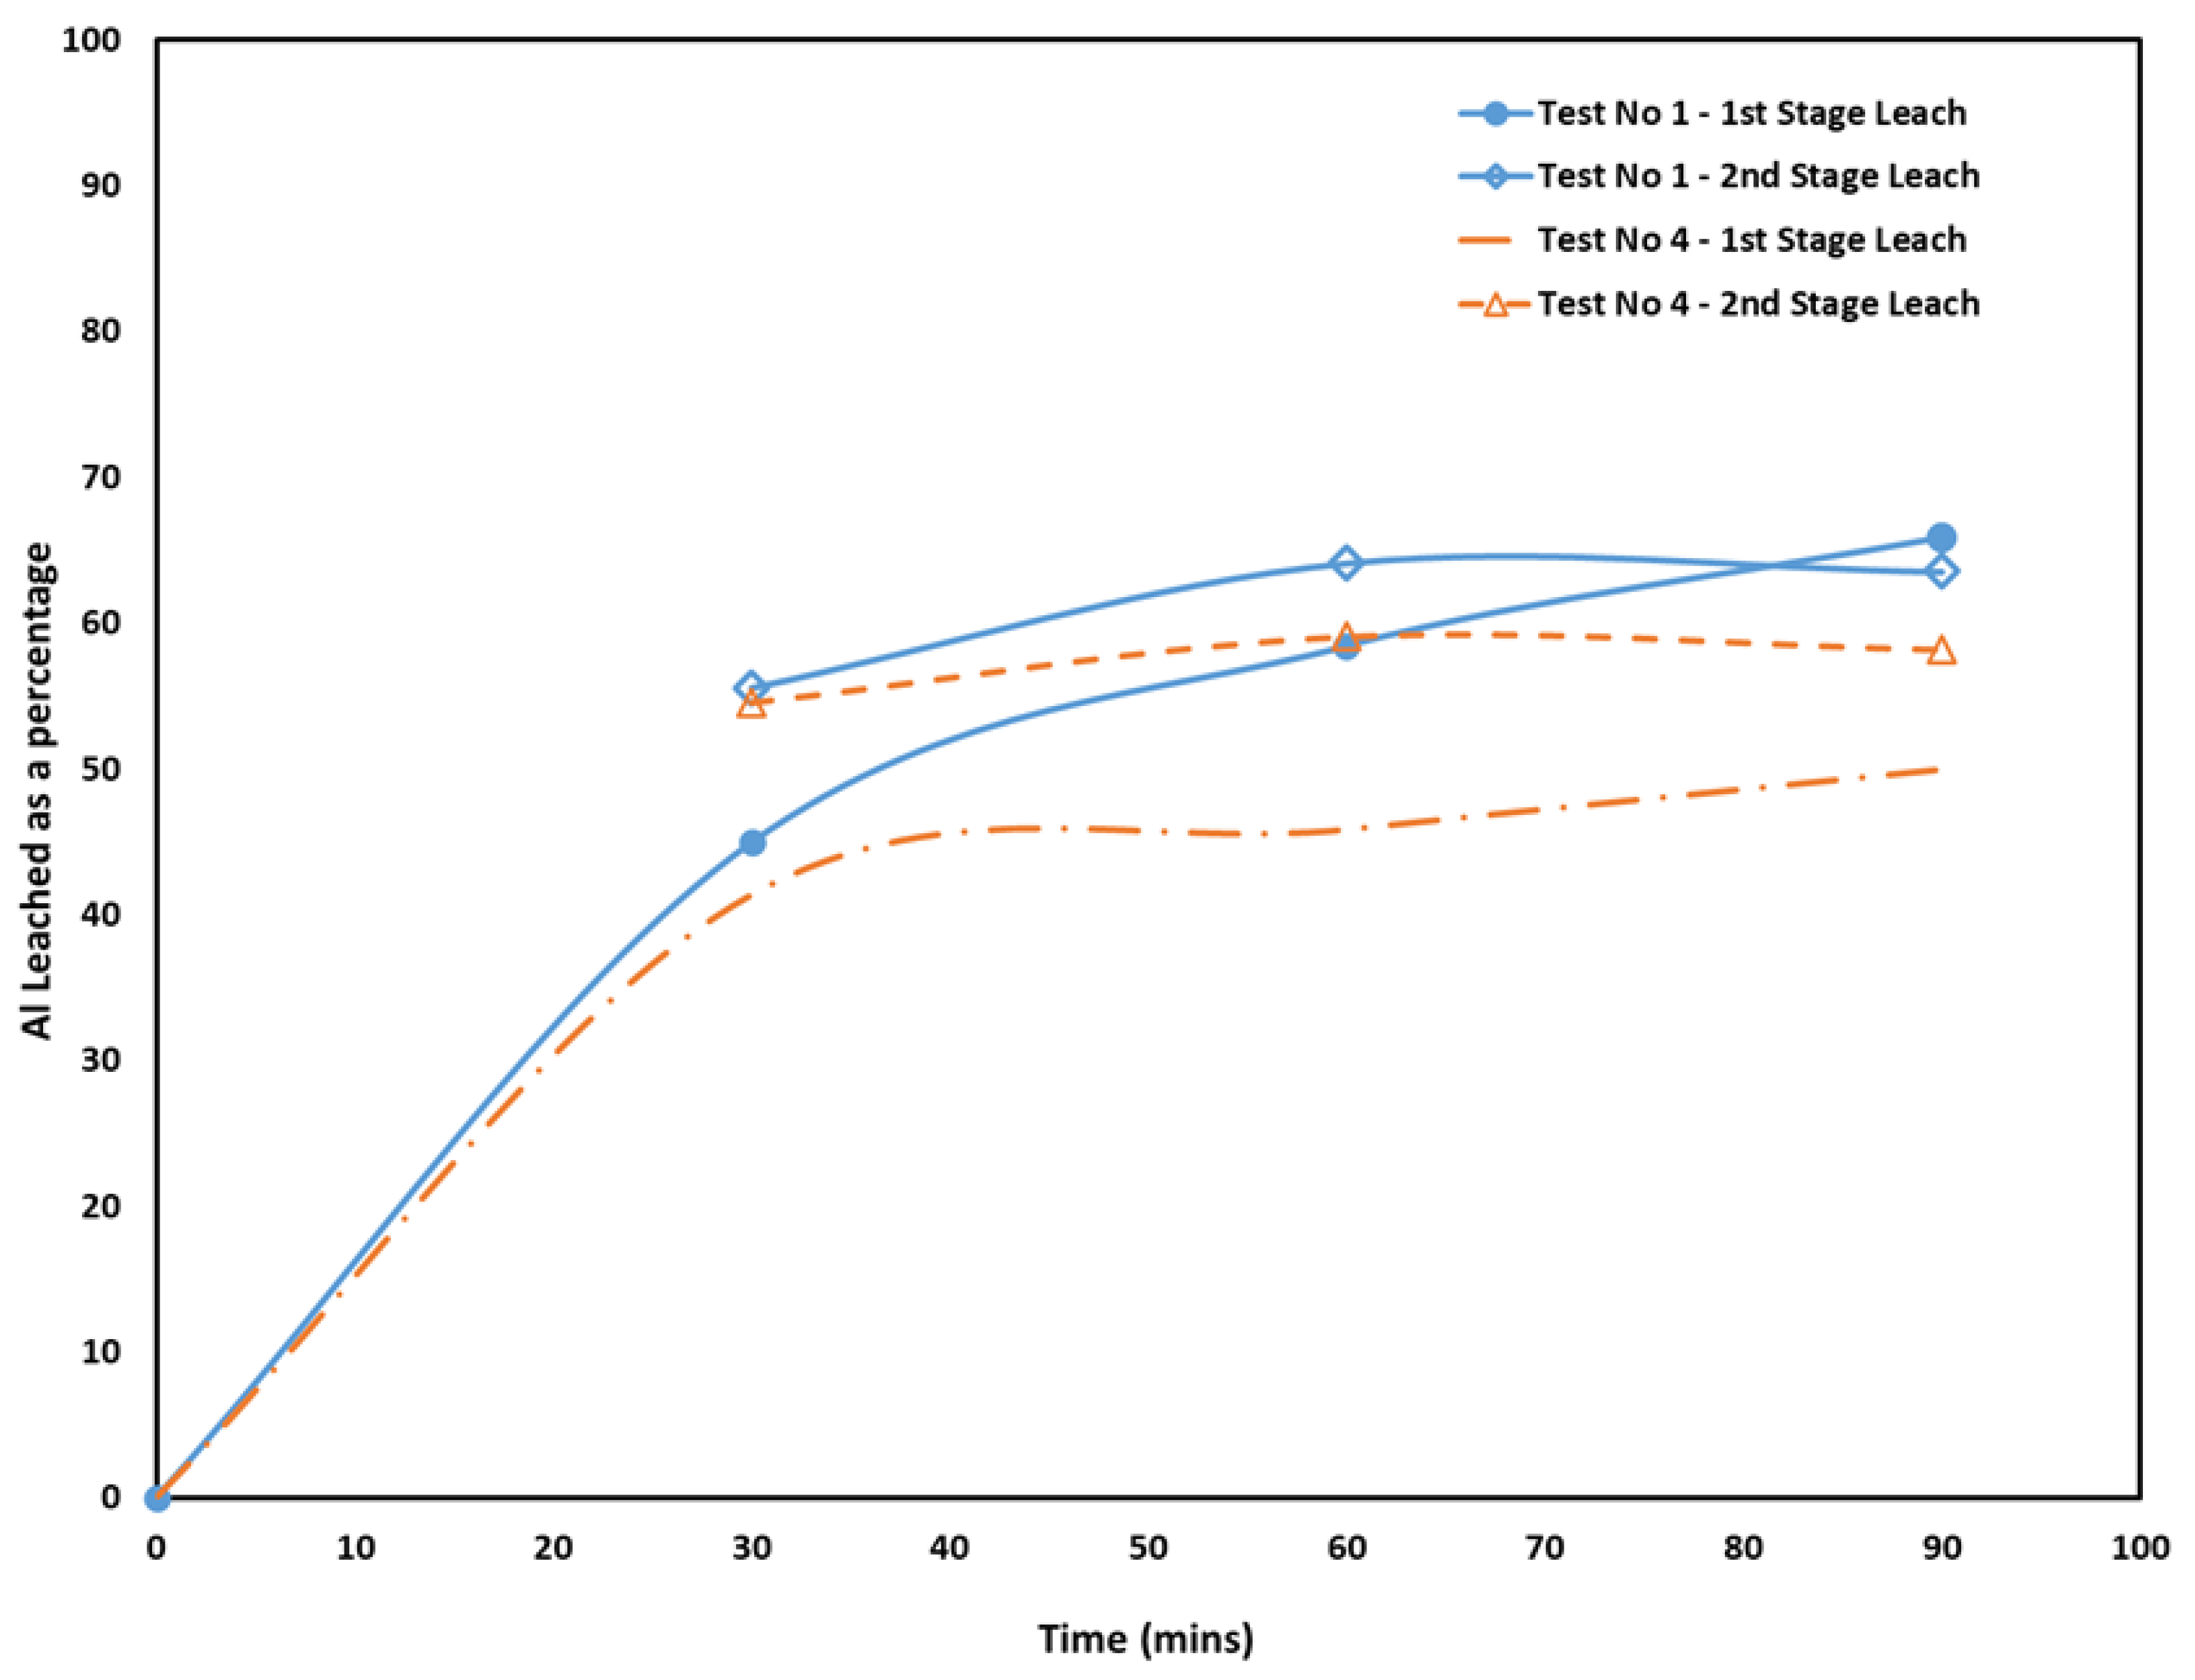
3.1.4. Leaching Duration and Solution Concentration
3.1.5. Grey Mud Analysis
3.2. Desilication
3.3. Precipitation of Aluminum Tri-Hydroxide
4. Conclusions
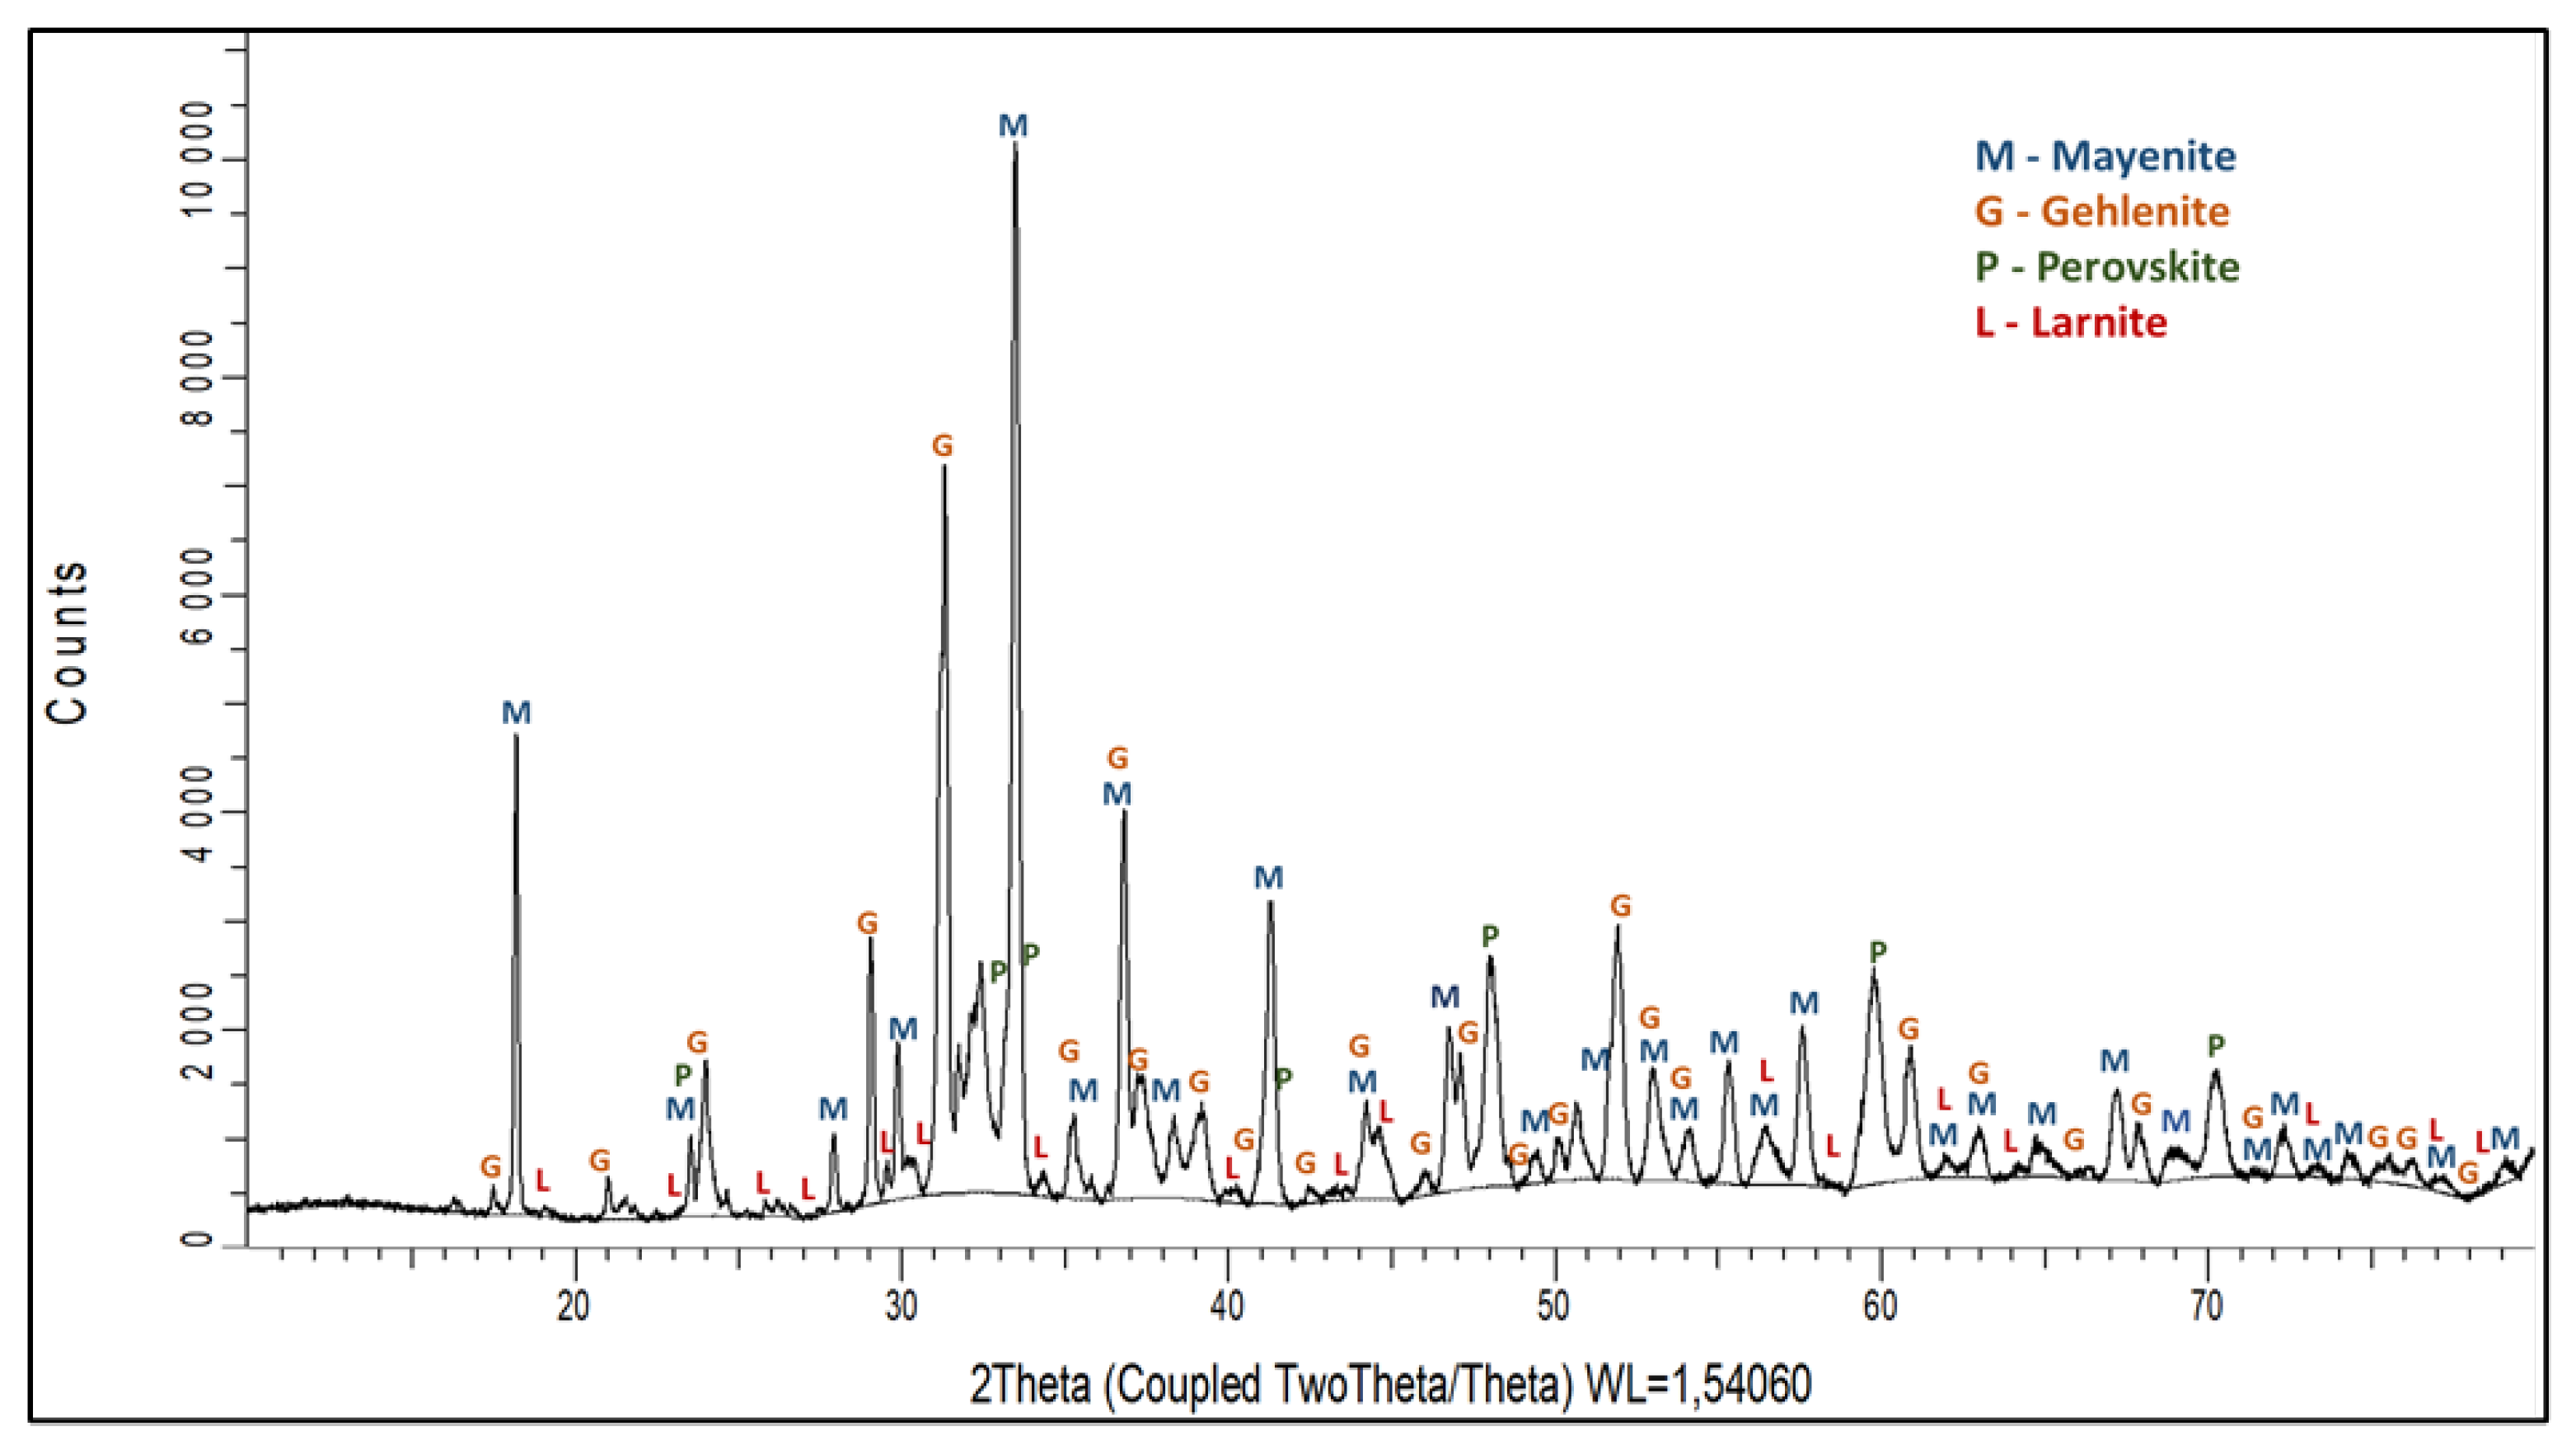
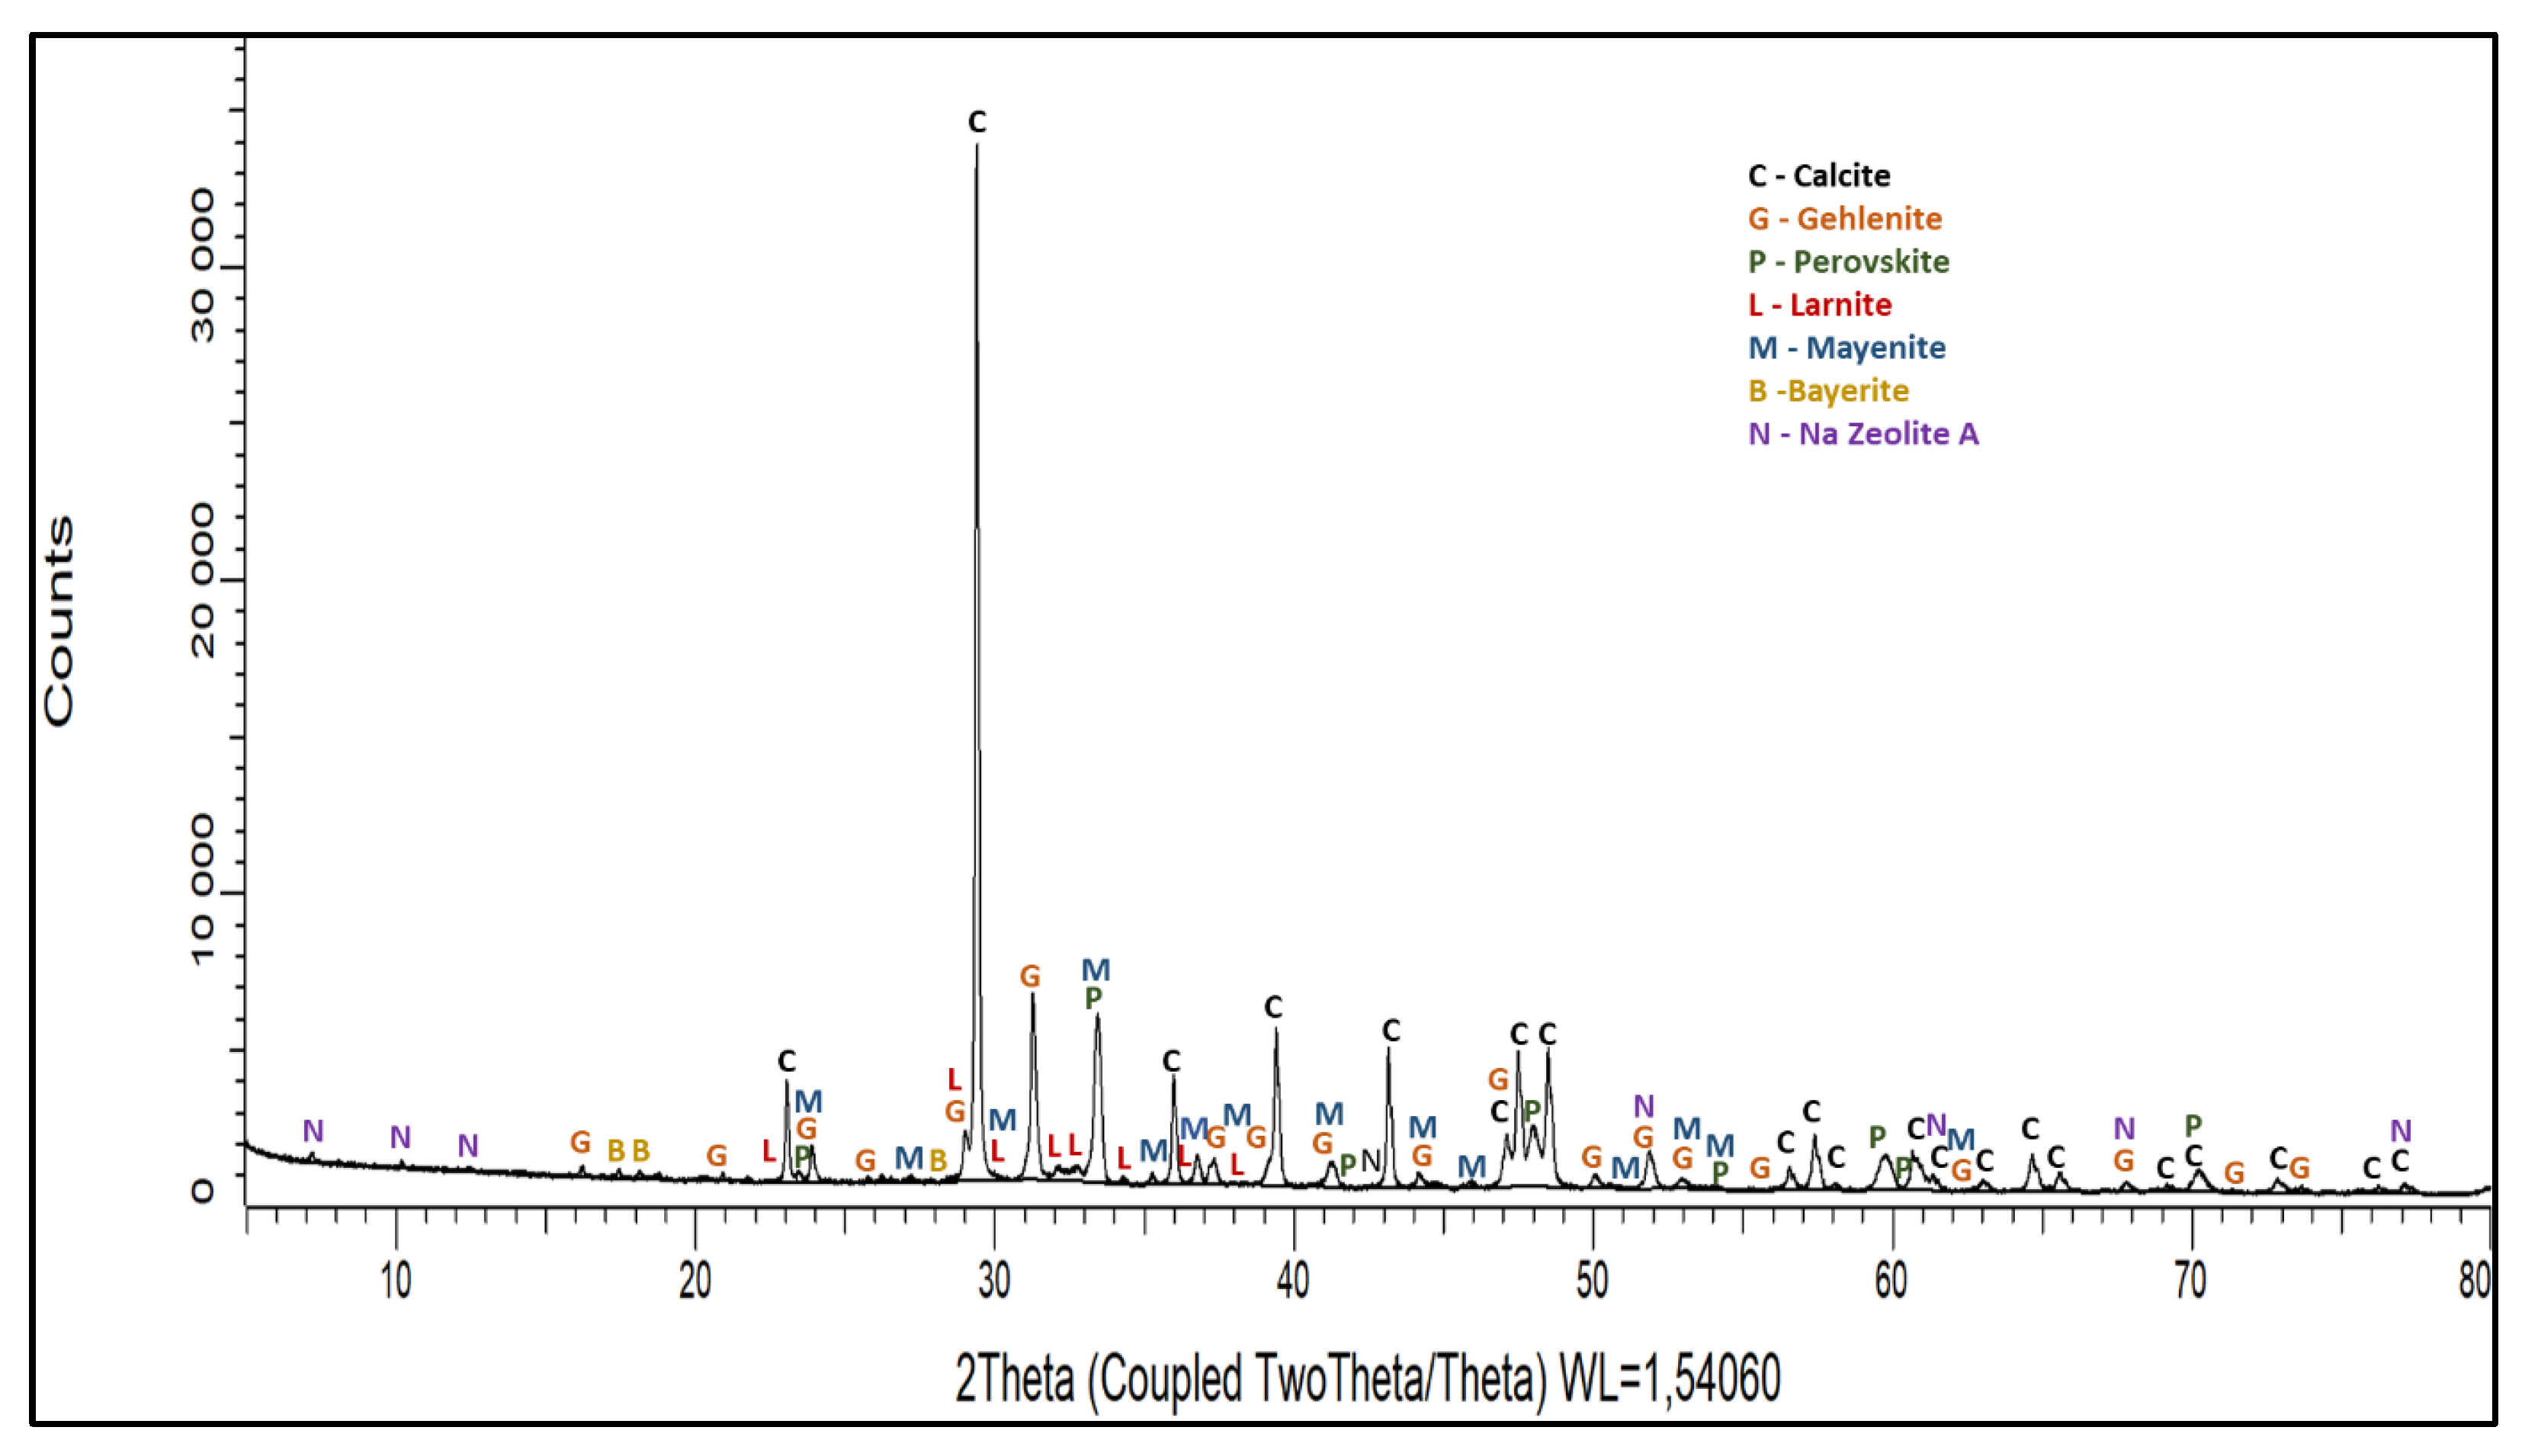
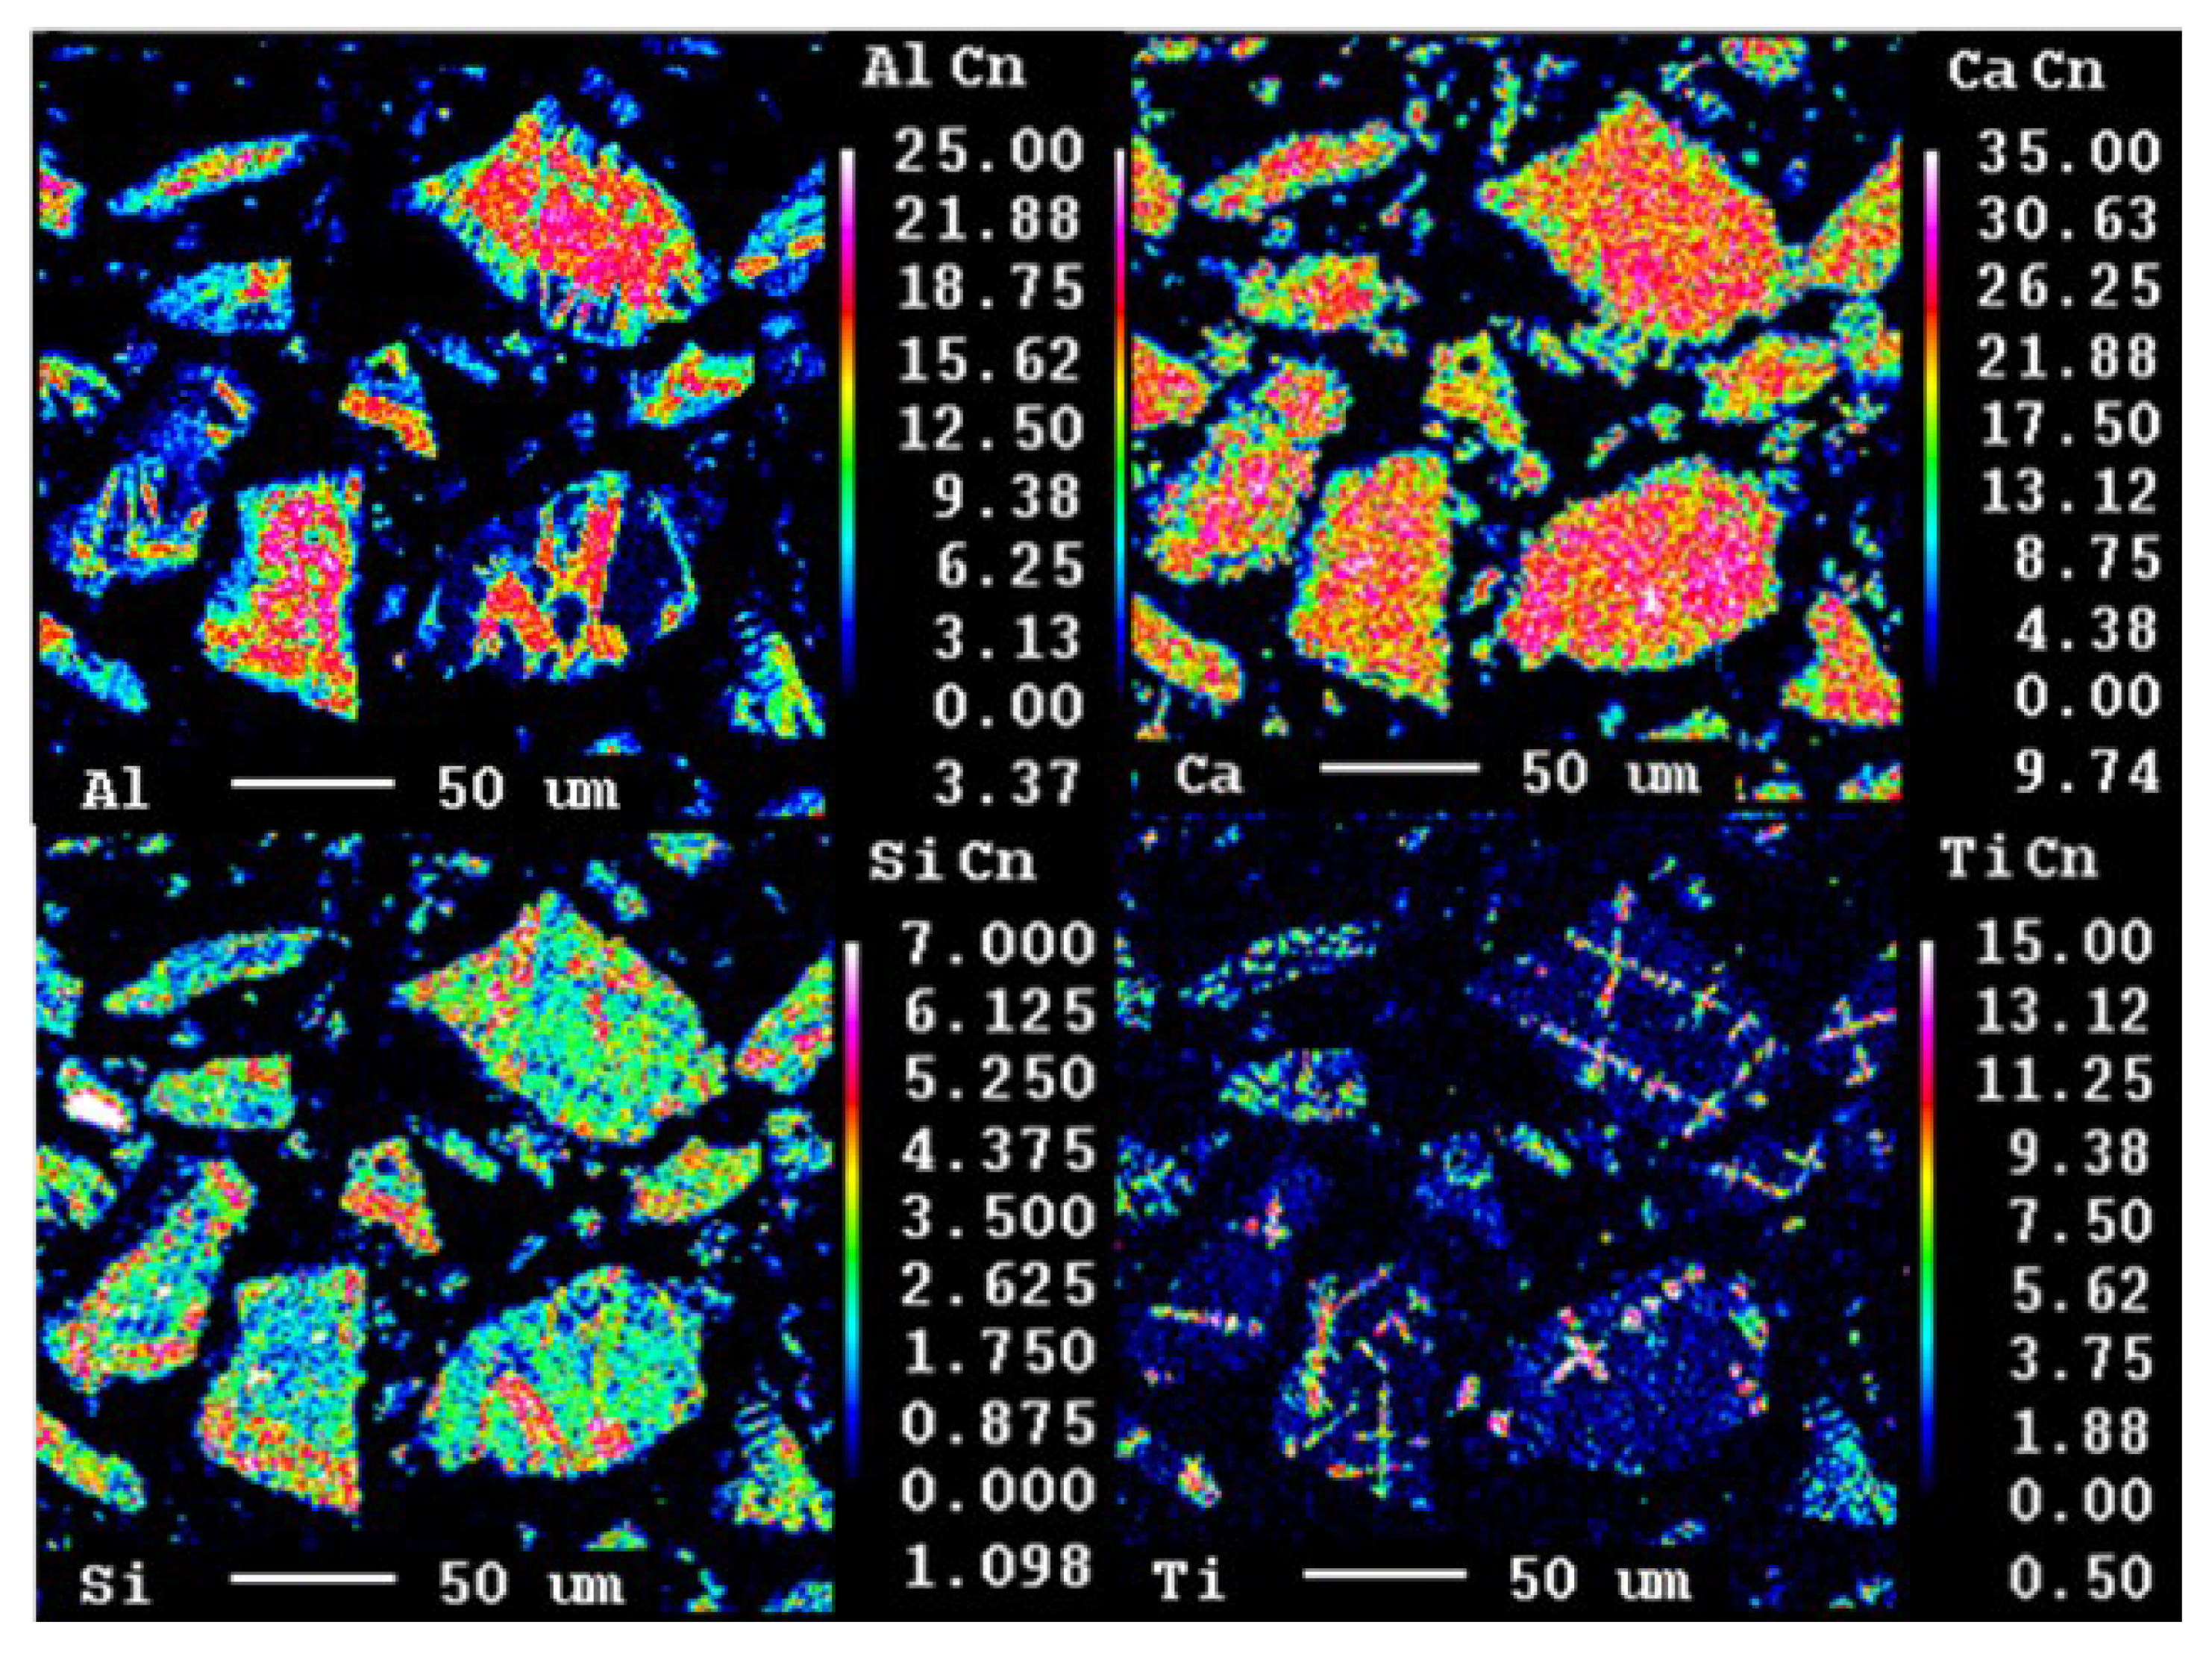
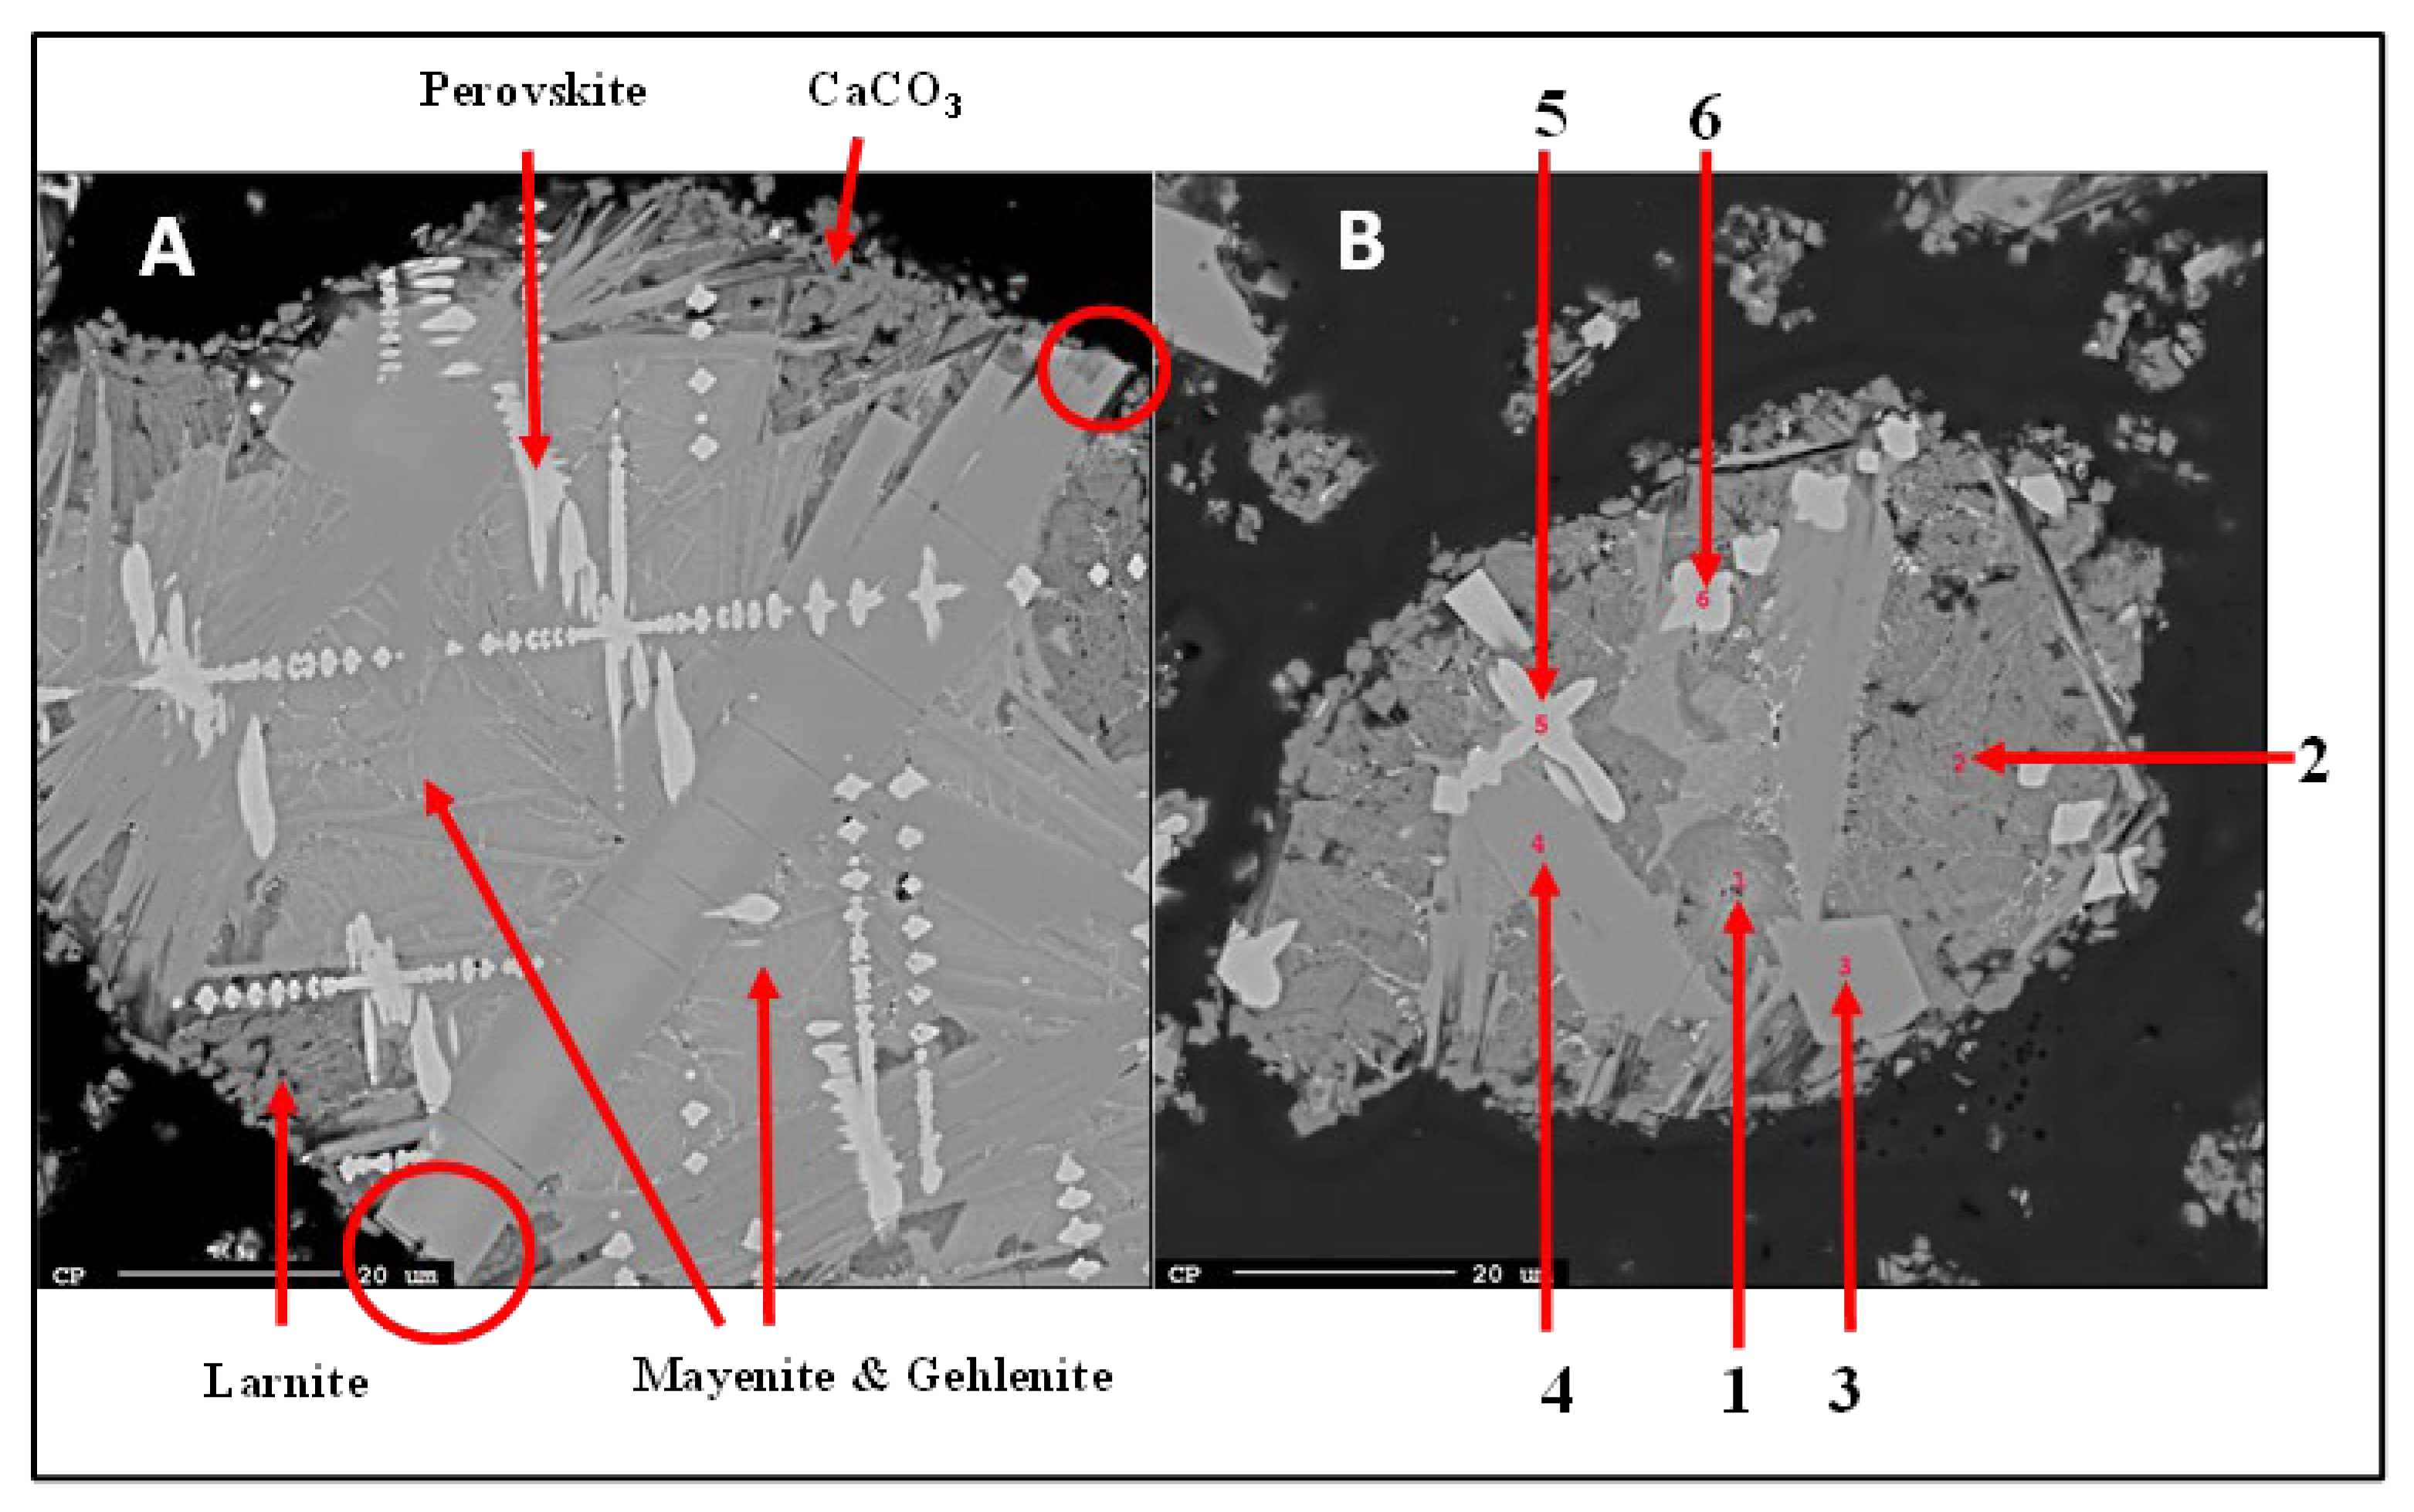
- Al occurred in the form of mayenite and gehlenite in the slag produced from bauxite residue. Moreover, in the leaching step, mayenite was almost completely leached.
- Although leaching resulted in Al extractions, no higher than 68% regardless of the slag mineralogy, it must be noted that this may not be a prohibiting factor when processing secondary and waste materials.
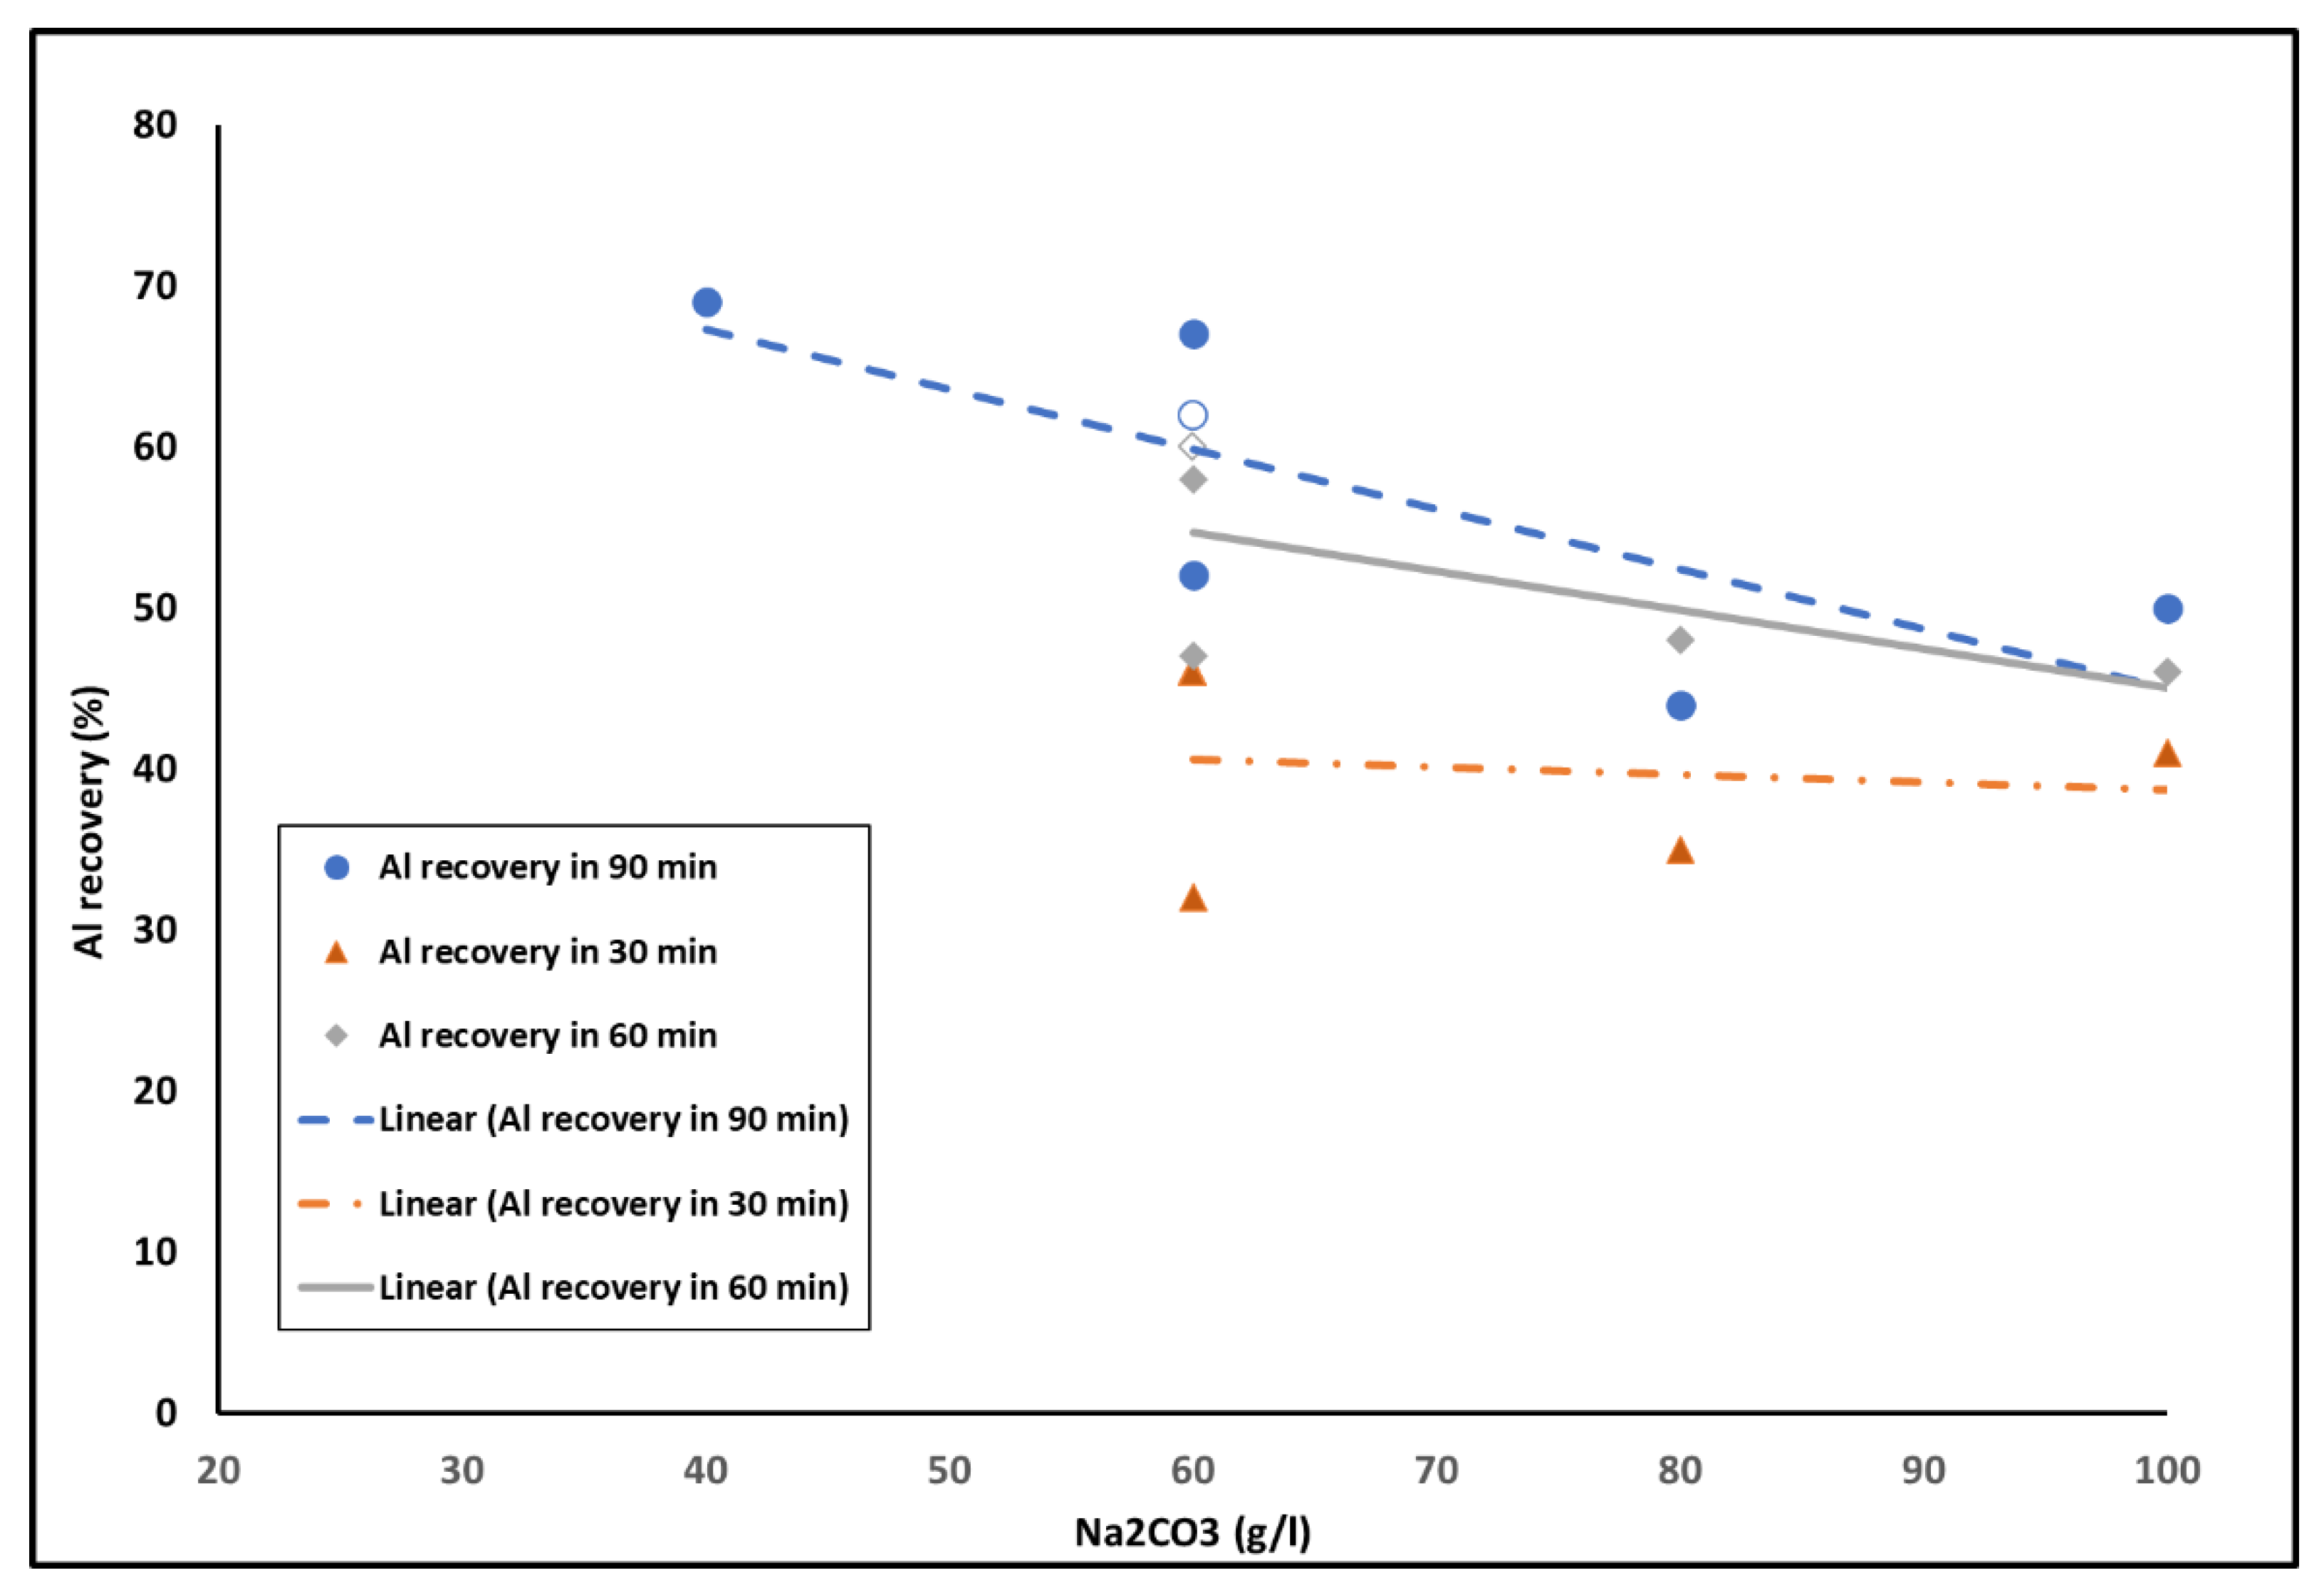
- The benefit of an intermediate mechanical step before re-leaching the material was minimal, while a solution concentration of 60 g/L of Na2CO3 appears to be ideal. Higher concentrations appear to cause passivation to occur faster.
- Desilication with CaO resulted in up to 88% of silica being removed with higher CaO additions. A mechanism for the desilication by CaO was proposed in which hydrogarnite is formed and deposited.
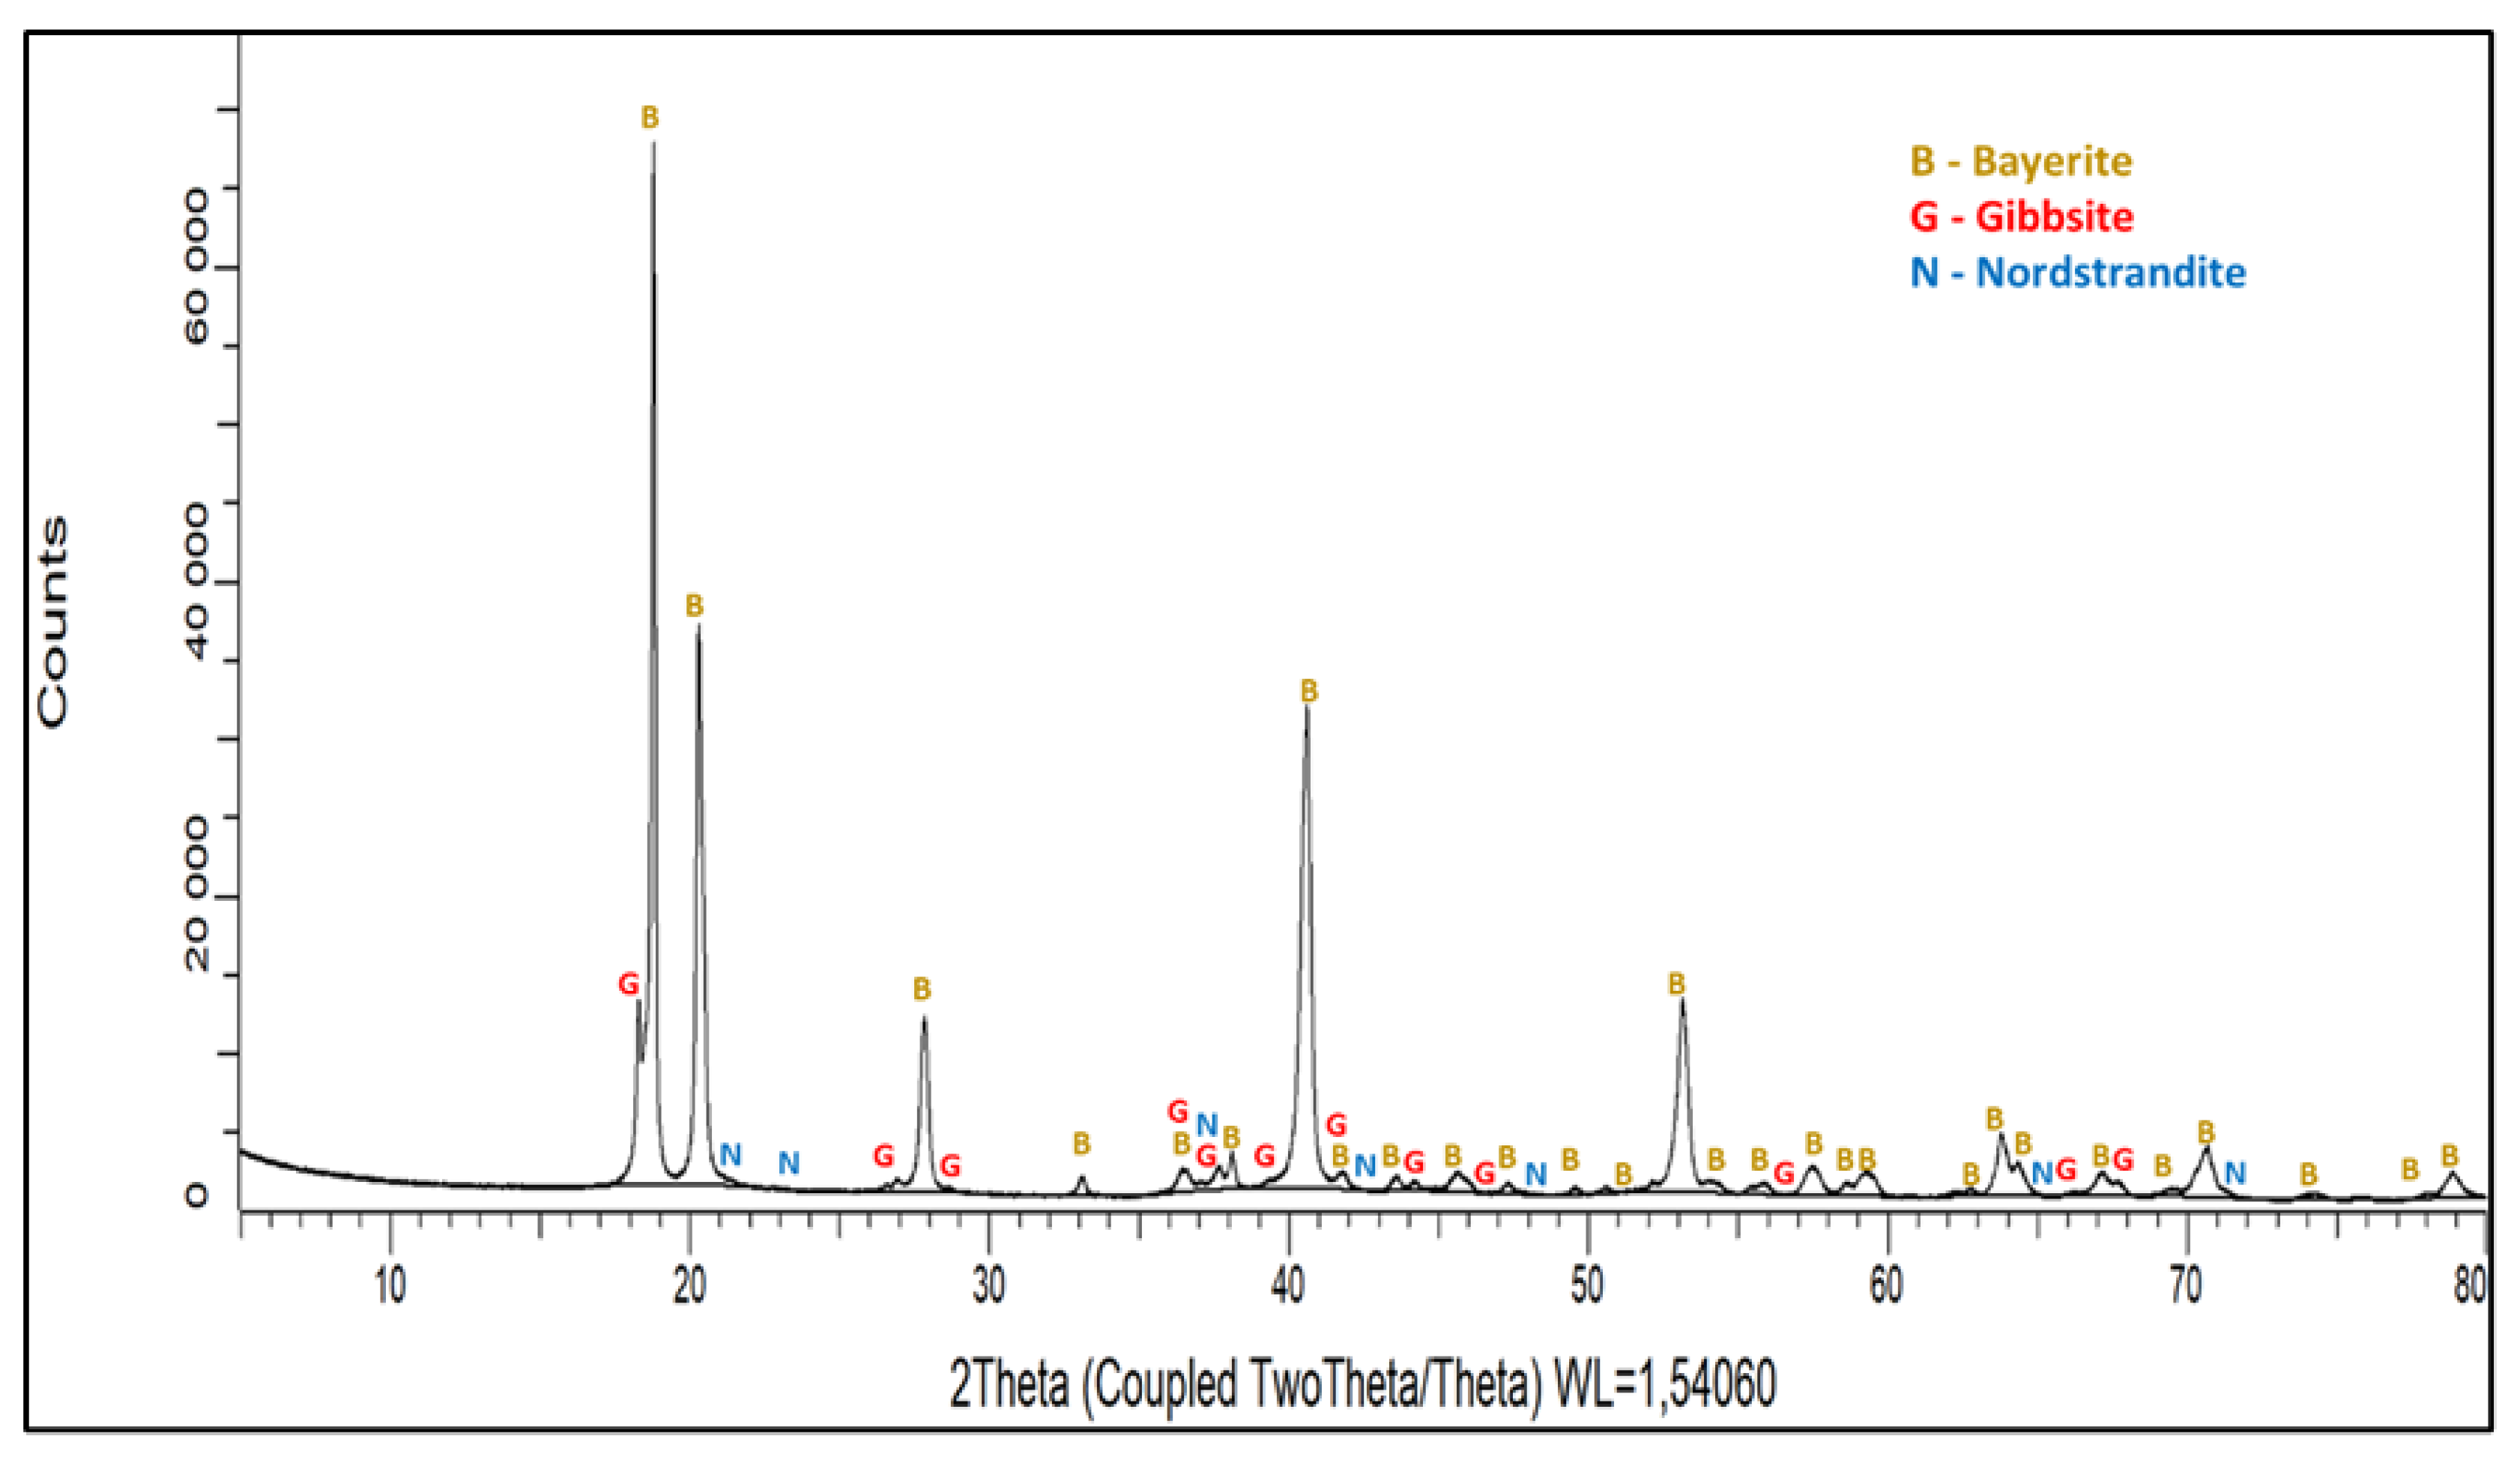
- The precipitation process was the most successful among the three processes, producing a product with the desired Al tri-hydroxides. The tests have shown that this is achieved by a combination of carbonation and aging done at temperatures lower than 30 °C on a leach solution with no more than 60 g/L Na2CO3 concentration.
Author Contributions
Funding
Institutional Review Board Statement
Informed Consent Statement
Data Availability Statement
Conflicts of Interest
References
- Pan, S.; Wang, T.; Jin, K.; Cai, X. Understanding and designing metal matrix nanocomposites with high electrical conductivity: A review. J. Mater. Sci. 2022, 57, 6487–6523. [Google Scholar] [CrossRef]
- Zinoveev, D.; Grudinsky, P.; Zhiltsova, E.; Grigoreva, D.; Volkov, A.; Dyubanov, V.; Petelin, A. Research on High-Pressure Hydrochloric Acid Leaching of Scandium, Aluminum and Other Valuable Components from the Non-Magnetic Tailings Obtained from Red Mud after Iron Removal. Metals 2021, 11, 469. [Google Scholar] [CrossRef]
- Miller, J.; Irgens, A. Alumina Production by the Pedersen Process—History and Future. In Essential Readings in Light Metals; Donaldson, D., Raahauge, B.E., Eds.; Springer: Cham, Swizerland, 1974; pp. 977–982. [Google Scholar]
- Nielsen, K. The Pedersen Process—An Old Process in a New Light. Erzmetall 1978, 31, 523–525. [Google Scholar]
- Pedersen, H. Process of Manufacturing Aluminium Hydroxide. U.S. Patent 1,618,105, 15 February 1927. [Google Scholar]
- Hudson, L.K.; Misra, C.; Perrotta, A.J.; Wefers, K.; Williams, F.S. Aluminum Oxide. In Ullmann’s Encyclopedia of Industrial Chemistry; Wiley-VCH Verlag GmbH & Co., KGaA: Weinheim, Germany, 2000. [Google Scholar] [CrossRef]
- Safarian, J.; Kolbeinsen, L. Smelting-reduction of bauxite for sustainable alumina production. Sustain. Ind. Processing Summit Exhib. 2016, 5, 149–158. [Google Scholar]
- Vafeias, M.; Marinos, D.; Balomenos, E.; Panias, D.; Safarian, J.; Van der Eijk, C.; Solheim, I.; Ksiazek, M.; Davris, P. From Red to Grey: Revisiting the Pedersen Process to Achieve Holistic Bauxite Ore Utilization. In Proceedings of the 2nd International Bauxite Residue Valorisation and Best Practices Conference, Athens, Greece, 7–10 May 2018. [Google Scholar]
- Blake, H.E.; Fursman, O.C.; Fugate, A.D.; Banning, L.H. Adaptation of the Pedersen Process to the Ferruginous Bauxites of the Pacific Northwest; Report of Investigations 6939; United States Department of Interior, Bureau of Mines: Albany, OR, USA, 1966.
- Azof, F.I.; Yang, Y.; Panias, D.; Kolbeinsen, L.; Safarian, J. Leaching characteristics and mechanism of the synthetic calcium-aluminate slags for alumina recovery. Hydrometallurgy 2019, 185, 273–290. [Google Scholar] [CrossRef]
- Moolenaar, R.J.; Evans, J.C.; McKeever, L.D. The structure of the aluminate ion in solutions at high pH. J. Phys. Chem. 1970, 74, 3629–3636. [Google Scholar] [CrossRef]
- Czajkowski, A.; Noworyta, A.; Krótki, M. Studies and modelling of the process of decomposition of aluminate solutions by carbonation. Hydrometallurgy 1981, 7, 253–261. [Google Scholar] [CrossRef]
- Panias, D.; Asimidis, P.; Paspaliaris, I. Solubility of boehmite in concentrated sodium hydroxide solutions: Model development and assessment. Hydrometallurgy 2001, 59, 15–29. [Google Scholar] [CrossRef]
- Wang, Z.; Bi, S.; Yang, Y.; Yuan, Z. Evolution of particle size and strength of hydrargillite from carbonization in seeded sodium aluminate liquors. J. Cryst. Growth 2005, 274, 218–225. [Google Scholar] [CrossRef]
- Shayanfar, S.; Aghazadeh, V.; Saravari, A.; Hasanpour, P. Aluminium hydroxide crystallization from aluminate solution using carbon dioxide gas: Effect of temperature and time. J. Cryst. Growth 2018, 496–497, 1–9. [Google Scholar] [CrossRef]
- Chan, V.A.; Ang, H.M. A laboratory continuous crystallization system for aluminium hydroxide precipitation studies. J. Cryst. Growth 1996, 166, 1009–1014. [Google Scholar] [CrossRef]
- Zhou, Q.; Peng, D.; Peng, Z.; Liu, G.; Li, X. Agglomeration of gibbsite particles from carbonation process of sodium aluminate solution. Hydrometallurgy 2009, 99, 163–199. [Google Scholar] [CrossRef]
- Perander, L. Options for Significant CO2 Emissions Reduction in Alumina Refining; Internal Presentation; Outotec: Sandefjord, Norway, 2020. [Google Scholar]
- Hollum, A.M.; James, W.A.; Semple, W.A. Process for Producing Alumina from Slags or Sinters Prepared from Lime and Alumina-Bearing Materials. U.S. Patent 2,544,231, 6 March 1951. [Google Scholar]
- Fursman, O.C.; Blake, H.E.; Mauser, J.E. Recovery of Alumina and Iron from Pacific Northwest Bauxites by the Pedersen Process; Report of Investigations 7079; United States Department of Interior, Bureau of Mines: Albany, OR, USA, 1966.
- Azof, F.I.; Vafeias, M.; Panias, D.; Safarian, J. The leachability of a ternary CaO-Al2O3-SiO2 slag produced from smelting-reduction of a low-grade bauxite for alumina recovery. Hydrometallurgy 2020, 191, 105184. [Google Scholar] [CrossRef]
- Nedkvitine, E. Leaching and Precipitation Experiments Related to the Pedersen Process. Master’s Thesis, Department of Materials Science and Engineering, Norwegian University of Science and Technology, Oslo, Norway, 2019. [Google Scholar]
- Marinos, D.; Vafeias, M.; Balomenos, E.; Panias, D. Parameters Affecting the Precipitation of Al-Phases from Aluminate Solutions of the Pedersen Process: The Effect of Carbonate Content. J. Sustain. Metall. 2021, 7, 874–882. [Google Scholar] [CrossRef]
- Marinos, D.; Kotsanis, D.; Alexandri, A.; Balomenos, E.; Panias, D. Carbonation of sodium aluminate/sodium carbonate solutions for precipitation of alumina hydrates-avoiding dawsonite formation. Crystals 2021, 11, 836. [Google Scholar] [CrossRef]
- Kelly, L.; Mason, C.M.; Hatfield, J.D. Mechanism of the Precipitation of Alumina from Sodium Aluminate Solutions. 1945. Available online: https://pubs.acs.org/doi/10.1021/ja01225a010 (accessed on 6 October 2021).
- Lazou, A.; Van Der Eijk, C.; Tang, K.; Balomenos, E.; Kolbeinsen, L.; Safarian, J. The Utilization of bauxite residue with a calcite-rich bauxite ore in the Pedersen Process for iron and alumina extraction. Metall. Mater. Trans. 2021, B52, 1255–1266. [Google Scholar] [CrossRef]
- Scrivener, K.L.; Capmas, A. Chapter 13—Calcium Aluminate Cements. In LEA’s Chemistry of Cement and Concrete, 4th ed.; Elsevier: Amsterdam, The Netherlands, 1998; pp. 713–782. [Google Scholar] [CrossRef]
- Yan, Z. Major Leaching Processes of Combustion Residues: Characterization, Modelling and Experimental Investigation. Ph.D. Thesis, Royal Institute of Technology Stockholm, Stockholm, Sweden, 1998. Available online: http://www.diva-portal.org/smash/get/diva2:8412/FULLTEXT01.pdf (accessed on 11 January 2021).
- Li, X.; Yu, W.; Zhao, B. Effect of sintering temperature of potassium feldspar-limestone/dolomite on composition and microstructure of silicate fertilizers. Int. J. Ceram. Eng. Sci. 2019, 1, 185–193. [Google Scholar] [CrossRef] [Green Version]
- Azof, F.I.; Tang, T.; You, J.; Safarian, J. Synthesis and characterization of 12CaO.7Al2O3 Slags: The effects of impurities and atmospheres on the phase relations. Metall. Mater. Trans. B 2020, 51, 2689–2710. [Google Scholar] [CrossRef]
- Vafeias, M.; Bempelou, A.; Georgala, E.; Davris, P.; Balomenos, E.; Panias, D. Leaching of Ca-Rich Slags Produced from Reductive Smelting of Bauxite Residue with Na2CO3 Solutions for Alumina Extraction: Lab and Pilot Scale Experiments. Minerals 2021, 11, 896. [Google Scholar] [CrossRef]
- Azof, F.I. Pyrometallurgical and Hydrometallurgical Treatment of Calcium Aluminate-Containing Slags for Alumina Recovery. Ph.D. Thesis, Norwegian University of Science and Technology, Oslo, Norway, 2020. [Google Scholar]
- Whittington, B.I.; Fletcher, B.L.; Talbot, C. The effect of reaction conditions on the composition of desilication product (DSP) formed under simulated Bayer conditions. Hydrometallurgy 1998, 49, 1–22. [Google Scholar] [CrossRef]
- Nikolaychuk, P.A. The revised pourbaix diagram for silicon. Silicon 2014, 6, 109–116. [Google Scholar] [CrossRef]
- Dilnesa, B.Z.; Lothenbach, B.; Renaudin, G.; Wichser, A.; Kulik, D. Synthesis and characterization of hydrogarnet. Cem. Concr. Res. 2014, 59, 96–111. [Google Scholar] [CrossRef]
- Roach, G.I.D. The Equilibrium Approach to Causticisation for Optimising Liquor Causticisity. In Essential Readings in Light Metals: Volume 1 Alumina and Bauxite; Donaldson, D., Raahauge, B.E., Eds.; Springer International Publishing: Cham, Switzerland, 2016; pp. 228–234. [Google Scholar]
- Yuan, J.; Zhang, Y. Desiliconization reaction in sodium aluminate solution by adding tricalcium hydroaluminate. Hydrometallurgy 2009, 95, 166–169. [Google Scholar] [CrossRef]
- Rosenberg, S.P.; Wilson, D.J.; Heath, C.A. Some Aspects of Calcium Chemistry in the Bayer Process. In Essential Readings in Light Metals: Volume 1 Alumina and Bauxite; Donaldson, D., Raahauge, B.E., Eds.; Springer International Publishing: Cham, Switzerland, 2016; pp. 210–216. [Google Scholar]


| Elements | Bauxite Residue | By-Product | Elements | Bauxite Residue | By-Product |
|---|---|---|---|---|---|
| Al2O3 | 22.78 | 25.33 | Na2O | 1.93 | - |
| CaO | 8.44 | 34.49 | MnO | 0.10 | - |
| TiO2 | 5.88 | 1.24 | Cr2O3 | 0.26 | 0.01 |
| SiO2 | 6.35 | 1.11 | P2O5 | 0.19 | - |
| Fe2O3 | 43.59 | 5.61 | NiO | 0.07 | - |
| MgO | 0.56 | - | S | 0.15 | 0.01 |
| V2O5 | 0.30 | - | LoI | 9.30 | 32.20 |
| Al2O3 | CaO | SiO2 | TiO2 | Fe | Na2O | SO3 | MgO | ZrO2 | MnO | SrO | Cr2O3 | P2O5 |
|---|---|---|---|---|---|---|---|---|---|---|---|---|
| 39.6 | 43.9 | 6.99 | 5.84 | 1.82 | 1.19 | 0.18 | 0.17 | 0.14 | 0.06 | 0.06 | 0.03 | <0.05 |
| No. | Al2O3 | CaO | SiO2 | TiO2 | Al/Ca | Proposed Phase |
|---|---|---|---|---|---|---|
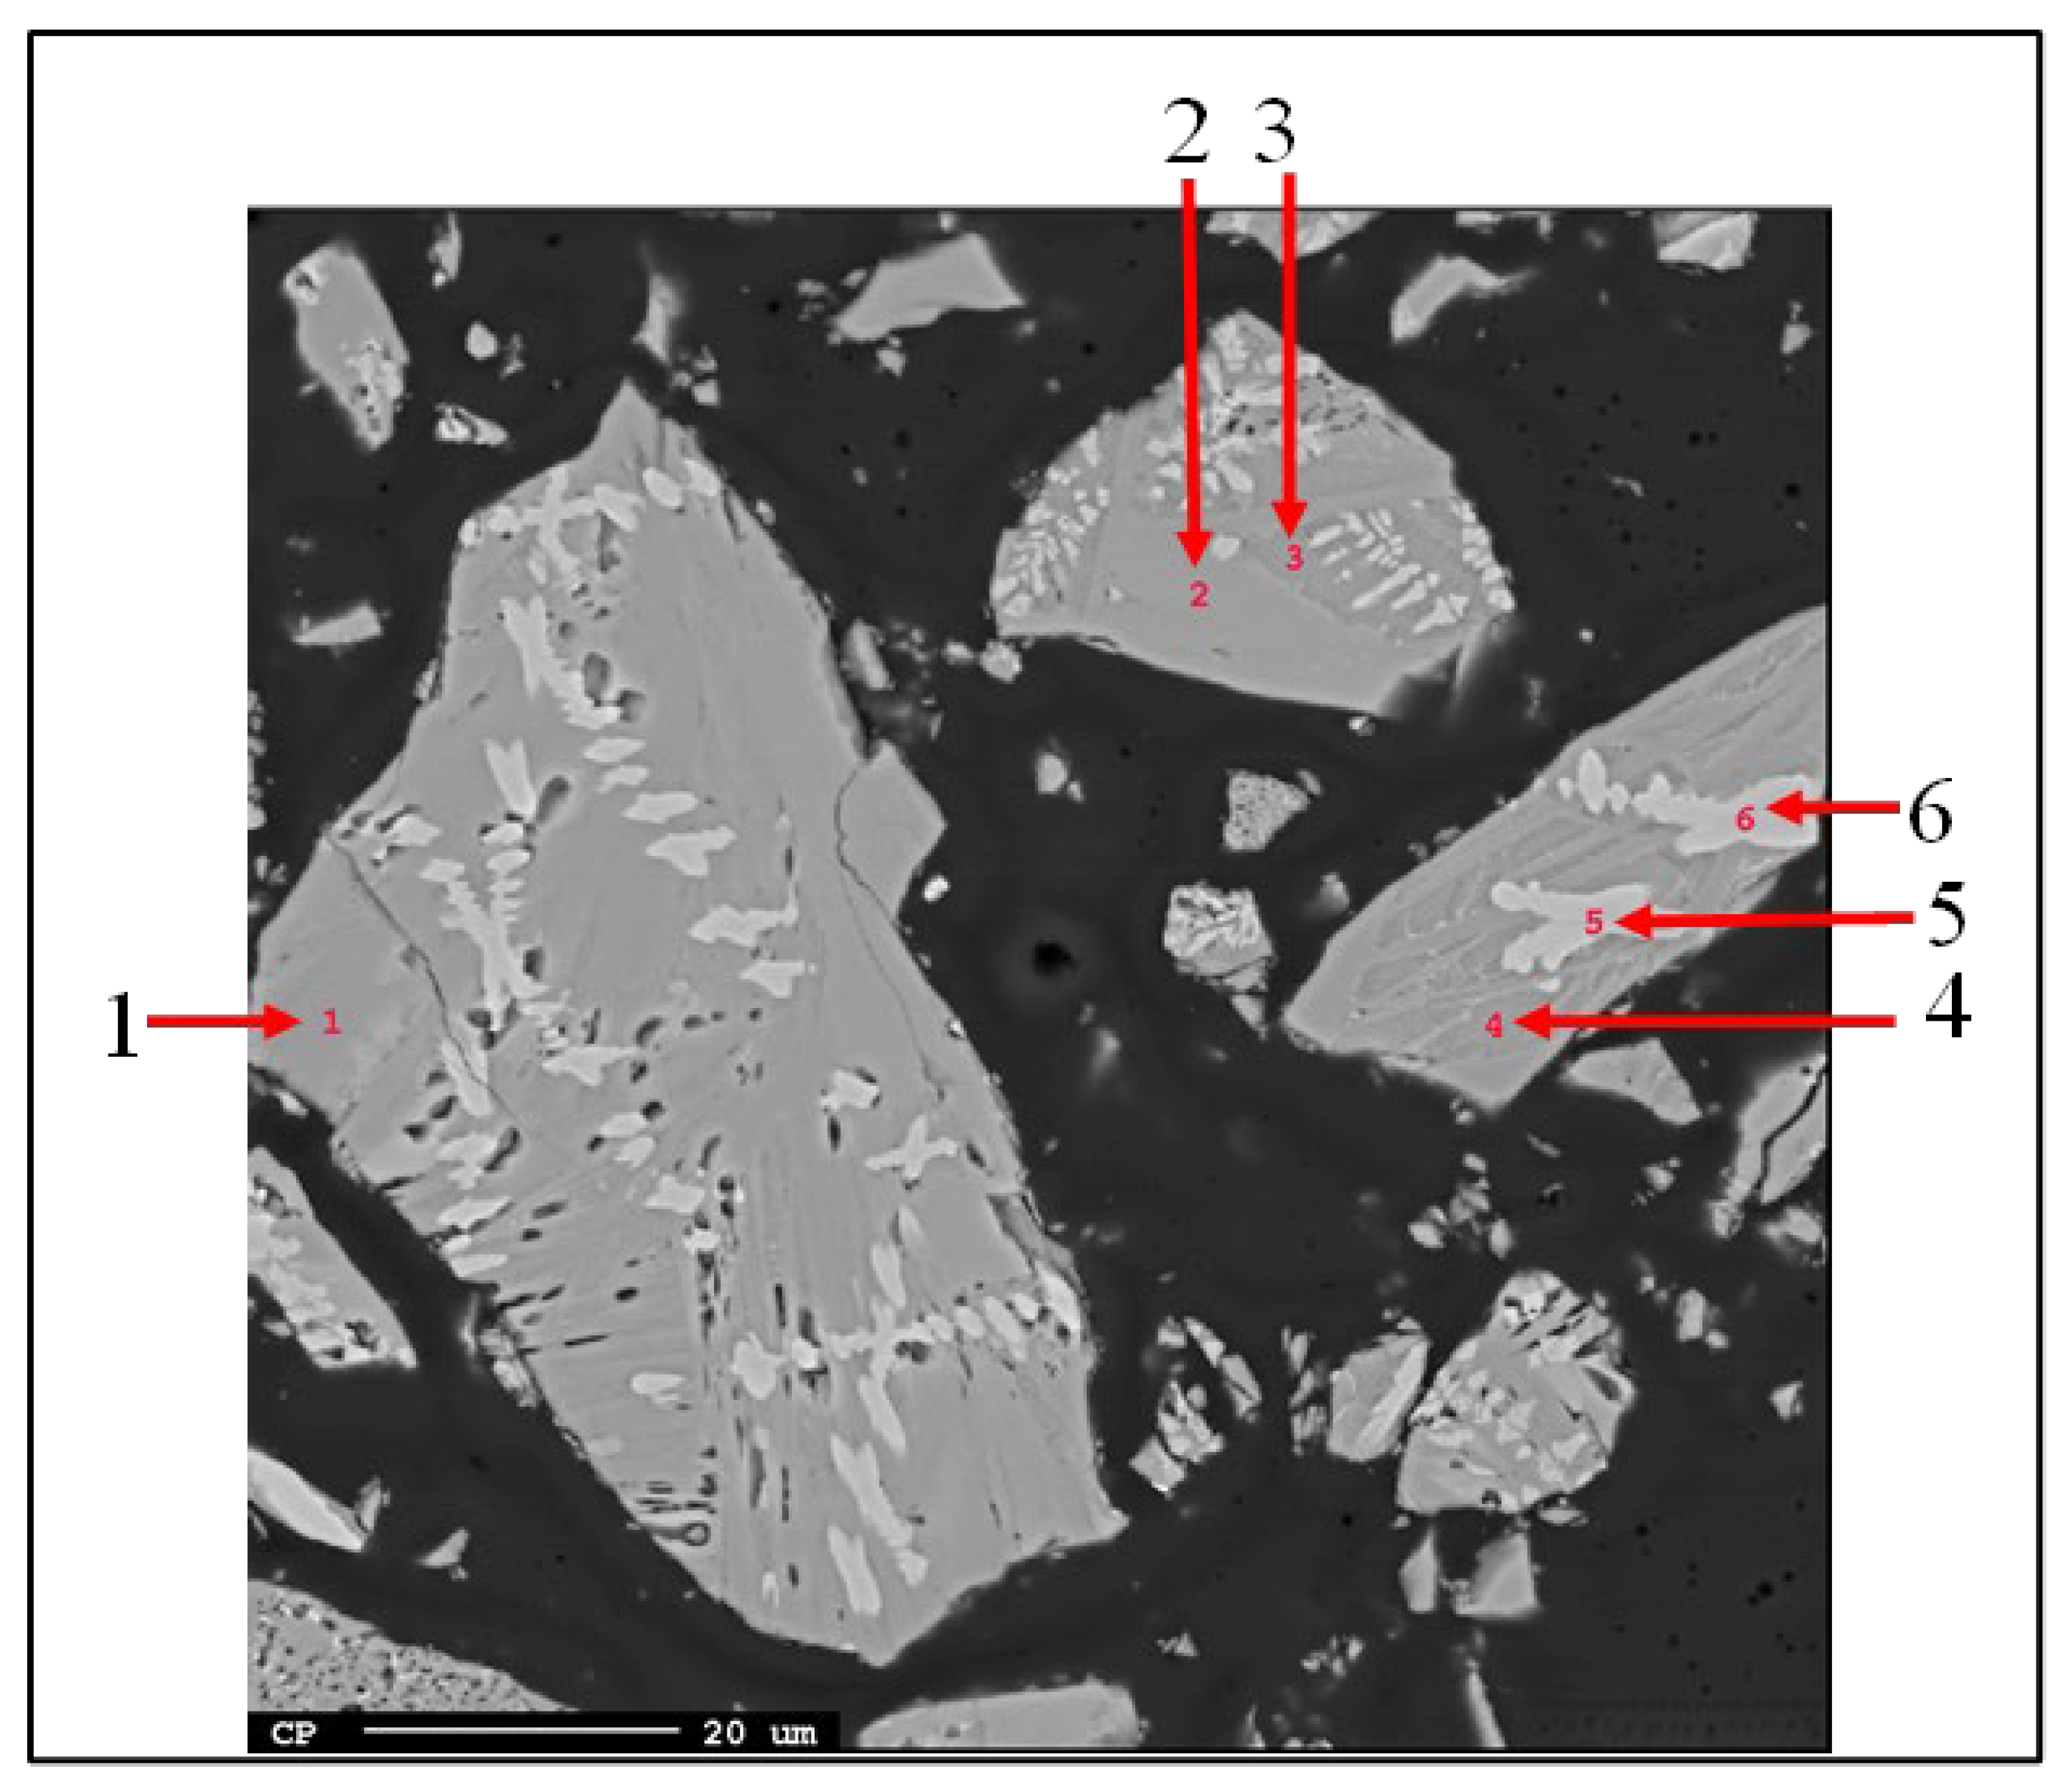
| 1 | 52.65 | 1.49 | 4.16 | 0.41 | 1.06 | Mayenite |
| 2 | 51.00 | 1.72 | 4.37 | 0.60 | 1.10 | Mayenite |
| 3 | 41.76 | 8.26 | 5.76 | 0.73 | 1.56 | Gehlenite (+larnite) |
| 4 | 40.48 | 8.63 | 5.61 | 1.36 | 1.62 | Gehlenite (+larnite) |
| 5 | 15.71 | 6.36 | 1.98 | 34.43 | - | Pervoskite |
| 6 | 16.42 | 6.88 | 1.97 | 35.16 | - | Perovskite |
| Test No. | First Stage Leach | Intermediate Step | Second Stage Leach |
|---|---|---|---|
| 1 | 60 g/L Na2CO3 (90 min) | Physical treatment with pestle and mortar | Recycled solution from 1st Stage Leach (90 min) |
| 2 | 60 g/L Na2CO3, 4 g NaOH (90 min) | N/A | N/A |
| 3 | 60 g/L Na2CO3 (180 min) | N/A | N/A |
| 4 | 100 g/L Na2CO3 (90 min) | Physical treatment with pestle and mortar | Recycled solution from 1st Stage Leach (90 min) |
| 5 | 40 g/L Na2CO3 (90 min) | Physical treatment with pestle and mortar | Leach with fresh solution 40 g/L Na2CO3 (90 min) |
| 6 | 80 g/L Na2CO3 (180 min) | N/A | N/A |
| Test No. | Solution from Leach Test No. | Temp. (°C) | PCO2 (%) | Rate of Agitation (rpm) | Duration (h) | Aging (days) |
|---|---|---|---|---|---|---|
| 1 | 1 | 25 | 50 | 200 | 0.5 | 3 |
| 2 | 2 | 25 | 50 | 200 | 0.5 | 3 |
| 3 | 3 | 50 | 50 | 200 | 1 | 1 |
| 4 | 4 | 75 | 50 | 200 | 2 | 1 |
| 5 | 6 | 25 | 50 | 200 | 2 | 1 |
| Test No. | 1 | 2 | 3 | 4 | 5 | 6 |
|---|---|---|---|---|---|---|
| ICP-MS | 63.53 | 61.20 | 57.13 | 58.16 | 42.58 | 53.03 |
| XRF | 67.12 | 64.95 | 64.17 | 64.60 | 68.77 | 58.25 |
| Test No. | 1 | 2 | 3 | 4 | 5 | 6 |
|---|---|---|---|---|---|---|
| Mineral Phase | ||||||
| Calcite (CaCO3) | 56 | 46 | 54 | 66 | 59 | 56 |
| Gehlenite | 20 | 24 | 21 | 7 | 16 | 17 |
| Perovskite | 15 | 17 | 14 | 14 | 17 | 16 |
| Larnite | 7 | 12 | 10 | 5 | 8 | 9 |
| Mayenite | 1 | 1 | 0 | 0 | 0 | 0 |
| Zeolite A (NaAlSiO4) | 0.5 | 0 | 0.5 | 8 | 0 | 2 |
| Bayerite | 0.5 | 0 | 0 | 0 | 0 | 0 |
| Test No. | 1 * | 2 * | 3 ** | 4 ** | 6 ** |
|---|---|---|---|---|---|
| Start (g/L) | 0.2 | 0.15 | 0.15 | 0.31 | 0.32 |
| End (g/L) | 0.15 | 0.11 | 0.02 | 0.23 | 0.04 |
| Silicon removal (%) | 25 | 27 | 87 | 28 | 88 |
| Start (g/L) | 15.07 | 13.17 | 10.04 | 23.10 | 22.23 |
| End (g/L) | 12.04 | 9.88 | 5.38 | 20.90 | 18.30 |
| Aluminum removal (%) | 26.64 | 30.09 | 55.08 | 18.46 | 26.43 |
| Test No. | 1 | 2 | 3 | 4 | 6 |
|---|---|---|---|---|---|
| Mineral Phase | |||||
| Calcium monocarboaluminate [Ca4Al2(OH)12CO2.5H2O] | 70 | 58 | 67 | 56 | 44 |
| Calcite (CaCO3) | 21 | 33 | 11 | 36 | 31 |
| Portlandite [Ca(OH)2] | 9 | 9 | 10 | 6 | 8 |
| Hydrogarnite Ca3Al2(SiO4)3−x(OH)4x [x = 1.5–3] | 0 | 0 | 12 | 1 | 18 |
| Solution Leach Test No. | 1 | 2 | 3 | 4 | 6 |
|---|---|---|---|---|---|
| Mineral Phase | |||||
| Bayerite [α-Al(OH)3] | 85 | 96 | 33 | 45 | 37 |
| Gibbsite [γ-Al(OH)3] | 12 | 0 | 0 | 0 | 0 |
| Nordstrandite [Al(OH)3] | 3 | 3 | 2 | 3 | 0 |
| Dawsonite [NaAlCO3(OH)2] | 0 | 0 | 65 | 52 | 67 |
| Natrite (Na2CO3) | 0 | 2 | 0 | 0 | 0 |
| Industrial | Test No. | |||||
|---|---|---|---|---|---|---|
| Contaminant | Specification | 1 | 2 | 3 | 4 | 6 |
| CaO | <0.04 | 0.09 | 0.20 | 0.27 | 0.13 | 0.20 |
| SiO2 | <0.015 | 0.55 | 0.55 | 0.09 | 0.59 | 0.59 |
| TiO2 | <0.004 | 0 | 0 | 0 | 0 | 0 |
| Fe2O3 | <0.015 | 0.01 | 0.03 | 0 | 0 | 0.02 |
| Na2O | <0.4 | 0.57 | 3.01 | 19.30 | 21.60 | 13.30 |
| Test No. | 1 | 2 | 3 | 4 | 6 |
|---|---|---|---|---|---|
| Start (g/L) | 12.04 | 9.88 | 5.38 | 20.9 | 18.30 |
| End (g/L) | 3.83 | 4.57 | 0.03 | 8.11 | 6.08 |
| Amount precipitated (%) | 68.19 | 53.74 | 99.44 | 61.20 | 66.78 |
| Carbonation time (h) | 0.5 | 0.5 | 1 | 2 | 2 |
| Na2CO3 leaching solution concentration (g/L) | 60 | 60 | 60 | 100 | 80 |
Publisher’s Note: MDPI stays neutral with regard to jurisdictional claims in published maps and institutional affiliations. |
© 2022 by the authors. Licensee MDPI, Basel, Switzerland. This article is an open access article distributed under the terms and conditions of the Creative Commons Attribution (CC BY) license (https://creativecommons.org/licenses/by/4.0/).
Share and Cite
Mwase, J.M.; Vafeias, M.; Marinos, D.; Dimitrios, P.; Safarian, J. Investigating Aluminum Tri-Hydroxide Production from Sodium Aluminate Solutions in the Pedersen Process. Processes 2022, 10, 1370. https://doi.org/10.3390/pr10071370
Mwase JM, Vafeias M, Marinos D, Dimitrios P, Safarian J. Investigating Aluminum Tri-Hydroxide Production from Sodium Aluminate Solutions in the Pedersen Process. Processes. 2022; 10(7):1370. https://doi.org/10.3390/pr10071370
Chicago/Turabian StyleMwase, James Malumbo, Michail Vafeias, Danai Marinos, Panias Dimitrios, and Jafar Safarian. 2022. "Investigating Aluminum Tri-Hydroxide Production from Sodium Aluminate Solutions in the Pedersen Process" Processes 10, no. 7: 1370. https://doi.org/10.3390/pr10071370
APA StyleMwase, J. M., Vafeias, M., Marinos, D., Dimitrios, P., & Safarian, J. (2022). Investigating Aluminum Tri-Hydroxide Production from Sodium Aluminate Solutions in the Pedersen Process. Processes, 10(7), 1370. https://doi.org/10.3390/pr10071370