Article

Experimental Verification of Reservoirs with Different Wettability Using an Oil–Water Relative Permeability Model

1
The Institute of Geosciences, Northeast Petroleum University, Daqing 163453, China
2
Logging & Testing Service Company, Daqing Oilfield Company Limited, Daqing 163453, China
*
Author to whom correspondence should be addressed.
Processes 2022, 10(6), 1211; https://doi.org/10.3390/pr10061211
Submission received: 18 May 2022 / Revised: 6 June 2022 / Accepted: 14 June 2022 / Published: 17 June 2022
(This article belongs to the Special Issue Multiphase Flow Assurance in Porous Media and Production Operations)

Abstract

:
Oil–water relative permeability is an important parameter that affects fluid flow in porous media. It is usually obtained in a laboratory. Since rock resistivity and relative permeability are both effects of water saturation, they should theoretically have a relationship. Based on the parallel conduction principle of fluid and skeleton in porous media, the pore structure and fluid distribution can be simplified using the Kozeny–Carman permeability correction equation and the Archie formula, and the relative permeability model of the water phase can be deduced under different wetting conditions. In this study, the resistivity and relative permeability experimental data of 20 rock samples from four inspection wells were compared and verified. The results show that the proposed oil–water relative permeability model agrees well with a reservoir having a porosity range of 17.6–30.7% and an air permeability of 0.16–973 × 10−3 μm, and it may explain why the relative permeability of the water phase decreases as water saturation increases. This model could provide a new technique to construct the relative permeability curves of sandstone reservoirs.

1. Introduction

Oil–water relative permeability is an important parameter affecting fluid flow in porous media, and it is a basic principle that must be followed in oil–water two-phase seepage. It is traditionally obtained in a laboratory, but experiments to determine relative permeability are expensive, difficult and time-consuming in most cases, especially when there is a phase shift and mass transfer between two phases as pressure changes. Taking a sample out of the ground also makes it difficult to maintain accurate reservoir conditions, and it is difficult to obtain real-time relative permeability. Since rock resistivity and relative permeability are both effects of water saturation, they should theoretically have a relationship.
After conducting a literature investigation, we found that there are only a few mathematical model studies about the relationship between rock resistivity and relative permeability. The following is a brief review. Brook and Corey [1,2] obtained a relatively complete model of the relationship between relative permeability and water saturation. App J [3] addressed experimental measurement of relative permeabilities for a rich gas/condensate reservoir using a live, single-phase reservoir fluid. In 1964, Pirson [4] et al. verified the theoretical formula for predicting relative permeability by resistivity logging proposed by predecessors with experimental data and a modified theoretical model, thus establishing an improved equation for gas–liquid two-phase and oil–water two-phase conditions, as well as verifying the accuracy of their model through experiments. However, all the values in the model are constant and have strong experience, limiting the application of the model. Li Kewen [5,6] (2005;2008) established a new method for calculating the relative permeability of the oil–water phase using resistivity data based on the flow in porous media and the properties of the conductive medium current flow similar principle. The model, which considers relative permeability and resistance increase in Archie formula coefficients as functions of water saturation, has very similar properties, and it is concluded that the relative permeability of the wetting phase is inversely proportional to the resistance increase coefficient, and the relationship model between the relative permeability of the wetting phase, water saturation and resistance increase coefficient is established. After introducing normalized water saturation to the formula, the relative permeability of the oil phase is obtained according to the Brooks–Corey model. With different porosity, permeability and temperature under the sandstone conditions, data validation shows that the model for calculating relative permeability and capillary pressure data is close and that resistivity data measuring with the relative permeability model is much easier than capillary pressure data measuring, which can be directly obtained from the resistivity logging. The feasibility of calculating relative permeability using resistivity data has been experimentally verified. Li Kewen [7] et al. improved the calculation formula of relative permeability of the non-wetting phase by introducing the aperture distribution index λ based on the Brooks–Corey (1966) model and Li-Horne’s research results. The experimental results show that the relative permeability calculation accuracy in the water phase is higher than that in the oil phase. Faruk Civan [8] described variation in porosity and permeability by scale dissolution and precipitation in porous media based on fractal attributes of the pores, with the relationship between permeability and porosity conforming to Civan’s power-law flow units equation. Practical analytical solutions were derived and verified by experimental data. Deviations in the empirically determined exponents of the pore-to-matrix volume ratio compared to the Kozeny–Carman equation were due to the relative fractal dimensions of pore attributes of random porous media. He Yan [9] established the relationship between relative permeability, water saturation and fractal dimension. Andersen [10,11] et al. derived relative permeability and capillary pressure functions from measurements of pressure drop and oil production data in multirate water injection tests showed that the change in wettability toward a more water-wet state can give an apparent EOR effect by reducing the end effects without there being any real reduction in the residual oil saturation. Andersen’s research showed that the change in wettability toward a more water-wet state can give an apparent EOR effect by reducing the end effects without there being any real reduction in the residual-oil saturation. Ma Jianbin [12] et al. deduced a formula for calculating rock permeability by employing resistivity based on Archie’s formula and the famous Kozeny–Carman (KC) model [13], assuming that rock is spherical with uniform size. Using rock’s physical properties measured by a multiparameter core scanner, the results were verified. The experimental results indicate that the proposed method can effectively characterize the relationship between rock resistivity and permeability. Tsakiroglou [14] et al. converted the electrical resistances to water saturations with the aid of the Archie equation for resistivity index. Both krw and krg are regarded as power functions of water, Caw of gas and Cag of capillary numbers, the exponents of which are estimated with non-linear fitting to the experimental datasets. The water saturation is insensitive to changes in water and gas capillary numbers and each relative permeability is affected by both water and gas capillary numbers. Liu Jiangtao [15] established a relationship model between relative permeability and normalized water saturation. LeiliMoghadasi [16] et al. measured spatial and temporal dynamics of in situ saturations along core samples directly through an X-ray absorption technology. The latter rendered detailed distributions of (section-averaged) fluid flow phases through the medium, which can then be employed for the characterization of relative permeabilities. Bai Songtao [17] et al. studied the relationship between capillary pressure, nuclear magnetic resonance T2 spectrum, resistivity increase coefficient and relative permeability. Based on fractal theory, they analyzed and deduced the exponential relationship between the resistivity increase coefficient and relative permeability and verified it using data from rock physics experiments.
In conclusion, relative permeability calculation models have various forms and strong practicability, but the application of some models is still limited [18,19,20,21,22,23,24,25,26,27,28,29,30,31]. The influence of wettability is rarely considered in the present model proposed to explain the relationship between oil–water relative permeability and resistivity.
In this study, the water-phase relative permeability model of reservoirs with different wettability is derived using the principle of parallel conduction of skeleton and fluid in porous media. The improved oil-phase relative permeability model is presented based on the research results of Li and Horne [6], and the experimental data of resistivity and relative permeability of 20 rock samples from four inspection wells are compared and verified, proving the universality of the proposed model.

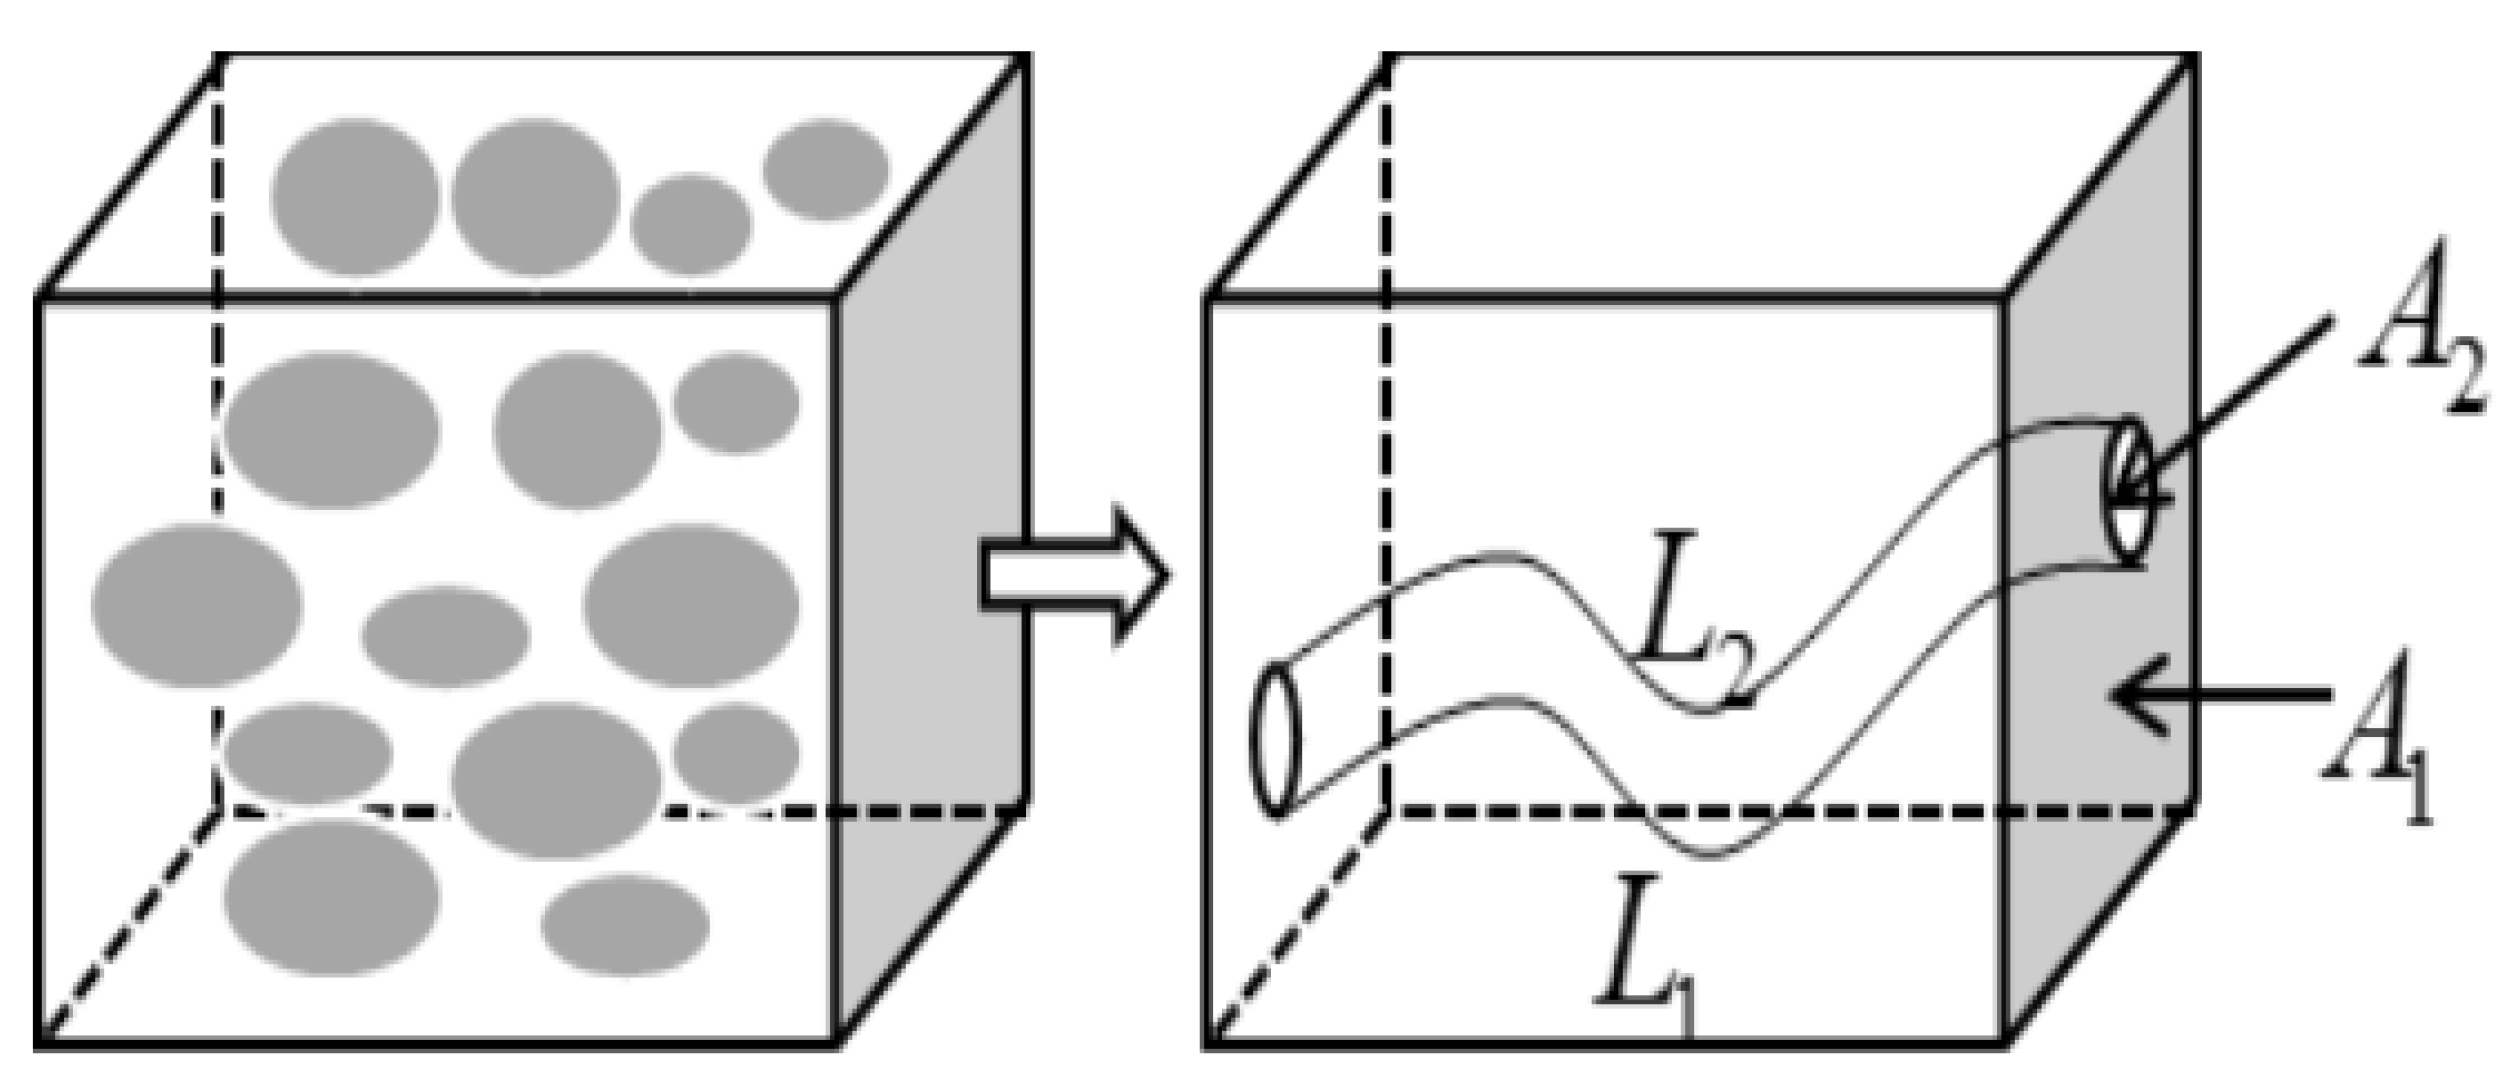
2. Mathematical Model

2.1. Water-Phase Relative Permeability Model

The conductive characteristics of porous media rock are equivalent to skeleton and formation water. L 1 is the rock length, A 1 is the cross-sectional area and L 2 and A 2 are the equivalent length and cross-sectional area of formation water, respectively (Figure 1). Assuming that the skeleton is completely non-conductive, according to the parallel conduction principle,
1 R t L 1 A 1 = 1 R w L 2 A 2
The above formula can be further expressed as
V R t L 1 2 = V φ S w R w L 2 2
Equations (1) and (2), V ,   φ ,   R t ,   R w ,   S w represent the rock volume, total porosity, rock resistivity, formation water resistivity and water saturation of porous media, respectively.
According to Formula (2), the hydraulic bending degree (tortuosity, τ ) of the medium can be obtained with different water saturations.
τ 2 = L 2 2 L 1 2 = R t R w φ S w
According to the literature [9], the original permeability of porous media is mainly restricted by porosity, the specific surface area related to pore volume and hydraulic bending of the media, which can be expressed as:
K = α φ 1 S τ 2
In Formula (4), α is the shape factor of porous media, dimensionless; φ is the porosity, dimensionless; τ is the hydraulic bending of the medium, dimensionless; S is the specific surface area related to pore volume, dimensionless.
According to Equations (3) and (4), under different water saturation conditions in porous media, the effective permeability of water is:
K w = α φ 1 R t R w φ S w ( A w V w ) 2 = α R w R t S w ( A w V w ) 2
where A w is the total surface area of the water phase with different water saturation and V w is the total volume of the water phase.
When the porous medium contains 100% water, R t = R 0 , S w = 1 ,
K = α R w R 0 ( A V ) 2
where A is the total surface area of pores and V is the total volume of pores.
Based on the Archie formula [27] combined with water saturation and relative permeability, the relative permeability of the water phase can be expressed as
K r w = K w K = S w I ( A A w ) 2
where I is the resistivity index and S w is the water saturation.
The relative permeability of water in porous media is a function of water saturation, resistivity index and the ratio of the porosity to total surface area (determined as A / A w in Equation (7)). The pore was simplified into a columnar capillary model in the literature [15], and the calculation results of capillary seepage under the condition of internal water and internal oil are as follows:
(1)
If the porous media is oil-wet, it indicates that the capillary has a columnar structure with external oil and internal water. In this case,
A A w = 1 S w 0.5
Substituting (8) into (7),
K r w = 1 I
According to the similarity principle of fluid flow in porous media and current flow in conductive media, the obtainable relative permeability model of the water phase is completely consistent with Equation (9) and the report of Li Kewen [7].
(2)
If the porous media is hydrophilic, it indicates that the inside of the capillary has a columnar structure with external water and internal oil. In this case,
A A w = 1 1 + ( 1 S w ) 0.5
Substituting(10) into (7),
K r w = S w I 1 [ 1 + ( 1 S w ) 0.5 ] 2
(3)
If the porous medium is neutral, the relative permeability of water can be regarded as the comprehensive effect of the relative permeability of the above water phases. That is,
K r w = 1 2 I 1 + S w [ 1 + ( 1 S w ) 0.5 ] 2
When the water saturation is 100%, it can be calculated using the formula K r w = 1 , which is under the physical law. When the water saturation is bound, K r w = 0 , I tends to infinity. However, when the water saturation is bound, I does not tend to infinity. Therefore, K r w calculated using the formula is greater than 0, which is inconsistent with the laws of physics. Considering these problems, the formula was improved by multiplying the normalized saturation of the water phase in the formula:
S w * = S w S w i 1 S w i
where S w * is the standardized water-phase saturation and S w i is the bound water saturation. According to Archie formula [27],
I = R t R o = S w n
where n is the saturation index, dimensionless.
Furthermore, Equations (9), (11) and (12) can be further expressed as relative permeability equations of the water phase under different wettability conditions.
Oil   wetting : K r w = S w * S w n
Water   wetting : K r w = S w * S w n + 1 1 [ 1 + ( 1 S w ) 0.5 ] 2
Neutral   wetting : K r w = 1 2 S w * S w n 1 + S w [ 1 + ( 1 S w ) 0.5 ] 2
According to Formulas (15)–(17), when S w = 100 % , K r w = 1 ; when S w = S w i , K r w = 0 . At that time, it conforms to the laws of physics.

2.2. Oil-Phase Relative Permeability Model

In the case of the gas–water two-phase, the formula for calculating the non-wetting phase through the Brooks–Corey model [1,2,3] was:
k r n w = ( 1 S w * ) 2 [ 1 S w * ) 2 + λ λ
Li and Horne(2005) point out [6]
k r w = ( S w * ) 2 + λ λ
Combined with Equations (18) and (19), oil-phase relative permeability can be expressed as:
k r o = ( 1 S w ) 2 1 k r w
where S w is the standardized water saturation formula of the oil phase, which can be expressed as:
k r o = ( 1 S w ) 2 1 k r w
where S w i is the bound water saturation and S o r is the residual oil saturation.
When S w = S w i , K r o = 1 , it satisfies the boundary condition. When S w = 1 S o r , K r o = 0 , it satisfies the boundary condition.

3. The Experiment

Experiments were carried out at room temperature, and oil–water relative permeability and resistivity were measured simultaneously. This section describes the experimental set up as well as rock and fluid properties.

3.1. Rock Properties

A total of 20 core samples from four wells were analyzed. The length of these core samples ranged from 5.150 to 7.871 cm, the diameter from 2.54 to 2.59 cm and the porosity from 17.62 to 30.70%.The permeability of the samples ranged from 0.656 to 1200 mD. The characteristics and experimental results of these core samples are presented in Table 1. These core samples were obtained from the Putaohua and Saertu oil reservoir groups in the Xingshugang area of Daqing Changyuan, SongliaoBasin. The two oil formations were sandstone-dominated sedimentary rocks.

3.2. Fluid Characteristics
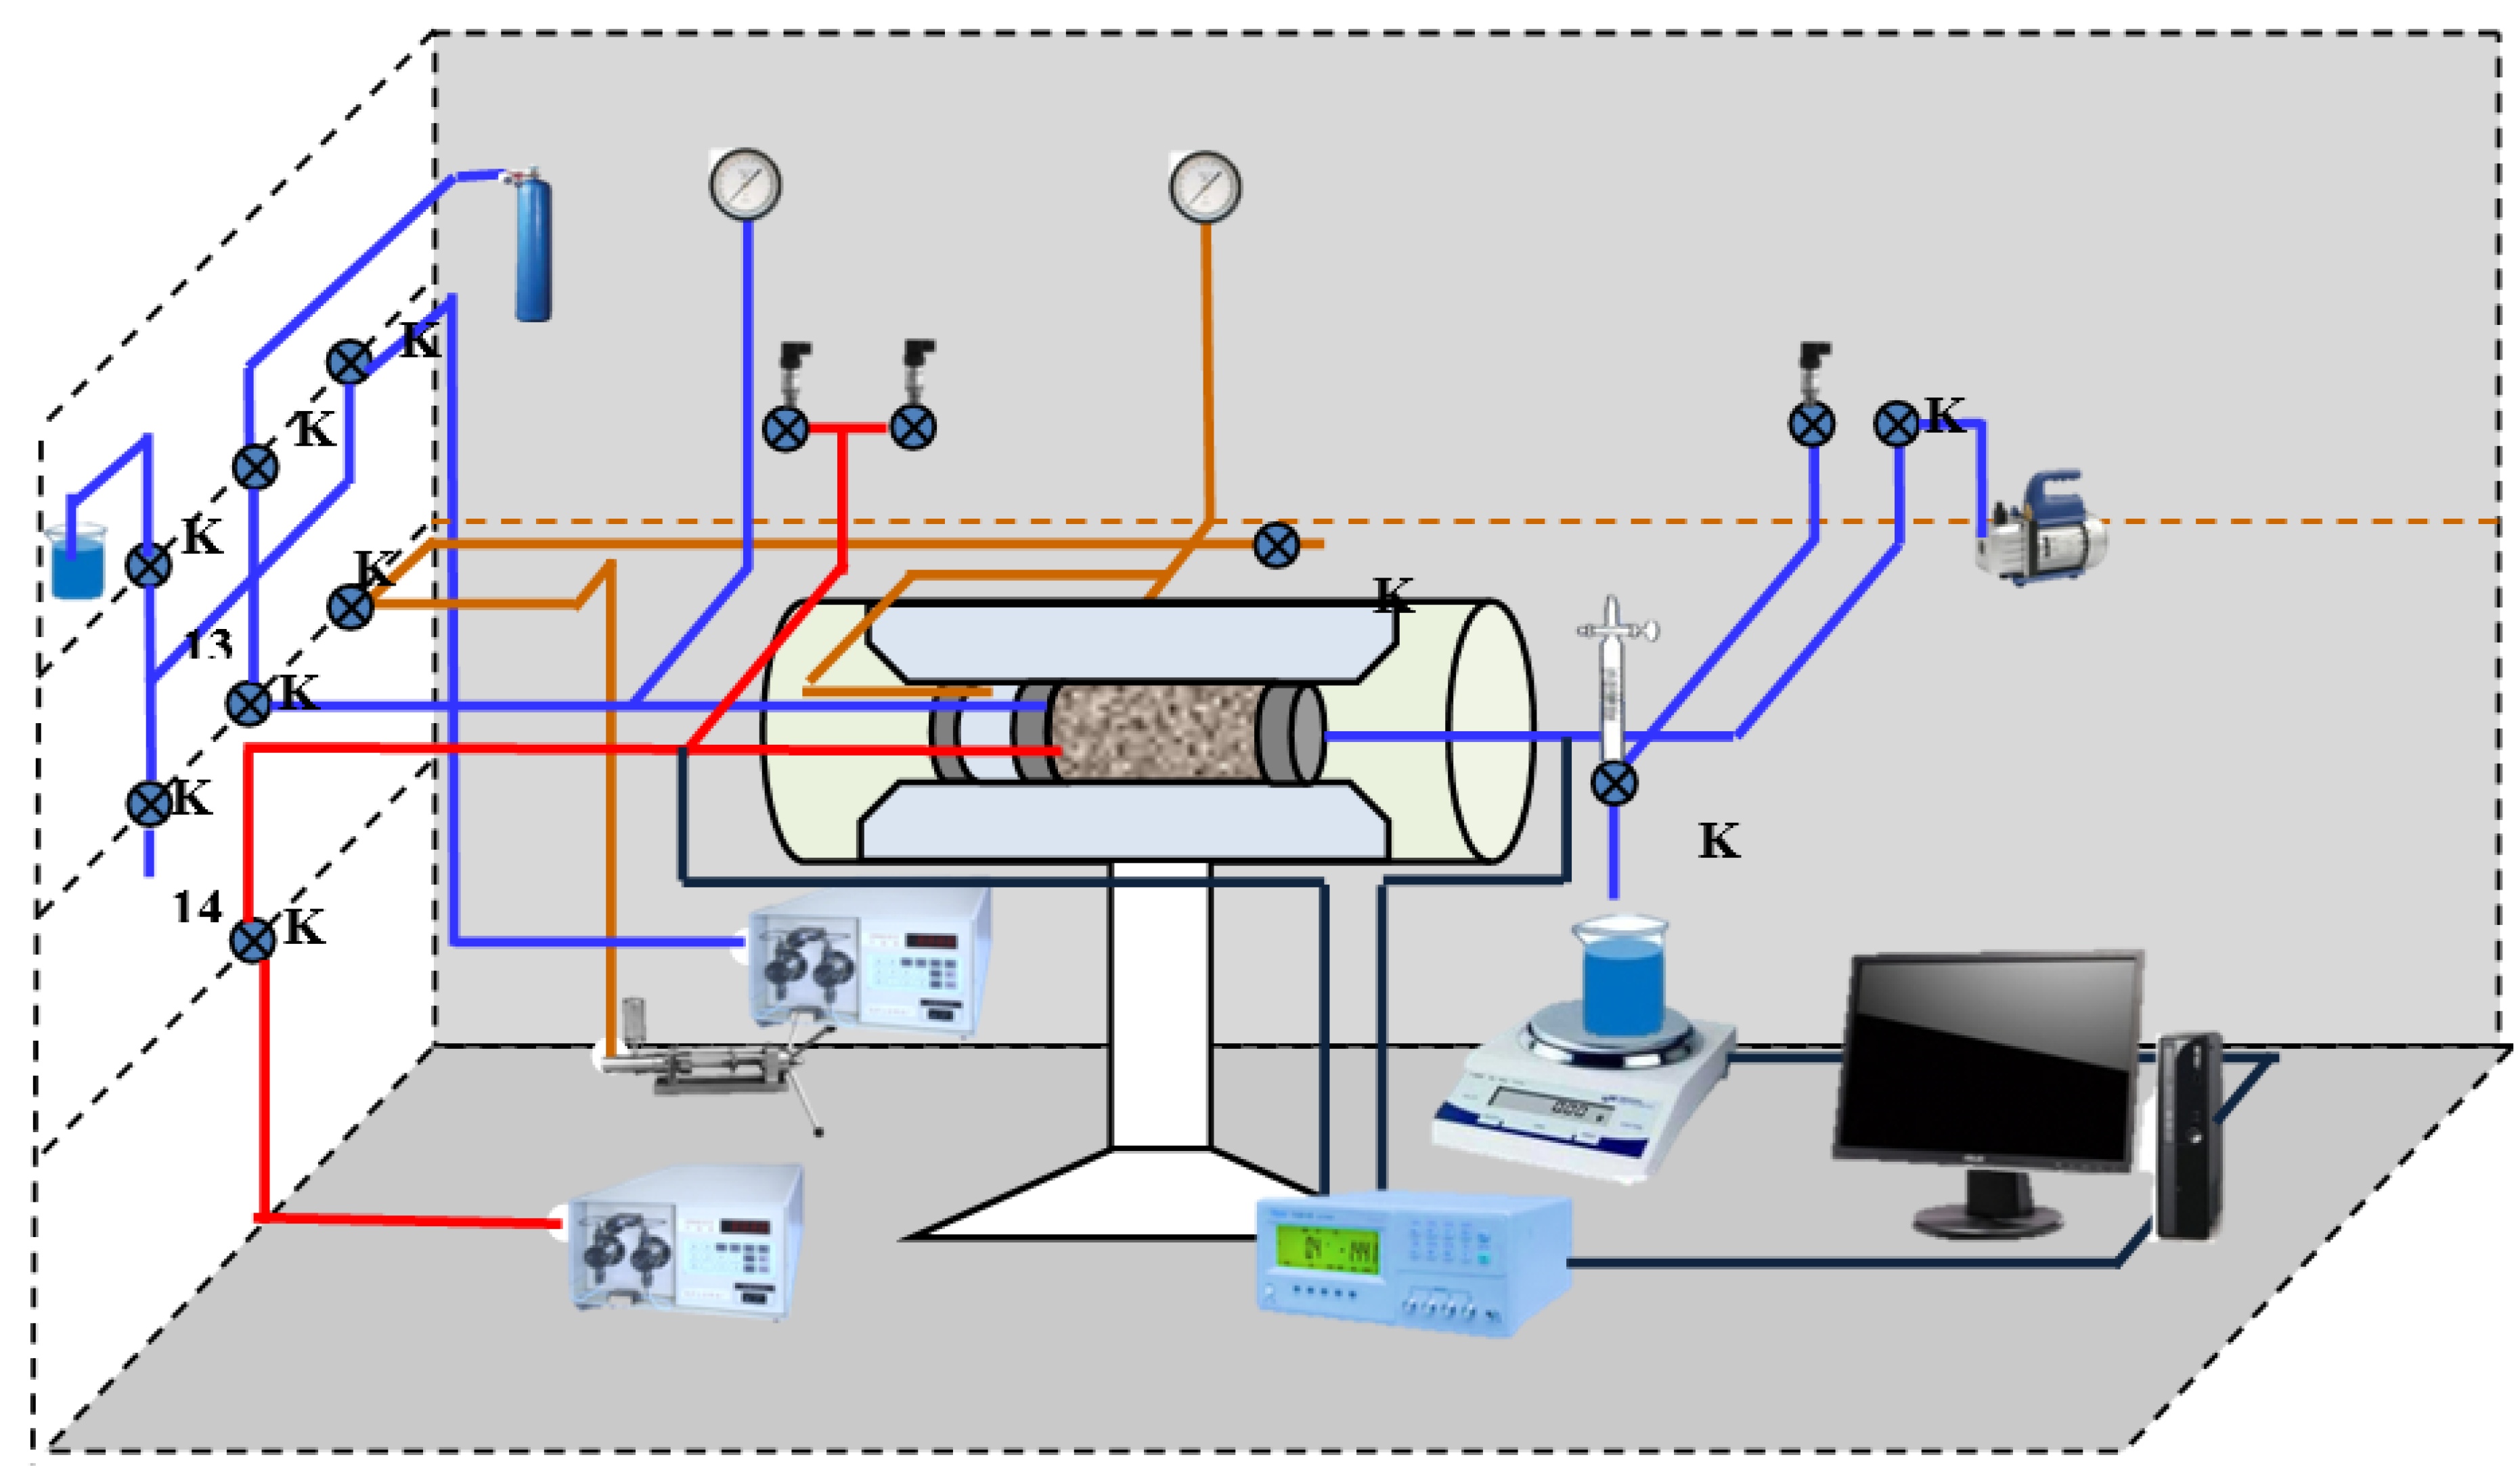
The formation water salinity of the Putaohua and Saertu reservoirs is 7500 ppm. The viscosity of crude oil in these two reservoirs is about 9 mPa.s at 20 °C. The viscosity of the oil used in this study was about 8.8 mPa.s at 20 °C, and the density of the oil was 0.845 g/cm3.

3.3. Instruments

A dynamic displacement technology was used to measure the relative permeability of oil–water. A schematic of the instrument used to measure oil–water relative permeability and resistivity is shown in Figure 2. A core clip was used to measure the resistivity of the core samples at different water saturations in real time during water injection. Gas flow was measured using an XFM digital mass flowmeter manufactured in Aalborg. The resistivity was measured using a 1730 LCR manufactured by Quad Tech. The differential pressures on the rocks were measured using pressure sensors with different measuring ranges with an accuracy of 0.25%. Oil and water were injected into the core sample using a constant flow injection pump at a rate of 0.01 to 9.99 mL/min. The precision of the constant flow jet pump was 0.01 mL/min, and the maximum working pressure was 80MPa.The amount of oil produced by water injection was measured using a glass cylinder with an accuracy of 0.05 mL. The total liquid production was measured using a balance with a precision of 0.01 g. The instrument enabled the core sample to be saturated with water online to reduce errors.

3.4. Experimental Procedure

(1)
The analyzed samples were cleaned and dried before the test.
(2)
The wettability of cores after cleaning and restoration was measured using a combination of imbibition and forced displacement.
(3)
To establish bound water saturation, the oil flooding method was used. Oil flooding was performed at a low flow rate (generally 0.1 mL/min), and the displacement speed was gradually increased until no water escaped.
(4)
Oil-phase permeability under bound water was measured three consecutive times, and the relative error was less than 3%.
(5)
According to the requirements of displacement conditions, the appropriate displacement speed was selected to carry out the water displacement experiment.
(6)
Water penetration time, cumulative oil production at water penetration, cumulative fluid production, displacement speed, pressure difference at both ends of rock sample and resistance value were accurately recorded.
(7)
At the initial stage of water appearance, there cords were encrypted, and the time interval was selected according to the amount of oil production. With the continuous decline in oil production, the time interval of recording was gradually lengthened. When the water content was about99.95% or 30 times the pore volume of water injection, the water-phase permeability of residual underwater was measured.
(8)
At the end of the displacement experiment, the residual oil saturation was calculated using accumulative oil production and liquid production, and the core was subsequently removed from the gripper and weighed, and the residual oil saturation was calculated using the material balance method.
(9)
The relative permeability of water and oil was calculated using the JBN method provided by Johnson et al. (1959). During all displacements, the resistivity was measured using an LCR meter with a frequency of 10 kHz.

4. Results

To test the model, oil–water relative permeability and resistivity were measured in all 20 core samples. Figure 3 shows the relationship between sample increased resistance coefficient and water saturation. The saturation exponent, n, was calculated by linear fitting under logarithmic coordinates, n, ranging from 0.78 to 2.14. The correlation between n and permeability was low, with a weak correlation in residual oil saturation and irreducible water saturation, but a strong correlation with porosity. Figure 4 shows the relationship between saturation index and porosity. The saturation index decreased as the porosity increased.
The oil-water relative permeability calculated from resistivity data was consistent with the experimental results. The correlation coefficient, R ,was used to calculate the accuracy of the model results, and the derivation of R is as follows:
R 2 = 1 i k r i , m k r i , e x p 2 i k r i , e x p k r i , e x p ¯ 2
where k r i , m is the relative permeability of oil or water obtained by the model, k r i , exp is the relative permeability of oil or water derived from the experiment and k r i , exp ¯ is the average of the relative permeability of all oil or water under different saturation obtained from the experiment. R 2 ranged from 0 to 1. Table 2 shows the calculated and measured correlations of oil–water relative permeability for all 20 core samples.

5. Discussion

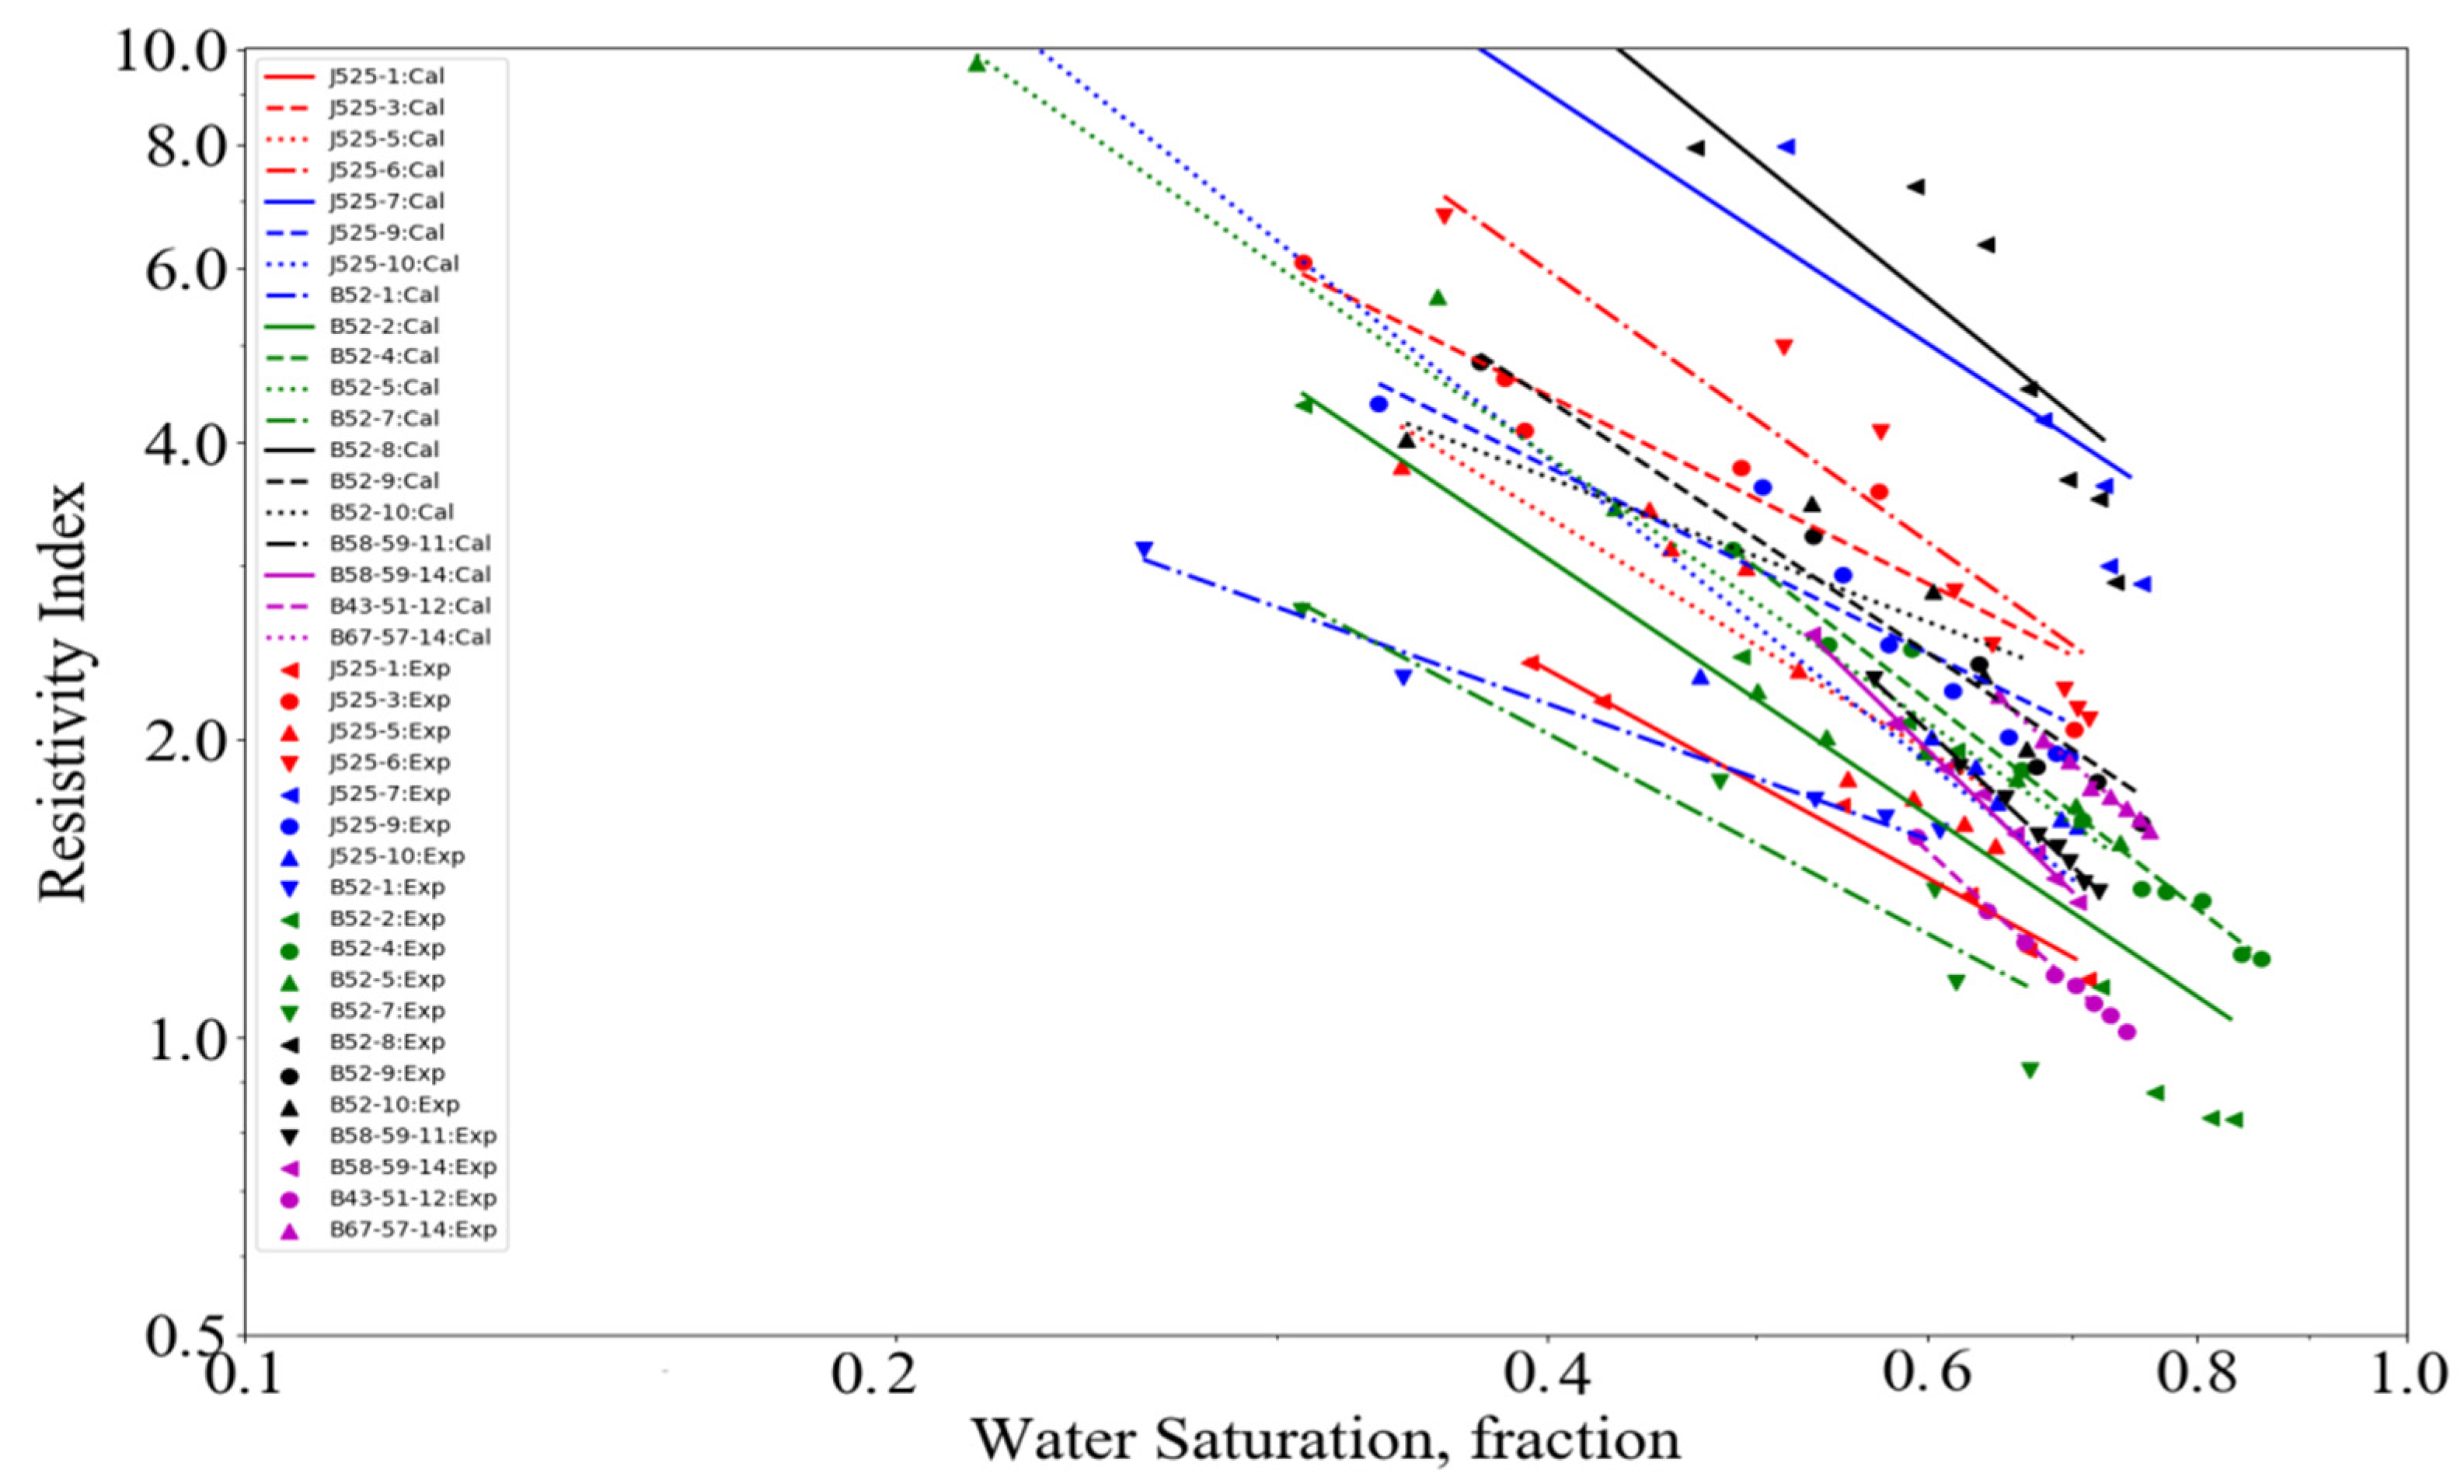
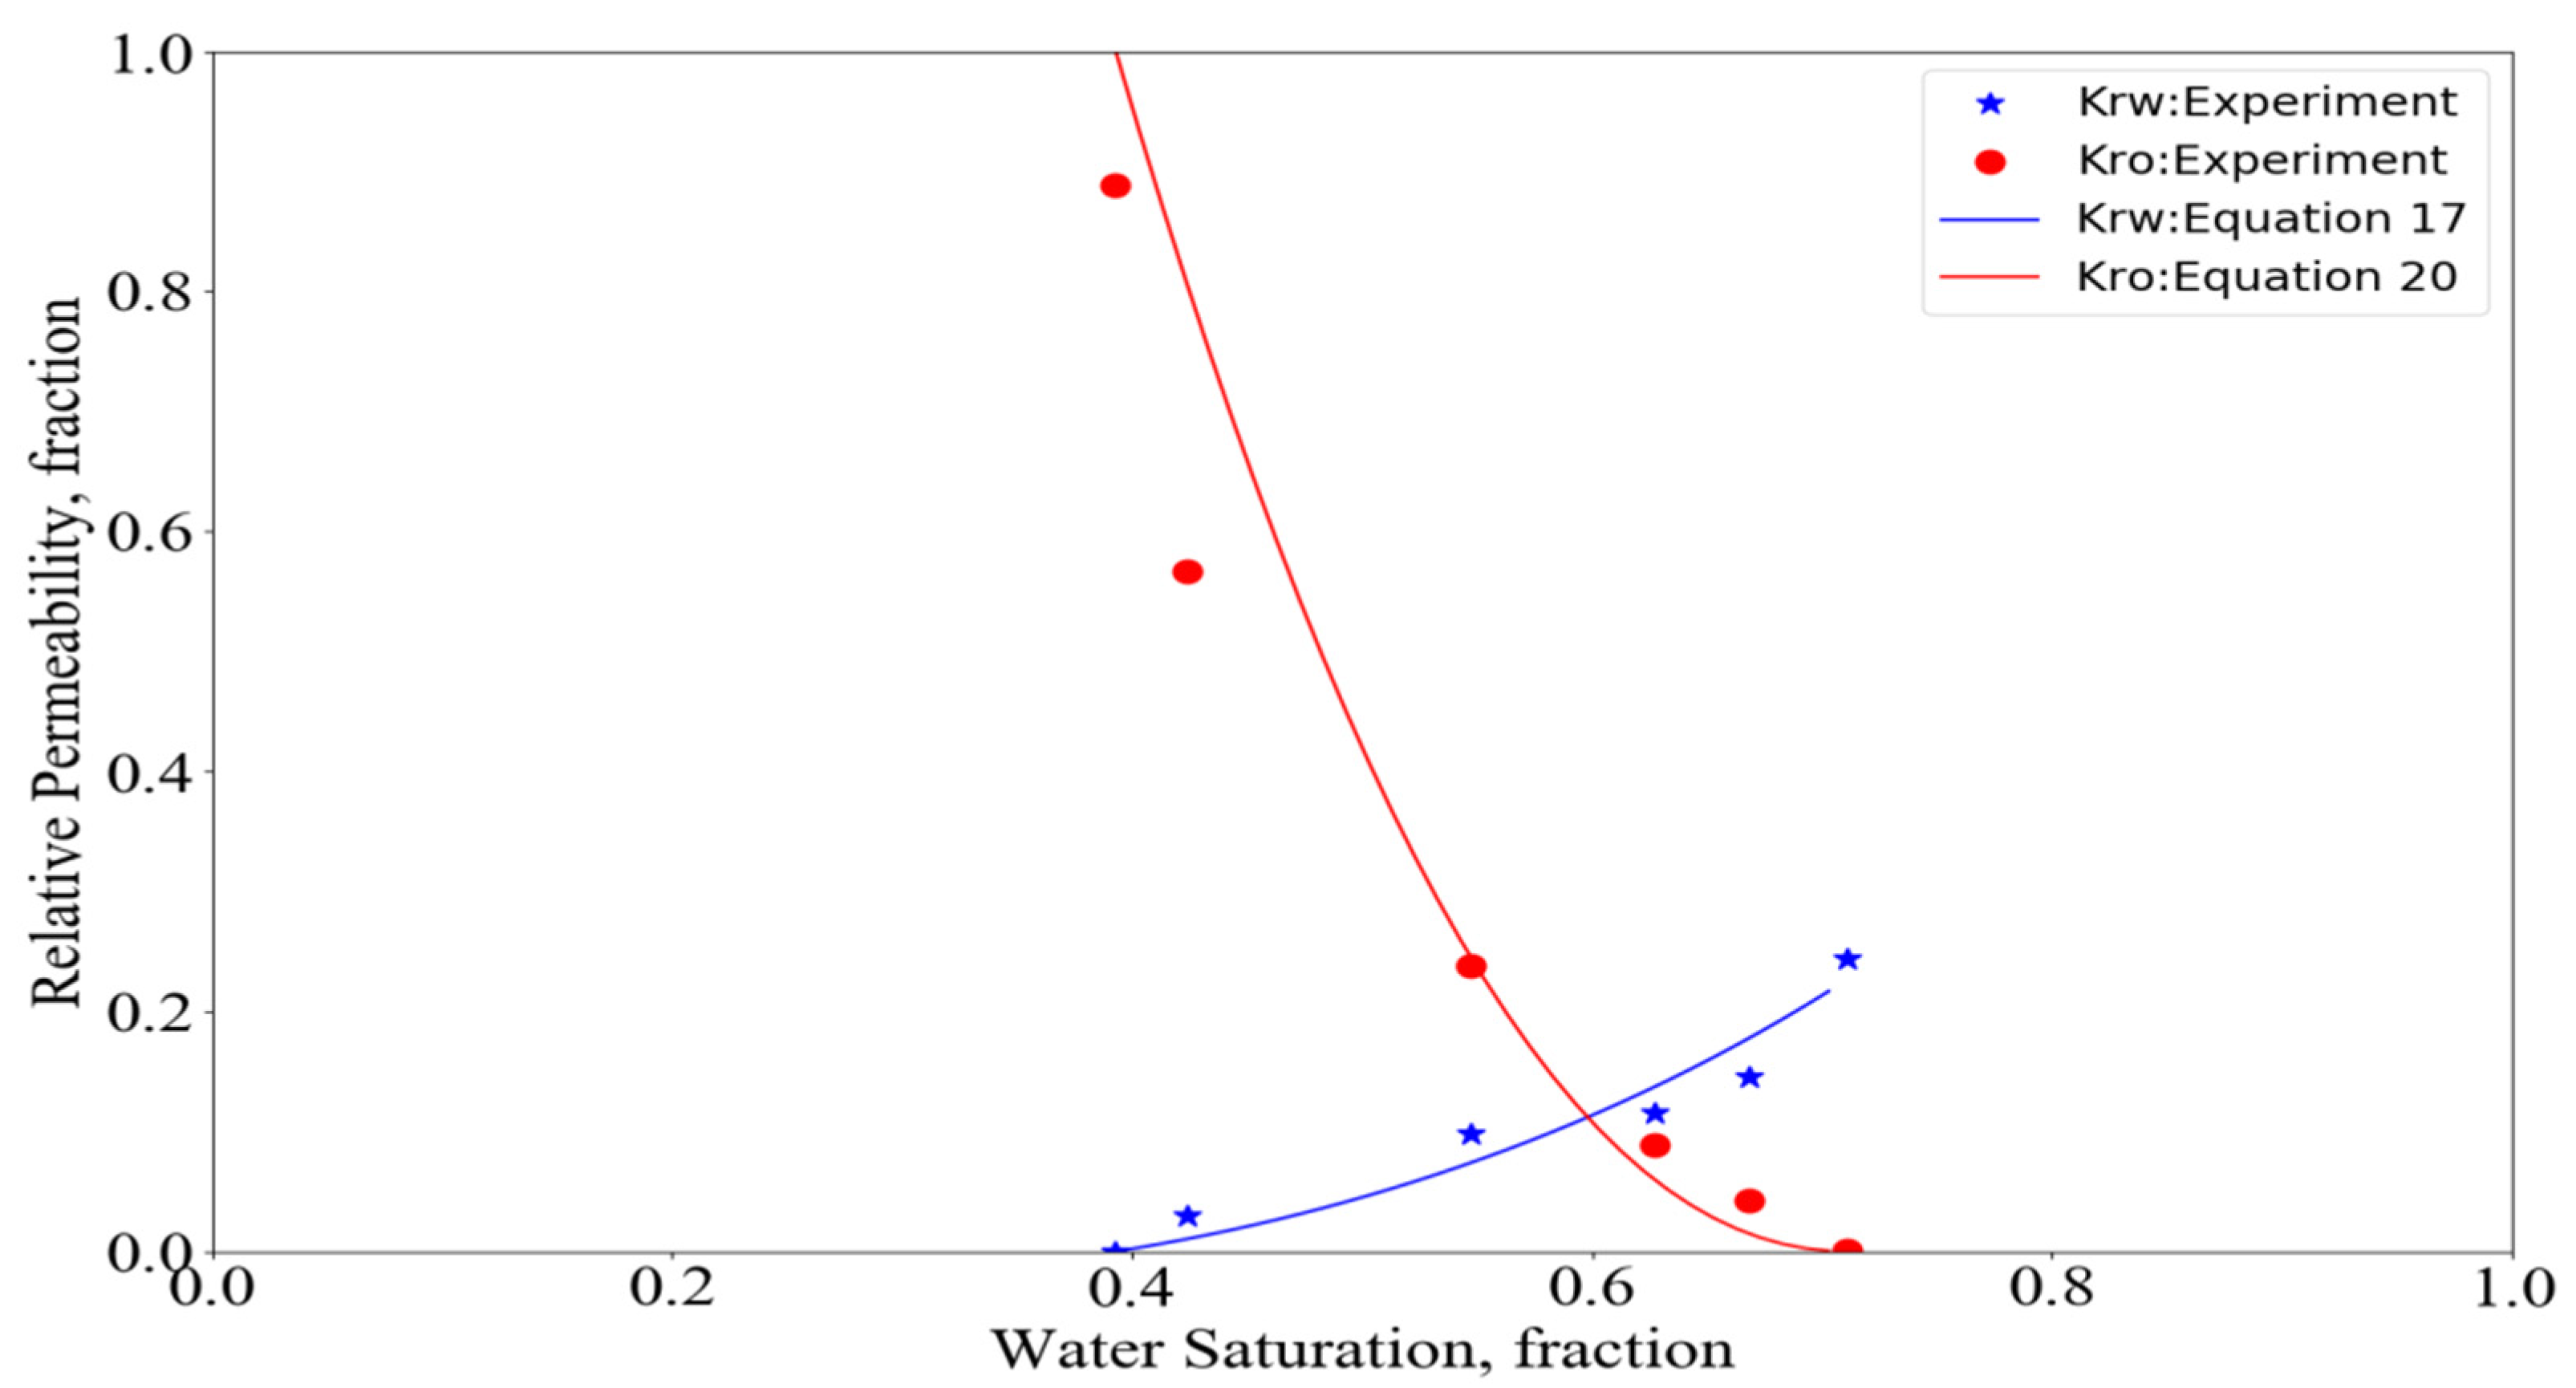
5.1. Comparison of Water-Wet Model Experiments

The calculated results were consistent with the experimental results of seven water-wet rock samples. B51-12 and J525-9 are two samples with great permeability differences. Figure 5 shows the comparison between the oil–water relative permeability calculated based on the resistivity and relative permeability water-wet model and the experimentally measured oil–water relative permeability of core sample B51-12. The obtained porosity was 19.75%, the air permeability was 0.67 × 10⁻³ μm2 and the resistivity amplification coefficient and water saturation fitting calculation, n, was 2.02. The wettability measurement results were water-wet, with an oil relative permeability correlation coefficient of 0.99 and a water relative permeability correlation coefficient of 0.96. Figure 6 shows the core sample J525-9, which had a porosity of24.83%, air permeability of 577.61 × 10⁻³ μm2 and a resistivity amplification coefficient and water saturation fitting calculation, n, of 1.07.The wettability measurement results were water-wet, with an oil relative permeability correlation coefficient of 0.94 and a water relative permeability correlation coefficient of 0.95.

5.2. Comparison of Neutral Wetting Model Experiments

The calculated results of 13 neutral wetted rock samples were consistent with the experimental results of 9 rock samples, but they were inconsistent with the experimental results of 4 rock samples.
For core sample J525-1, the porosity was 27.66%, the air permeability was 152.92 × 10⁻³ μm2, the resistivity amplification coefficient and water saturation fitting calculation, n, was 1.20, and the wettability measurement result was neutral. Figure 7 shows the comparison between the oil–water relative permeability of core sample A525-1 which calculated by the neutral wettability model of resistivity and relative permeability and the experimentally measured oil–water relative permeability. According to the calculation, the correlation coefficient of oil-phase relative permeability was 0.96 and that of the water-phase relative permeability was 0.94.
Rock samples B52-1, B52-2, B52-4 and B52-5 were not in good agreement with the experimental results, demonstrating the curve shape of ‘water phase downward concave’. Figure 8 shows the comparison between the calculated oil–water relative permeability of core sample B52-4 based on the water-wet model of resistivity and relative permeability and the experimentally determined oil–water relative permeability. This curve shape is generally believed to be caused by low porosity, low permeability, high clay content, high sensitivity to water expansion, blockage of pores and increased flow resistance [19]. According to the literature [20,21], the wettability of reservoir rock samples is related to fluid saturation; when the water saturation is very low, the water is not enough to form a network channel; the whole piece of rock is characterized by oil-wetness; when the water saturation is greater than a certain value, the water will form a network channel; rock is characterized by water-wetness; when water can form part of the network channels, rock is characterized by parts of water-wet parts of oil-wet neutral wetting. As water saturation increases, i.e., as the rock surface area of water-bearing pores increases, the wettability of reservoir rock samples gradually changes from oil-wet to water-wet. The relative permeability model established in this study can better explain this phenomenon, i.e., when the water saturation is low, the reservoir is oil-wet or neutral, and as the water saturation increases, the reservoir gradually becomes water-wet. This process shows the shape of the downward concave water phase on the phase permeability curve.

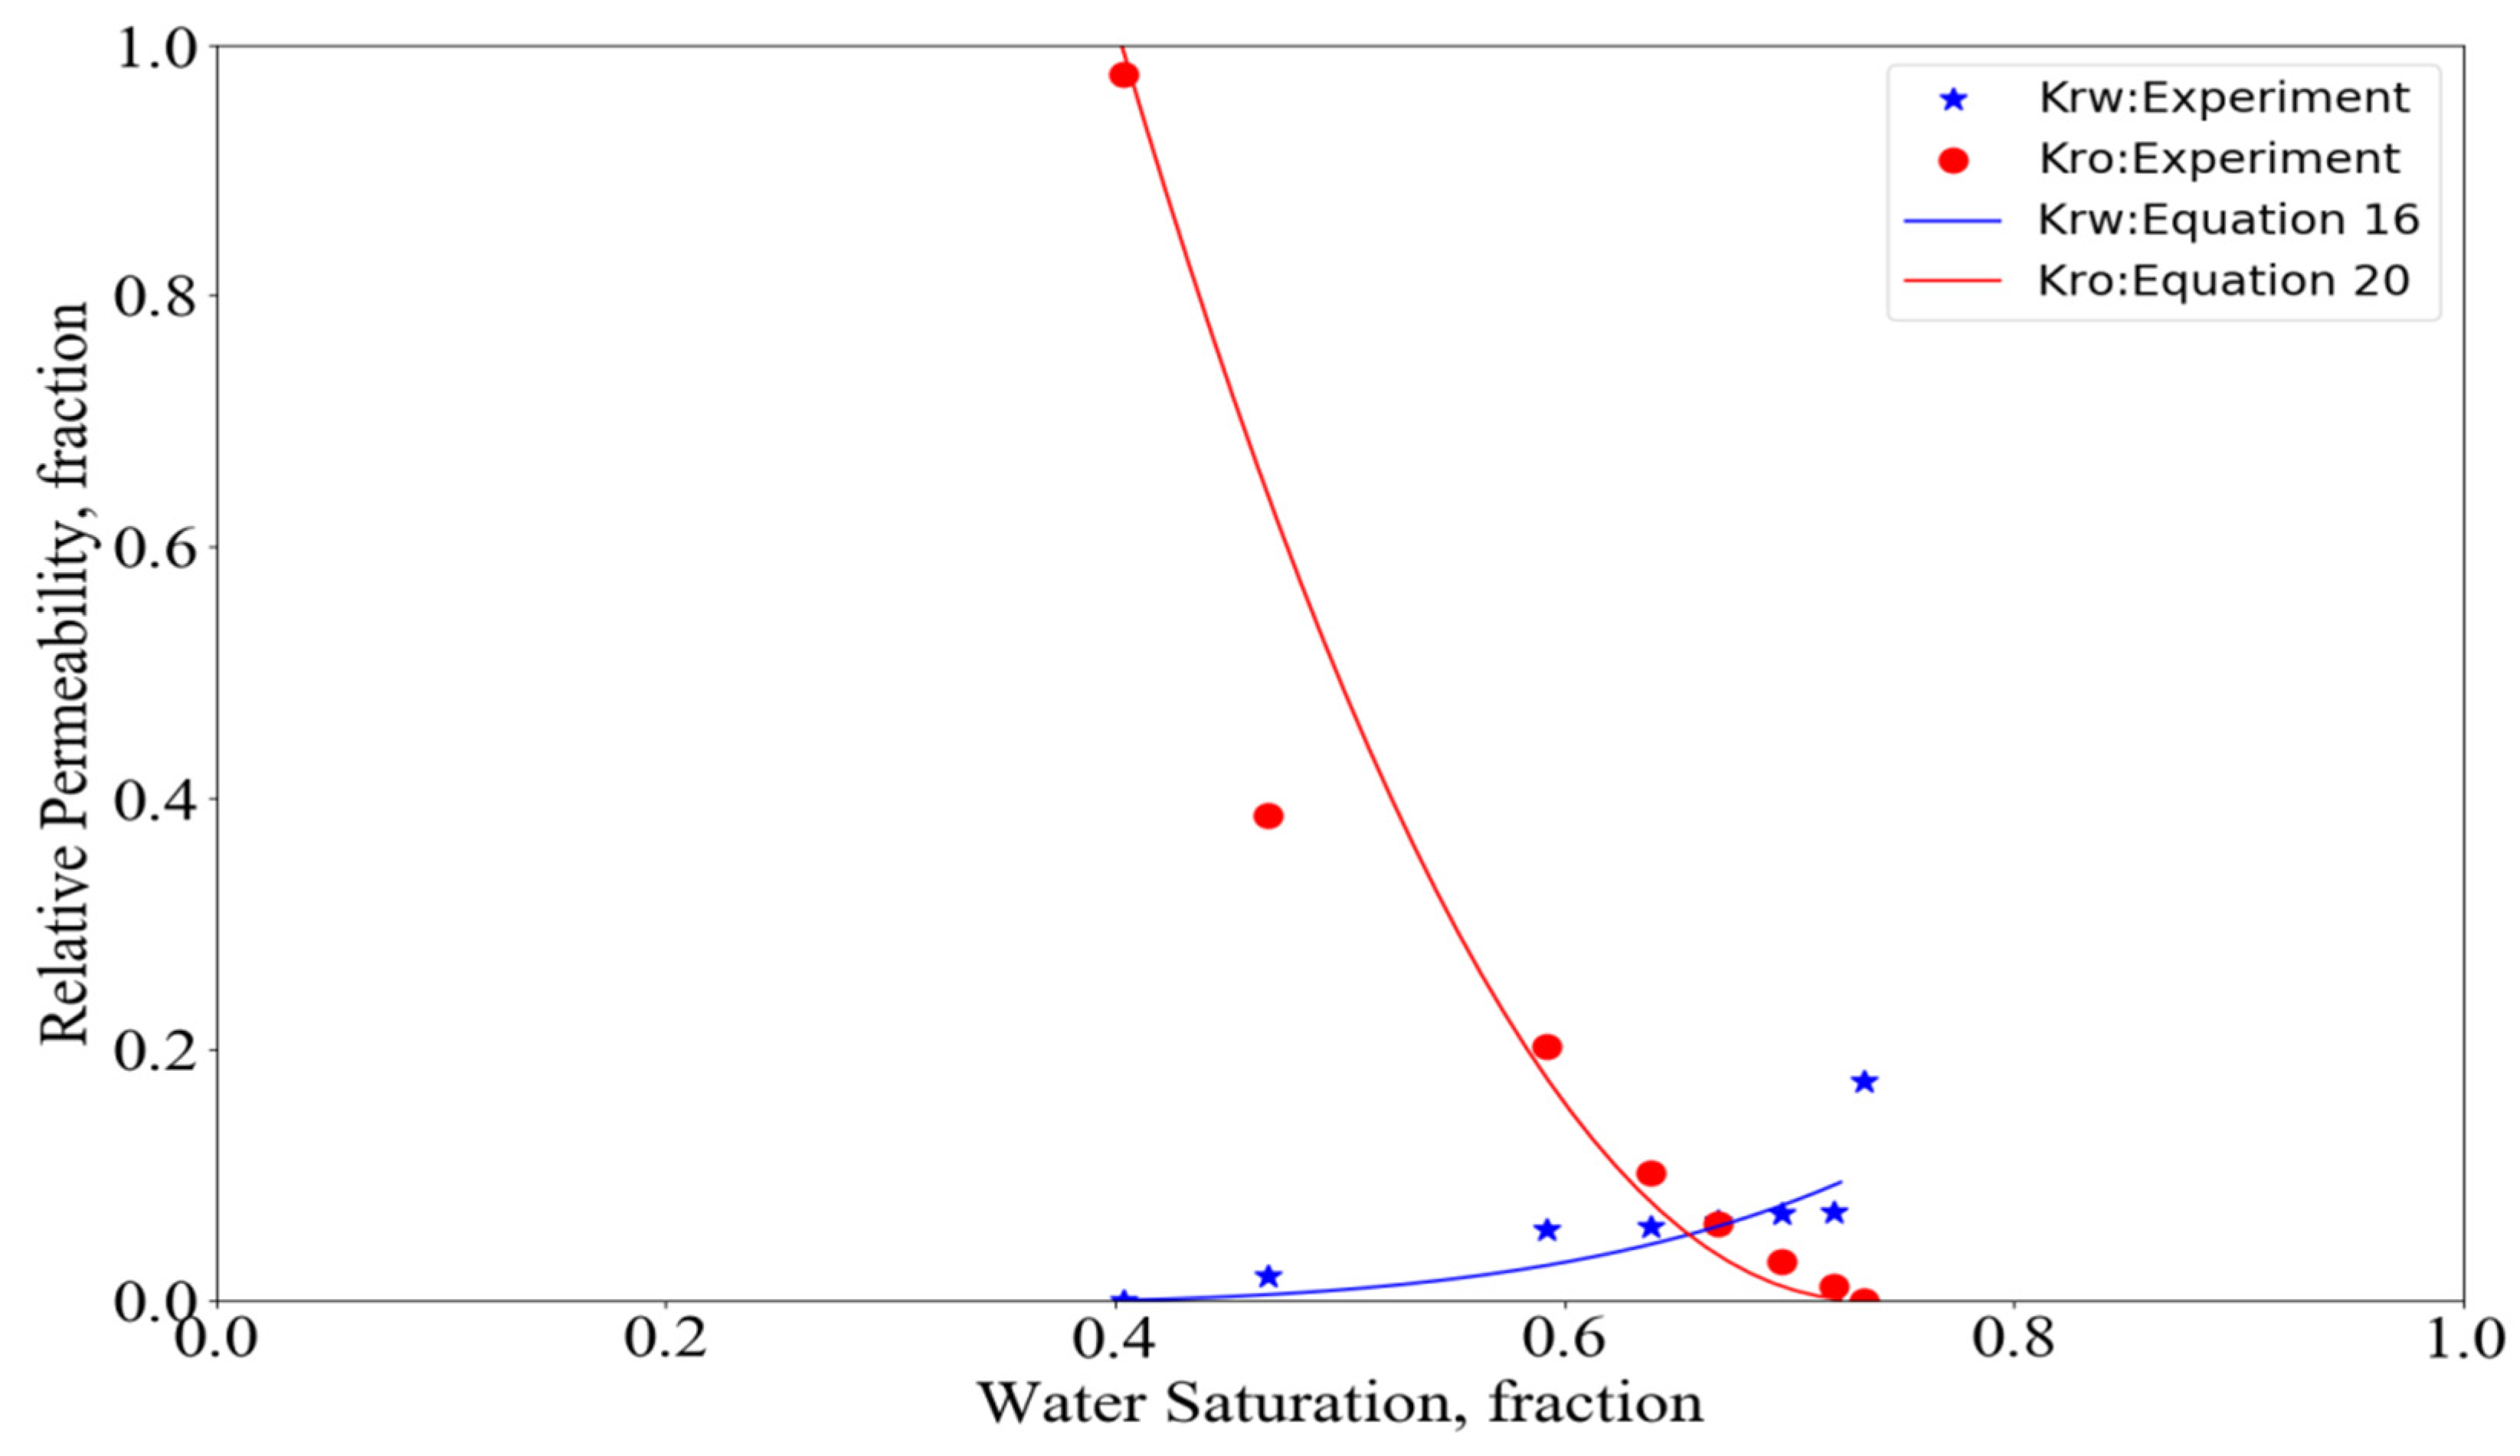
5.3. Oil–WaterRelative Permeability Curve

The oil–water two-phase relative permeability curve is a comprehensive reflection of the oil–water two-phase seepage characteristics, and it is also the basic law that must be followed in the oil–water two-phase seepage process. It has been widely used in the preparation of oilfield development plans, special research on oilfield development, and reservoir numerical simulation. Therefore, the oil–water two-phase relative permeability curve is not only an important basic theoretical problem for oilfield development, but also a widespread application problem.
The relation curve between oil–water phase relative permeability and water sat-uration is called the oil–water relative two-phase permeability curve, which is usually produced by water displacement of crude oil in the laboratory. As shown in Figure 9, with the increase in the water saturation Sw, the relative permeability kro of the oil phase decreases, and the relative permeability krw of the water phase increases.
As shown in Figure 9, with the increase in the water saturation Sw, the relative permeability kro of the oil phase decreases, and the relative permeability krw of the water phase increases.
The oil–water two-phase relative permeability curve has five characteristics:
(i)
Swi: irreducible water saturation, which corresponds to the maximum oil saturation Soi, that is, the original oil saturation;
(ii)
Sor: residual oil saturation, which corresponds to the maximum water saturation Swmax, Swmax = 1-Sor;
(iii)
kromax: relative permeability of the oil phase under irreducible water conditions (maximum);
(iv)
krwmax: relative permeability of the water phase under residual oil condition (maximum);
(v)
Isotonic point: the intersection of the relative permeability curves of the oil phase and the water phase.
According to the model derived in this study, the relative permeability is determined by rock wettability, saturation index, irreducible water saturation and residual oil saturation. Figure 9 shows the relative permeability curves of different saturation exponents under different wettability conditions. It shows that from oil-wet to medium-wet, and then to water-wet, the end value of the water phase decreases, and the isotonic point shifts to the right; the oil relative permeability curve shape has little change, which is consistent with the experimental phenomenon of relative permeability observed by us. At the same time, as the saturation index increases, the water phase endpoint value also decreases, and the isotonic point also shifts to the right, which implies that there is a relationship between the wettability of the rock and the saturation index.
Figure 10 shows the cross plot of resistivity and saturation index of the water-saturated formation. Obviously, the water-wet and medium-wet samples have clear boundaries on the map. The left side of the black boundary line is the water-wet sample, and the right side is the medium-wet sample. Among the samples, there is one water-wet sample in the medium-wet range, and the plate conincidence rate is 95%.
The relationship between saturation index and porosity is pointed out in Section 4. Since porosity is a parameter which is easy to obtain by using logging data, it can usually be calculated by using sonic logging, density logging or neutron logging data. Formation resistivity can also be calculated from logging curves of pure water layers. Previous studies have also shown that irreducible water saturation and residual oil saturation have a significant statistical relationship with formation porosity and shale content [22]. Therefore, the relative permeability curve can be estimated using logging data and the proposed model.

6. Conclusions

In this study, a water phase relative permeability model based on the resistivity amplification coefficient was established. The model confirms that rocks with different wettability have different water-phase relative permeability under the same saturation index. The model was verified using the resistivity increase coefficient and the experimental data of relative permeability. The results show that the model can accurately represent the relative permeability curves of oil and water phases of sandstone with different porosity and permeability. Therefore, the saturation index can be used to estimate the relative permeability curve, which provides a new way to obtain the relative permeability curve, according to the oil–water relative permeability model established in this paper. Since no oil-wet rock samples were obtained from this experiment, future research will focus on verifying the accuracy of the oil-wet model and exploring the use of logging curves to calculate relative permeability curves for different reservoirs.

Author Contributions

Conceptualization, J.P.; methodology, J.P. and Y.Z.; software, J.H. and X.Z.; validation, J.H. and J.Z.; investigation, Q.W. and J.Z.; writing—review and editing, X.Z. and H.G.; project administration, J.P.; funding acquisition, Y.Z.; All authors have read and agreed to the published version of the manuscript.

Funding

This research was funded by China National Natural Science Foundation (grant number 42172150).

Institutional Review Board Statement

Not applicable.

Informed Consent Statement

Not applicable.

Data Availability Statement

Not applicable.

Conflicts of Interest

The authors declare no conflict of interest.

References

  1. Corey, A.T. The interrelation between gas and oil relative permeabilities. Prod. Mon. 1954, 19, 38–41. [Google Scholar]
  2. Brooks, R.H. Properties of porous media affecting fluid flow. Proceedings of the American Society of Civil Engineers. J. Irrig. Drain. Div. 1966, 92, 61–88. [Google Scholar] [CrossRef]
  3. App, J.F.; Burger, J.E. Experimental determination of relative permeabilities for a rich gas/condensate system using live fluid. SPE Reserv. Eval. & Eng. 2009, 12, 263–269. [Google Scholar]
  4. Pirson, S.J.; Boatman, E.M.; Nettle, R.L. Prediction of relative permeability characteristics of intergranular reservoir rocks from electrical resistivity measurements. J. Pet. Technol. 1964, 16, 561–570. [Google Scholar] [CrossRef]
  5. Li, K.; Horne, R.N. A Semianalytical Method to Calculate Relative Permeability from Resistivity Well Logs: SPE Annual Technical Conference and Exhibition; Society of Petroleum Engineers: Dallas, TX, USA, 2005. [Google Scholar]
  6. Li, K.; Horne, R.N. Fractal modeling of capillary pressure curves for the Geysers rocks. Geothermics 2006, 35, 198–207. [Google Scholar] [CrossRef]
  7. Li, K. A new method for calculating two-phase relative permeability from resistivity data in porous media. Transp. Porous Media 2007, 74, 21–33. [Google Scholar] [CrossRef]
  8. Civan, F. Scale effect on porosity and permeability. Kinetics, model, and correlation. AIChEJ 2001, 47, 271–287. [Google Scholar] [CrossRef]
  9. He, Y.; Wu, Y.; Wu, N. A new method for quantitative prediction of relative permeability. J. Petrol. Explor. Dev. 2000, 27, 66–68. [Google Scholar]
  10. Andersen, P.Ø.; Skjæveland, S.M.; Standnes, D.C. A Novel Bounded Capillary Pressure Correlation With Application to Both Mixed and Strongly Wetted Porous Media. In Proceedings of the SPE Abu Dhabi International Petroleum Exhibition & Conference, Abu Dhabi, United Arab Emirates, 13–16 November 2017. [Google Scholar] [CrossRef]
  11. Andersen, P.Ø. Capillary Pressure Effects on Estimating the EOR Potential During Low Salinity and Smart Water Flooding. In Proceedings of the SPE Asia Pacific Oil and Gas Conference and Exhibition, Brisbane, Australia, 23–25 October 2018. [Google Scholar] [CrossRef]
  12. Ma, J.-B.; Tang, X.-G. Study on the Method of calculating rock permeability by using resistivity. J. Yangtze Univ. (Nat. Sci. Ed.) 2013, 10, 105–106, 122. [Google Scholar] [CrossRef]
  13. Carman, P.C. Permeability of saturated sands, soils and clays. J. Agric. Sci. 1939, 29, 263–273. [Google Scholar] [CrossRef]
  14. Tsakiroglou Christos, D. The correlation of the steady-state gas/water relative permeabilities of porous media with gas and water capillary numbers. Oil Gas Sci. Technol. 2019, 74, 11. [Google Scholar] [CrossRef]
  15. Liu, J.; Liao, D.; Ge, X. Calculation method of relative permeability of water phase based on Kozeny-Carman Equation. J. Sci. Technol. Eng. 2012, 12, 7500–7503. [Google Scholar]
  16. Moghadasi, L.; Guadagnini, A.; Inzoli, F.; Bartosek, M.; Renna, D. Characterization of two- and three-phase relative permeability of water-wet porous media through X-ray saturation measurements. J. Pet. Sci. Eng. 2016, 145, 453–463. [Google Scholar] [CrossRef]
  17. Bai, S.; Wan, J.; Cheng, D.; Li, G.; Zhao, J.; Yang, L.; Wang, M. A study on the relationship between capillary pressure, nuclear magnetic resonance τ_2 spectrum, resistivity increase rate and relative permeability in rock physics experiments. J. Chengdu Univ. Technol. (Nat. Sci. Ed.) 2014, 41, 483–491. [Google Scholar]
  18. Olivar, A.L.; De, L.; Wang, Y.-J. Determination of water saturation and permeability using resistivity, dielectric and porosity logging curves. J. For. Pet. Explor. 1997, 9, 110–118. [Google Scholar]
  19. Wang, G.; Xie, J.; Li, J.; Tan, W.; Du, J.; Wang, H.; Wan, W. Reservoir relative permeability curve shape and production characteristics. Xinjiang Pet. Geol. 2004, 25, 301–304. [Google Scholar]
  20. Li, D. Low Permeability Oilfield Development; Petroleum Industry Press: Beijing, China, 1997; pp. 114–153. [Google Scholar]
  21. Yao, F.; Yao, T.; Li, J. Characteristics and factors of reversal of reservoir wettability. Pet. Geol. Recovery Effic. 2007, 14, 76–78. (In Chinese) [Google Scholar]
  22. Wang, S.; Zhao, G.; Yu, B. Statistical law of oil-water relative permeability and its application in daqing oilfield. J. Acta Pet. Sin. 2005, 36, 78–85. [Google Scholar]
  23. Marsden, S.S.; Ramey, H.J.; Sanyal, S.K. The Effect Of Temperature On Electrical Resistivity of Porous Media. Log Analyst 1973, 14, 10–24. [Google Scholar]
  24. Wells, J.D.; Amaefule, J.O. Capillary Pressure and Permeability Relationships in Tight Gas Sands. In Proceedings of the SPE/DOE Low Permeability Gas Reservoirs Symposium, Denver, CO, USA, 19–22 March 1985. [Google Scholar]
  25. Longeron, D.G.; Argaud, M.J.; Feraud, J.P. Effect of overburden pressure and the nature and microscopic distribution of fluids on electrical properties of rock samples. SPE Form. Eval. 1989, 4, 194–202. [Google Scholar] [CrossRef]
  26. Szabo, M.T. New methods for measuring imbibition capillary pressure and electrical resistivity curves by centrifuge. Soc. Pet. Eng. J. 1974, 14, 243–252. [Google Scholar] [CrossRef]
  27. Archie, G.E. The electrical resistivity log as an aid in determining some reservoir characteristics. Trans. AIME 1942, 146, 54–62. [Google Scholar] [CrossRef]
  28. Shabani, B.; Kazemzadeh, E.; Entezari, A.; Aladaghloo, J.; Mohammadi, S. The Calculation of Oil-water Relative Permeability From Capillary Pressure Data in an Oil-wet Porous Media: Case Study in a Dolomite Reservoir. Pet. Sci. Technol. 2014, 32, 38–50. [Google Scholar] [CrossRef]
  29. Zeinijahromi, A.; Rouhi, F.; Bruining (Hans), J.; Pavel, B. Effect of fines migration on oil–water relative permeability during two-phase flow in porous media. Fuel 2016, 176, 222–236. [Google Scholar] [CrossRef]
  30. Marios, S.; Valavanides; Mascle, M.; Youssef, S.; Vizika, O. Steady-State Two-Phase Flow in Porous Media: Laboratory Validation of Flow-Dependent Relative Permeability Scaling. In Proceedings of the International Symposium of the Society of Core Analysts, Pau, France, 26–30 August 2019; SCA. [Google Scholar]
  31. Olugbenga, F.; Edo, M. Wettability effects on capillary pressure, relative permeability, and irredcucible saturation using porous plate. J. Pet. Eng. 2014, 2014, 1–12. [Google Scholar]
Figure 1. Rock physical volume model of porous media.
Processes 10 01211 g001
Figure 2. Schematic of the apparatus used for the combined measurements of oil–water relative permeability and resistivity. Red line represents oil, blue line represents water or gas, orange line represents vacuum-saturated water, and black line represents wire.
Processes 10 01211 g002
Figure 3. Relationship between resistivity-increasing coefficient and water saturation of rock sample.
Processes 10 01211 g003
Figure 4. Relationship between saturation index and porosity. The red dots represent the saturation index at different porosity.
Processes 10 01211 g004
Figure 5. Comparison of experimental and calculated relative permeability in core sample B51-12.
Processes 10 01211 g005
Figure 6. Comparison of experimental and calculated relative permeability in core sample J525-9.
Processes 10 01211 g006
Figure 7. Comparison of experimental and calculated relative permeability in core sample A525-1.
Processes 10 01211 g007
Figure 8. Comparison of experimental and calculated relative permeability in core sample B52-4.
Processes 10 01211 g008
Figure 9. Oil–water relative permeability curve with different wettability and saturation index.
Processes 10 01211 g009
Figure 10. Cross plot of water-saturated formation resistivity and saturation index.
Processes 10 01211 g010
Table 1. Properties of core samples.
Core No.L
(cm)
D
(cm)
Φ
(f)
Kw
(md)
Swi
(%)
Sor
(%)
R0
(Ω m.)
nWettability
J525-15.1502.55427.66152.9239.328.915.1431.20Middle wet
J525-35.5102.54927.42308.7130.829.813.5161.08Water-wet
J525-57.3622.54824.64103.5434.235.512.3531.35Middle wet
J525-66.8902.54726.8654.0035.928.810.5021.56Middle wet
J525-77.0632.56626.61620.3032.322.710.9771.44Water-wet
J525-96.7372.54824.83577.6133.530.211.5921.07Water-wet
J525-107.3632.55426.86479.7422.229.610.7481.76Middle wet
B52-16.6972.58917.6232.8526.139.216.8960.78Middle wet
B52-27.2242.55626.89260.3230.917.515.2901.47Middle wet
B52-46.3252.53521.439.6348.614.418.3511.69Middle wet
B52-57.4242.55120.72140.8121.826.424.9861.54Middle wet
B52-76.4362.55124.8799.1230.23333.2141.15Middle wet
B52-85.1582.55224.3175.3240.326.713.1021.76Water-wet
B52-97.5722.55527.33973.1337.324.612.7431.46Middle wet
B52-106.7242.54930.7744.5634.433.49.64950.83Water-wet
B59-117.8712.53219.172.7056.627.99.4012.04Middle wet
B59-146.4522.52219.113.4153.029.58.8452.14Middle wet
B51-127.2212.55019.750.6159.826.88.3792.02Water-wet
B57-147.8502.55118.180.1664.724.06.5511.92Water-wet
Table 2. Correlation coefficients of the calculated and measured oil/water relative permeability in core samples.
Core No.R2_OilR2_WaterCore No.R2_OilR2_Water
J525-10.960.94B52-50.830.67
J525-30.980.96B52-70.990.93
J525-50.950.96B52-80.960.94
J525-60.960.97B52-90.930.94
J525-70.930.97B52-100.950.95
J525-90.940.95B59-110.990.96
J525-100.980.92B59-140.960.98
B52-10.920.66B51-120.990.96
B52-20.880.62B57-140.930.97
B52-40.990.68
Publisher’s Note: MDPI stays neutral with regard to jurisdictional claims in published maps and institutional affiliations.

