Abstract
Due to the strong demand for organic light-emitting diode (OLED) display products and the highly competitive global market, OLED enterprises need to proactively make product innovations for presuming business competitive advantage, high sales, high profits, high customer consuming value, and the sustainability of the enterprise. A suitable multi-criteria decision-making (MCDM) model for OLED new product development (NPD) can help OLED enterprises’ R&D team to minimize risks and maximize the success rate of NPD. However, the literature reviews of the MCDM model for OLED NPD are very rare. This study aims to propose the approaches for establishing an integrated MCDM model for OLED NPD that apply three methodologies which include the literature review and expert panel, Interpretive structural modeling (ISM), and Fuzzy analytic network process (FANP). Meanwhile, after the implication of the proposed approaches in the case study of Taiwan OLED NPD, this study proposes an integrated MCDM model for OLED NPD in Taiwan. The research results reveal fifteen evaluation criteria of OLED NPD and their relative weight. Furthermore, the research results reveal the top three important criteria are return on investment, expert research and industry evaluation, and R&D funding preparation. The proposed approaches can be applied in other industries for establishing an integrated MCDM model for their own NPD. The proposed integrated MCDM model for OLED NPD in Taiwan can help enterprises in the Taiwan OLED industry to develop new OLED products in an efficient way and to boost sales, profits, and competitive advantages. Besides, this study enriches the research references of MCDM model for NPD and OLED field.
1. Introduction
Display technology has become ubiquitous in our daily life; its widespread applications cover smartphones, tablets, desktop monitors, TVs, data projectors and augmented reality/virtual reality devices [1]. Organic light-emitting diode displays have grown rapidly, enabling foldable smartphones and rollable TVs [2]. As per the IDTechEx report, OLEDs for cellphones and TVs dominate the OLED sector, comprising 78% and 17% of the OLED market revenue in 2020, respectively [3]. According to the Global OLED Display Market reported the global OLED display market is valued at 42,490 million US$ in 2020 and is expected to reach 185,830 million US$ by the end of 2026, growing at a compound annual growth rate (CAGR) of 23.2% during 2021–2026 [4]. Furthermore, the International Data Corporation (IDC) study presents the worldwide smartphone market will reach 1.38 billion units shipped in 2022, up 1.6% from the 1.36 billion units shipped in 2021 [5]. According to above descriptions and the coming age of 5G and Artificial intelligence, the OLED displays industry is a crucial and highly competitive industry.
Under the challenge of rapid technological change, the dramatic shrinkage of product life cycles and the incessant advent of competitors in the market, new product development is vital for the survival and growth of enterprises [6] and is considered a key strategic activity that is critical to long term success [7]. Product innovation, valid quality, and low cost are three major competitive advantages for present worldwide enterprises. To execute product innovation, the NPD process and methodology need to be accurately and efficiently planned. Successful NPD can lead to great enterprise sales, profits, and competitive advantages; however, due to the complexity of the NPD process, the failure rate of new products is highly significant [8]. About 40% of new products are estimated to fail at launch, even after all the development and testing work; and only 13% of firms report that their total new product efforts achieve their annual profit objectives [9]. NPD involves five performance indicators: new products, manufacturing methods, markets, materials, and parts. New products are usually a source of new sales and profits [10] and can bring internal benefits such as technology and cost [11]. Therefore, enterprises proactively determine how to systematically apply a set of rigorous analyses of the NPD process to minimize development risks and maximize the success rate of new products has become a challengeable and vital business development issue.
Performance assessment for NPD project is very important in any industry [12]. This assessment of NPD project performance is a multi-criteria decision-making problem. MCDM is considered as a complex decision-making tool involving both quantitative and qualitative factors [13]. Furthermore, MCDM has grown as a part of operational research, concerning with designing computational and mathematical tools for supporting the subjective evaluation of performance criteria by decision makers [14]. Several studies have been published that proposed the MCDM model for their own specific selection or optimization problem [15,16,17,18,19,20,21]. There are many techniques that can be applied to MCDM model. The first category of techniques applied in MCDM is the technique to identify the crucial criteria for NPD, e.g., literature reviews, expert panel, Delphi, Fuzzy Delphi method (FDM), etc. Second category of technique that applying in MCDM is the technique to identify the interrelationships among those criteria, e.g., Interpretive structural modeling, Fuzzy ISM (FISM), Decision making trial and evaluation laboratory (DEMATEL), Fuzzy DEMATEL (FDEMATEL), etc. The third category of technique that applying in MCDM is the technique to determine the relative importance weights of criteria, e.g., Analytic hierarchy process (AHP), Analytic network process (ANP), Fuzzy analytic hierarchy process (FAHP), Fuzzy analytic network process (FANP), Artificial neural network (ANN), etc. Chen et al. [12] proposed a complete MCDM model that integrating FDM, FDEMATEL, FANP, and CPV for NPD in an LED-Based Lighting Plant Factory. The final category of technique that applying in MCDM is the technique to evaluate and select the optimal decision alternative, e.g., a technique for order of preference by similarity to ideal solution (TOPSIS), evaluation based on distance from average solution (EDAS), VlseKriterijumska Optimizacija I Kompromisno Resenje (VIKOR), multi-objective optimization on the basis of ratio analysis (MOORA), Data Envelopment Analysis (DEA), etc. Yang and Wang [22] developed an integrated MCDM model using the FAHP and the fuzzy TOPSIS (F TOPSIS) to analyze suppliers to implement green innovation criteria for SSCM practices in the textile manufacturing companies of China. Wang et al. [23] proposed an integrated MCDM model combining FANP and TOPSIS for wave energy plant location selection. Bathaei et al. [24] proposed an integrated MCDM model combining FANP and VIKOR to evaluate the green agile factors and sub-factors in the dairy companies in Iran.
According to above descriptions, companies in the OLED industry should strongly need to obtain a solid MCDM model for their NPD project to boost company’s sales, profits, and competitive advantages. However, there is a general dearth of MCDM model for NPD in the OLED relative research field. Only, Shen et al. [25] proposed a hybrid technology selection process integrating FDM, DEMATEL, ANP, and PCA for the best OLED technology selection. Their research result indicates that OLED structural design and material development is the most significant technology field for Taiwan OLED industry. However, their MCDM model cannot help OLED manufacturer to determine what crucial criteria should be noticed and arrange well as well as to select optimum NPD alternatives. Therefore, this study aims to propose an integrated MCDM model for OLED NPD that apply the literature review and expert panel, ISM, and FANP. The contribution of this research is to propose an integrated MCDM model for OLED NPD and to enrich the research references of MCDM model for NPD/OLED field. Besides, the enterprises in the OLED industry can implicate this MCDM model to develop new OLED products in an efficient way and to boost sales, profits, and competitive advantages.
The rest of this study is organized as follows. Section 2 goes through the literature on the subjects and methodologies adopted in this study. Section 3 describes the approaches for establishing an integrated MCDM model for OLED NPD. Section 4 verifies the practicality of the proposed approaches and establish an integrated MCDM model for OLED NPD by the case study of Taiwan OLED NPD. The final section gives a conclusion and discussion.
2. Literature Review
2.1. Interpretive Structural Modeling
ISM is an interactive learning process that involves expert interviews and pairwise comparison matrix analysis. The ISM process involves disassembling a complex system into several pieces by using practical experience and expert knowledge. The different and directly related elements of the complex system are integrated to form a model with a complete, multilevel system architecture [26,27,28]. ISM entails interpreting the relevance of elements at each level on the basis of Bollinger Bands, which are based on the discrete mathematics of binary logic. In addition, ISM involves applying the basic concepts of hierarchical structures in graph theory to determine the influence and importance of the relationships between the elements at each level. Regarding problem structures, Warfield [29] proposed a method for determining the relevant elements of the problem and constructed the ISM framework through the integration and comparison of information. As the complexity of a system structure increases, interpreting the structural model becomes increasingly necessary. Tatsuoka [30] suggested supplementing the correlation between conceptual elements, integrating these elements (exhibiting specific and potentially strong relationships) into n × n-order square matrices, and multiplying them using Bollinger algebra matrices (e.g., Boolean [M*M*M…], where M is the dependency matrix) until stable and unchanged “0” and “1” matrix elements were obtained. Finally, the researcher compared the final or reachability matrix with the original dependency matrix M to obtain the new intersection point.
ISM has been applied in various research fields to identify the interrelationships between structural elements. Attri et al. [31] conducted a comprehensive review of crucial ISM concepts. In ISM research, various applications are highly extensive, but the final directed graph is typically ignored. A directed graph is drawn by connecting the nodes of the reachability matrix and the influence correlation graph, with the arrows constituting the edge lines [31,32,33,34,35]. Vittal and Shivraj [36] employed ISM to illustrate the elements of information technology, knowledge management, and environmental improvement, and they identified crucial factors affecting project management performance and cost structure. Chirra and Kumar [37] evaluated 14 decision factors of the automotive component manufacturing industry provided by supply chain experts, and they identified the interaction (dependency) relationships and hierarchical structural models of the factors by using an ISM questionnaire. Bhattacharya and Momaya [38] applied ISM to analyze issues pertaining to the quality and delivery of complex projects, effectively improving the operational capabilities of Indian engineering and construction companies and satisfying customer requirements. Wang et al. [39] used a hybrid process combining ISM and other methods to effectively evaluate the feasibility of regional regeneration and reconstruction. Lee et al. [40] proposed a new technology transfer evaluation framework for high-tech industries, emphasizing that ISM can be used to determine the interdependence between the crucial elements or factors of new technology transfer; they then combined ISM with FANP to evaluate the migration effectiveness of equipment supplier technology. ISM can be used to convert an inferior mental imagery model into a well-defined visual hierarchical model that can efficiently solve current problems [41] and promote understanding of the direct and indirect influences of the relationship between a system and its individual-level elements [42]. ISM requires experts with experience and knowledge in relevant fields to efficiently classify hierarchical elements and construct a multilevel model [43]. Rana et al. [44] suggested that ISM and the Cross-Impact Matrix Multiplication Applied to Classification approach could help the management personnel of small or medium-sized enterprises (SMEs) avoid adopting mobile commerce practices, as SMEs typically do. Tan et al. [45] applied ISM to evaluate the influence of the relationships between the barriers involved in building information modeling practices. Chirra and Kumar [37] analyzed the flexibility of an automobile supply chain under sales promotional schemes (SPS) to meet the demand uncertainty by applying ISM. Liang et al. [46] adopted DEMATEL-ISM method to identify and analyze the influencing factors of electric vehicle charging stations (EVCS) have been built in China.
2.2. Analytic Network Process
The ANP is an advanced decision-making model based on the AHP proposed by Saaty [47]. At the same level, the elements of control and influence are independent of each other in the AHP. However, such elements may be mutually influential in reality (e.g., dependence and feedback). Therefore, Saaty [48] proposed the ANP, which was intended to comprehensively improve the interdependence and feedback that can occur in the traditional AHP hierarchy. In the ANP, the factors affected by decision-making are no longer limited to the linear structure flowing from the upper layer to the lower layer; rather, they behave more like a network structure. Each level factor can affect other level factors, and each level factor can also affect its own existing level factors. This is called the feedback effect.
The ANP allows for the feedback effect between factors on the same level (such as the dimension or criterion level), which is called internal dependence. In addition, the ANP allows for the feedback effect between clusters at different levels (such as the dimension or criterion level), which is called external dependence. Researchers on decision-making can use an ANP questionnaire (9-point scale) to pair each element and calculate the feature vector to evaluate the weight priority vectors of all dimensions and criterion levels as well as the clusters and dimensions within clusters. Next, the final decision-making priority of the selection plan can be derived. The ANP method is presented in a nonlinear network structure, which can be used to understand the interaction or interdependence between factors. By contrast, the traditional AHP method only has a one-way, single-dominant linear hierarchical structure [49].
The elements of each ANP level are presented in a network structure. By statistically analyzing the interdependence and influence of the elements of each level by using an expert questionnaire, researchers can obtain a clear understanding of the relationship between the dimensions and the criteria. Saaty [48] used a super-matrix model to calculate the weights of each element, which can be used to determine the interdependence and strength of each dimension and criterion. A super-matrix can be formed using the influence limit between control criteria and each super-matrix is weighted appropriately through a comprehensive evaluation according to its own priority in the control hierarchy [50]. A super-matrix is a combination of multiple sub-matrices, which are feature vectors obtained by interactively comparing dimension elements and criterion elements at various levels. If the super-matrix contains blanks or zeros, the groups or elements are entirely independent of each other. Saaty [51] proposed a super-matrix for hierarchical and holarchical structures. The difference between hierarchical and holarchical structures is that the submatrix in the last row and column of a hierarchical structure is the identity matrix I; by contrast, the super-matrix in the bottom layer of a holarchical structure is connected to the top level, or dependence loop, and the construction is complete. A hierarchy’s cluster of structures (clusters or components) is constructed by gradually connecting the structures to one another and to the inner dependence loop.
The ANPs are widely used to explore the dependency between decision factors and decision-making priority [52,53,54]. In the evaluation of a paired upside-down comparison, a 9-point scale (and occasionally the semantic ambiguity of questionnaire questions) can cause participants to feel subjectively uncertain when completing a questionnaire, thereby leading to uncertainty in decision evaluation [55]. The purpose of the FANP is to solve complex problems through the concept of fuzzy weight, select the superior solution, and make the most appropriate decision. Mikhailov and Singh [56] used linguistic appraisal and fuzzy arithmetic operations to insert fuzzy numbers into a super-matrix to solve the ambiguity problems generated during criterion measurement and judgment. They conducted extensive research involving the use of the ANP to explore human preferences, and they used the α-Cut method to transfer the fuzzy value to an appropriate range of weight values to facilitate the design of a decision-making system. Büyüközkan et al. [57] used semantic evaluation, a fuzzy algorithm, and the fuzzy number of the super-matrix to solve a fuzzy problem of criterion selection and judgment.
The ANP and fuzzy theory can be combined to explain the fuzzy consensus between the dimension and the criterion elements through a group’s evaluation viewpoint (questionnaire). Mohanty et al. [58] applied the FANP to analyze investment risks and uncertainties and used fuzzy cost analysis to select the best research and design (R&D) project. Promentilla et al. [59] applied FANP techniques to analyze pollution sources and evaluate improvement countermeasures. The researchers also applied the α-cut method, interval arithmetic operations, and a fuzzy optimization index to define a matrix and identify the eigenvector value. To determine the relative priority of weights, each paired comparison matrix represents the subjective opinion of the decision-maker. Chen and Chang [60] used ISM to obtain the influence interdependence between various dimensions and criteria and used the FANP to determine the most important priority weights for a company’s improvement projects based on NPD. Yu and Cheng [61] developed fuzzy preference programming to complement the FANP. Chen et al. [12] evaluated the performance of the NPD decision-making process at a light-emitting diode (LED) factory. The researchers used the FDM to identify crucial factors and FDEMATEL to obtain the structure on the basis of the interdependence between the dimensions and the criteria. In addition, the researchers used the FANP to obtain the relative weights of the criteria, the four major objects affecting the company’s NPD decision-making plan, and the priority of 11 criteria. Wang et al. [23] proposed an integrated MCDM model combining FANP and TOPSIS for wave energy plant location selection. Bathaei et al. [24] proposed an integrated MCDM model combining FANP and VIKOR to evaluate the green agile factors and sub-factors in the dairy companies in Iran.
3. The Establishing Approaches of Proposed MCDM Model for OLED NPD
Because of the substantial demand and the market competition for OLED products, OLED manufacturers must carefully evaluate the key elements (factors) that may determine the success of their NPD projects and then make timely and effective decisions to ensure that their companies can have a continuous competitive advantage. This study aims to propose an integrated MCDM model that applies the literature review and expert panel, ISM, and FANP for NPD in the OLED industry. The procedure passes through three stages with the above two techniques to complete this study. In the first stage, criteria affecting NPD are collected, analyzed, and decided from the related literature review and expert panel in the OLED NPD. In the second stage, an ISM is managed to construct the hierarchical structure, and the expert questionnaire was responded to by OLED NPD experts and used to transform the relationship matrix into a reachability matrix on the basis of the external dependence of the criterion level and internal feedback, construct the dependence relationship between the criteria, and confirm the structural diagram of the ISM influence level of the relationship. In the third stage, a limit super-matrix is created by using a FANP, and the weights of all the criteria are computed. A determination of the ranking weights shows the priority of the critical success factors in the OLED new product project. The framework for establishing the proposed integrated MCDM model for OLED NPD is shown in Figure 1.
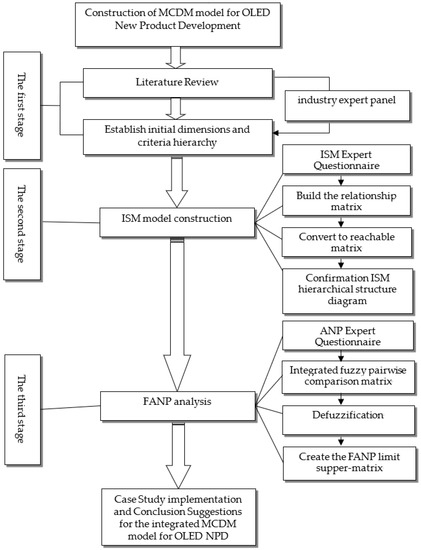
Figure 1.
The framework for establishing an integrated MCDM model for OLED NPD.
3.1. Identifying the Crucial Dimensions and Criteria of OLED NPD
This study identifies the crucial dimensions and criteria of OLED NPD by the method of related literature review and expert panel in the OLED industry. The expert of the expert panel must be a person who has substantial experience and knowledge of NPD in the OLED industry.
3.2. Forming the SIM Network Structure
A hierarchical structure is formed based on the relationship among the criteria and within the criteria by utilizing the ISM method. The approach for forming an ISM network structure is listed in the following steps.
Step 1: Build the relationship matrix.
The ISM expert questionnaire is developed and sent to industry experts (the person numbers = N) for completion. Next, the results of the N completed questionnaires are analyzed. When n elements in the decision analysis system were constructed using dimensions and the guidelines, the elements were divided by 2 to compare their mutual influence relationships. Elements with highly influential relationships were marked as “1” and those without highly influential relationships were marked as “0” (a relationship was considered to have a high degree of influence when N − 1 or more experts considered it to be influential). The binary relational matrix of influence is expressed as in Equation (1). In addition, the relational matrix D represents the correlation between the elements, and among them, Xi and Xj represent the eith and ejth elements, respectively, and the relationship between the two is represented by Xij. Therefore, if an influential relationship exists between Xi and Xj, then πij = 1, and if no influential relationship exists, then πij = 0.
Step 2: Calculate the reachability matrix.
To calculate the reachability matrix, a relation matrix must be calculated that includes its own X. Next, the n × n relationship matrix D is applied to identity matrix I (identity matrix) of one order to obtain M, which is given in Equation (2). Subsequently, Boolean logic is employed (Table 1). Linear algebra operations were performed using Equation (3) for the multiplication of matrix M to achieve convergence, and the reachable matrix M* was subsequently obtained using Bollinger algebra.

Table 1.
Boolean logic and operational modes.
Step 3: Convert the reachable matrix into a hierarchical matrix.
The ith element in the reachable matrix M* is extracted, in which the intersection value of each item in the column (horizontal) and row (vertical) is 1. Next, the reachable set is obtained by using Equation (4). The intersection value of each item in the row (vertical) and column (horizontal) was set to 1, and the antecedent set was obtained using Equation (5); the intersection set of these two sets was obtained using Equation (6).
Step 4: Complete the ISM hierarchy diagram with the hierarchy matrix.
The elements that satisfy the interpretive structural model in Equation (6) in the aforementioned hierarchy could be identified and the structure of the elements’ relationships can also be expressed using the graph. Then, an ISM hierarchy diagram is completed [62].
3.3. Determining the Dimensions and Criteria Priority of OLED NPD
This study uses the 9-point scale of relative importance [63] for pairwise comparison in the design of the MCDM model for the OLED NPD process as well as applies the Lambda-Max fuzzy coefficient adjustment from the FANP developed by Csutora and Buckley [64] which is used to derive the priority weights of the various dimension and criterion elements of the MCDM model for OLED NPD. The steps for this FANP are listed as follows:
Step 1: Establish the network architecture.
A hierarchical structure for OLED NPD is established. The process for establishing the network architecture is already described in step1 to step3 in Section 3.2.
Step 2: Build a comparison matrix.
In consideration of each dimension, semantic variables for OLED NPD are evaluated by experts to determine the relative importance of the pairwise criteria. A 9-point scale pairwise comparison ANP questionnaire is designed and answered by N experts. A paired comparison matrix based on the results of the questionnaire is then constructed. The upper triangular matrix is composed of the measurement value of the comparison matrix, in which the value of the lower triangular part is the reciprocal of the relative position value of the upper triangular matrix. In addition, the paired upside-down comparison matrix in Equation (7) is constructed.
Step 3: Calculate the eigenvalues and eigenvectors.
After the paired comparison matrix is established, eigenvalues and eigenvectors are calculated using MATLAB software. Eigenvalues could also be approximated according to the row vector average value through a standardization method, in which each row element is first standardized with the sum of the row elements as the denominator. Next, the standardized elements of each column are added and divided by the total number of column elements [65,66], as presented in Equation (8). The eigenvector is then substituted into Equation (9), which is used to verify consistency.
where w is the eigenvector of matrix A gained from Formula (8) and λmax is the largest eigenvalue in the matrix A.
Step 4: Verify consistency.
After the paired comparison matrix is established, the consistency of the decision must be verified. Because in a paired comparison matrix, if represents the relative importance of dimension and criterion element i to element j, indicates the relative importance of dimension and criterion element j to element k. Therefore, in terms of the relative importance of element i to element k, the importance of must meet the condition of to ensure the complete consistency of the selection results. Meeting these transition conditions can be challenging. Therefore, the consistency test method proposed by Saaty [63] was used to ensure that the judgment and consensus of the selected experts reached a certain degree of consistency. The consistency ratio (C.R.) of the paired comparison matrix can be defined as follow:
The consistency index (C.I.) indicates the degree of difference between the maximum eigenvalue and the order (n). When , the judgment and consensus of the selected experts are completely consistent. When , the judgment and consensus of the selected experts are inconsistent, and satisfactory consistency can be obtained only when . The random index (R.I.) indicates that when the problem becomes increasingly complicated, the judgments of the pairwise comparison and the order of the pairwise comparison matrix increase. Under this condition, judgment consistency is lower. Therefore, Saaty [67] proposed the R.I. (Table 2) to adjust varying degrees of C.I. value changes under different orders and obtain a favorable C.R.
Table 2.
R.I. values.
Step 5: Convert the pairwise upside-down comparison matrix into a fuzzy pairwise upside-down comparison matrix.
The semantic variables of the original paired comparison matrix are expressed as positive and negative triangular fuzzy numbers. The scale for the evaluation of the relative importance of variables for OLED NPD is presented in Table 3. The triangular fuzzy numbers represent the selection experts’ opinions on each dimension of the hierarchy and the relative judgment strength for each criterion. If the triangular fuzzy number is (L, M, U), the fuzzy pairwise comparison matrix of the positive and negative values can be expressed as shown in Equation (11), for example (5, 6, 7) and (1/ 7, 1/6, 1/5). The membership function of the fuzzy number is presented in Table 4.
Table 3.
Evaluation scale for the relative importance of OLED NPD variables.
Table 4.
Membership function of fuzzy numbers in Bollinger logic.
Fuzzy positive and negative matrices as defined by Buckley [68] can be expressed in Equations (12) and (13), respectively.
: The fuzzy upside-down matrix of k decision-makers or domain-specific experts.
: Comparison of the importance of the ith element relative to the jth element
To calculate the fuzzy weights of the decision elements, the Lambda-Max method proposed by Csutora and Buckley [64] is used. The procedures are as follows:
- (1)
- Through the α-cut set (α-cut method), let α = 1. Through the α-cut set, the upside-down matrix of the kth OLED NPD process is obtained. The weight is calculated using the hierarchical analysis method to obtain the weight matrix: .
- (2)
- Let α = 0; the α-cut set can be used to obtain the lower-bound upside-down matrix and upper-bound upside-down matrix of the kth OLED NPD process, respectively. Let and . The hierarchical analysis method was used to calculate the weights to obtain the weight matrices and , respectively.
- (3)
- To minimize the lower limit and maximize the upper limit of the fuzzy weight, the following formulas are used to obtain the respective adjustment coefficients:
and are presented in Equations (14) and (15), respectively:
- (4)
- After the coefficient is adjusted, the upper and lower limits of the weight of each element are calculated, as presented in Equations (16) and (17):
- (5)
- The upper and lower final limit weights of each element are obtained using Equations (18) and (19):
By applying the , , and , we could derive the normal triangular fuzzy weight matrix , i = 1, 2, …, n, of the kth OLED NPD. Furthermore, we could derive (*k), i = 1, 2, …, n, representing the fuzzy weight value determined by the kth selected expert for the ith element.
Step 6: Combine the expert opinions of OLED NPD.
After the fuzzy pairwise comparison matrix is established, the geometric mean could be calculated to integrate the opinions of selected experts in OLED NPD. When multiple decision-making experts select a decision value, the geometric mean expressed in Equation (20) can be calculated, which is less affected by extreme value influence. In addition, the consistency of the expert matrices produced after integration do not require verification [68]. The geometric average method is listed as follows:
where indicates integration of the fuzzy weight value of the ith element in the opinions of the kth selected expert, is the fuzzy weight value of the kth selected expert for the ith element, and k is the total number of selected experts.
Step 7: Perform defuzzification.
The defuzzification formula proposed by Chen [69] is used to obtain and sort the defuzzification values of all elements. The process is listed as follows:
where is the defuzzification ranking value of element i and and are the distance between two fuzzy numbers. Elements with high values are given priority in ranking.
Step 8: Create super-matrix.
To determine the priority of the relationship between features, feedback, and hierarchy generalization, a FANP super-matrix is used to calculate the relative weight of the features of each dimension and criterion. The super-matrix comprises numerous sub-matrices with a cumulative influence on each feature and on other interacting elements; this could be derived through the multiplication of the super-matrix by the limited powers.
The combination of multiple submatrices could yield a preliminary unweighted super-matrix, and because this matrix may not conform to the principle of row randomization (columns stochastic), normalizing the weights such that a value of 1 is added to each row weight value would be necessary; hence, we obtained a weighted super-matrix. The limit of the weighted super-matrix could be obtained using Equation (24), in which the matrix is multiplied several times by the limit (infinity), after which the matrix gradually converges, revealing the relative weight between the features. If the super-matrix limit formed two or more limit values during this change, Equation (25) is applied [49], in which the weighted value obtained after convergence is not the true overall weight and must be normalized (i.e., either element divided by the sum of the cluster). This limit super-matrix could be used to obtain the final relative weight matrix of the relationship between the dimension and criteria of OLED NPD.
4. Case Study
Given the strong demand for OLED display products and the highly competitive global market, OLED enterprises need to execute product innovation for presuming business competitive advantage. A suitable MCDM model for OLED NPD can help OLED enterprises’ R&D teams to minimize risks and maximize the success rate of NPD. This study aims to propose an integrated MCDM model for OLED NPD. The establishment procedures are shown in Section 3. For verifying the practicality of the approaches for the proposed MCDM model for OLED NPD, a case study of Taiwan OLED NPD is applied. With the assistance of Taiwan’s Industrial Technology Research Institute and OLED relevant technology manufacturers in Hsinchu Science Park. This study invites twelve experts in the OLED industry to joint expert panel for identifying the crucial dimensions and criteria of the MCDM model for OLED NPD. The twelve experts’ backgrounds are shown in Table 5. After applying related literature review and expert panel methods, this study identifies six crucial dimensions of OLED NPD, namely management team, funds finance, products and technologies, marketing, external environment, and R&D strategy; additionally, these six dimensions comprise 25 evaluation criteria. The crucial dimensions and criteria of the MCDM model of OLED NPD are shown in Table 6.
Table 5.
Twelve Experts’ backgrounds.
Table 6.
Crucial criteria of MCDM model of OLED NPD.
Following the approach that descript in Section 3.2, the reachable matrix is shown in Table 7. Furthermore, by using Equation (4) to Equation (6) in the Step3 of Section 3.2, this study has converted the reachable matrix into a hierarchical matrix. The reachable set , the antecedent set and the intersection set of these two sets are shown in Table 8. Take criteria 1 as an example, C1 (Expertise and management capabilities of team members) will influence C2 (Implement Knowledge Management and Organizational Learning), C12 (Patent and Intellectual Property Rights), and C15 (New Product Marketing Strategy). Finally, the ISM hierarchy diagram of MCDM model for OLED NPD is shown in Figure 2.
Table 7.
The reachable matrix of criteria.
Table 8.
The result of reachable set and antecedent set.
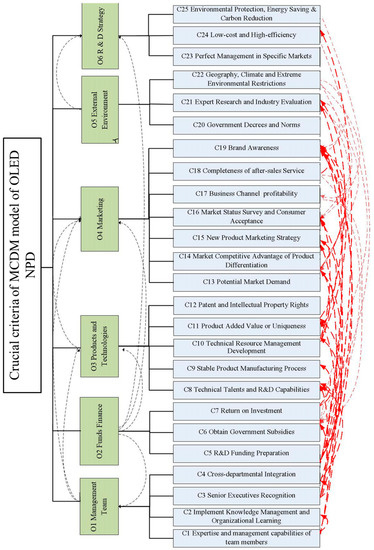
Figure 2.
The ISM hierarchy diagram for OLED NPD.
After the ISM-based construction of the hierarchical structure of the MCDM model for OLED NPD, the internal and external dependence and feedback relationship between the dimensions and criteria established in this study must be determined. Therefore, the results of the ANP questionnaire completed by the twelve OLED NPD experts that have described in Table 5 are used to determine the relative importance between the composition and the criteria. The rest work of conducting FANP analysis job can be seen in the eight-step procedure in Section 3.3. Table 9 shows the result matrix along with eigenvectors and validation consistency (C.R. < 0.1) after processing defuzzification. After build FANP initial super-matrix, normalize each column matrix to make a weighted super-matrix, and multiply such process until the weighted super-matrix reaches convergence status. The unnormalized limit super-matrix is shown in Table 10. The final relative weight of criteria of MCDM model for OLED NPD is shown in Table 11.
Table 9.
The defuzzification of fuzzy pairwise comparison matrix.
Table 10.
The unnormalized limit super-matrix.
Table 11.
The final relative weight of criteria of MCDM model for OLED NPD.
By applying the case study of Taiwan OLED NPD, this study verifies the practicality of the proposed approaches for establishing an integrated MCDM model for OLED NPD. The results of the case study have revealed that the top three important criteria are C7 (Return on Investment), C21 (Expert Research and Industry Evaluation), and C5 (R&D Funding Preparation). Furthermore, C9 (Stable Product Manufacturing Process), C23 (Perfect Management in Specific Markets), and C24 (Low-cost and High-efficiency) are the last three criteria, respectively. In the philosophy of business management, enterprises usually pursue a company’s high profit by designing a new product or improving the performance/quality of the existed product. Therefore, in the issue of NPD for any type of industry, C7 (Return on Investment) certainly is the most important evaluation criteria. In such a dynamic industry environment, enterprises should know the current circumstances, recent technology research, and competitive environment of their industry to plan their operation strategies or actions. Therefore, this research reveals C21 (Expert Research and Industry Evaluation) which is the second most important criteria of NPD in Taiwan’s OLED industry. The success of any action plan implementation only can happen in the condition of enough financial support. Therefore, if enterprises want to successfully develop a new product, then they need to provide enough R&D funding.
5. Conclusions and Suggestions
Due to the strong demand for OLED display products and a highly competitive global market, OLED enterprises need to proactively make product innovations for a presuming business competitive advantage, high sales, high profits, high customer consuming value, and the sustainability of the enterprise. A suitable MCDM model for OLED NPD can help OLED enterprises’ R&D teams to minimize risks and maximize the success rate of NPD. However, the literature reviews of the MCDM model for OLED NPD are very rare. Most present literature reviews of OLED were related to the materials and methods to produce OLED [3]. This study proposes the approaches for establishing an integrated MCDM model for OLED NPD that apply three methodologies which include the literature review and expert panel, ISM, and FANP. After the implication of the proposed approaches in the case study of Taiwan OLED NPD, the research results reveal fifteen evaluation criteria of OLED NPD and their relative weight. OLED enterprises can use these fifteen criteria and their relative weight to evaluate or select NPD alternatives. Furthermore, the research results reveal the top three important criteria are C7 (Return on Investment), C21 (Expert Research and Industry Evaluation), and C5 (R&D Funding Preparation). These results let OLED enterprises know that they should set Return on Investment (ROI) as the most important goal, should completely handle the information of expert research and industry evaluation in the Taiwan OLED industry, and should have enough R&D funding preparation when trying to conduct a successful NPD project.
There are three contributions to this research. First, this study proposes the approaches for establishing an integrated MCDM model for OLED NPD that apply three methodologies which include the literature review and expert panel, ISM, and FANP. The approaches can be applied in other industries for establishing an integrated MCDM model for their own NPD. Second, this study proposes an integrated MCDM model for OLED NPD in Taiwan. The enterprises in the Taiwan OLED industry can implicate this proposed OLED NPD criteria and their relative weights to select an optimal new OLED product alternative in an efficient way and to boost sales, profits, and competitive advantages. Besides, the proposed MCDM model can be used as a reference by OLED enterprises in other nations. Third, this study enriches the research references of MCDM model for NPD and OLED field.
There are two limitations of this study. First, the considered dimension/criteria and expert assessments regarding the importance of pairwise criteria may vary across the member selected in the expert panel. The second limitation of this study is the research scope is limited to the Taiwan OLED industry. The proposed MCDM model for OLED NPD can only be used as a reference or guideline by OLED enterprises in other nations but cannot be directly applied.
For future research, this proposed MCDM model can combine different optimization methods (TOPSIS, EDAS, VIKOR, DEA, and Goal Programming, etc.) to evaluate the alternatives and select the optimum OLED NPD alternative.
Author Contributions
Conceptualization, methodology; W.-C.C.; data curation, formal analysis, investigation; P.-W.L.; project administration, writing—original draft preparation, writing—review and editing, visualization, supervision; W.-J.D. All authors have read and agreed to the published version of the manuscript.
Funding
This research received no external funding.
Institutional Review Board Statement
Not applicable.
Informed Consent Statement
Not applicable.
Data Availability Statement
The data presented in this study are available on request from the corresponding author.
Conflicts of Interest
The authors declare no conflict of interest.
References
- Huang, Y.; Hsiang, E.L.; Deng, M.Y.; Wu, S.T. Mini-LED, Micro-LED and OLED displays: Present status and future perspectives. Light Sci. Appl. 2020, 9, 105. [Google Scholar] [CrossRef] [PubMed]
- Tsujimura, T. OLED Display Fundamentals and Applications; John Wiley & Sons: Hoboken, NJ, USA, 2017. [Google Scholar]
- Swayamprabha, S.S.; Dubey, D.K.; Shahnawaz; Yadav, R.A.K.; Nagar, M.R.; Sharma, A.; Tung, F.C.; Jou, J.H. Approaches for long lifetime organic light emitting diodes. Adv. Sci. 2021, 8, 2002254. [Google Scholar] [CrossRef] [PubMed]
- OLED Display Market Size In 2022: 23.2% CAGR with Top Countries Data, What Are the Key Industry Trends of the OLED Display Market? Available online: https://www.marketwatch.com/press-release/oled-display-market-size-in-2022-232-cagr-with-top-countries-data-what-are-the-key-industry-trends-of-the-oled-display-market-in-depth-93-pages-report (accessed on 6 April 2022).
- Worldwide Smartphone Forecast, 2022–2026. Available online: https://www.idc.com/getdoc.jsp?containerId=US48936022 (accessed on 25 April 2022).
- Abbasi, D.; Ashrafi, M.; Ghodsypour, S.H. A multi objective-BSC model for new product development project portfolio selection. Expert Syst. Appl. 2020, 162, 113757. [Google Scholar] [CrossRef]
- Lin, Y.S.; Chen, M. Implementing TRIZ with Supply Chain Management in New Product Development for Small and Medium Enterprises. Processes 2021, 9, 614. [Google Scholar] [CrossRef]
- Lin, C.T.; Chen, C.T. New product go/no-go evaluation at the front end: A fuzzy linguistic approach. Trans. Eng. Manag. 2004, 51, 197–207. [Google Scholar] [CrossRef]
- Cooper, R.G.; Edgett, S.J.; Kleinschmidt, E.J. Benchmarking best NPD practices—I: Culture, climate, teams, and senior management’s role. Res.-Technol. Manag. 2004, 47, 31–43. [Google Scholar]
- Lee, A.H.I.; Lin, C.Y. An integrated fuzzy QFD framework for new product development. Flex. Serv. Manuf. J. 2011, 23, 26–47. [Google Scholar] [CrossRef]
- Yin, S.; Li, B.; Zhang, X.; Zhang, M. How to Improve the Quality and Speed of Green New Product Development? Processes 2019, 7, 443. [Google Scholar] [CrossRef] [Green Version]
- Chen, W.C.; Lin, Y.F.; Liu, K.P.; Chang, H.P.; Wang, L.Y.; Tai, P.H. A Complete MCDM Model for NPD Performance Assessment in an LED-Based Lighting Plant Factory. Math. Probl. Eng. 2018, 2018, 7049208. [Google Scholar] [CrossRef] [Green Version]
- Mardani, A.; Jusoh, A.; Zavadskas, E.K. Fuzzy multiple criteria decision-making techniques and applications-Two decades review from 1994 to 2014. Expert Syst. Appl. 2015, 42, 4126–4148. [Google Scholar] [CrossRef]
- Behzadian, M.; Otaghsara, S.K.; Yazdani, M.; Ignatius, J. A state-of the-art survey of TOPSIS applications. Expert Syst. Appl. 2012, 39, 13051–13069. [Google Scholar] [CrossRef]
- Dadelo, S.; Turskis, Z.; Zavadskas, E.K.; Dadeliene, R. Multi-criteria assessment and ranking system of sport team formation based on objective measured values of criteria set. Expert Syst. Appl. 2014, 41, 6106–6113. [Google Scholar] [CrossRef]
- Wang, C.N.; Huang, Y.F.; Cheng, I.F.; Nguyen, V. A Multi-Criteria Decision-Making (MCDM) Approach Using Hybrid SCOR Metrics, AHP, and TOPSIS for Supplier Evaluation and Selection in the Gas and Oil Industry. Processes 2018, 6, 252. [Google Scholar] [CrossRef] [Green Version]
- Wang, C.N.; Tsai, H.T.; Ho, T.P.; Nguyen, V.T.; Huang, Y.F. Multi-Criteria Decision Making (MCDM) Model for Supplier Evaluation and Selection for Oil Production Projects in Vietnam. Processes 2020, 8, 134. [Google Scholar] [CrossRef] [Green Version]
- Nguyen, N.B.T.; Lin, G.H.; Dang, T.T. Fuzzy Multi-Criteria Decision-Making Approach for Online Food Delivery (OFD) Companies Evaluation and Selection: A Case Study in Vietnam. Processes 2021, 9, 1274. [Google Scholar] [CrossRef]
- Lu, H.; Zhao, Y.; Zhou, X.; Wei, Z. Selection of Agricultural Machinery Based on Improved CRITIC-Entropy Weight and GRA-TOPSIS Method. Processes 2022, 10, 266. [Google Scholar] [CrossRef]
- Karacan, I.; Senvar, O.; Arslan, O.; Ekmekçi, Y.; Bulkan, S. A Novel Approach Integrating Intuitionistic Fuzzy Analytical Hierarchy Process and Goal Programming for Chickpea Cultivar Selection under Stress Conditions. Processes 2020, 8, 1288. [Google Scholar] [CrossRef]
- Alsaadi, N. Prioritization of Challenges for the Effectuation of Sustainable Additive Manufacturing: A Case Study Approach. Processes 2021, 9, 2250. [Google Scholar] [CrossRef]
- Yang, Y.; Wang, Y. Supplier Selection for the Adoption of Green Innovation in Sustainable Supply Chain Management Practices: A Case of the Chinese Textile Manufacturing Industry. Processes 2020, 8, 717. [Google Scholar] [CrossRef]
- Wang, C.N.; Thanh, N.V.; Su, C.C. The Study of a Multicriteria Decision Making Model for Wave Power Plant Location Selection in Vietnam. Processes 2019, 7, 650. [Google Scholar] [CrossRef] [Green Version]
- Bathaei, A.; Mardani, A.; Baležentis, T.; Awang, S.R.; Streimikiene, D.; Fei, G.C.; Zakuan, N. Application of Fuzzy Analytical Network Process (ANP) and VIKOR for the Assessment of Green Agility Critical Success Factors in Dairy Companies. Symmetry 2019, 11, 250. [Google Scholar] [CrossRef] [Green Version]
- Shen, Y.C.; Lin, T.R.; Tzeng, G.H. Combined DEMATEL techniques with novel MCDM for the organic light emitting diode technology selection. Expert Syst. Appl. 2011, 38, 1468–1481. [Google Scholar] [CrossRef]
- Warfield, J.N. Toward Interpretation of Complex Structural Modeling. IEEE Trans. Syst. Man Cybern. 1974, 5, 4–5. [Google Scholar]
- Warfield, J.N. Developing Interconnection Matrices in Structural Modeling. IEEE Trans. Syst. Man Cybern. 1974, 1, 81–87. [Google Scholar] [CrossRef] [Green Version]
- Sage, A.P. Interpretive Structural Modeling: Methodology for Large-Scale System; McGraw-Hill: New York, NY, USA, 1977. [Google Scholar]
- Warfield, J.N. Societal Systems Planning, Policy and Complexity; John Wiley and Sons: New York, NY, USA, 1976. [Google Scholar]
- Tatsuoka, K.K. Architecture of Knowledge Structures and Cognitive Diagnosis: A Statistical Pattern Recognition and Classification Approach. In Cognitively Diagnostics Assessment; Nichols, P.D., Chipman, S.F., Brennan, R.L., Eds.; Routledge: Abingdon, UK, 1995. [Google Scholar]
- Attri, R.; Grover, S.; Dev, N.; Kumar, D. An ISM approach for modeling the enablers in the implementation of total productive maintenance (TPM). Int. J. Syst. Assur. Eng. Manag. 2013, 4, 313–326. [Google Scholar] [CrossRef]
- Raj, T.; Attri, R. Identification and modeling of barriers in the implementation of TQM. Int. J. Prod. Qual. Manag. 2011, 8, 153–179. [Google Scholar]
- Raj, T.; Attri, R.; Jain, V. Modeling the factor affecting flexibility in FMS. Int. J. Ind. Syst. Eng. 2012, 11, 350–374. [Google Scholar]
- Valmohammadi, C.; Dashti, S. Using interpretive structural modeling and fuzzy analytical process to identify and prioritize the interactive barriers of e-commerce implementation. Inf. Manag. 2016, 53, 157–168. [Google Scholar] [CrossRef]
- Chen, W.C.; Wang, L.Y.; Lin, M.C. A Hybrid MCDM Model for New Product Development: Applied on the Taiwanese LiFePO4 Industry. Math. Probl. Eng. 2015, 2015, 462929. [Google Scholar]
- Vittal, A.; Shivraj, K. Role of Information Technology and Knowledge Management in improving project management. VINE 2008, 38, 357–369. [Google Scholar]
- Chirra, S.; Kumar, D. Analysis of SCF under sales promotional schemes: An application of interpretive structural modelling approach. Int. J. Prod. Res. 2018, 56, 6015–6033. [Google Scholar] [CrossRef]
- Bhattacharya, S.; Momaya, K. Interpretive Structural Modeling of Growth Enablers in Construction Companies. Singap. Manag. Rev. 2009, 31, 73–97. [Google Scholar]
- Wang, W.M.; Lee, A.H.I.; Peng, L.P.; Wu, Z.L. An integrated decision making model for district revitalization and regeneration project selection. Decis. Support Syst. 2013, 54, 1092–1103. [Google Scholar] [CrossRef]
- Lee, A.H.I.; Wang, W.M.; Lin, T.Y. An evaluation framework for technology transfer of new equipment in high technology industry. Technol. Forecast. Soc. Chang. 2010, 77, 135–150. [Google Scholar] [CrossRef]
- Alawamleh, M.; Popplewell, K. Interpretive structural modelling of risk sources in a virtual organization. Int. J. Prod. Res. 2011, 49, 6041–6063. [Google Scholar] [CrossRef] [Green Version]
- Thirupathi, R.M.; Vinodh, S. Application of interpretive structural modelling and structural equation modelling for analysis of sustainable manufacturing factors in Indian automotive component sector. Int. J. Prod. Res. 2016, 54, 6661–6682. [Google Scholar] [CrossRef]
- Lim, M.K.; Tseng, M.L.; Tan, K.H.; Bui, T.D. Knowledge management in sustainable supply chain management: Improving performance through an interpretive structural modelling approach. J. Clean. Prod. 2017, 162, 806–816. [Google Scholar] [CrossRef]
- Rana, N.P.; Barnard, D.J.; Baabdullah, A.M.A.; Rees, D.; Roderick, S. Exploring barriers of m-commerce adoption in SMEs in the UK: Developing a framework using ISM. Int. J. Inf. Manag. 2019, 44, 141–153. [Google Scholar] [CrossRef]
- Tan, T.; Chen, K.; Xue, F.; Lu, W. Barriers to Building Information Modeling (BIM) implementation in China’s prefabricated construction: An interpretive structural modeling (ISM) approach. J. Clean. Prod. 2019, 219, 949–959. [Google Scholar] [CrossRef]
- Liang, Y.; Wang, H.; Zhao, X. Analysis of factors affecting economic operation of electric vehicle charging station based on DEMATEL-ISM. Comput. Ind. Eng. 2022, 163, 107818. [Google Scholar] [CrossRef]
- Saaty, T.L. On polynomials and crossing numbers of complete graphs. J. Comb. Theory Ser. A 1971, 10, 183–184. [Google Scholar] [CrossRef] [Green Version]
- Saaty, T.L. Decision Making with Dependence and Feedback—The Analytic Network Process; RWS Publication: Pittsburgh, PA, USA, 1996. [Google Scholar]
- Saaty, T.L.; Takizawa, M. Dependence and Independence: From Linear Hierarchies to Nonlinear Networks. Eur. J. Oper. Res. 1986, 26, 229–237. [Google Scholar] [CrossRef]
- Saaty, T.L. Decision Making in Complex Environments, Super Decisions—The Analytic Network Process; RWS Publications: Pittsburgh, PA, USA, 2003. [Google Scholar]
- Saaty, T.L. Fundamentals of the analytic network process-Dependence and feedback in decision-making with a single network. J. Syst. Sci. Syst. Eng. 2004, 13, 129–157. [Google Scholar] [CrossRef]
- Yüksel, İ.; Dagdeviren, M. Using the Analytic Network Process (ANP) in a SWOT Analysis—A Case Study for a Textile Firm. Inf. Sci. 2007, 177, 3364–3382. [Google Scholar] [CrossRef]
- Zheng, L.; Liu, H. Evaluating multifunctional agriculture in Dalishu China: A combined application of SWOT analysis and the analytic network process method. Outlook Agric. 2013, 42, 103–108. [Google Scholar] [CrossRef]
- Genç, T.; Kabak, M.; Özceylan, E.; Çetinkaya, C. Evaluation of natural gas strategies of Turkey in East Mediterranean region: A strengths-weaknesses-opportunities-threats and analytic network process approach. Technol. Econ. Dev. Econ. 2018, 24, 1041–1062. [Google Scholar] [CrossRef] [Green Version]
- Phillis, Y.A.; Andriantiatsaholiniaina, L.A. Sustainability: An ill-defined concept and its assessment using fuzzy logic. Ecol. Econ. 2001, 37, 435–456. [Google Scholar] [CrossRef]
- Mikhailov, L.; Singh, M.G. Fuzzy analytic network process and its application to the development of decision support systems. IEEE Trans. Syst. Man Cybern. Part C Appl. Rev. 2003, 33, 33–41. [Google Scholar] [CrossRef]
- Büyüközkan, G.; Ertay, T.; Kahraman, C.; Ruan, D. Determining the importance weights for the design requirements in the house of quality using the fuzzy analytic network approach. Int. J. Intell. Syst. 2004, 19, 443–461. [Google Scholar] [CrossRef]
- Mohanty, R.P.; Agarwal, R.; Choudhury, A.K.; Tiwari, M.K. A fuzzy ANP-based approach to R&D project selection: A case study. Int. J. Prod. Res. 2005, 43, 5199–5216. [Google Scholar]
- Promentilla, M.A.B.; Furuichi, T.; Ishii, K.; Tanikawa, N. A Fuzzy Analytic Network Process for Multi-Criteria Evaluation of Contaminated Site Remedial Countermeasures. J. Environ. Manag. 2008, 88, 479–495. [Google Scholar] [CrossRef]
- Chen, W.C.; Chang, H.P. The application of fuzzy ANP in the development of new product decision-making-a case study of the solar module industry. Adv. Mater. Res. 2012, 472–475, 1333–1338. [Google Scholar]
- Yu, J.R.; Cheng, S.J. An Integrated Approach for Deriving Priorities in Analytic Network Process. Eur. J. Oper. Res. 2007, 180, 1427–1432. [Google Scholar] [CrossRef]
- Huang, J.J.; Tzeng, G.H.; Ong, C.S. Multidimensional data in multidimensional scaling using the analytic network process. Pattern Recognit. Lett. 2005, 26, 755–767. [Google Scholar] [CrossRef]
- Saaty, T.L. The Analytic Hierarchy Process; McGraw-Hill: New York, NY, USA, 1980. [Google Scholar]
- Csutora, R.; Buckley, J.J. Fuzzy hierarchical analysis: The Lambda-Max method. Fuzzy Sets Syst. 2001, 120, 181–195. [Google Scholar] [CrossRef]
- Saaty, T.L. A scaling method for priorities in hierarchical structures. J. Math. Psychol. 1977, 15, 234–281. [Google Scholar] [CrossRef]
- Kamenetzky, R.D. The relationship between the analytical hierarchy process and the additive value function. Decis. Sci. 1982, 13, 702–713. [Google Scholar] [CrossRef]
- Saaty, T.L. Theory and Applications of the Analytic Network Process: Decisions Making with Benefits, Opportunities, Costs, and Risks; RWS Publications: Pittsburgh, PA, USA, 2005. [Google Scholar]
- Buckley, J.J. Fuzzy hierarchical analysis. Fuzzy Sets Syst. 1985, 17, 233–247. [Google Scholar] [CrossRef]
- Chen, C.T. Extensions of TOPSIS for group decision-making under fuzzy environment. Fuzzy Sets Syst. 2000, 114, 1–9. [Google Scholar] [CrossRef]
Publisher’s Note: MDPI stays neutral with regard to jurisdictional claims in published maps and institutional affiliations. |
© 2022 by the authors. Licensee MDPI, Basel, Switzerland. This article is an open access article distributed under the terms and conditions of the Creative Commons Attribution (CC BY) license (https://creativecommons.org/licenses/by/4.0/).