Article

Effect of Cooling Rate on the Grain Morphology and Element Segregation Behavior of Fe-Mn-Al-C Low-Density Steel during Solidification

1
Key Laboratory for Ferrous Metallurgy and Resources Utilization of Ministry of Education, Wuhan University of Science and Technology, Wuhan 430081, China
2
The State Key Laboratory of Refractories and Metallurgy, Wuhan University of Science and Technology, Wuhan 430081, China
3
Shanghai Key Laboratory of Advanced High-temperature Materials and Precision Forming, School of Materials Science and Engineering, Shanghai Jiao Tong University, Shanghai 200240, China
*
Author to whom correspondence should be addressed.
Processes 2022, 10(6), 1101; https://doi.org/10.3390/pr10061101
Submission received: 28 April 2022 / Revised: 20 May 2022 / Accepted: 25 May 2022 / Published: 1 June 2022

Abstract

:
Mold with diameter sizes of 140 mm, 80 mm, 40 mm and 15 mm were designed to obtain the ingot of Fe-30Mn-10Al-1.1C low-density steel under different cooling rates. The influence of cooling rate on the grain morphology and elemental segregation behavior during the steel solidification process was analyzed by methods including inductively coupled plasma, scanning electron microscope and energy dispersive spectroscopy. The solidification sequence of the low-density steel was calculated by JMatPro 7.0 thermodynamic software. The results show that the microstructure of the steel is mainly austenite and contains a small amount of ferrite. The solidification order in the steel is: L → α, L → γ and α → γ, L → γ + MC. As the cooling rate increases from 1.69 °C/s to 10.28 °C/s, the ferrite phase precipitation increases by 16.7%, and the grain size decreases significantly, and in particular, the austenitic grain size decreases by 26%. With the increase in cooling rate, the microscopic segregation value of aluminum decreases approximately to 1. Additionally, the microscopic segregation of manganese showed a trend of increasing first and then decreasing. Microscopic segregation of Al and Mn can be improved significantly by increasing the cooling rate.

1. Introduction

Fe-Mn-Al-C low-density steel offers excellent mechanical properties. Its yield strength can reach 400~1000 MPa and its tensile strength can reach 600~2000 MPa, and it shows an outstanding strength-ductility [1,2,3,4]. Significant progress has been achieved in research regarding the microstructure and relative properties of steel [5,6,7,8,9,10,11,12,13,14,15]. However, the high Mn and Al components in the steel can generate a series of problems during the solidification process, especially the problem of element segregation.
Grajcar et al. [16] studied the segregation of solute elements in Fe-(3-5)Mn-1.5Al TRIP steel, and the results showed that on the cross-section of the ingot, the content of Al in the surface layer is higher than that inside the ingot, while the distribution of Mn is opposite. Senk et al. [17] studied the microstructure and elemental distribution of Fe-25Mn-xC (x = 0.01, 0.32) austenitic steel. It was found that Mn is prone to segregation, and at the same time, a statistical method was used to investigate the microscopic segregation of elements in the steel. The results show that the tendency of elemental segregation increases with the element content increasing. Lan et al. [18,19] carried out research on the distribution of elements in Fe-22Mn-0.7C TWIP steel between dendrites. It was reported that Mn and C can undergo positive segregation in dendrites, and there is a significant interaction between Mn and C. Liu et al. [20] investigated the segregation of solute elements in Fe-(12~20)Mn-(0.02~1)C-(0.05~5)Al TWIP steel, and the results showed that no obvious macroscopic segregation was found in the direction from the edge of the ingot to the center. The distribution of C in the dendrites was relatively uniform, Al was slightly negatively segregated in dendrites, and Mn was more obviously positively segregated.
However, under higher Mn and Al additions, the influence of cooling rate on grain morphology and elemental segregation behavior during the solidification process of Fe-Mn-Al-C low-density steel has been rarely reported. The Fe-Al-Mn-C steel solidification process can be studied from both macro and micro perspectives. Different ingot materials were obtained in this study by controlling the solidification cooling rate of Fe-Al-Mn-C steel. The grain morphology and elemental segregation properties of the ingot materials were investigated with metallographic observation and energy spectrometer dot analysis methods.

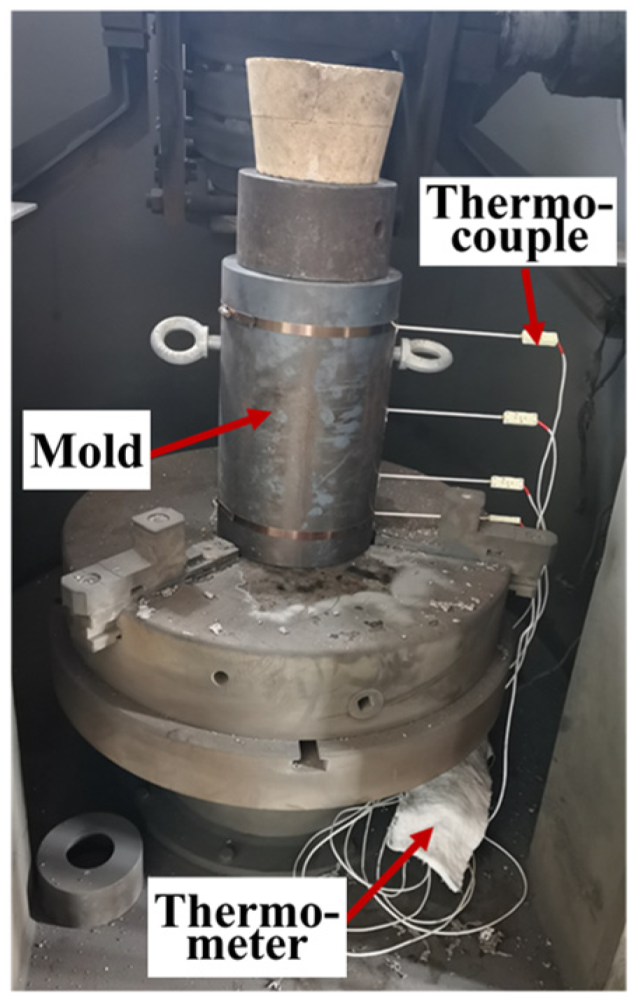
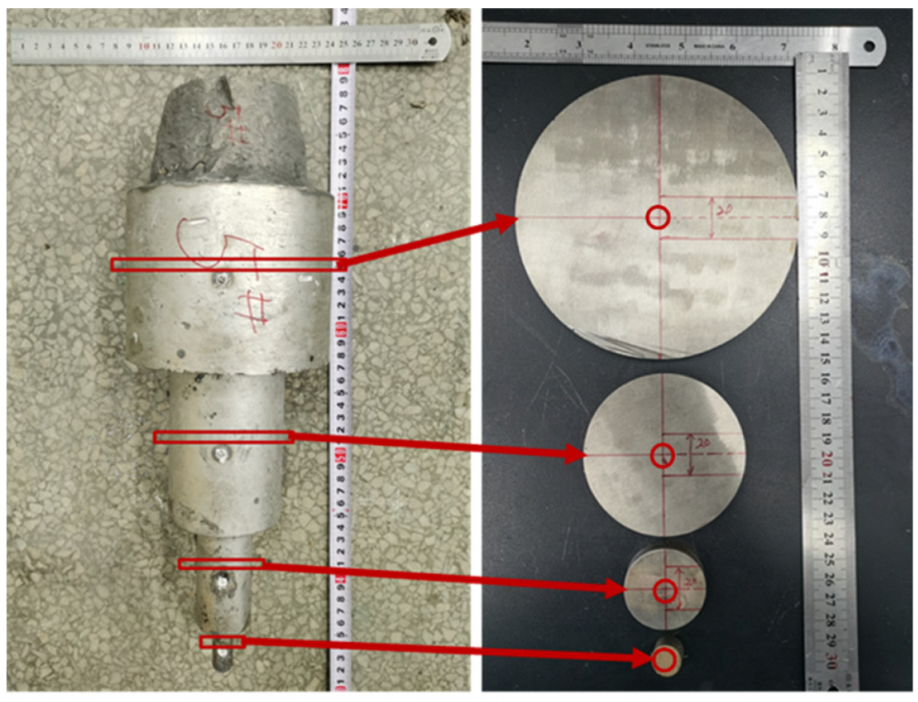
2. Materials and Methods

The composition of Fe-Mn-Al-C steel used in this study is shown in Table 1.
Due to the differences in ingot diameter and mold wall thickness, the heat dissipation rate during pouring was different, resulting in differences in the cooling rate of the ingot with different diameters. In order to study the effects of different cooling rates on the grain morphology and elemental segregation behavior of Fe-Mn-Al-C steel casting specimens, an experimental casting mold with diameter sizes of 140 mm, 80 mm, 40 mm and 15 mm was designed in this study which is shown in Figure 1. The temperature measurement position was the center of the ingot with different diameters as shown in Figure 1 (1, 2, 3 and 4). During the pouring process, a closed ceramic tube at one end was inserted into the specified position, and an S-type (platinum rhodium alloy) thermocouple was placed into the ceramic tube. The thermocouple was connected to a temperature recorder (SMT-X7), and the cooling curve of the different diameters of cast billet was recorded automatically. The cooling rate from the initial crystal formation to the complete crystallization was determined. The average cooling rate of different diameter ingots was calculated with the cooling curve. Experimental set-up of the casting mold, thermocouple arrangement, temperature measuring instrument and casting head is shown in Figure 2.
In this study, a 25 kg VIM/L vacuum induction furnace was employed to melt steel. The obtained stepped ingot is shown in Figure 3. Round disks with a thickness of 20 mm were cut near the temperature measurement positions at different diameters of the stepped ingots. The round disks were drilled at center position, and composition analysis of the drilling cuttings was carried out using ICP (inductively coupled plasma) and chemical titration. Then, an 8 mm specimen shown in Figure 3 was cut from the center of the stepped ingot. The specimens were polished and corroded first. A microscopic structure of the specimens was observed using a scanning electron microscope equipped with EBSD (electron back-scattering diffraction) (VEGA3). And after the re-grinding and polishing of the samples, composition analysis was performed in a scanning electron microscope equipped with EDS (energy dispersive spectroscopy).

3. Results and Analysis

3.1. Solidification Mode of Fe-Mn-Al-C Steel

To investigate the phase transformation in the Fe-30Mn-10Al-1.1C steel solidification process, a thermodynamic calculation of the steel was first performed using JMatPro 7.0 simulation software. The calculated phase fractions of each phase as a function of temperature in the steel at non-equilibrium status was based on the Scheil–Guliver Model [21] are shown in Figure 4. The result shows that the ferrite phase forms at a temperature of 1353.04 °C first, and then the austenitic phase forms at a temperature of 1345.98 °C. The precipitation temperature of MC carbide is 1327.43 °C, which is lower than the precipitation temperature of the ferrite phase and austenitic phase. At the same time, while the austenitic phase is formed, the ferrite phase content essentially reaches the maximum value, and then slightly decreases. The solidification sequence calculated by the Scheil–Guliver model is: L → α, L → γ and α → γ, L → γ + MC.

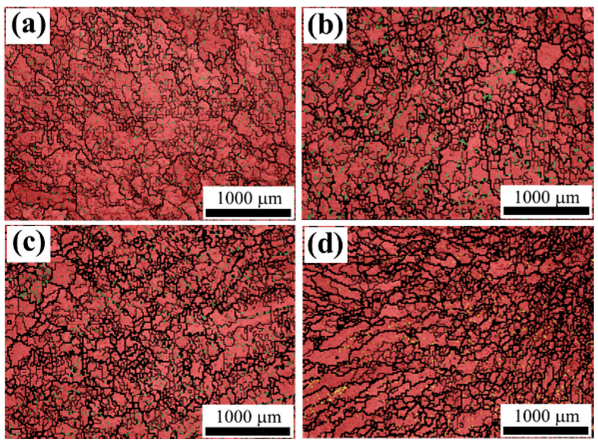
3.2. Effect of Cooling Rate on Grain Morphology of Fe-Mn-Al-C Steel

The cooling curves of different diameter ingots are shown in Figure 5. To clearly exhibit the differences in ingot cooling rate, the enlarged plot of the curves from 500 s to 800 s is given additionally in Figure 5. The pouring temperature of different diameter ingots is the same. However, the cooling rate of different diameter ingots is diverse. The calculated average cooling rate of different diameter ingots is listed in Table 2. As the diameter of casting ingots decreases, the cooling rate of the steel solidification process gradually increases. The average cooling rates of ingot diameter at 15 mm, 40 mm, 80 mm and 140 mm are 10.28 °C/s, 5.87 °C/s, 2.01 °C/s and 1.69 °C/s, respectively.
Microstructure at the center of the ingot with different diameters is given in Figure 6. The highlighted white phase in the figure is the ferrite phase and the gray phase is the austenitic phase. The results show that the size of ferrite phase decreases significantly and the distribution becomes denser with the cooling rate increasing. The ferrite phase was extracted in the samples under different cooling rates as shown in Figure 6(a1–d1). Area statistics were performed on the precipitated ferrite phase using Image-Pro Plus software, and the results are shown in Figure 7.
The results show that the area fraction of the ferrite phase increases with the cooling rate increasing: the ferrite phase content is 6.54%, 6.79% and 7.03% as the cooling rate is 1.69 °C/s, 2.01 °C/s and 5.87 °C/s, respectively. While the cooling rate is 10.28 °C/s, the ferrite phase content is 7.63%, which increases by 16.7% compared with the lowest cooling rate.
Figure 8 shows the grain organization pattern (EBSD) of different diameters for the Fe-Mn-Al-C steel ingot. Dimensional measurements were conducted of the austenitic phase grains. The results are given in Figure 9.
It can be seen from Figure 9 that the grain size of the austenitic phase gradually decreases with the cooling rate increasing. The average austenitic grain size is 120.17 μm as the cooling rate is 1.69 °C/s, while the cooling rate increases to 10.28 °C/s, the average austenite grain size is 88.63 μm, which decreases by 26%.
The super cooling degree of metal melt increases as the cooling rate increases, which results in an increase in nucleus formation rate and growth rate. The number of grains per unit area has the following relationship with the rate of nucleus formation and growth [22]:
Z S = 1.1 ( N G ) 1 / 2  
where ZS is the number of grains per unit area, N is the nucleus formation rate, and G is the growth rate. According to the relationship between the number of grains per unit area and the rate of nucleus formation and growth, the overall variation trend of grain size shows a parabolic shape with the increase in super cooling, which mainly depends on the competitive relationship between the nucleus rate and the growth rate. As the increase in nucleus formation rate is dominant, which means that the increasing rate of the nucleus formation rate is greater than the growth rate, the number of grains per unit area increases, and the grain size is small. Conversely, while the increasing rate of growth rate is greater than the nucleus formation rate, the number of grains per unit area decreases and the grain size becomes larger. As the melt super cooling degree increases, the increase in nucleus formation rate is dominant, and therefore the number of grains per unit area increases, resulting in the refinement of ingot grains.

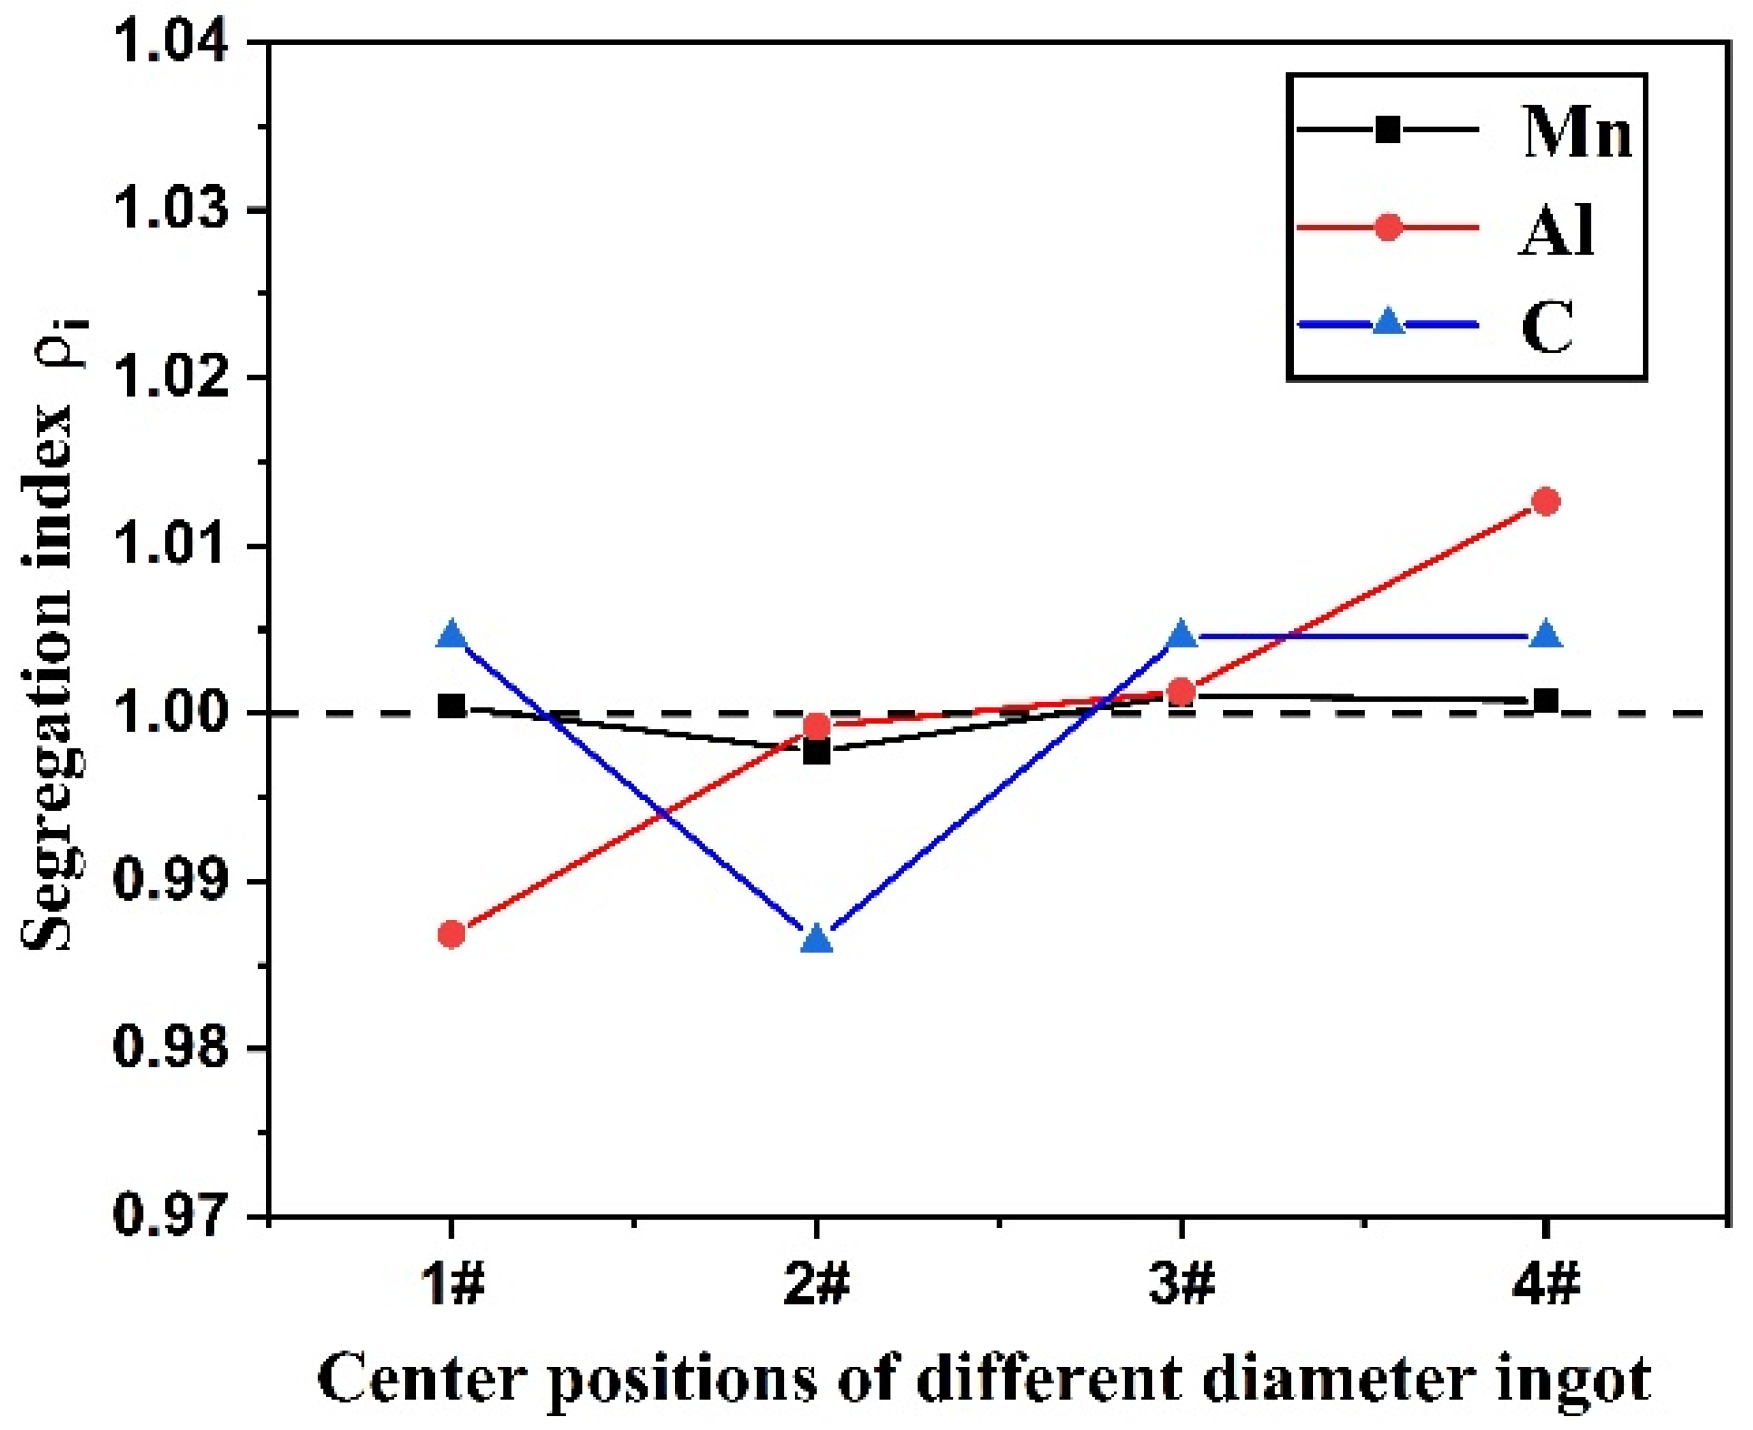
3.3. Effect of Cooling Rate on the Macroscopic Segregation of Fe-Mn-Al-C Steel Elements

Segregation index is a frequently-used indicator to manifest the extent of positive and negative segregation of each element in alloy. It is defined as the ratio of element content at an analyzed point to the average content of the element in ingot sample. The segregation index of each element characterizes the segregation situation at the center of the ingot with different diameters in this study. The segregation index formula is calculated as the following equations [20]:
ρ i = C i C 0  
C 0 = 1 n i = 1 , 2 , n C i    
Here, ρi is segregation index, Ci is the element content of i point in Fe-Mn-Al-C steel ingot, and C0 is the average content of the element at each point. ρi > 1 indicates that the element segregates positively at this experimental point, and ρi < 1 indicates that the element segregates negatively at the point in the ingot.
Table 3 shows the content of C, Mn and Al at the center of the Fe-Mn-Al-C steel ingot with different diameters, where number 1 to 4 positions are shown in Figure 1. The segregation situation of C, Mn and Al at the center of the ingot with different diameters is shown in Figure 10. From Table 3 and Figure 10, it can be found that Mn has a minimum segregation extent. At position 2, with the cooling rate of 2.01 °C/s, C assumes serious negative segregation. Al content shows an increasing trend with the cooling rate increasing, and its segregation extent is a maximum, which transforms from negative segregation to positive segregation. From Figure 6, it can be seen that the more ferrite phase precipitates during the solidification process at the center of the ingot with a higher cooling rate. Al is the stable and forming element of the ferrite phase, and the formation of the ferrite phase will inevitably consume more Al. Therefore, Al content detected at the center of the ingot with a higher cooling rate is relatively higher.

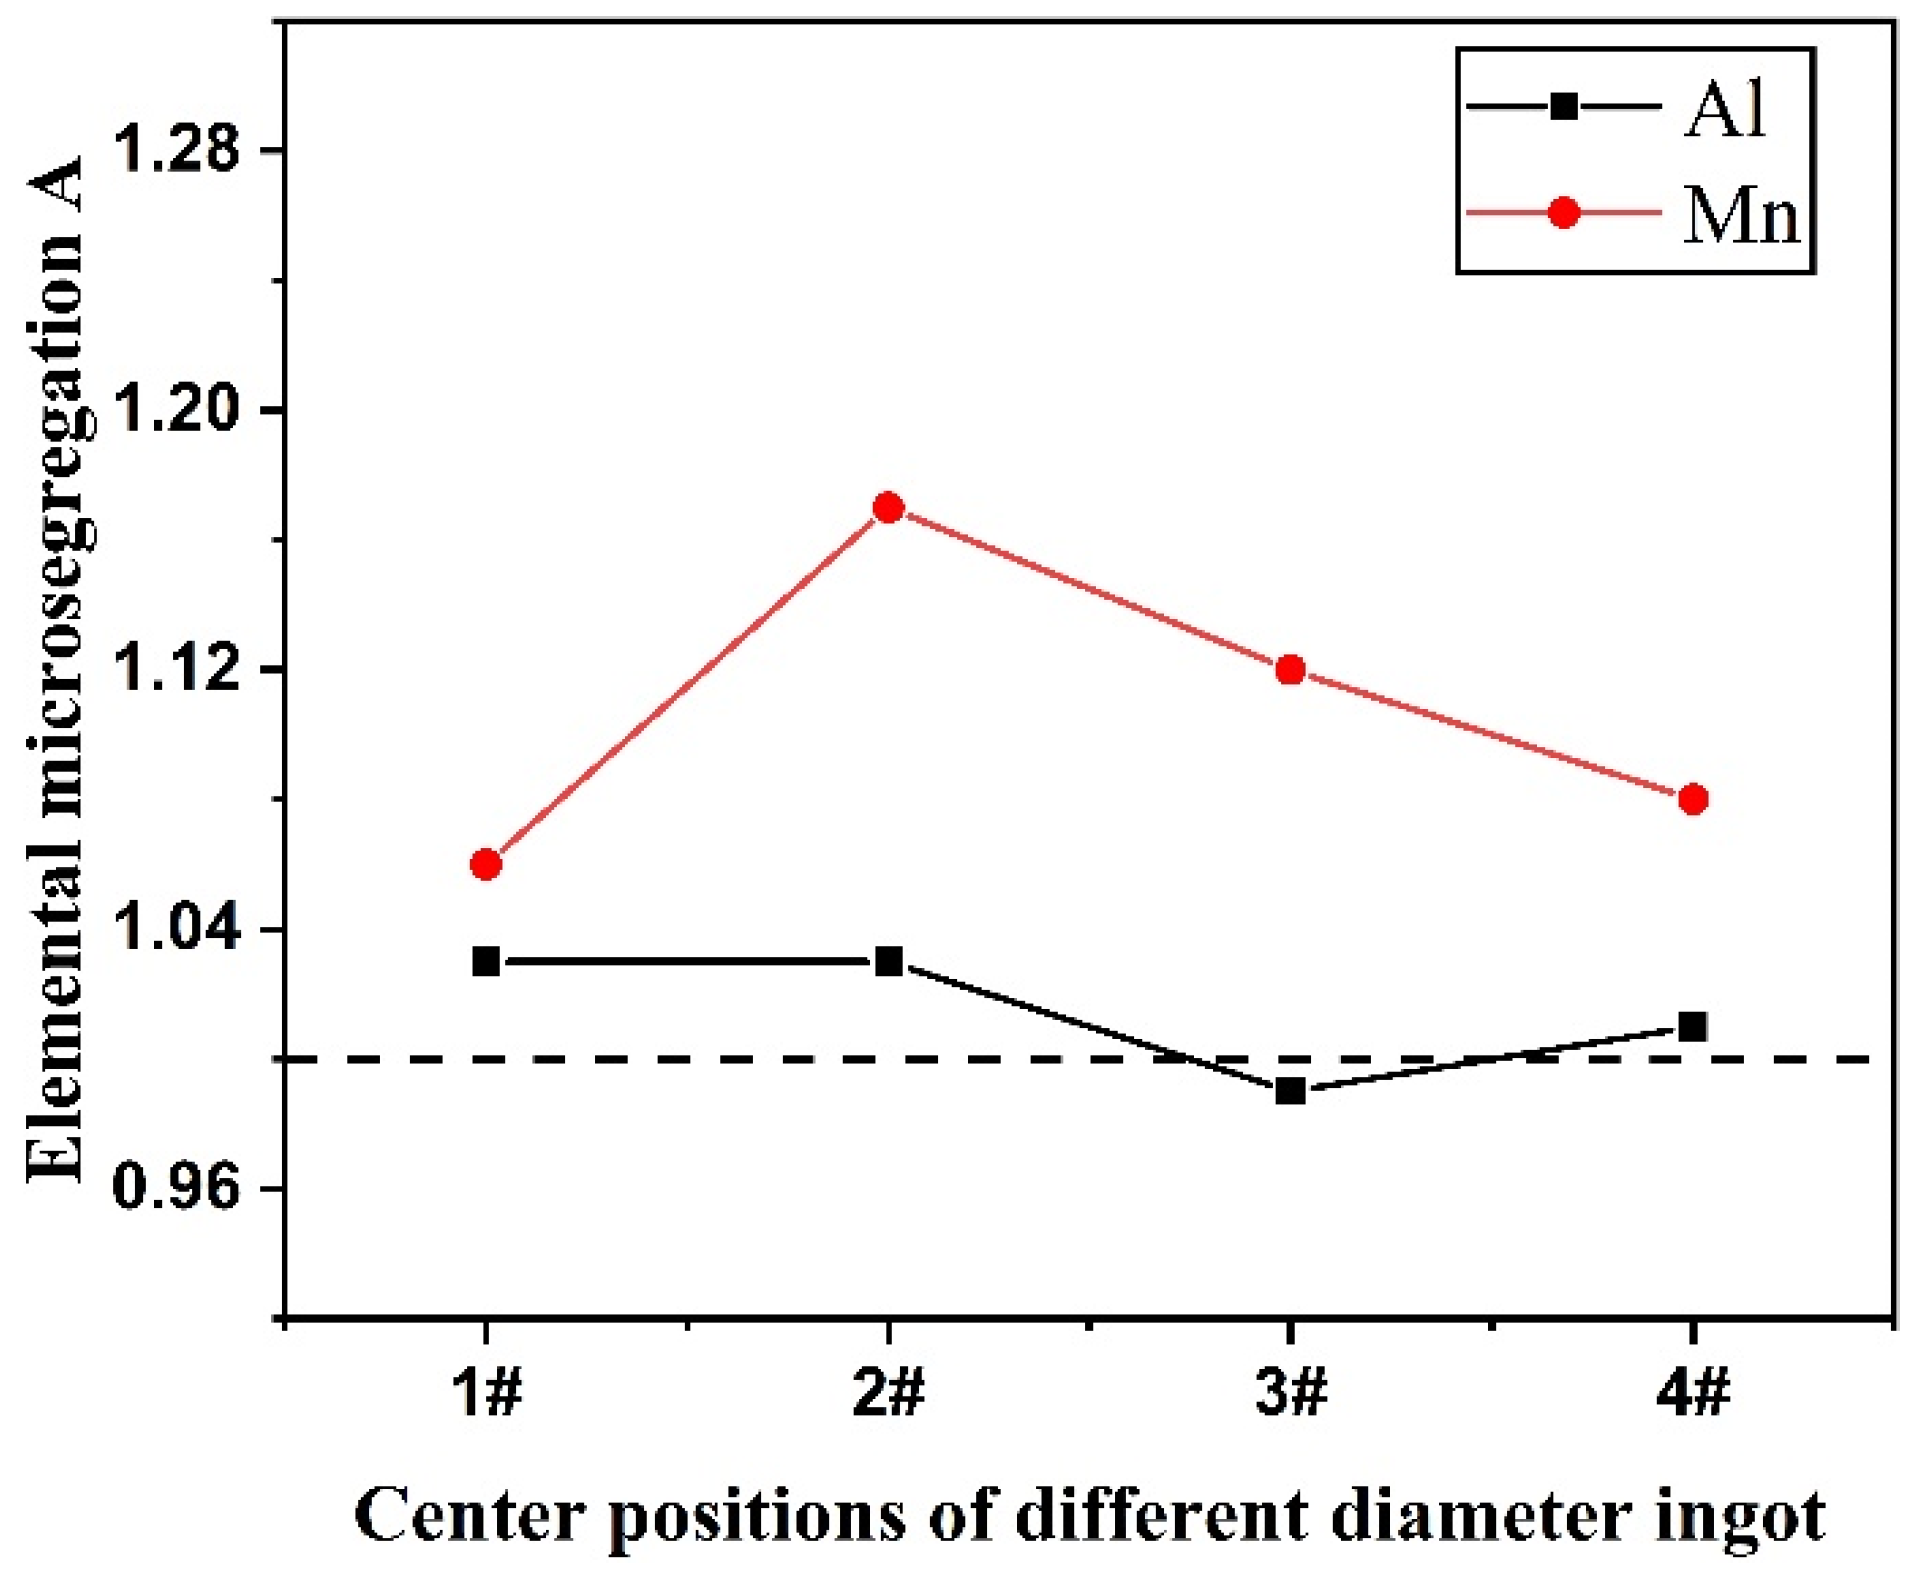
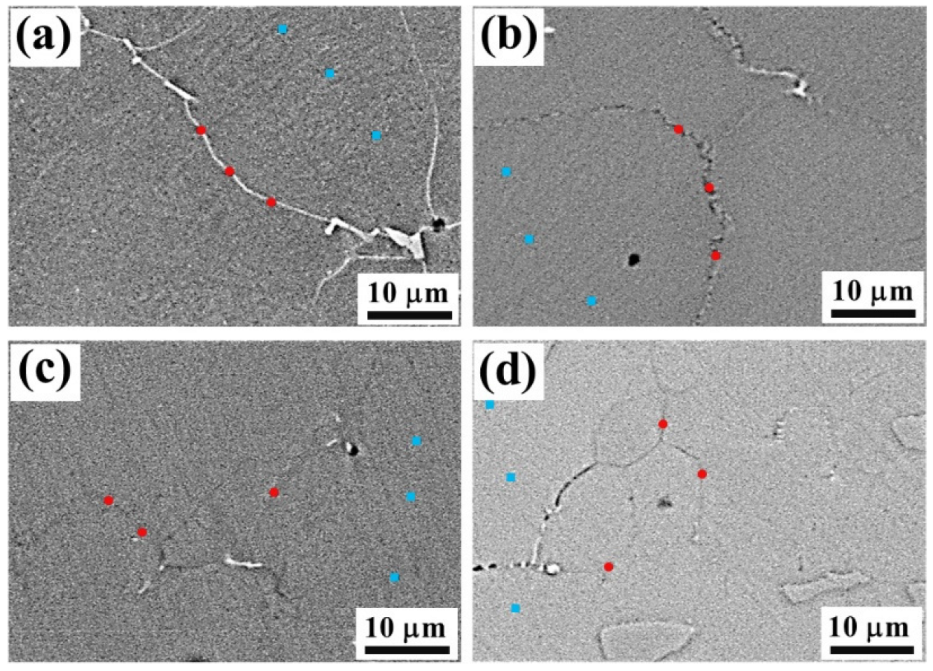
3.4. Effect of Cooling Rate on Microsegregation of Fe-Mn-Al-C Steel Elements

Element content (EDS) analysis was performed on grain boundaries and in the austenitic phase matrix; the test location is shown in Figure 11.
Average contents of Mn and Al on grain boundaries and in austenite crystals at the center of the ingot with different cooling rates were calculated with the detected results at the location as shown in Figure 11. The results are shown in Table 4 and Table 5.
Micro-segregation A of the element is defined and calculated as the following equation:
A = Grain Boundary Element Content/Element Content in Grain
A > 1 indicates that the element content on the grain boundary is higher than that in the grain. A more serious elemental segregation phenomenon on the grain boundary and in the grain occurs higher than the A value.
The extent of elemental micro-segregation on grain boundaries and in austenite grains at ingot centers with different diameters is given in Figure 12. From the figure it can be seen that Al content at the grain boundary is higher than that in the austenite grain as the cooling rate is low. With the increase in cooling rate, the Al micro-segregation value is close to 1, and the micro-segregation extent decreases. The Mn content at the grain boundary is invariably higher than that in the austenite grain. With the increase in cooling rate, Mn micro-segregation shows a trend of increasing first and subsequently decreasing. Combined with Figure 7 and Figure 9, it can be deduced that the nucleation rate of steel melt increases with the cooling rate increasing; meanwhile, the size of the grains in the steel decreases and the number of grains increases. Therefore, the distribution difference in elements on the grain boundary and in the grain reduces. Hence, it can be concluded that the increase in cooling rate can promote the elemental distribution to be more uniform on the grain boundary and in the austenite grain, and the micro-segregation of Al and Mn can be effectively prevented.

4. Conclusions

(1)
The cooling rate has a significant influence on the content, size and distribution of the ferrite phase precipitation in Fe-30Mn-10Al-1.1C steel. With the increase in cooling rate, the ferrite phase precipitation content increases, the size of the ferrite grains is visibly reduced and the distribution of the ferrite phase becomes more uniform.
(2)
As the cooling rate increases, the austenitic phase grain size in the isometric crystal region at the center of the ingot decreases significantly. While the cooling rate increases from 1.69 °C/s to 10.28 °C/s, the average grain size of the austenitic phase transforms from 120 μm to 89 μm, which is a 26% reduction.
(3)
During the solidification process, the Mn and Al content are enriched on the grain boundary. With the cooling rate increasing, the micro-segregation value of Al is close to 1 and the extent of segregation decreases. Mn micro-segregation shows a trend of increasing first and subsequently decreasing. An increase in cooling rate helps to prevent Al and Mn segregation in Fe-30Mn-10Al-1.1C steel.

Author Contributions

Z.Z., Q.T. and G.Z. conceived and designed the study; S.H. and Q.T. conducted the experiment; S.H. analyzed the experimental data and wrote the manuscript with the advice of Z.Z., Q.T., G.Z. and G.L. All authors have read and agreed to the published version of the manuscript.

Funding

This research received no external funding.

Institutional Review Board Statement

Not applicable.

Informed Consent Statement

Not applicable.

Data Availability Statement

Not applicable.

Acknowledgments

The authors are grateful for the support from the Institute of Metal Research Chinese Academy of Sciences.

Conflicts of Interest

The authors declare no conflict of interest.

References

  1. Raabe, D.; Springer, H.; Gutiérrez-Urrutia, I.; Roters, F.; Bausch, M.; Seol, J.-B.; Koyama, M.; Choi, P.-P.; Tsuzaki, K. Alloy design, combinatorial synthesis, and microstructure-property relations for low-density Fe-Mn-Al-C austenitic steels. JOM 2014, 66, 1845–1856. [Google Scholar] [CrossRef]
  2. Kalashnikov, I.; Acselrad, O.; Shalkevich, A.; Pereira, L.C. Chemical Composition Optimization for Austenitic Steels of the Fe-Mn-Al-C System. J. Mater. Eng. Perform. 2000, 9, 597–602. [Google Scholar] [CrossRef]
  3. Kim, H.; Suh, D.W.; Kim, N.J. Fe-Al-Mn-C lightweight structural alloys: A review on the microstructures and mechanical properties. Sci. Technol. Adv. Mater. 2013, 14, 014205. [Google Scholar] [CrossRef] [PubMed]
  4. Frommeyer, G.; Brüx, U. Microstructures and mechanical properties of high-strength Fe-Mn-Al-C light-weight TRIPLEX steels. Steels Automot. Appl. 2006, 77, 627–633. [Google Scholar] [CrossRef]
  5. Charles, J.; Berghezan, A.; Lutts, A. High manganese-aluminium austenitic steel for cryogenic applications, some mechanical and physical properties. J. Phy. Colloq. 1984, 45, 619–623. [Google Scholar]
  6. Köster, W.; Tonn, W. Die Eisenecke des Systems Eisen-Mangan-Aluminium. Steel Res. Int. 1933, 7, 365–366. [Google Scholar] [CrossRef]
  7. Lai, H.J.; Wan, C.M. The study of deformation twins in the austenitic Fe-Mn-C and Fe-Mn-Al-C alloys. Scr. Metall. 1989, 23, 179–182. [Google Scholar] [CrossRef]
  8. Grassel, O.; Frommeyer, G. Effect of martensitic phase transformation and deformation twinning on mechanical properties of Fe-Mn-Si-Al steels. Mater. Sci. Technol. 1998, 14, 1213–1217. [Google Scholar] [CrossRef]
  9. Yoo, J.D.; Park, K.T. Microband-induced plasticity in a high Mn-Al-C light steel. Mater. Sci. Eng. 2008, 496, 417–424. [Google Scholar] [CrossRef]
  10. Yoo, J.D.; Hwang, S.W.; Park, K.T. Factors influencing the tensile behavior of a Fe-28Mn-9Al-0.8C Steel. Mater. Sci. Eng. 2009, 508, 234–240. [Google Scholar] [CrossRef]
  11. Sutou, Y.; Kamiya, N.; Umino, R.; Ohnuma, I.; Ishida, K. High-Strength Fe-20Mn-Al-C-Based Alloys with Low Density. ISIJ Int. 2010, 50, 893–899. [Google Scholar] [CrossRef] [Green Version]
  12. Koyama, M.; Springer, H.; Merzlikin, S.V.; Tsuzaki, K.; Akiyama, E.; Raabe, D. Hydrogen embrittlement associated with strain localization in a precipitation-hardened Fe-Mn-Al-C light weight austenitic steel. Int. J. Hydrogen Energy 2014, 39, 4634–4646. [Google Scholar] [CrossRef]
  13. Zuazo, I.; Hallstedt, B.; Lindahl, B.; Selleby, M.; Soler, M.; Etienne, A.; Perlade, A.; Hasenpouth, D.; Massardier-Jourdan, V.; Cazottes, S.; et al. Low-Density Steels: Complex Metallurgy for Automotive Applications. JOM 2014, 66, 1747–1758. [Google Scholar] [CrossRef]
  14. Ding, H.; Hu, X. Deformation mechanisms and microstructure control in Fe-Mn-Al-C steels with high stacking fault energies. Mater. Sci. Eng. 2018, 17, 239–244. [Google Scholar]
  15. Chen, X.; Li, W.; Ren, P.; Cao, W.; Liu, Q. Effects of C content on microstructure and properties of Fe-Mn-Al-C low-Density steel. Acta Metall. Sin. 2019, 55, 951–957. [Google Scholar]
  16. Grajcar, A.; Kalinowska-Ozgowicz, E.; Opiela, M.; Grzegorczyk, B.; Gołombek, K. Effects of Mn and Nb on the macro-and microsegregation in high-Mn high-Al content TRIP steels. Arch. Mater. Sci. Eng. 2011, 49, 5–14. [Google Scholar]
  17. Senk, D.; Emmerich, H.; Rezende, J.; Siquieri, R. Estimation of Segregation in Iron-Manganese Steels. Adv. Eng. Mater. 2007, 9, 695–702. [Google Scholar] [CrossRef]
  18. Lan, P.; Tang, H.; Zhang, J. Hot ductility of high alloy Fe-Mn-C austenite TWIP steel. Mater. Sci. Eng. 2016, 660, 127–138. [Google Scholar] [CrossRef]
  19. Lan, P.; Zhang, J. Thermophysical Properties and Solidification Defects of Fe-22Mn-0.7C TWIP Steel. Steel Res. Int. 2016, 87, 250–261. [Google Scholar] [CrossRef]
  20. Liu, H.B. Analysis of Metallurgical Fundamental and Solidification Characteristics of Fe-Mn-C (-Al) TWIP Steel; University of Science and Technology Beijing: Beijing, China, 2018. (In Chinese) [Google Scholar]
  21. Chen, S.L.; Yang, Y.; Chen, S.W.; Lu, X.-G.; Chang, Y.A. Solidification Simulation Using Scheil Model in Multicomponent Systems. J. Phase Equilibria Diffus. 2009, 30, 429–434. [Google Scholar] [CrossRef]
  22. Cui, Z.X.; Qin, Y.C. Metallography and Heat Treatment, 2nd ed.; Machine Press: Beijing, China, 2007; pp. 52–53. (In Chinese) [Google Scholar]
Figure 1. Schematic diagram of experimental casting mold.
Processes 10 01101 g001
Figure 2. Experimental set-up of experimental casting mold and temperature measurement system.
Processes 10 01101 g002
Figure 3. Obtained stepped ingot and sampling location.
Processes 10 01101 g003
Figure 4. Calculated phase fractions in Fe-30Mn-10Al-1.1C steel solidification process: (a) overall phase diagram; (b) the partial magnified phase diagram.
Processes 10 01101 g004
Figure 5. Cooling curves of the ingot with different diameters during pouring.
Processes 10 01101 g005
Figure 6. Morphology and quantity of ferrite phase precipitation at different cooling rates: (a,a1) 1.69 °C/s; (b,b1) 2.01 °C/s; (c,c1) 5.87 °C/s; (d,d1) 10.28 °C/s.
Processes 10 01101 g006
Figure 7. Effect of cooling rate on ferrite phase proportion.
Processes 10 01101 g007
Figure 8. Grain morphology of ingot center at different cooling rates: (a) 1.69 °C/s; (b) 2.01 °C/s; (c) 5.87 °C/s; (d) 10.28 °C/s.
Processes 10 01101 g008
Figure 9. Effect of cooling rate on average grain size of austenite phase.
Processes 10 01101 g009
Figure 10. Variation of element segregation index at the center of the ingot with different diameters.
Processes 10 01101 g010
Figure 11. Element content test location on grain boundaries (red points) and in the austenitic phase matrix (blue points) with different cooling rates: (a) 1.69 °C/s; (b) 2.01 °C/s; (c) 5.87 °C/s; (d) 10.28 °C/s.
Processes 10 01101 g011
Figure 12. Microscopic segregation of elements at the center of the ingot with different diameters.
Processes 10 01101 g012
Table 1. Compositions of Fe-Mn-Al-C steel.
ElementsMnAlCNbVFe
Content, wt (%)30101.10.10.158.7
Table 2. Average cooling rate of billets with different diameters during solidification.
Ingot PositionDiameter of Ingot, mmCooling Rate, °C/s
11401.69
2802.01
3405.87
41510.28
Table 3. Element content at the center of the ingot with different diameters.
ElementsIngot PointCooling Rate, °C/sContent, wt%
Mn11.6929.92
22.0129.84
35.8729.94
410.2829.93
Al11.699.56
22.019.68
35.879.70
410.289.81
C11.691.11
22.011.09
35.871.11
410.281.11
Table 4. Average Mn content in the center of the ingot with different diameters.
PositionIngotCooling Rate, °C/sContent, wt%
Grain boundary11.6937.24
22.0137.92
35.8737.62
410.2834.93
Inside the grain11.6934.97
22.0132.47
35.8733.61
410.2832.44
Table 5. Average Al content in the center of the ingot with different diameters.
PositionIngotCooling Rate, °C/sContent, wt%
Grain boundary11.6910.32
22.0110.27
35.879.62
410.289.77
Inside the grain11.6910.06
22.019.95
35.879.75
410.289.68
Publisher’s Note: MDPI stays neutral with regard to jurisdictional claims in published maps and institutional affiliations.

