Article

Numerical Simulation Experimental Study of the Deformation and Failure of Granite with Multiaxial Tension

1
School of Mining, Guizhou University, Guiyang 550025, China
2
Guizhou Panjiang Coal and Electricity Group Technology Research Institute Co., Ltd., Guiyang 550081, China
*
Author to whom correspondence should be addressed.
Processes 2022, 10(5), 949; https://doi.org/10.3390/pr10050949
Submission received: 16 April 2022 / Revised: 30 April 2022 / Accepted: 6 May 2022 / Published: 10 May 2022

Abstract

:
A numerical simulation method is proposed to study the deformation and failure rule of granite with multi-directional tensile stress, based on the importance of the rock tension. This investigation took into consideration the fact that the current experimental equipment cannot complete multi-directional tension experiments for rock. The deformation and failure rule of the granite material model with biaxial and triaxial tensile stress are studied using the numerical simulation software CASRock. The results show that in a biaxial tensile stress state, the tensile strength of granite decreases with the increase in the confining pressure, but the influence of the compression confining pressure on the strength reduction is greater than the tensile confining pressure. The number of cracks generated during failure decreases with the increase in the compressive confining pressure, and the inclination angle of the failure surface increases with the increase in the compressive confining pressure. In the three-direction tension stress state, the tensile strength of granite decreases slightly with the increase in the compressive confining pressure. However, when the compressive confining pressure in one direction is close to the uniaxial tensile strength, the tensile strength of granite will decrease quickly, and the failure result is similar to that of the uniaxial tensile failure.

1. Introduction

Rock material is brittle [1], and its tensile and compression properties are very different. The failure mode varies, and the tensile strength of rock is always less than the compressive strength. When the external stress value reaches a certain critical value, the rock mass will be destroyed via tensile failure and shear failure. In recent years, due to the increase in underground engineering projects, there have been many engineering disasters caused by the rock tensile failure, such as cracks on the surface of a dam’s foundation, small cracks in a roadway, the chamber of a mining field, the deformation and instability of the tunnel in a rock mass, and the high ground stress in a steep layered soft rock tunnel. Disasters caused by the tensile failure of rock also exist in other projects, as found through the study of the charge induction rule of the instability failure of coal and rock masses. One of the important reasons for an abnormal charge signal is that tensile stress causes crack propagation and damage localization in the process of the tensile instability failure [2]. When excavating roadways, tunnels, and chambers, blasting is often used. When blasting, tensile waves often exert a tensile load on the underground bedrock, change the lithology of the bedrock, and bury potential safety hazards [3]. Engineering practice has shown that tensile failure is a common cause of rock structure collapse [4]. In the evaluation strategy of engineering stability, deformation damage and the fracture of rock under the tensile stress play important roles.
Liao [5] research relationship of direct tension test, the Brazilian test and three-point bending test by numerical means. Carmona [6] indirectly obtained the tensile stress–strain curve and expression of concrete with a Brazilian splitting experiment. Other scholars indirectly obtained the tensile strength value of various rocks and factors affecting the tensile strength using Brazilian splitting experiments [7,8,9,10]. In recent years, most scholars have used the direct tensile method to measure the tensile strength of rock. Li [11] carried out a direct tension experiment on white marble to obtain the change of the acoustic emission (AE) waveform during rock fracture. Wille [12] explored the characteristics of the strength, ductility, and absorption capacity of UHP-FRC (ultra-high performance fiber reinforced concrete) with a direct tension experiment at a low strain rate. Hou [9,13] carried out cyclic loading and unloading experiments on marble and sandstone using an electronic experimenting machine, and the results showed that the memory of the high stress state rock was advanced. Peng [14] et al. obtained that the elastic strain and total strain energy increased with the increase in the strain rate by direct tension text of tuff. Yuan [15] experimented with the acoustic emission of the direct tension of three kinds of rocks. Yuan also obtained the full stress–strain curve of the tension and the variation rule of the acoustic emission according to the curve. Li [16] performed direct tension experiments on soft rock and hard rock with a hydraulic servo machine and found that there was no acoustic emission phenomenon at the initial stage of rock loading until the rock was destroyed. Li [17] compared the results of direct tensile and indirect tension experiments of granite and found that the tensile strength of the direct tension was higher than that of the indirect tension, and the acoustic emission was different. You [18] studied a direct tension experiment for granite under the confining pressure and determined that the tensile strength of the rock materials decreased with the increase in the confining pressure. Liu [19] studied the influence of different confining pressures and strain rates on the mechanical properties of granite. It was concluded that the tensile strength decreased with the increase in the confining pressure, and the tensile elastic modulus increased with the increase in the strain rate. Yuan [20] studied the influence of the lateral pressure and strain rate on the tensile strength of rock through experiments and determined that the tensile strength of the granite decreased slightly with the increase in the confining pressure. Wu and Xia [21] used an improved split Hopkinson pressure bar (SHPB) system for the static simulation of Brazilian disc specimens, and they found that the tensile strength increased linearly with the loading rate.
Based on previous studies, it was found that the tensile strength of rock under the confining pressure decreases with the increase in the confining pressure [18,22]. However, the current experiments are limited to only the direct tension experiments for rock in the one-dimensional stress and two-dimensional stress states. Direct tension experiments for a three-dimensional stress state are rarer [19], and the two-direction tension and three-directions tension experiments are basically not involved. Because the end face of a tension experiment specimen is difficult to fix, the stress of the rock specimen may be uneven, so the stress concentration may occur on the contact surface, and the upper and lower two contact surfaces of the rock specimen may be destroyed, leading to the failure of the experiment. Therefore, in this research, CASRock numerical simulation software was used in an experiment for a granite rock model with two-direction tension and three-direction tension, which not only avoids the failure of the experiment due to the limitations of the experimental equipment, but also obtains the deformation and failure rule of the rock for a multi-direction tensile stress state.

2. Model and Numerical Simulation Scheme

2.1. Introduction of CASRock
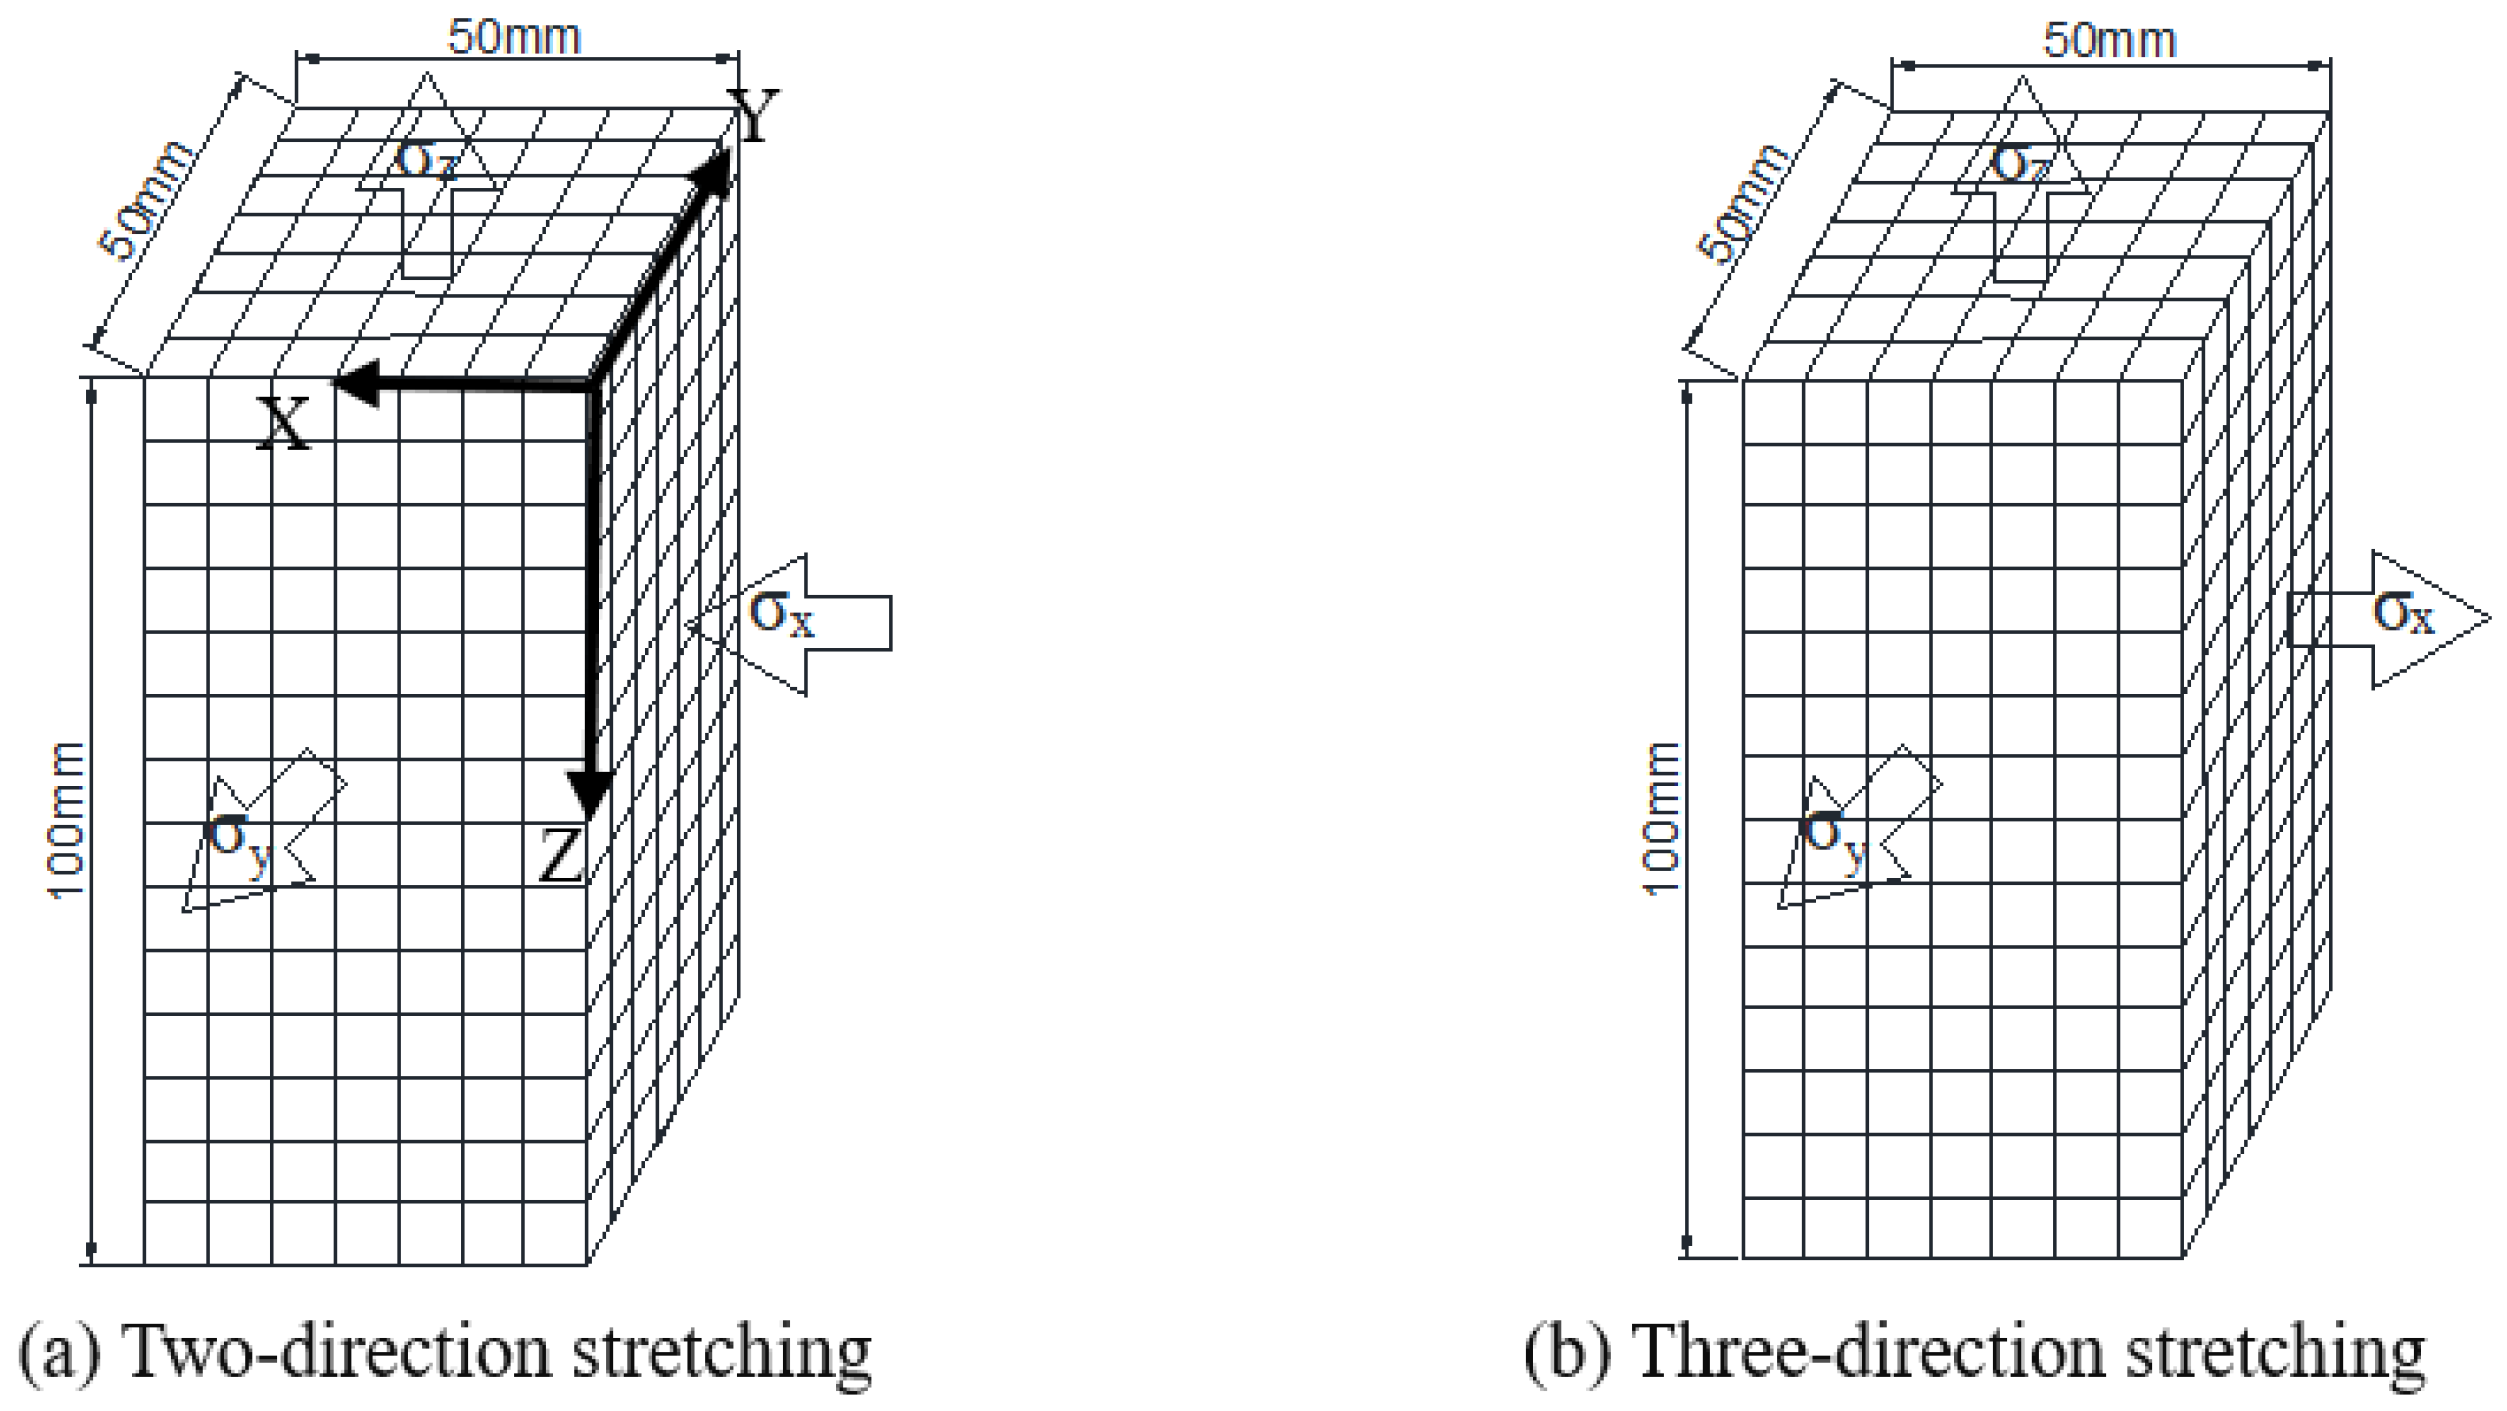
Due to the accuracy of the CASRock [23,24,25] algorithm and the strong visibility of the simulation results of rock mass failure, there are many projects that have used CASRock to carry out some numerical simulation experiments. The method regards an engineering rock mass as a system composed of cells, and the mechanical behavior of the whole engineering rock mass is transmitted only by the interaction between the cells and their neighbors according to the local elastic-brittle-plastic updating rules, which avoids solving large complex linear equations. For example, CASRock was used to numerically simulate the uniaxial compression failure of rock. The obtained experiment failure cloud chart and the uniaxial compression stress–strain curve are consistent with the results of the actual experiment. In this simulation experiment, the material parameters and loading conditions of the model specimen were set by CASRock. After the simulation was completed, the rock stability evaluation index of the rock fragmentation degree (RFD) in the CASRock software system was used to present the failure process of rock with the multi-directional tension.

2.2. Modelling

Because the mesh division of the model processed by Ansys 16.0 is relatively convenient and the expected fracture effect can only be displayed by relying on the mesh, we used an Ansys 16.0 × 50 mm × 100 mm three-dimensional granite model, which was divided into 25 × 25 × 50 units. The mechanical properties of granite were selected as the parameters of the rock specimen model. After the model was created, the displacement boundary conditions, and the stress boundary conditions were set and then imported into the CASRock experiment of displacement control. To verify the feasibility of using CASRock, a two-dimensional Brazilian disc and a direct tensile model were created with Ansys and then imported into CASRock for calculation. Figure 1 is the model loading chart of different

2.3. Model Parameter Presetting in CASRock

The granite model was selected for this experiment, and the mechanical parameters of the model were set. According to relevant literature, the basic mechanical property parameters of the granite were obtained, as shown in Table 1.
This experiment mainly examined the rules of deformation and failure for multi-directional tensile stress. The stress parameters of the experiment were set as shown in Table 2.
Note: In Table 2, σx, and σy are the confining pressures imposed in the numerical simulation experiments, and experiments were carried out with displacement control in the z direction.

3. Two-Dimensional Experimental Results

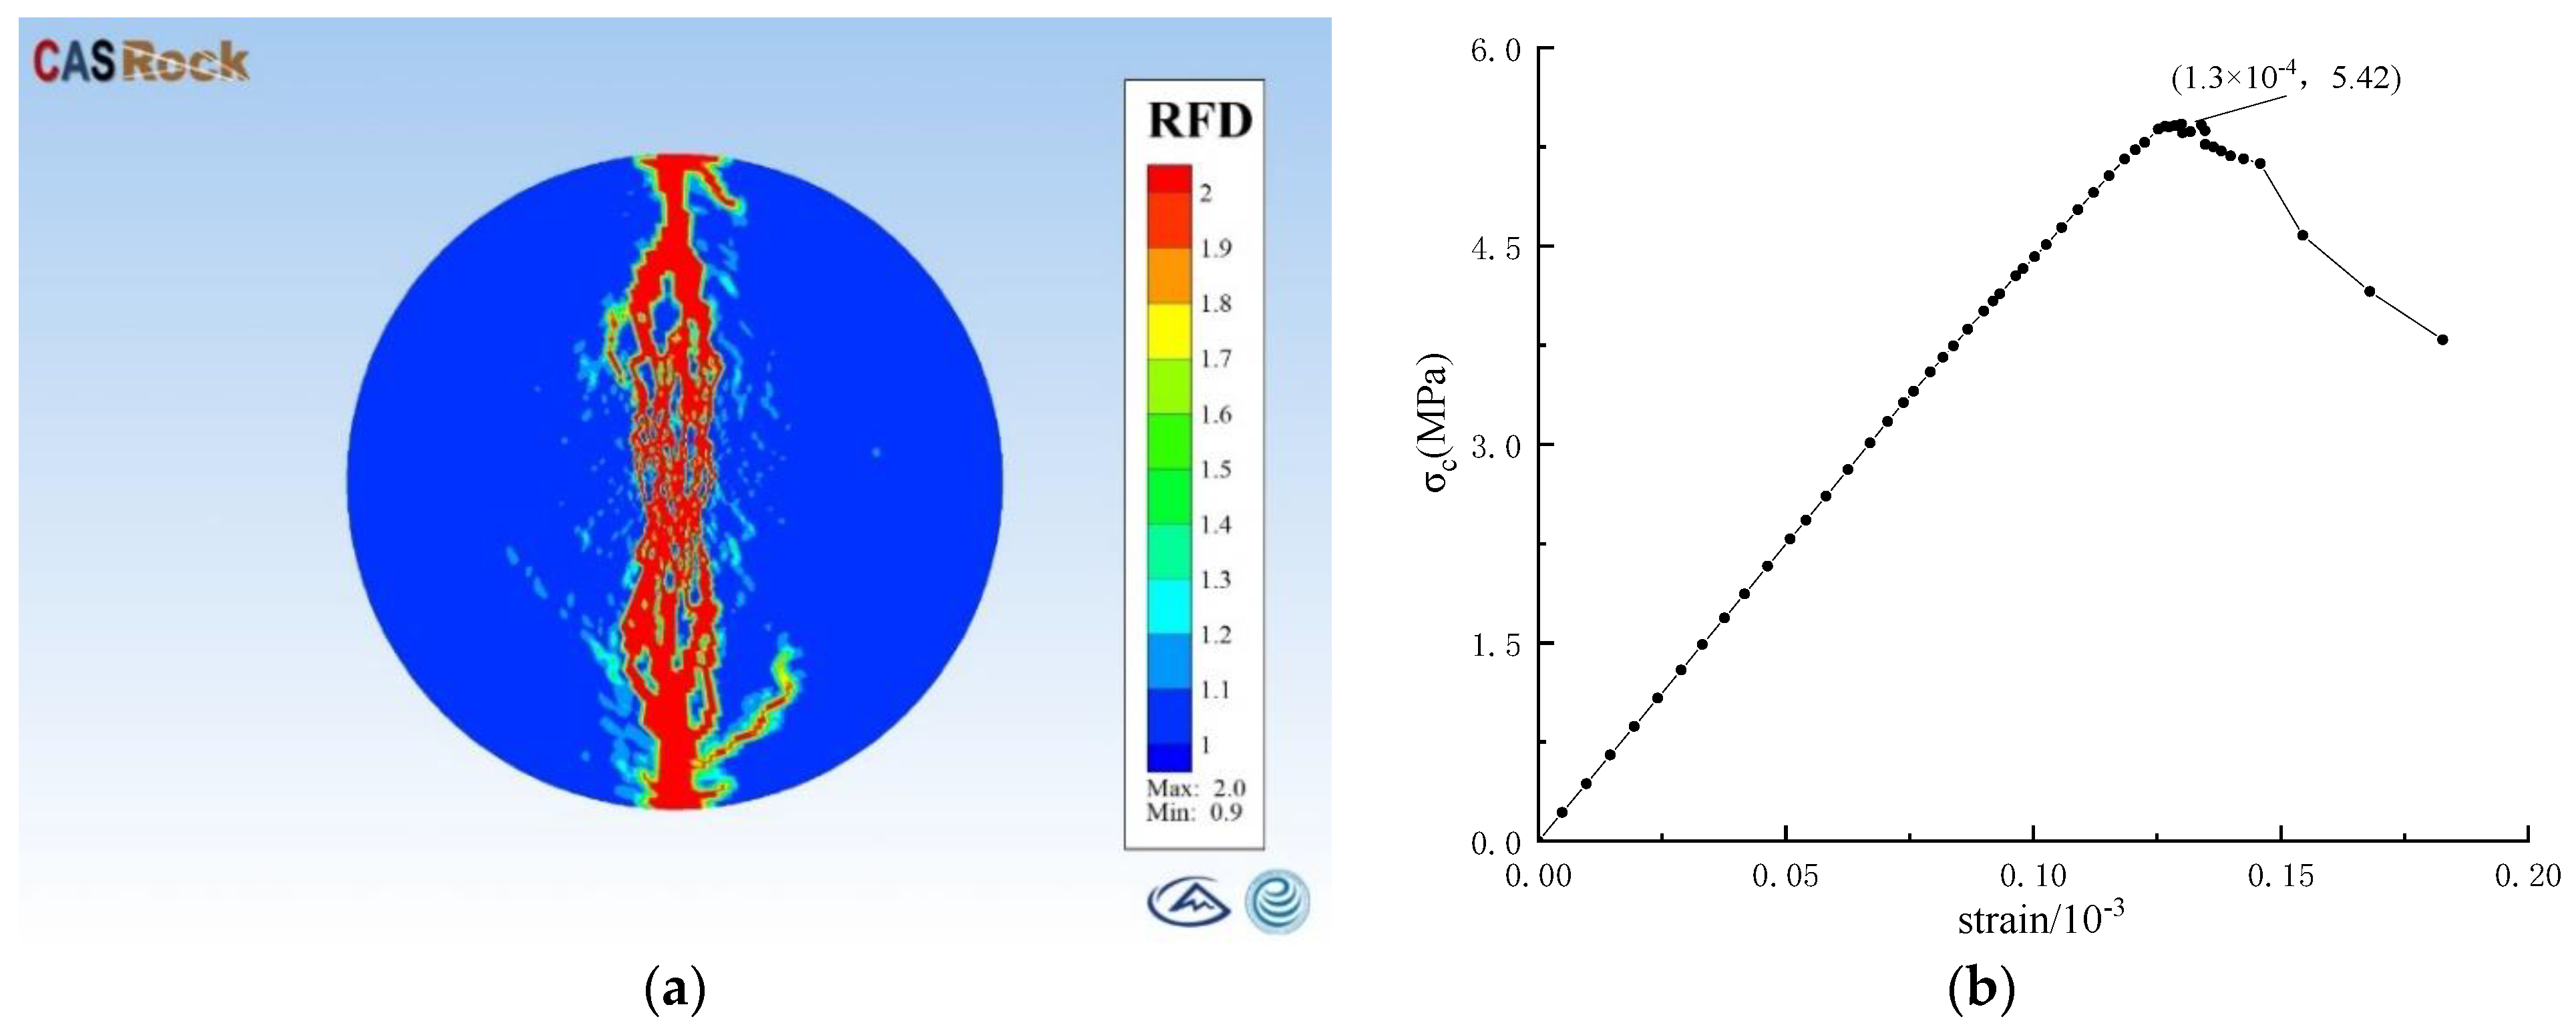
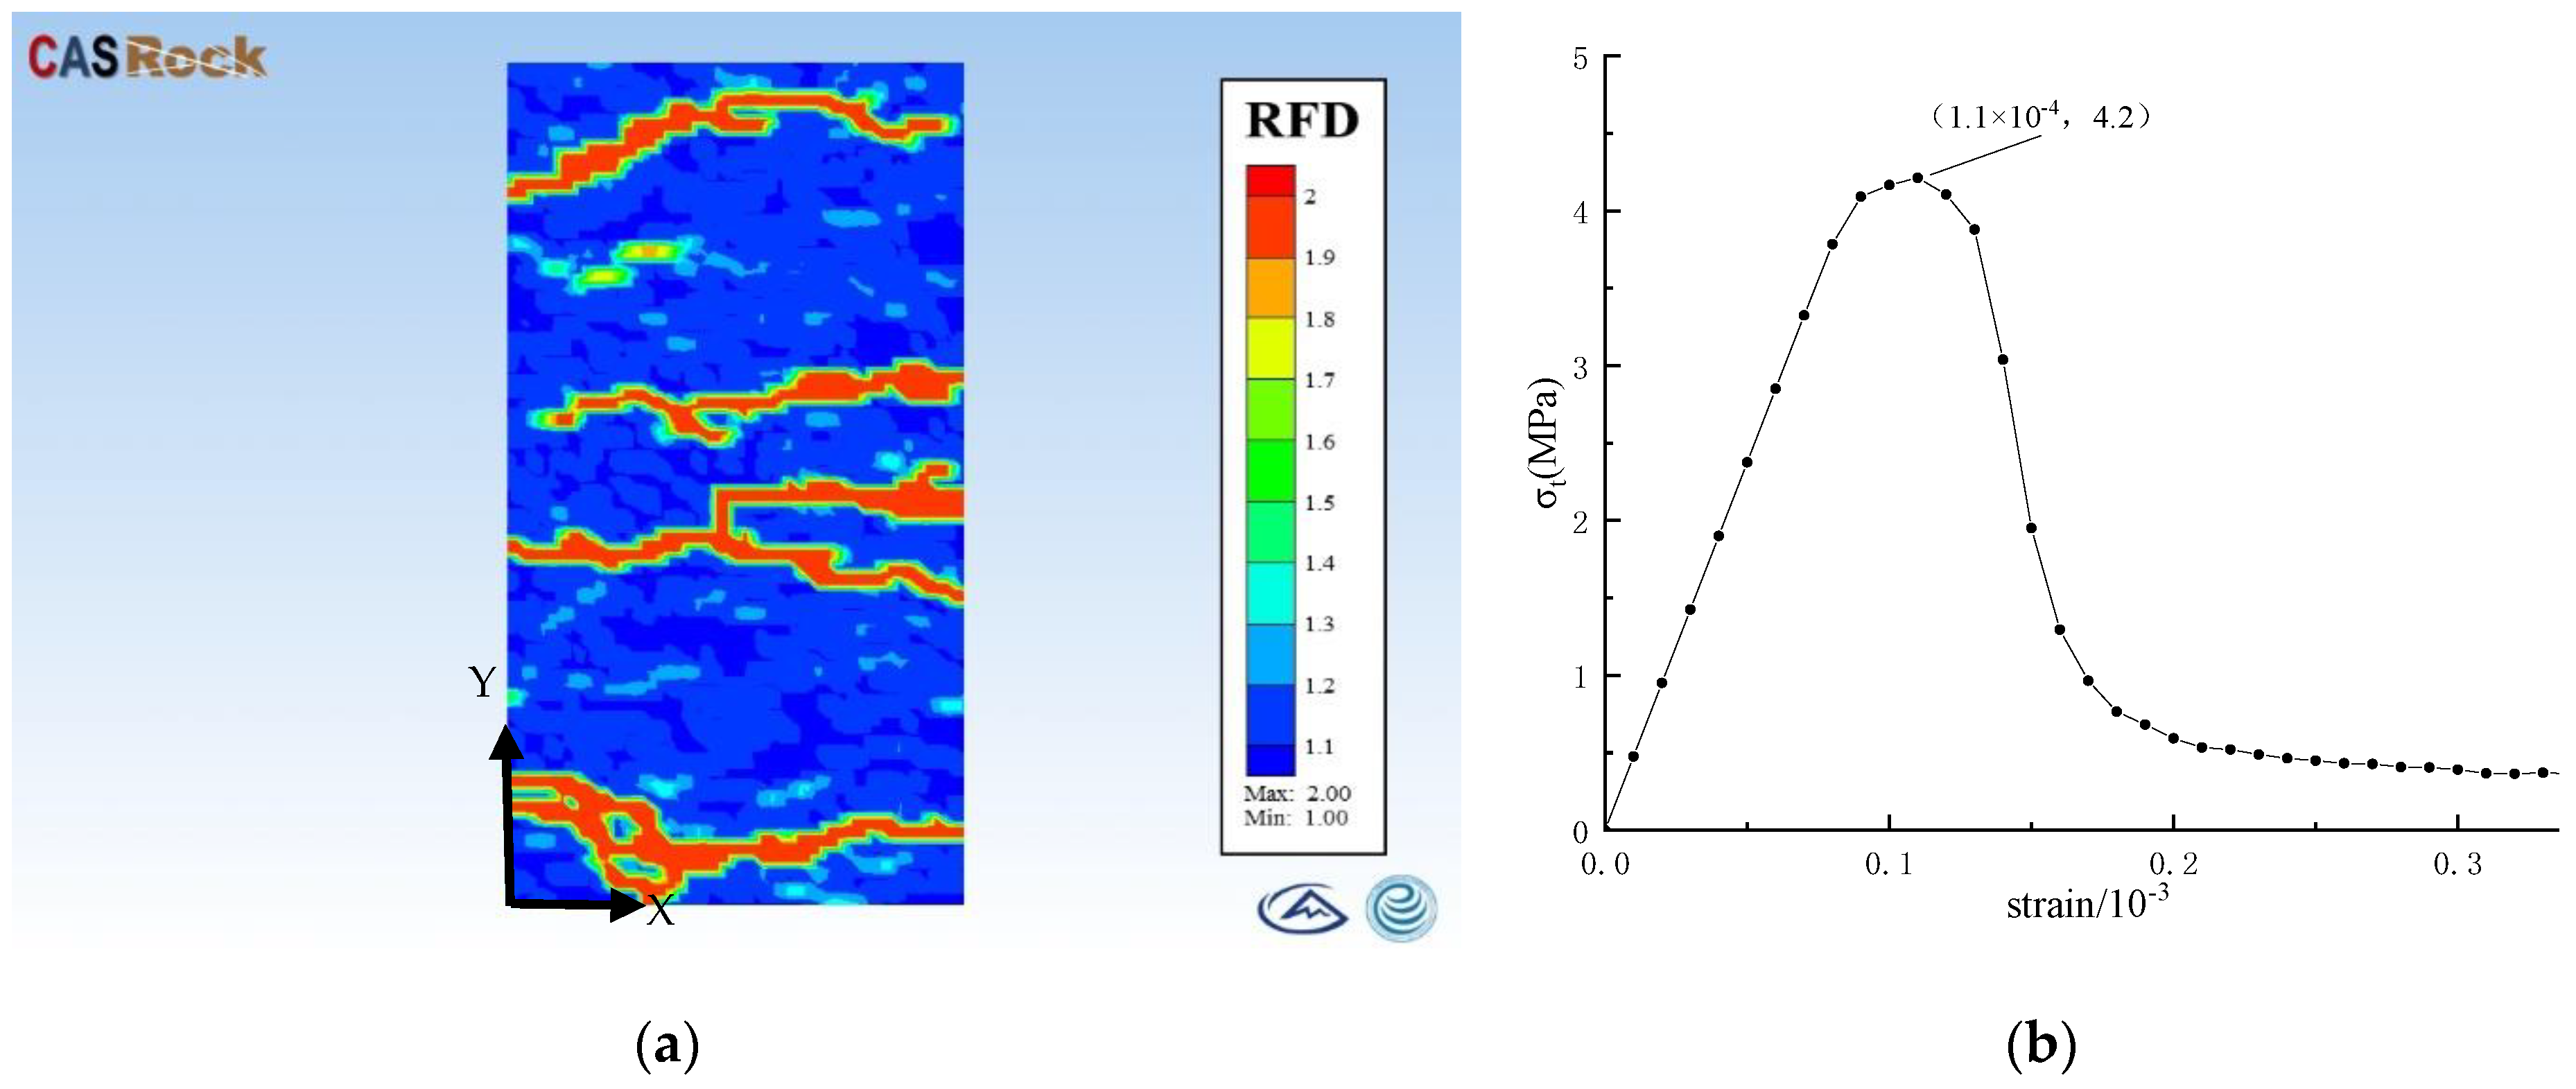
3.1. Brazilian Splitting Experiment

The Brazilian splitting experiment is an indirect method used to measure the tensile strength of rock. This experiment was instructive for studying the tensile properties of rock. Using the Ansys mesh refinement processing, the fracture development was identified, as shown in Figure 2a.
The formula for calculating the tensile strength of rock with Brazilian splitting is as follows:
σ t = 2 P π d t
where σt is the indirect tensile strength (MPa), P is the maximum pressure value of the specimen for splitting failure (N), d is the diameter of the Brazilian disc sample (m), and t is the thickness (m) of the Brazilian disc sample.
The stress–strain curve of the Brazilian disc specimen obtained with numerical simulation is shown in Figure 2b. The applied load is σc = 5.6 MPa, the Brazilian splitting model size is d = 50 mm, the thickness is t = 25 mm, and the Brazilian splitting strength is σt = 7.13 MPa, as can be obtained with Formula 1.

3.2. Uniaxial Direct Tension Experiment

To further verify the feasibility of the numerical software, a two-dimensional uniaxial direct tension experiment was needed. In this research, the results of the two-dimensional granite model through CASRock are basically consistent with the physical experiment results. The failure cloud chart is shown in Figure 3a, and Figure 3b shows the stress–strain curve of the direct tension. Based on this, the direct tensile strength of the rock model is 3.50 MPa.
As shown in Figure 2, the Brazilian splitting experiment is broken along the axial symmetry and cracked into two rock blocks; The direct tension experiment starts from the middle part of the rock sample, extends, and is finally broken into multiple rock blocks as shown in Figure 3. Combined with the stress–strain curves of the two experiments, it can be seen that the strength of the rock does not fall to zero after the failure with a direct tensile load, but there is a certain residual strength. The two-dimensional simulation results show that the CASRock numerical calculation results are in good agreement with the physical experiment, which proves the feasibility and reliability of the CASRock software.

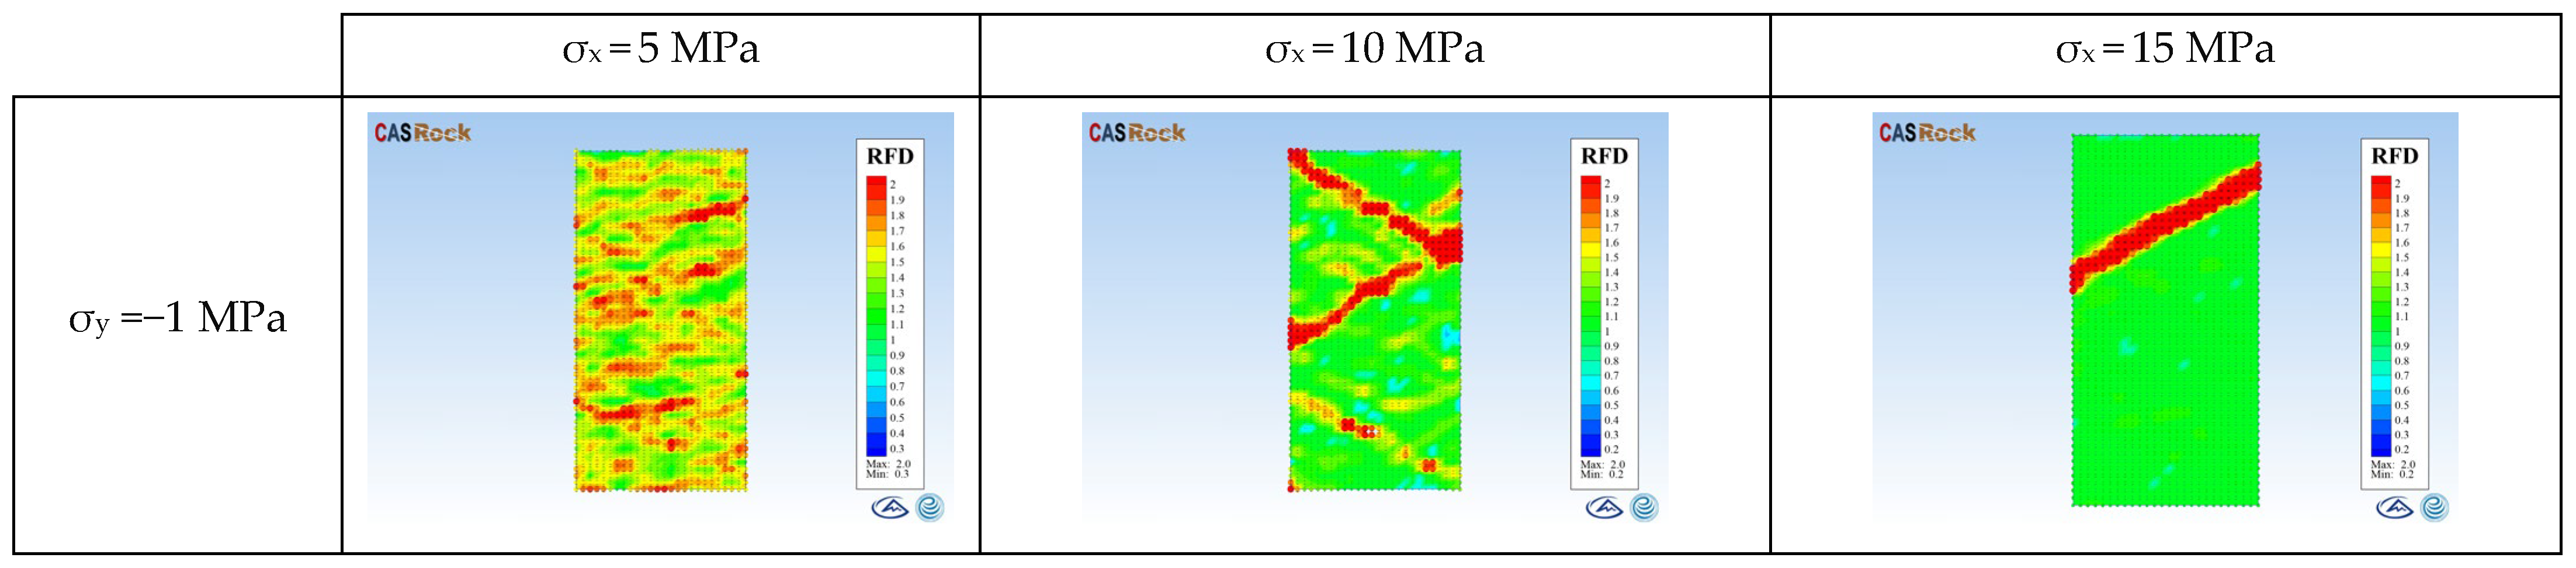
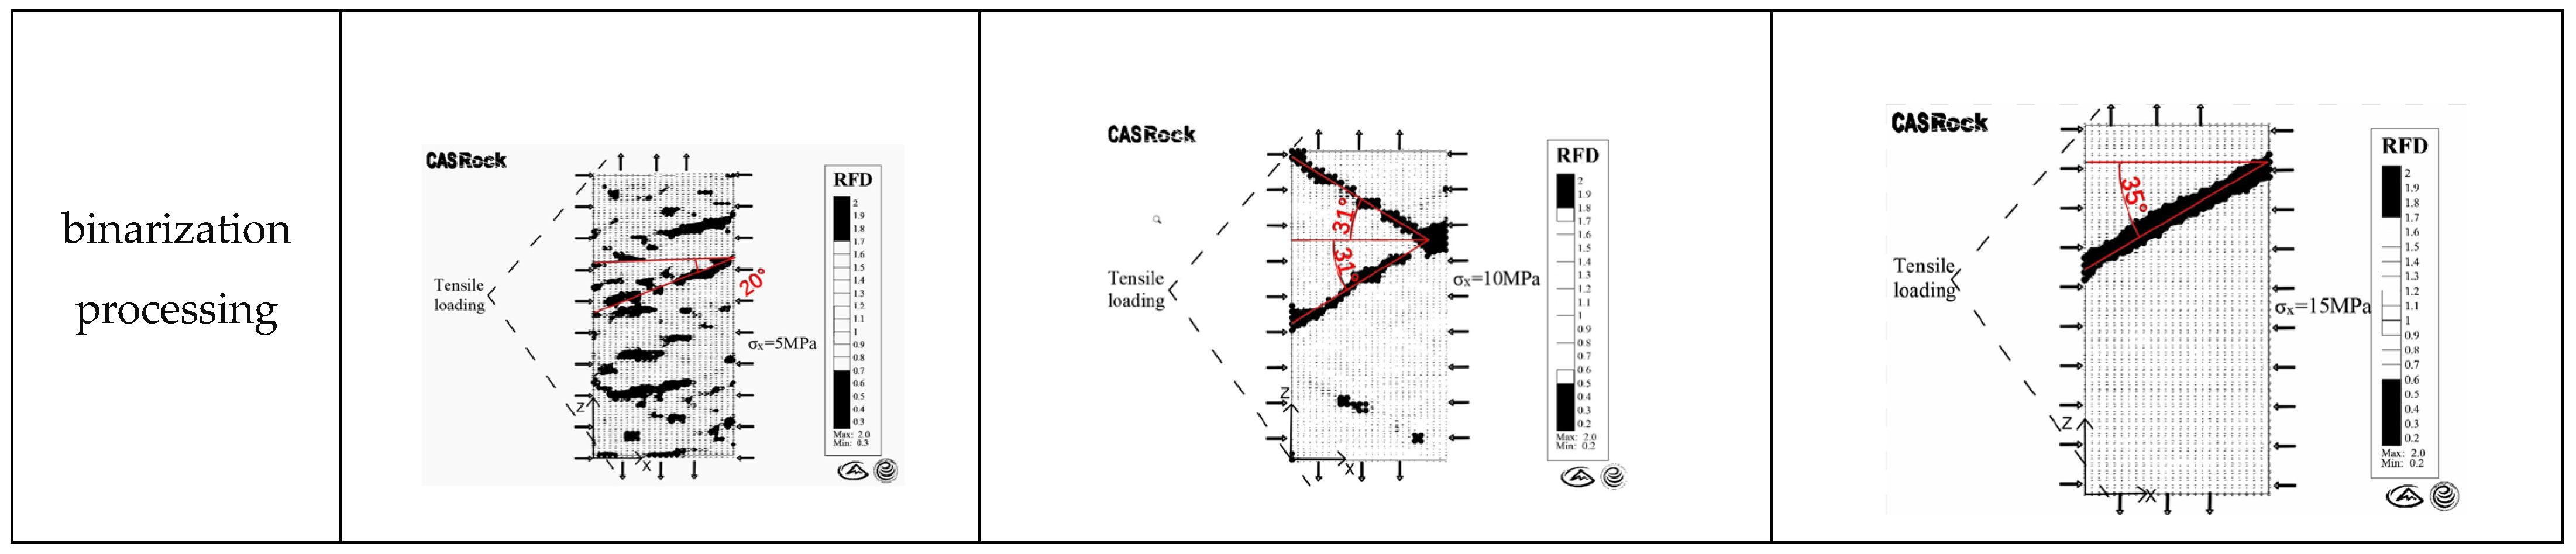
4. Two-Direction Tension Experiment Results and Discussion

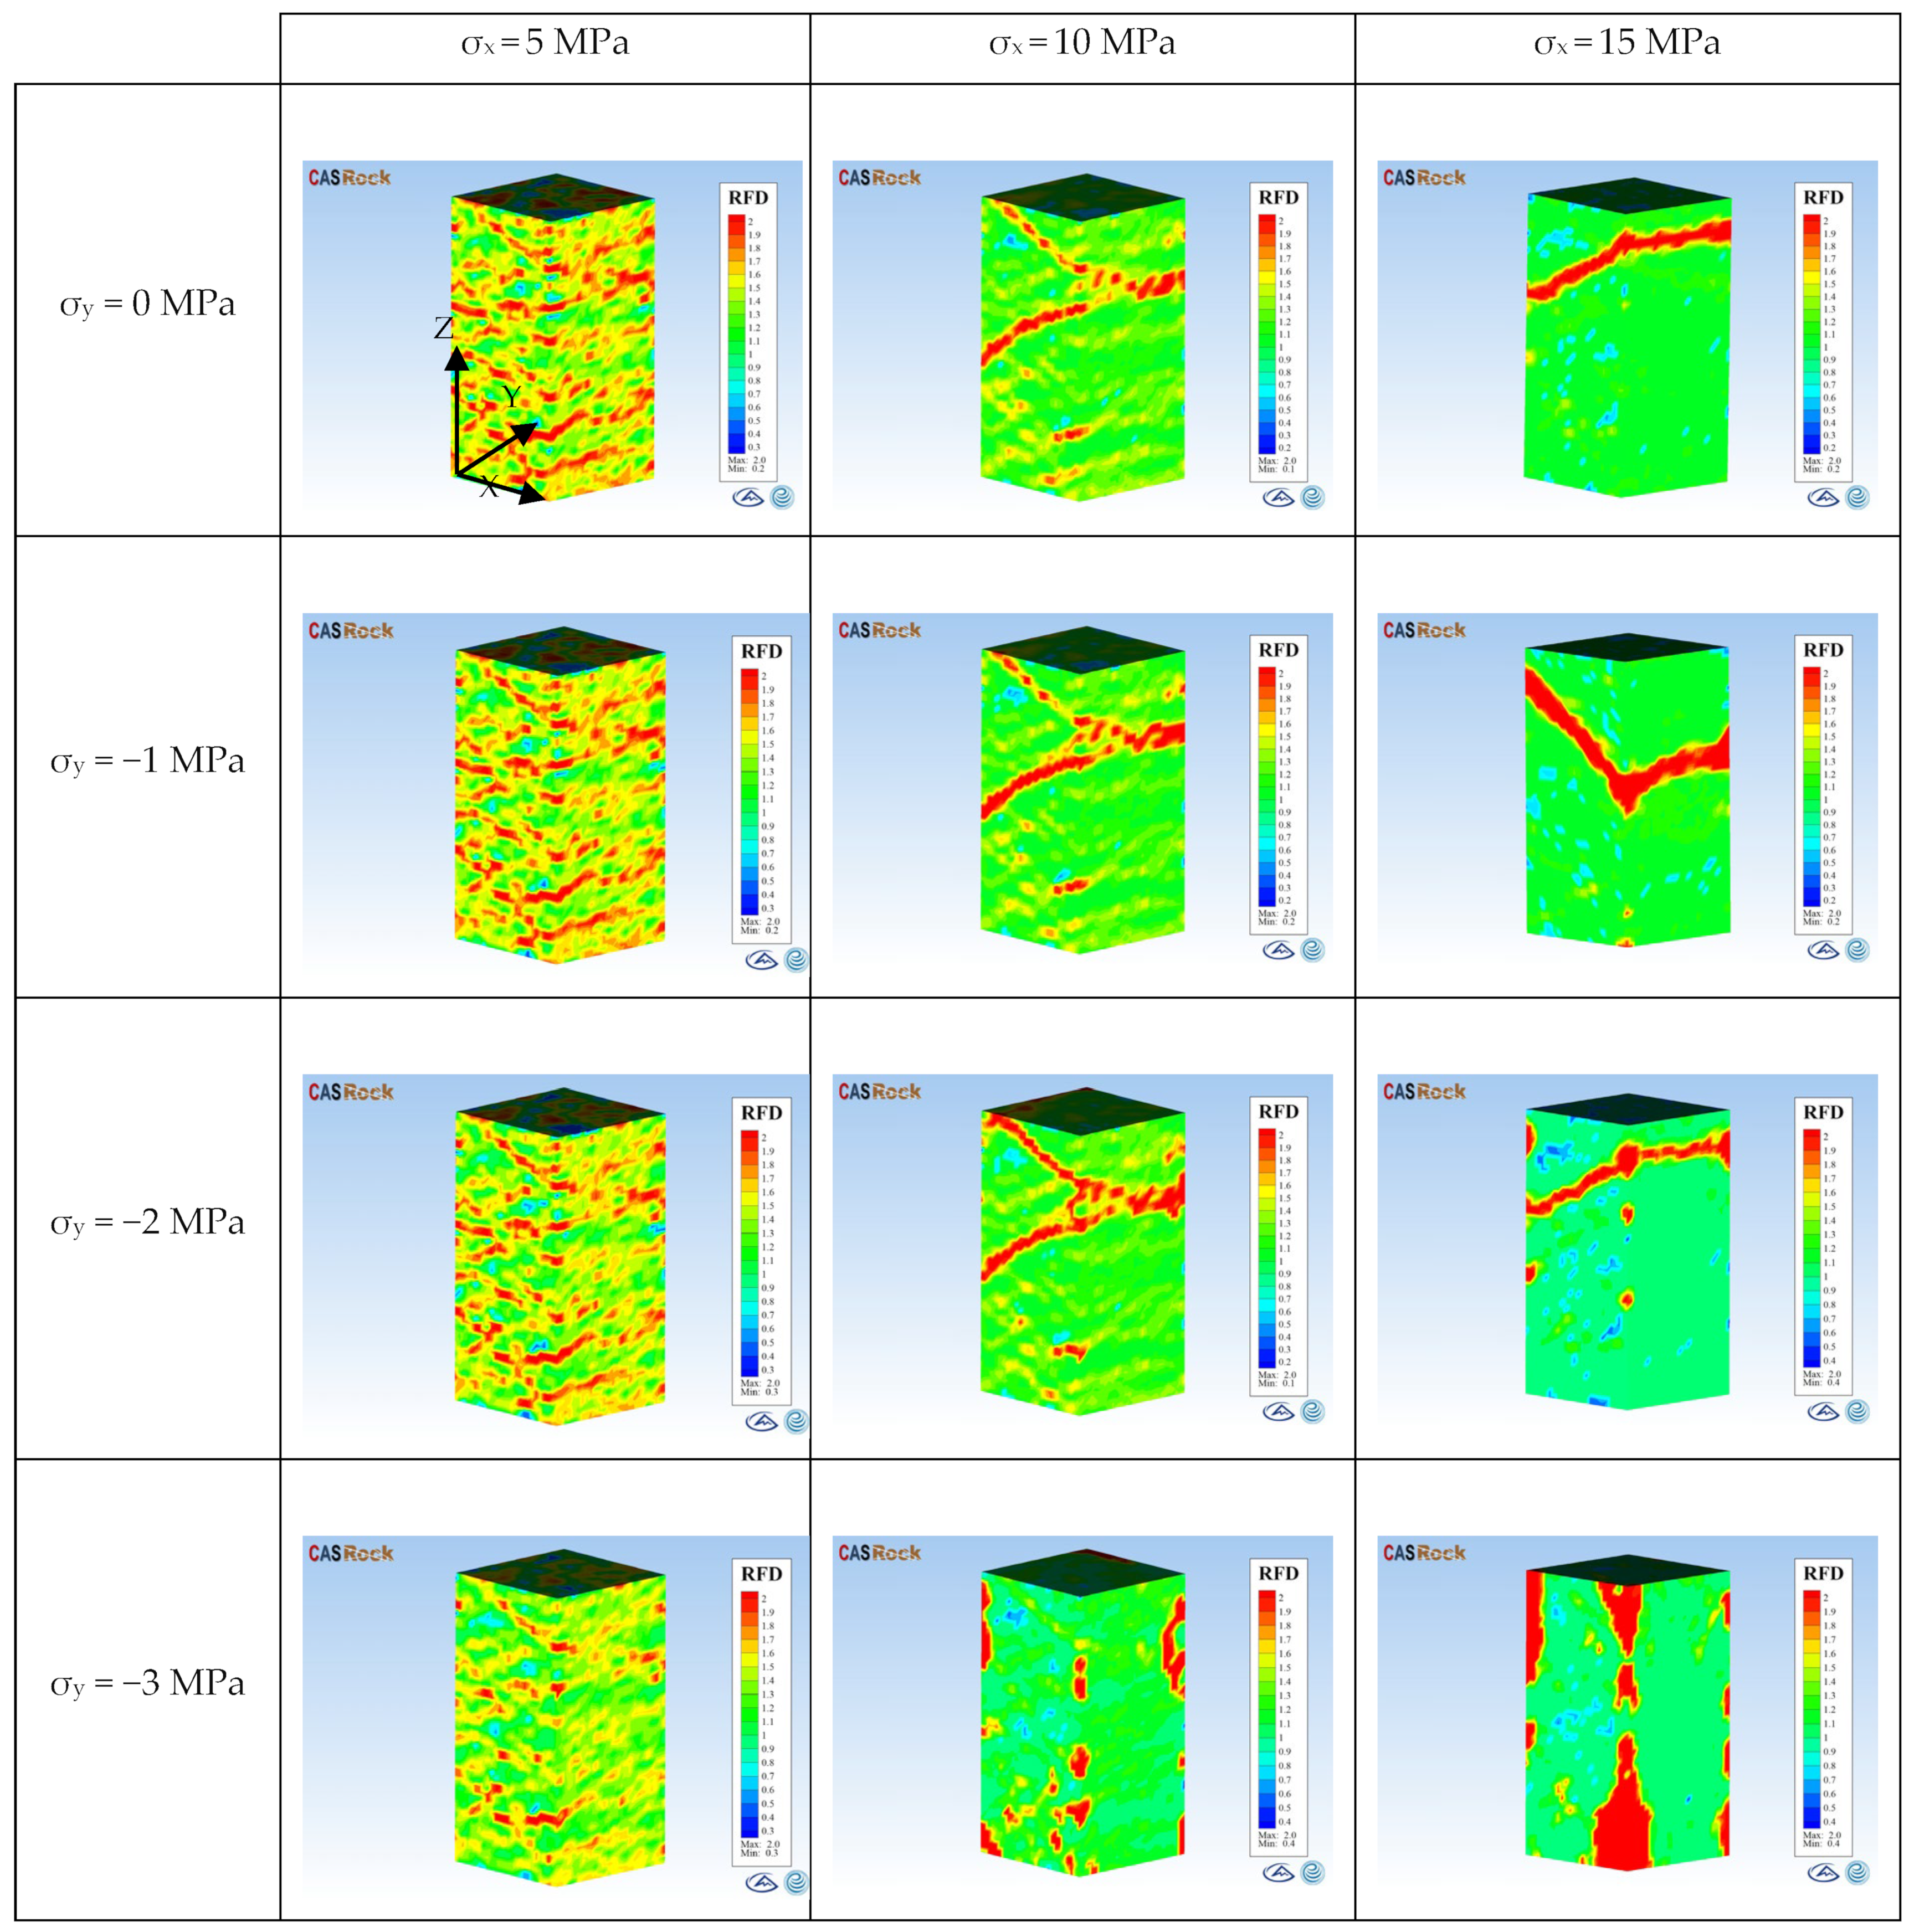
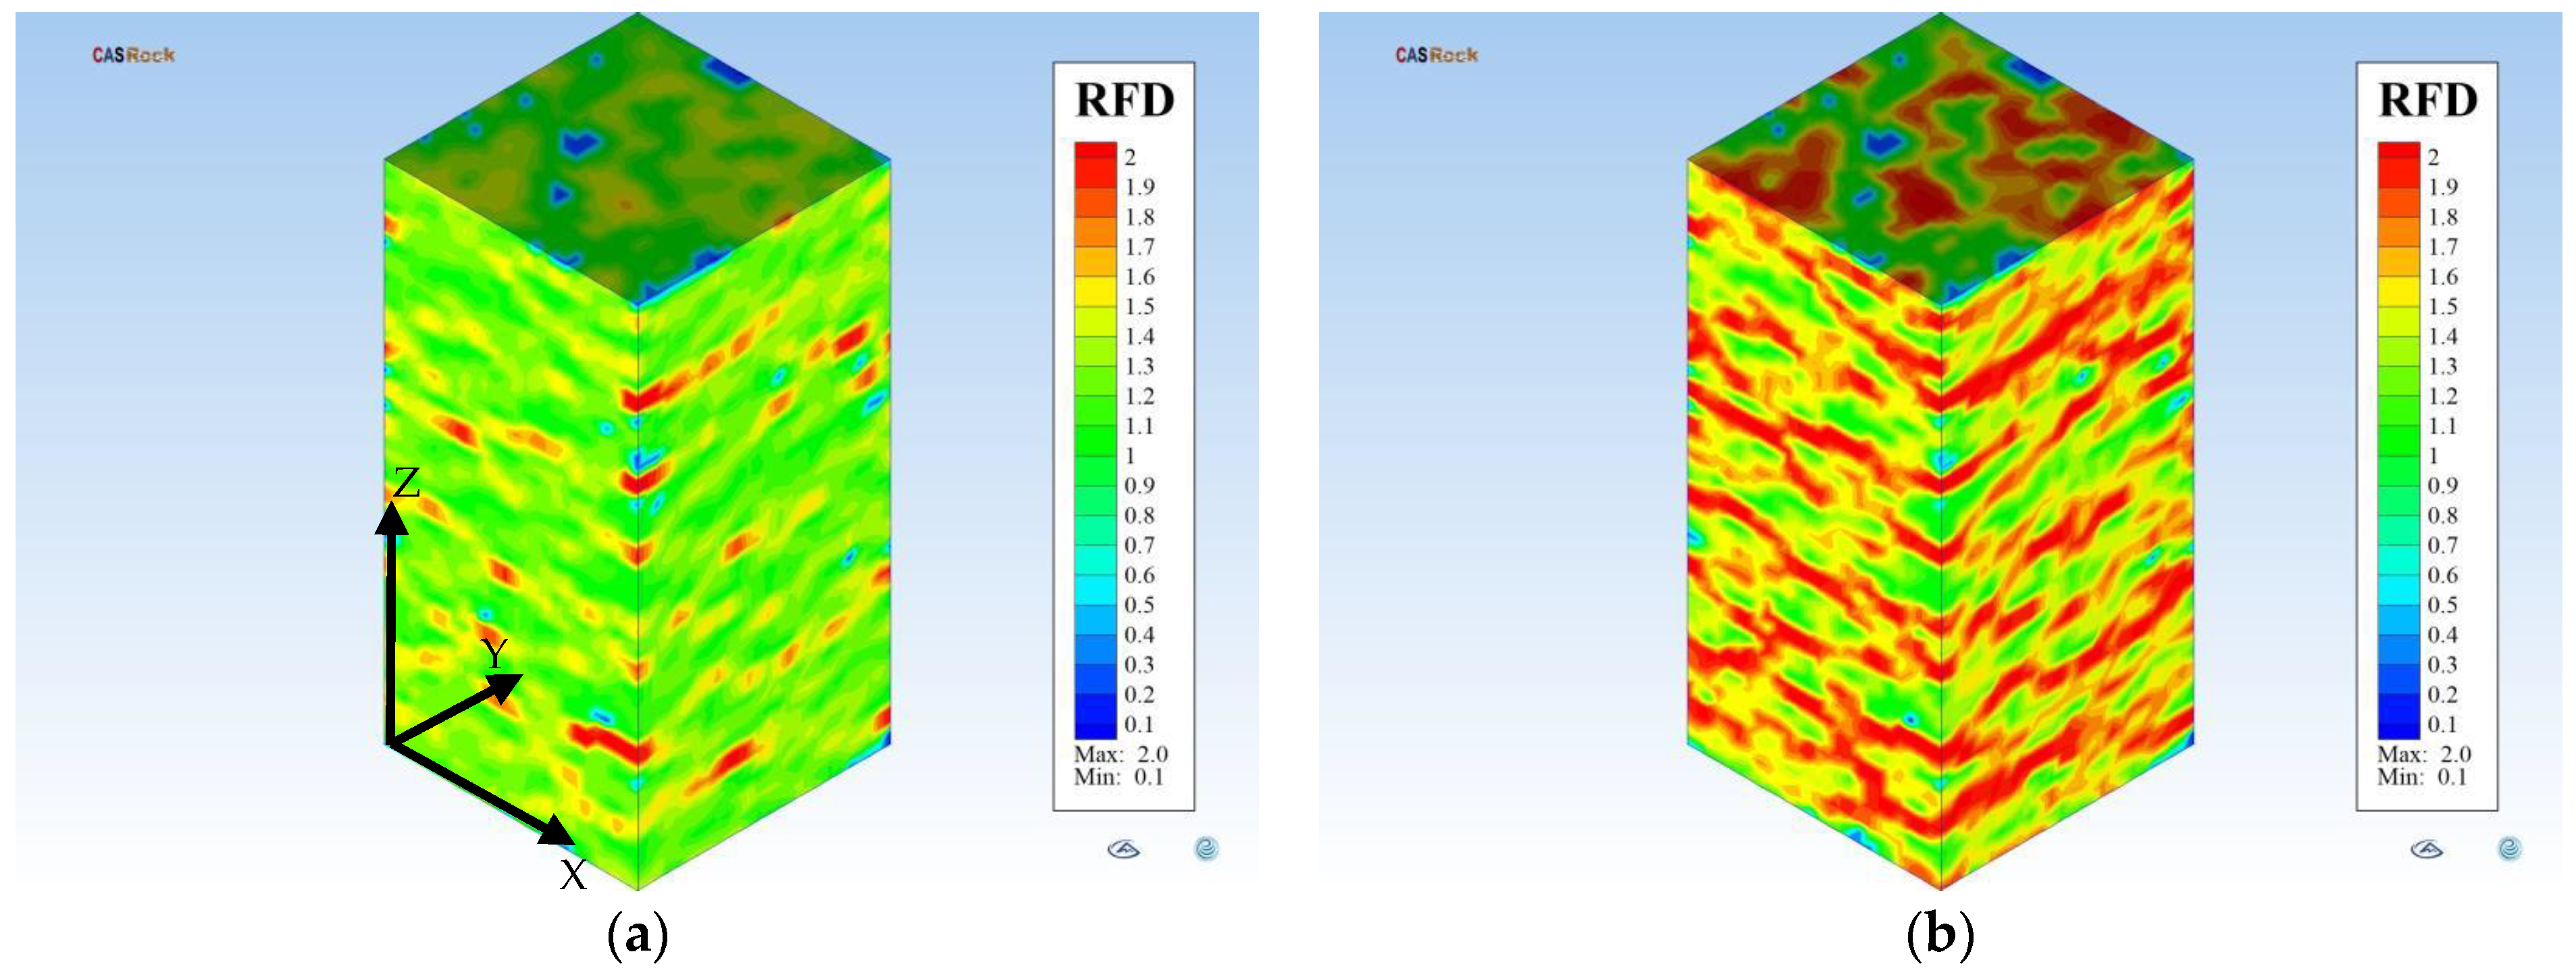
4.1. Fracture Changing

There are few engineering examples of rocks being subjected to one direction of compression and two directions of tension. To understand the deformation and failure rule of rock for this stress condition, 15 groups of simulation experiments were set up, and the three-dimension uniaxial direct tension experiment of rock was set as the control group. The uniaxial tensile strength of the granite model was 4.18 MPa.
Figure 4 shows the crack propagation patterns of granite under different confining pressures. It is found that when the confining pressure σx = 5 MPa, the number of cracks produced during the failure of the granite model is basically the same, and these cracks occur successively with the process of rock stretching. In the final failure of the rock, several or more cracks run through to form the failure surface. When the confining pressure σx = 10 MPa, the rock belongs to shear tensile failure mode. It can be found that the crack starts from the X direction and spreads to the X direction, and finally, forms the failure surface. When σx = 15 MPa, the crack also starts from the X direction and spreads to the X direction, and the failure mode belongs to shear-tension composite failure. When σy =−3 MPa, σx = 10 MPa, 15 MPa, the compressive confining pressure increases, leading to a rapid decline in the tensile strength of granite, which changes the failure mode of rock, showing tensile failure in the Y direction. It is worth noting that the failure conditions are the same when the confining pressure σy =0, −1, and −2 MPa. I will only discuss the failure conditions when the confining pressure σy = −1 MPa. The dip angle of the failure surface changes with the increase in σx, and the failure surface changes from multiple failure surfaces at σx = 5 MPa to one failure surface at σx = 15 MPa, and the failure mode changes from tensile failure at σx = 5 MPa to shear-tensile composite failure mode at σx = 15 MPa.
To further analyze the relationship between the angle of failure plane and the confining pressure σx, the failure results of granite under confining pressure σy = −1, σx = 5, 10, 15 MPa were sectioning in the center of the model and the direction of the section was y plane. As shown in Figure 5, it can be more intuitively and clearly judged by the slicing effect that with the increase in the confining pressure σx, the number of failure surfaces produced by granite when it reaches peak load decreases. The slices were binarized and the failure plane angle θ was calibrated (the included Angle between the fracture and X-axis after the slices). The results show that when the confining pressure σx = 5 MPa and θ = 20°, more cracks occur. When the confining pressure σx = 10 MPa, θ = 31°, the rock is broken by the propagation of two main cracks, and the number of secondary cracks is less. When the confining pressure σx = 15 MPa and θ = 35°, the rock is broken through by a crack propagation, and no other secondary cracks occur macroscopically.
Taken together, it can be concluded that the confining pressure σx has a great influence on the spreading morphology of failure surface. When the confining pressure σx = 5 MPa, there are more failure surfaces and the dip angle of failure surface θ = 20°.When σx = 10 MPa, there are two failure surfaces, with dip angle θ = 31°, and secondary cracks that do not penetrate the rock. When σx = 15 MPa, there is only one failure surface, and the angle of failure surface θ = 35°, and no secondary cracks are produced in the macroscopic process. Based on the crack propagation evolution rule [26,27], the rock mass contained primary cracks with different sizes, numbers, and shapes. When the confining pressure σx was applied to the rock mass, the change of the primary cracks in the rock mass was not consistent, and the stress concentration at the crack tip was also different. After the tensile and confining pressure were applied, the original cracks in the rock mass begin to crack at a certain angle.

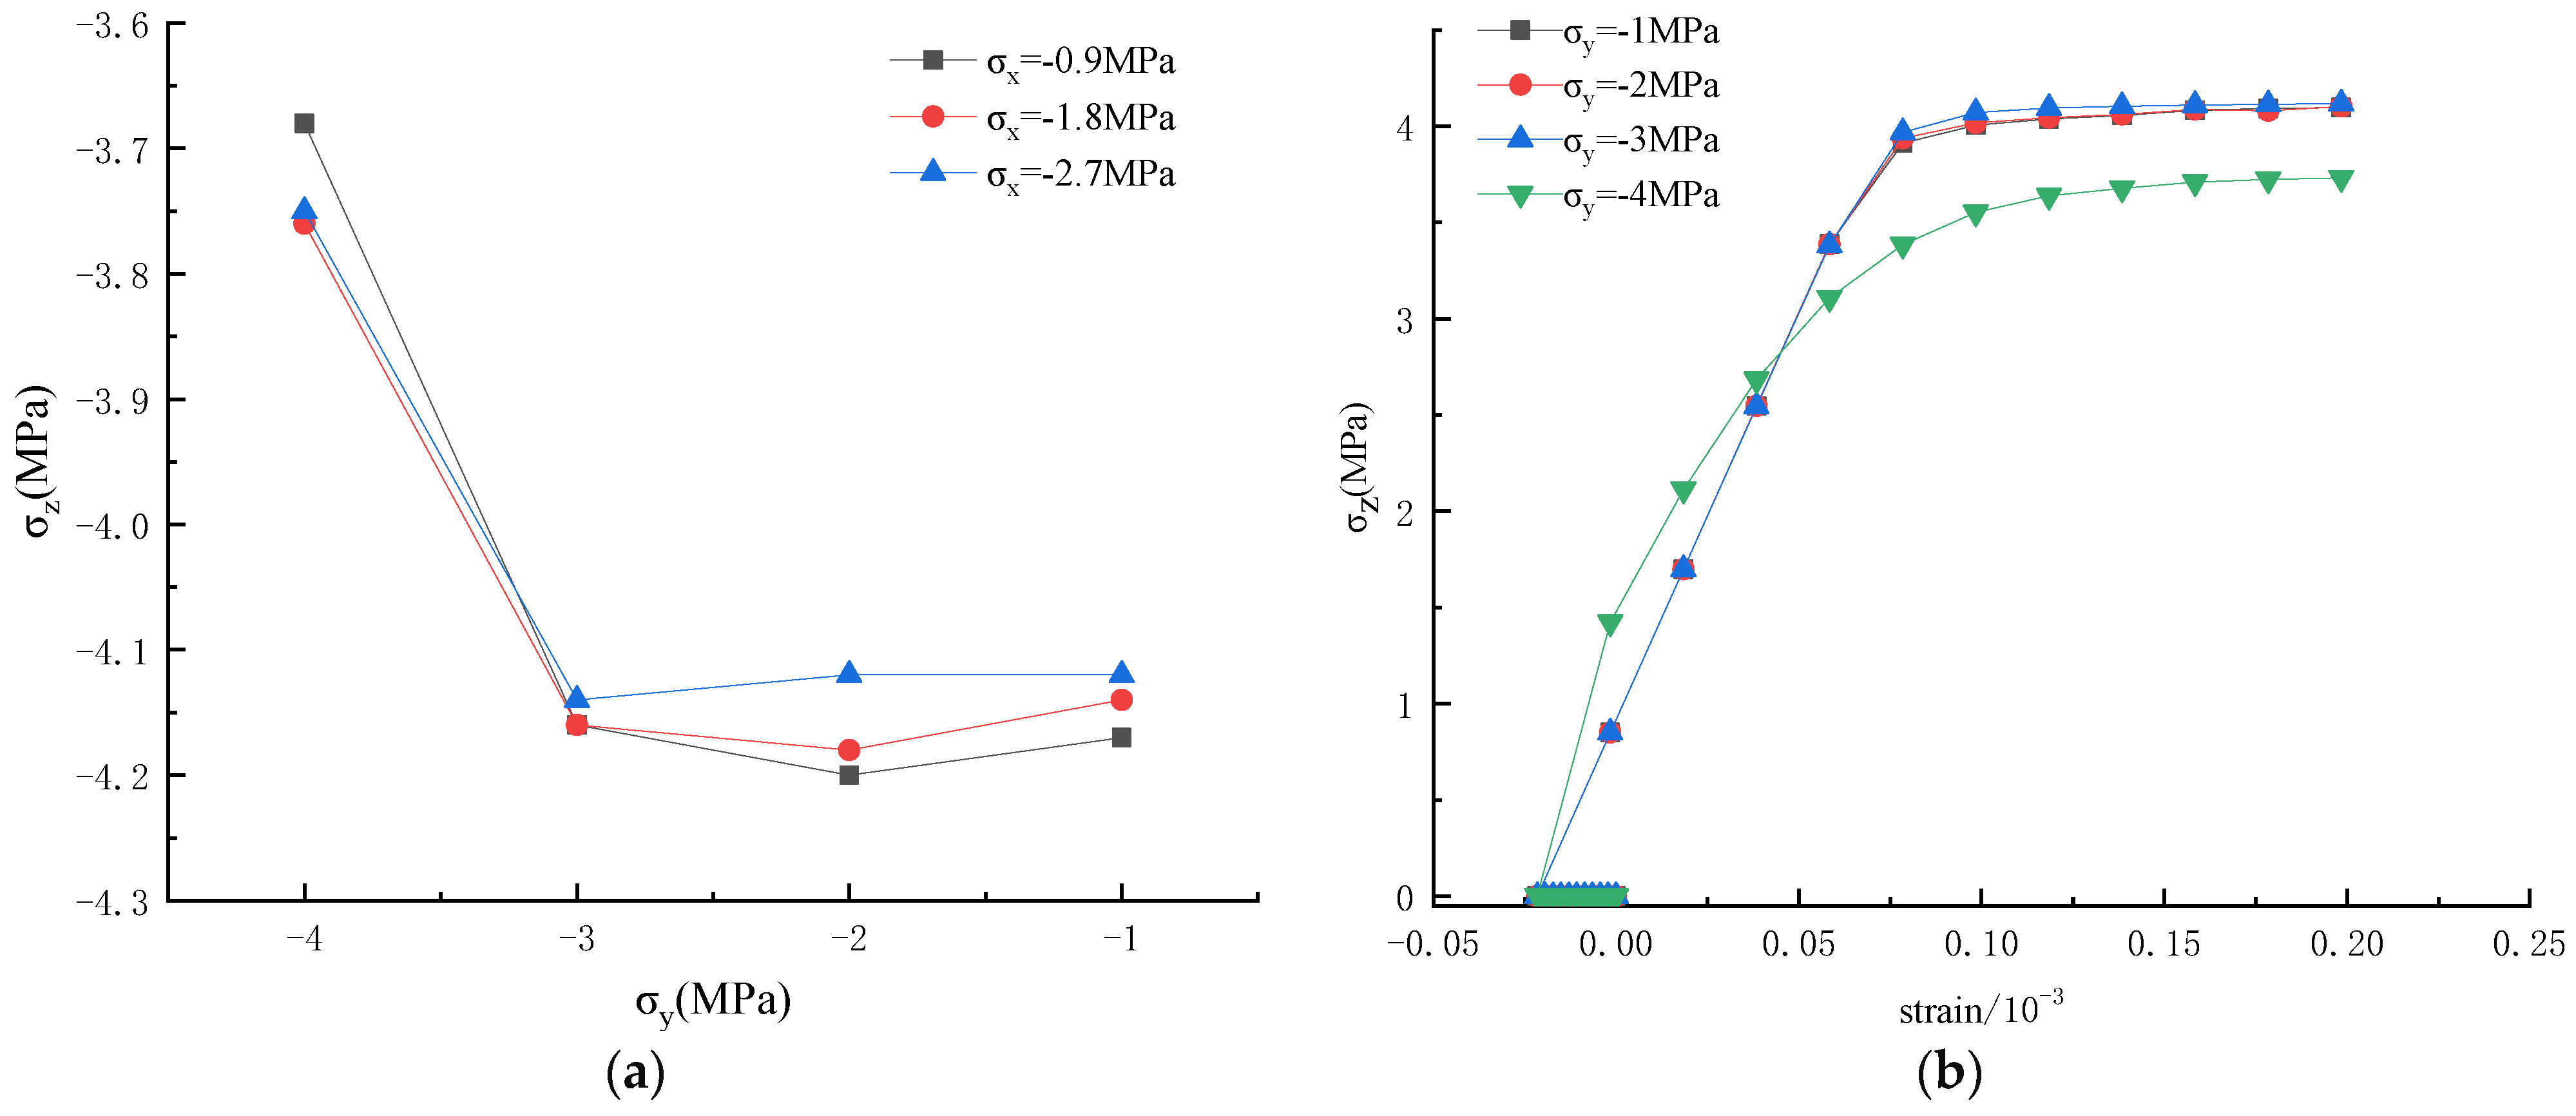
4.2. Strength Change

To further analyze the influence of confining pressure σx on tensile strength values, a set of experiments are added as a comparative study. Results show that the confining pressure σx = 5 MPa, σy = 4 MPa, the tensile strength of granite model value of σt = 3.46 MPa < |σy| = 4 MPa, shows that rock tensile damage from the y direction, it may occur destroying due to the confining pressure σy too much before loading in the Z direction. The obtained value σt = −3.46 MPa is not the tensile strength of the complete rock. Therefore, the inaccurate experimental results at the confining pressure = −4 MPa are discarded and the direct tensile strength values of the model under different confining pressures σx and σy are obtained in Table 3.
Using the data from Table 3, the strength curve was drawn, and is shown in Figure 6a. When the tensile confining pressure increases from 0 MPa to 2 MPa, the tensile strength of the granite decreases from 4.12 MPa to 3.69 MPa; meanwhile, when the tensile confining pressure increases from 2 MPa to 3 MPa, the tensile strength of the rock decreases from 4.10 MPa to 3.60 MPa, which decreases faster than the previous tensile strength. This shows that when σy = −2 MPa, the failure criterion of the rock mass changes, and this value may be the critical value of the internal change of the rock mass. Longitudinally, with the increase in the compression confining pressure σx, the tensile strength of the rock decreases. The tensile strength of the granite decreases with the increase in the confining pressure, but the change of the tensile strength with the compression confining pressure is greater than that with the tensile confining pressure.
Figure 6b,c are the stress–strain curves based on the experimental data (stress–strain in the z direction). Figure 6b reflects the two-way tensile stress state. When the tensile confining pressure in the y direction is less than the uniaxial tensile strength, the stress–strain curve trend is basically the same. When the tensile confining pressure in the y direction is close to the uniaxial tensile strength, the greater the σy value is, the easier it is to reach the tensile strength value for the same deformation condition. Figure 6c shows the tensile stress–strain curve corresponding to different confining pressures. It can be seen from the figure that with the increase of σx, the peak value of the tensile stress–strain curve decreases. In other words, the tensile strength decreases. At the same time, the larger the σx is, the smaller the area of the tensile stress–strain curve and the transverse axis is, which means that the larger the confining pressure σx is, the smaller the value of the required tensile fracture energy is.

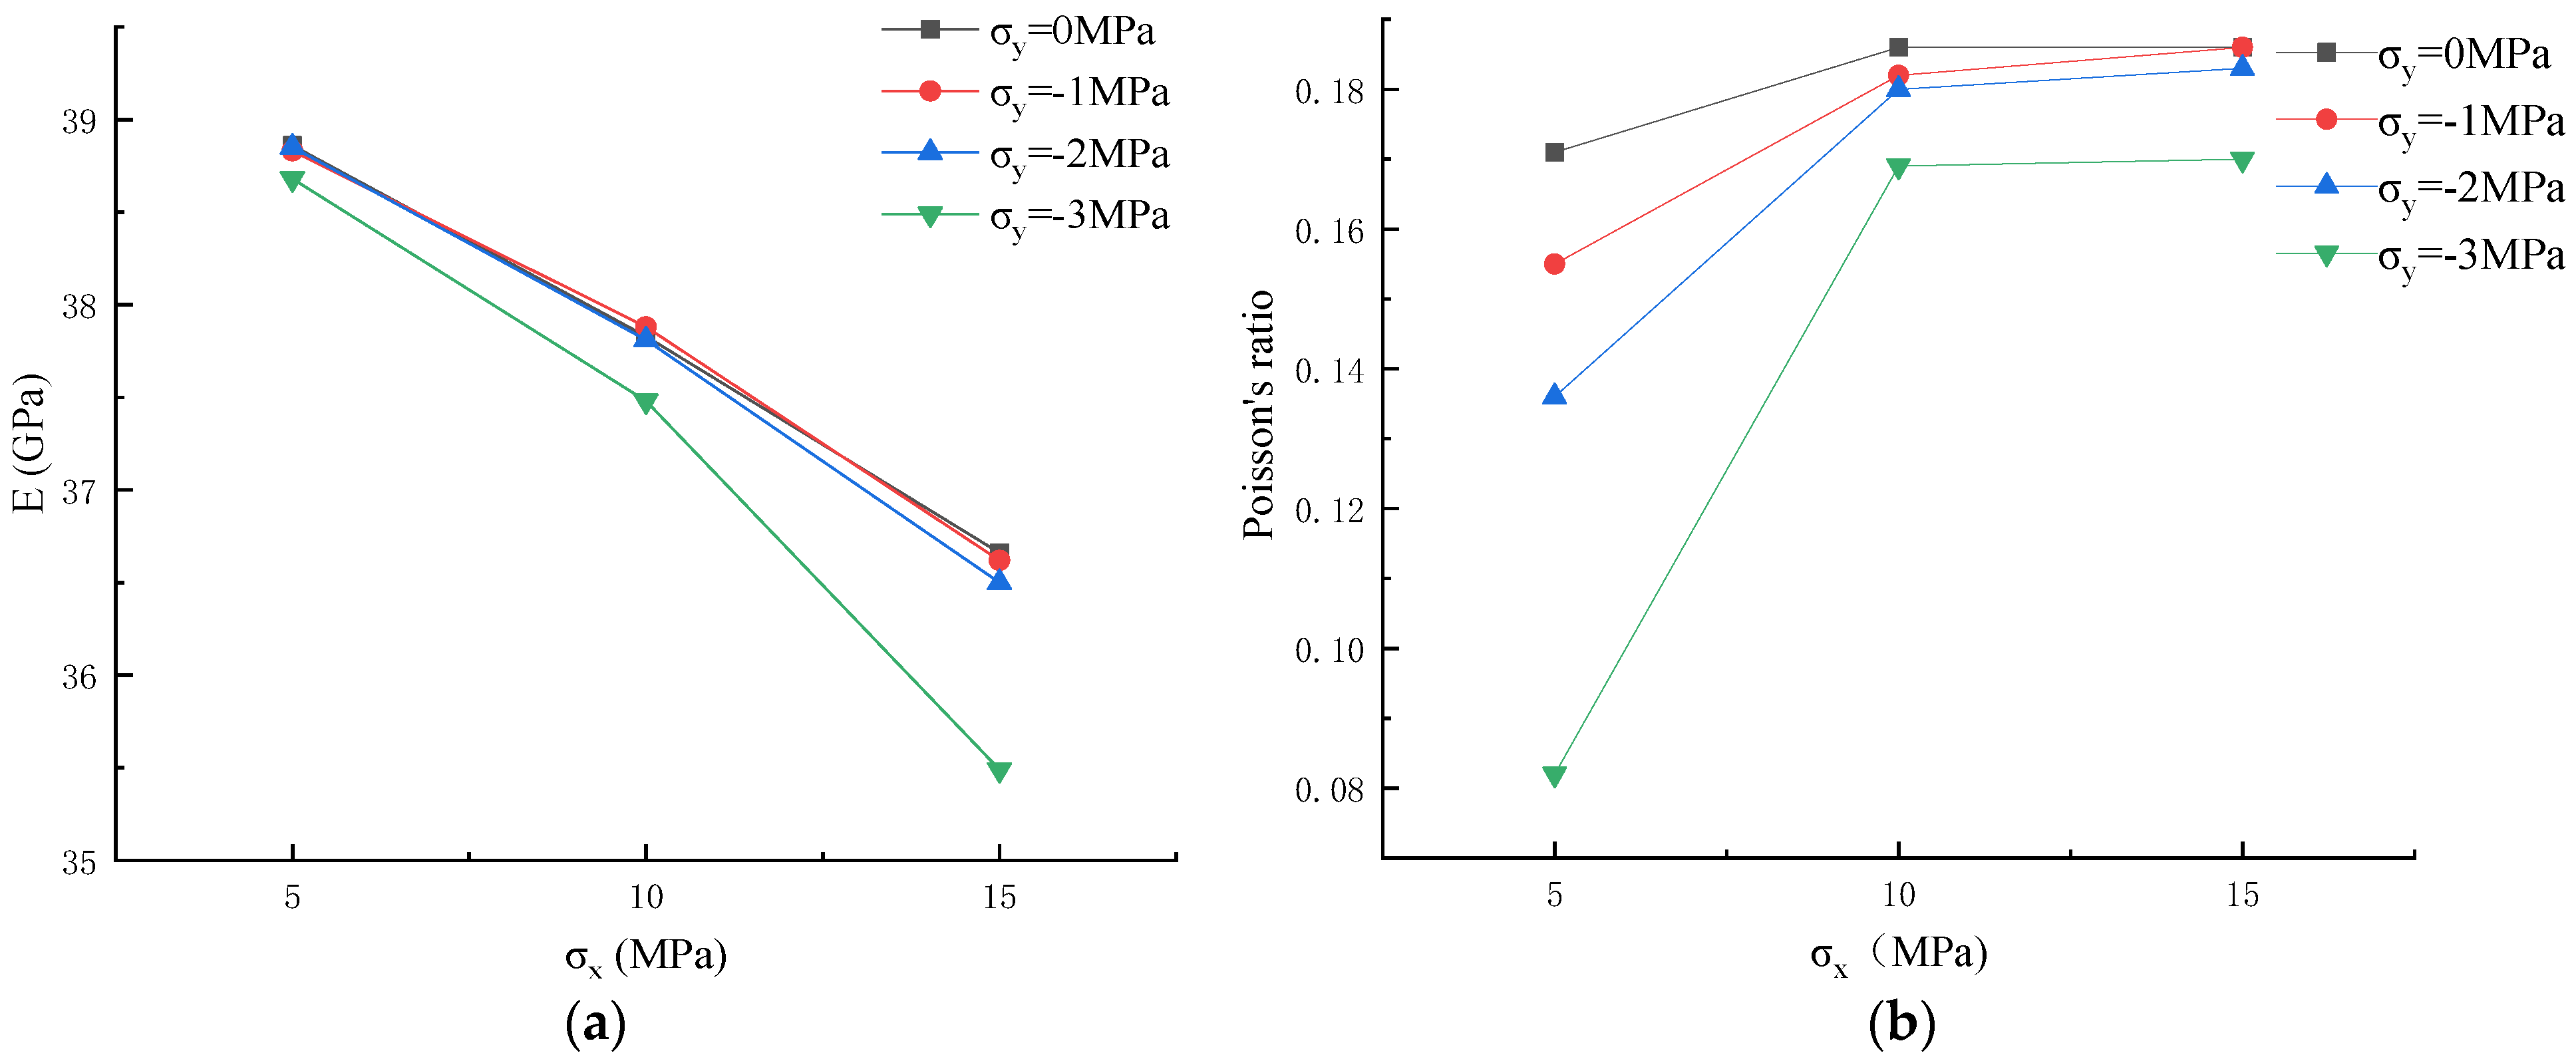
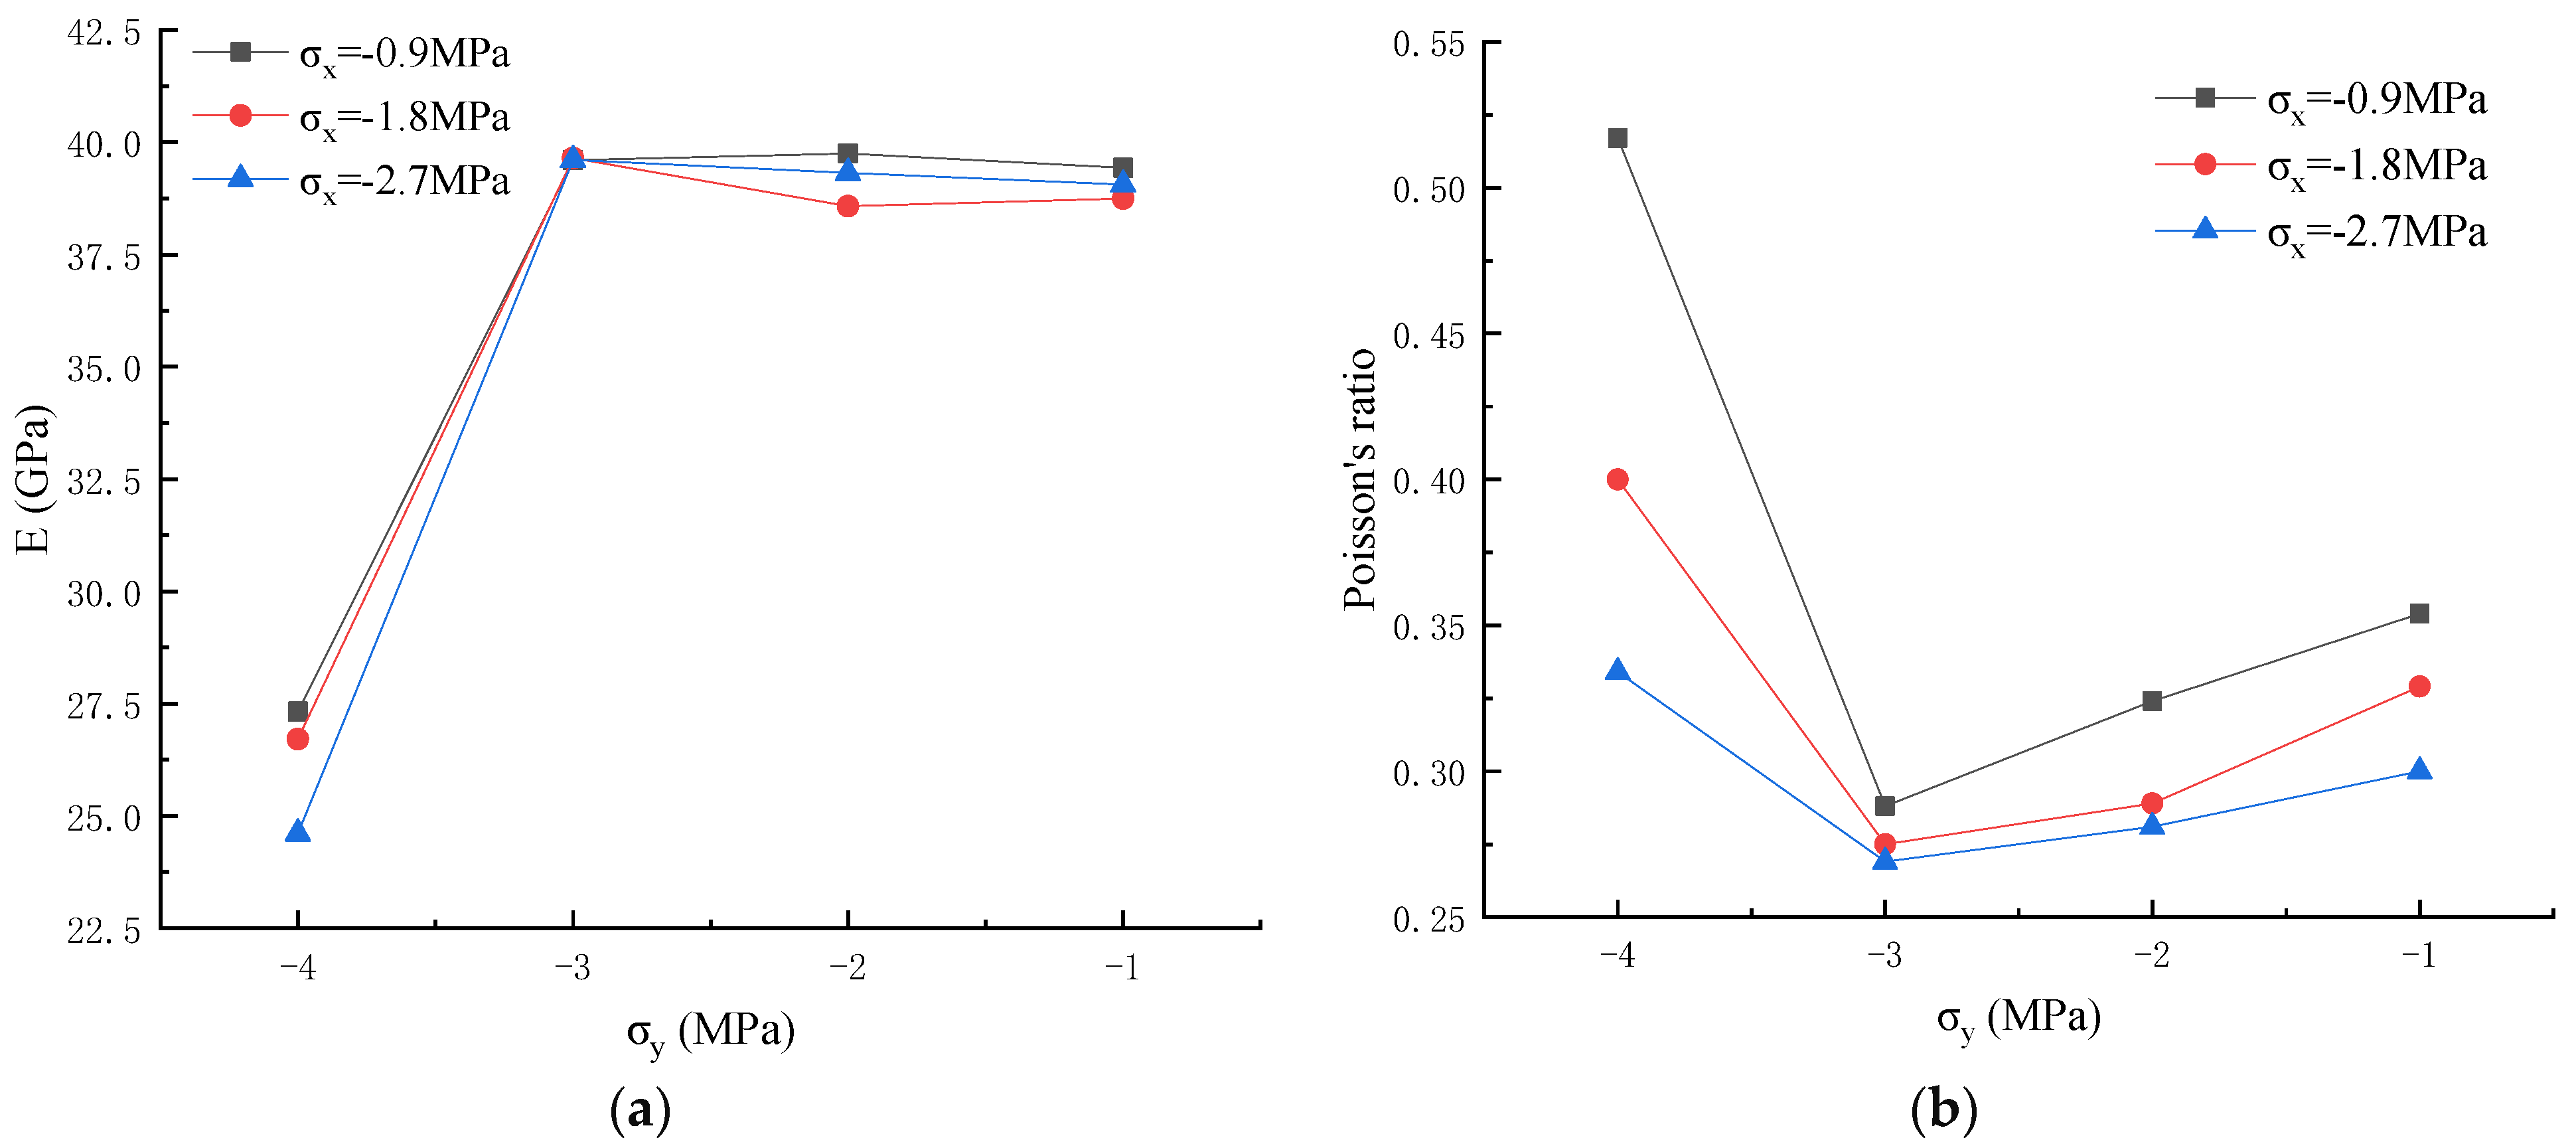
4.3. Changing the Elastic Modulus and Poisson’s Ratio

Based on the experimental data, the curves of the elastic modulus and Poisson’s ratio with the confining pressure were obtained. As shown in Figure 7a, the elastic modulus decreases with the increase in the compression confining pressure σx and decreases with the increase in the tensile confining pressure, but the change is obviously less than that with the change of the compression confining pressure. When σy = −3 MPa, the change trend is different from the other change trends, and the confining pressure decreases faster, as shown in Figure 7a. The reason for this may be that when the tensile confining pressure is close to the uniaxial tensile strength, the granite has been broken and destroyed before the displacement loading experiment in the z direction, and the parameters in the rock have changed, resulting in the decrease in the elastic modulus when σy = −3 MPa. Figure 7b generally reflects the fact that the Poisson’s ratio increases with the increase in the compression confining pressure σx, but the compression confining pressure less than 10 MPa has a great influence on the growth rate of Poisson’s ratio, and the Poisson’s ratio decreases with the increase in the tensile confining pressure.

5. Three-Direction Tension Experiment Results and Discussion

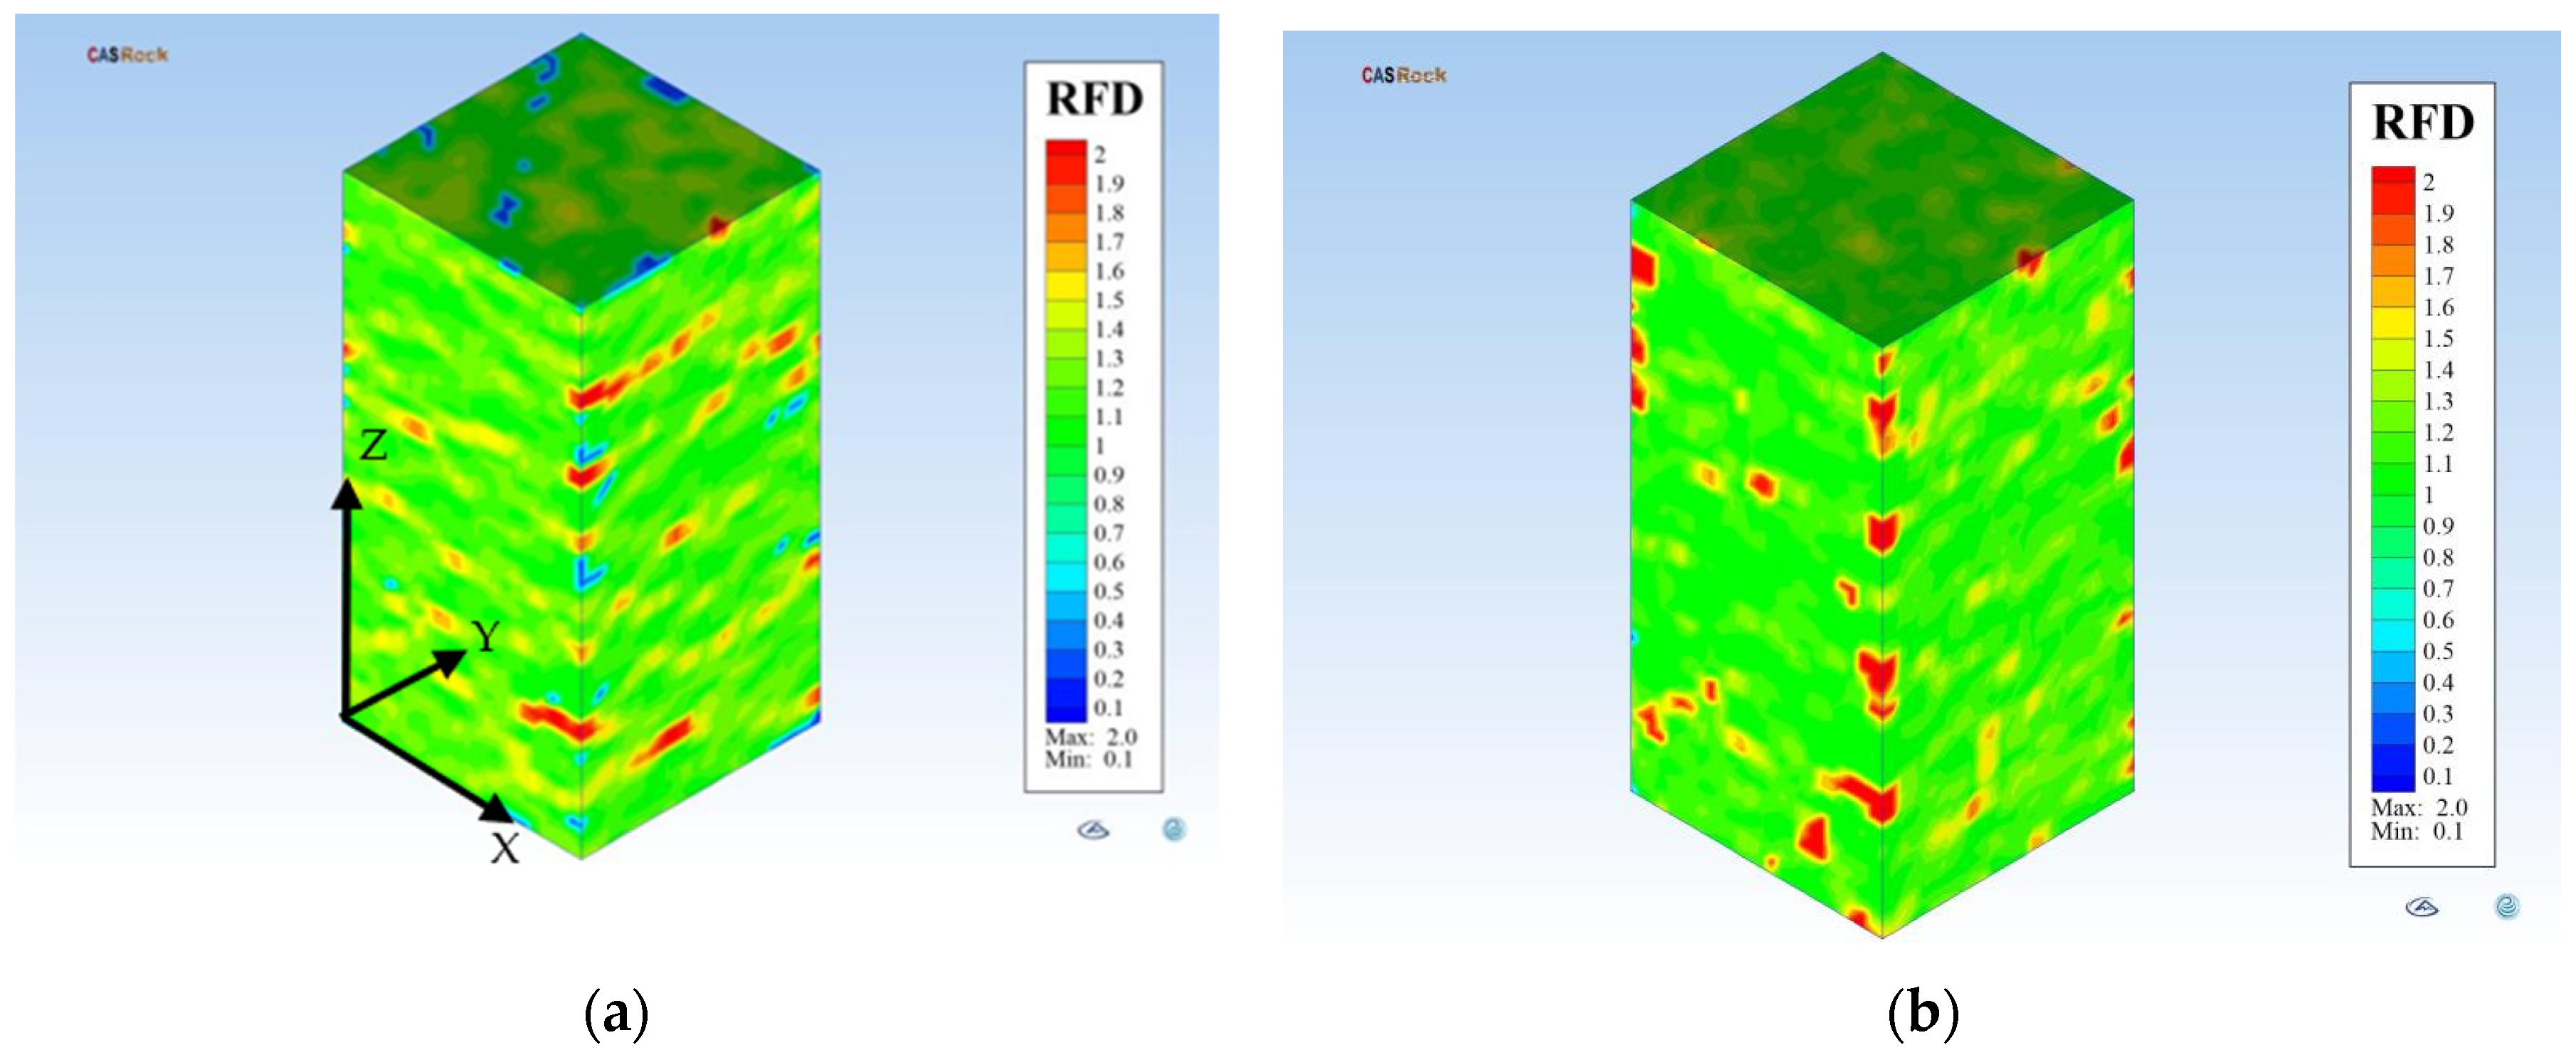
5.1. Fracture Changing

The three-direction tension stress state has a special stress mode and few engineering examples, so there have been no physical experimental or numerical simulation experimental studies on the three-direction tension. In this work, 12 groups of numerical simulation experiments were used to study the deformation and failure rule of granite with a three-direction tension load. Through the numerical simulation experiment results, we found that although the specimen was subjected to different tensile stress conditions, the failure mode of the model was very similar. Due to the three-dimensional tension experiment, the tensile confining pressures σx and σy are close in numerical values, and the average force and the deviatoric stress path are similar to the uniaxial tensile stress state, so the number of cracks and the inclination angle of the failure surface are almost the same, and the failure is also very similar to the uniaxial tensile failure. As shown in Figure 8, when the tensile confining pressures σx and σy are close, CASRock calculates the failure cloud chart of the 44th and 82nd steps. Figure 9 shows the failure cloud chart step 38: σx= −2.7 MPa, σy = −1, −4 MPa, it can be found that even though the tensile confining pressure in one direction is close to the uniaxial tensile strength, the granite exhibits tensile failure from the Z direction, which is in sharp contrast to the result in Figure 5. According to Figure 5 and Figure 9, when the tensile confining pressure σy = 4 MPa in the Y direction of the granite model, the compressive confining pressure will change the failure mode of the rock, that is, the tensile failure in the Z direction becomes the tensile failure in the Y direction.

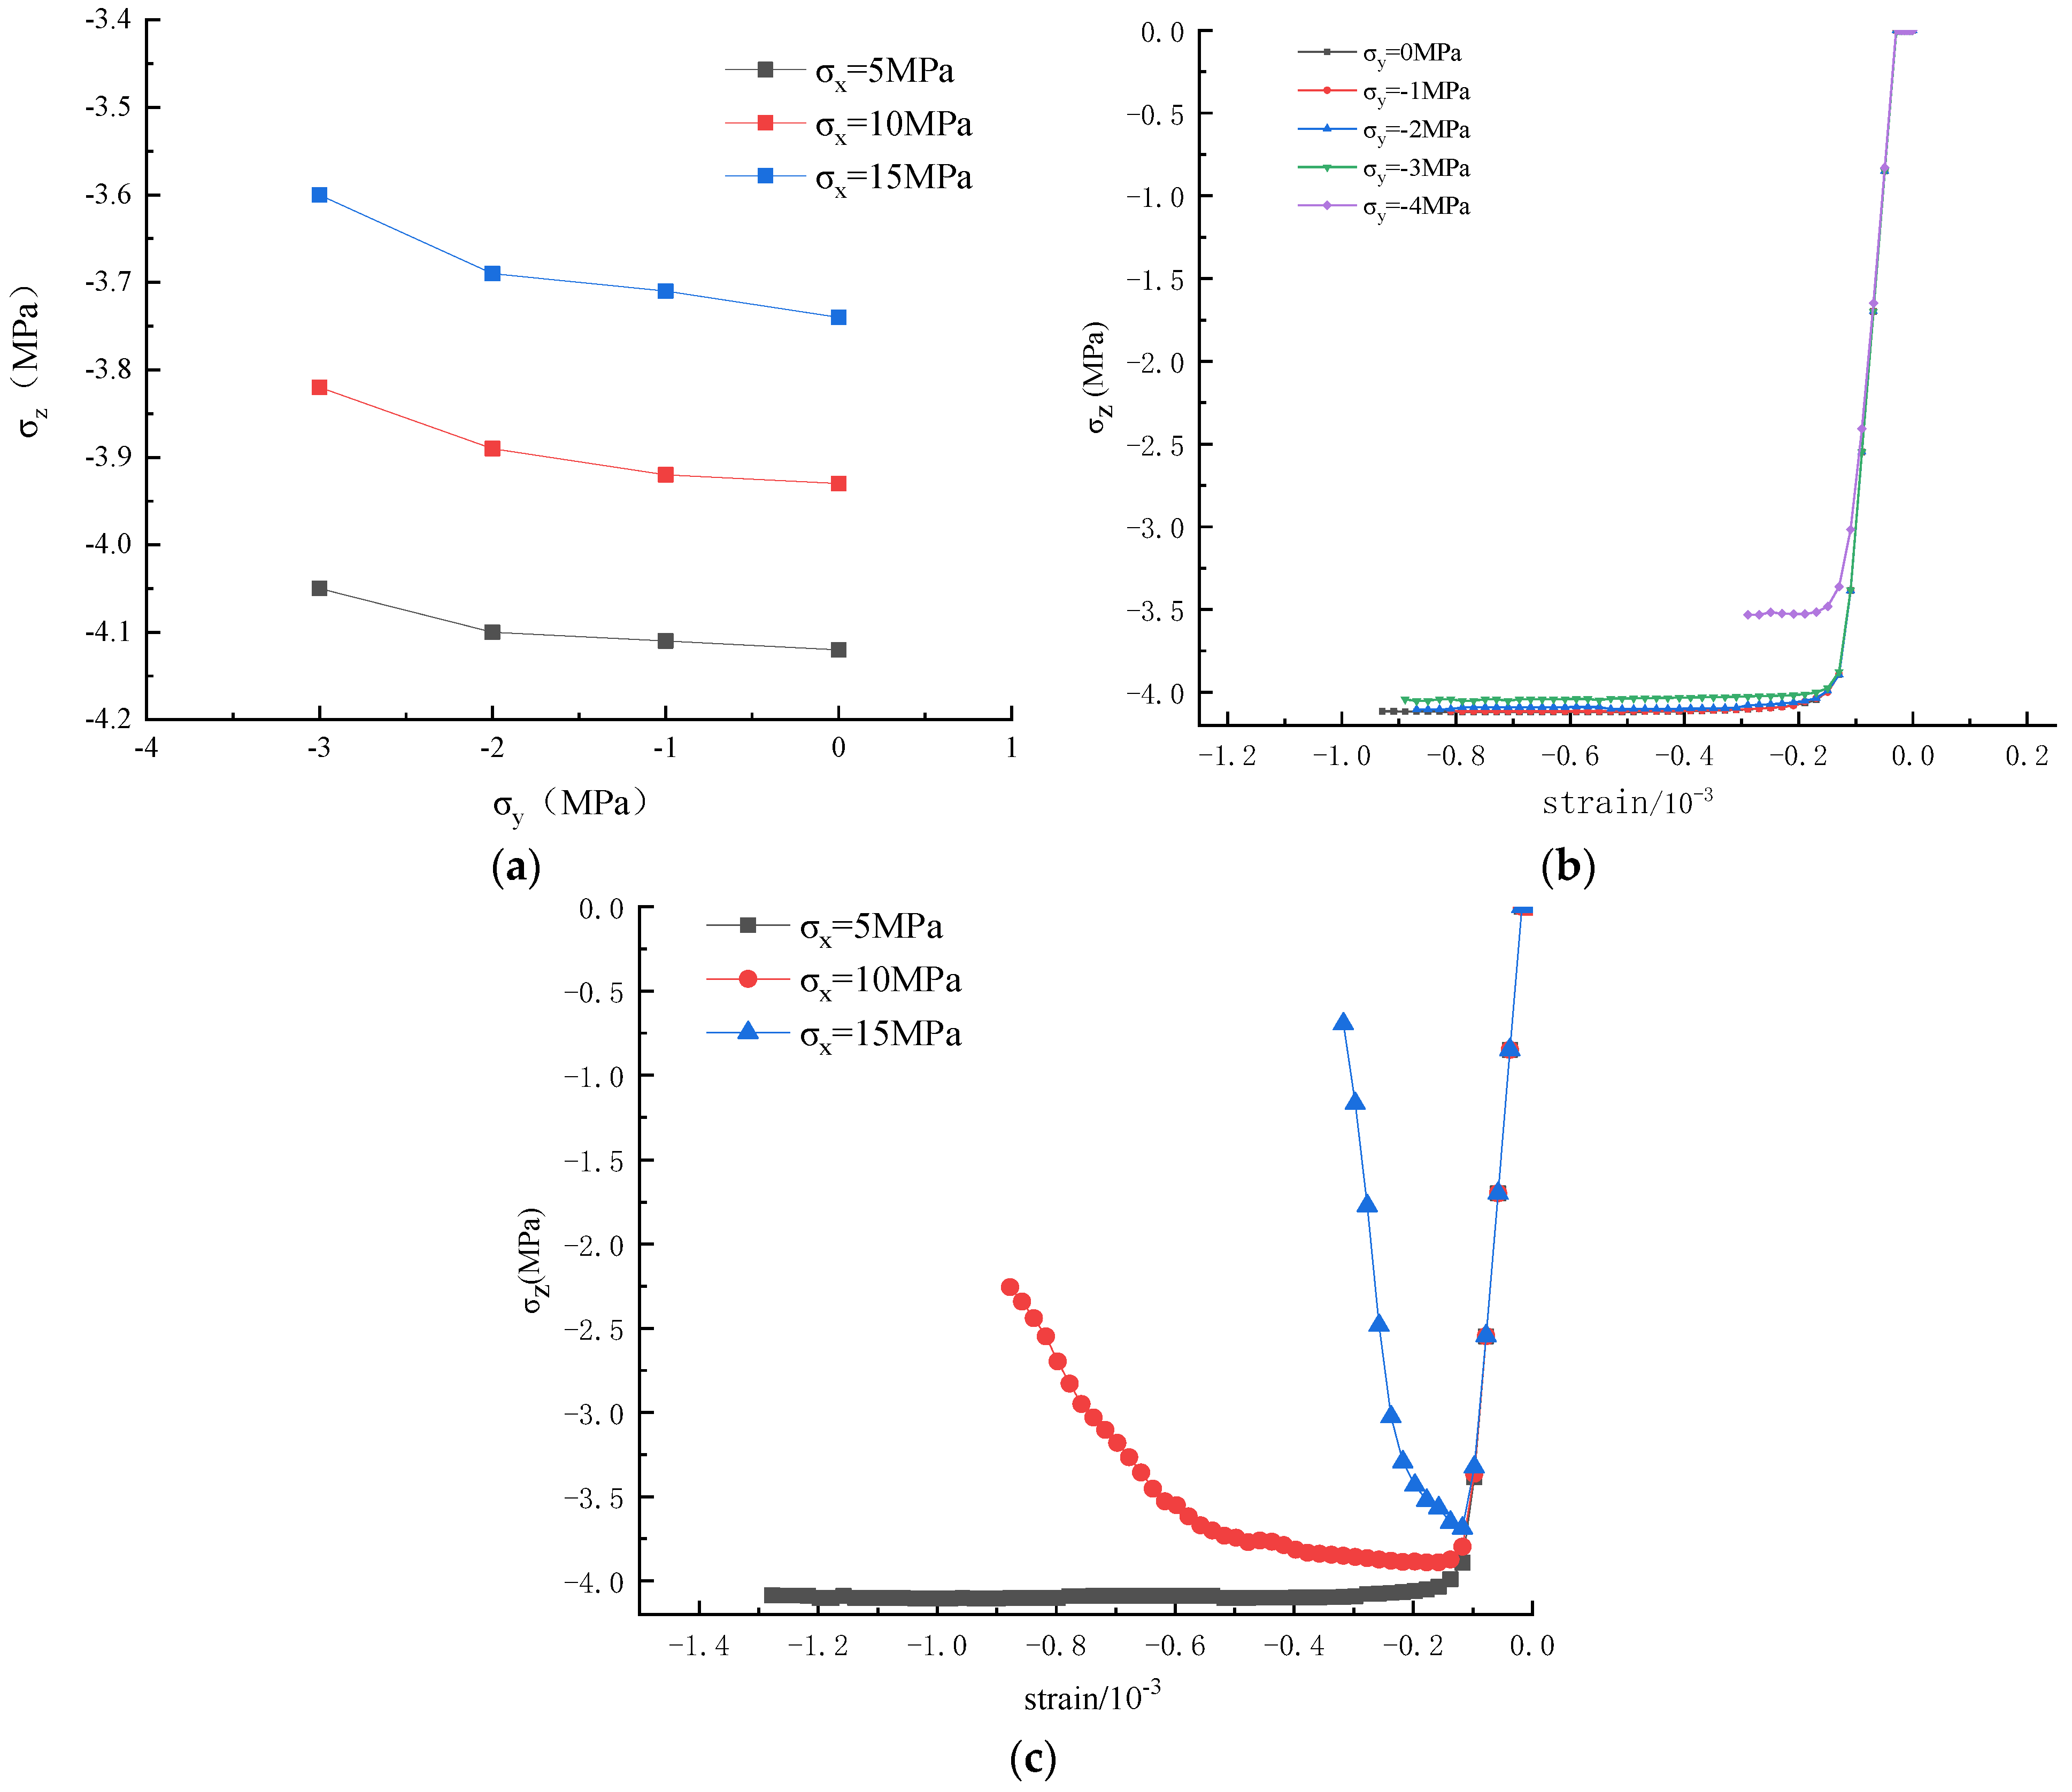
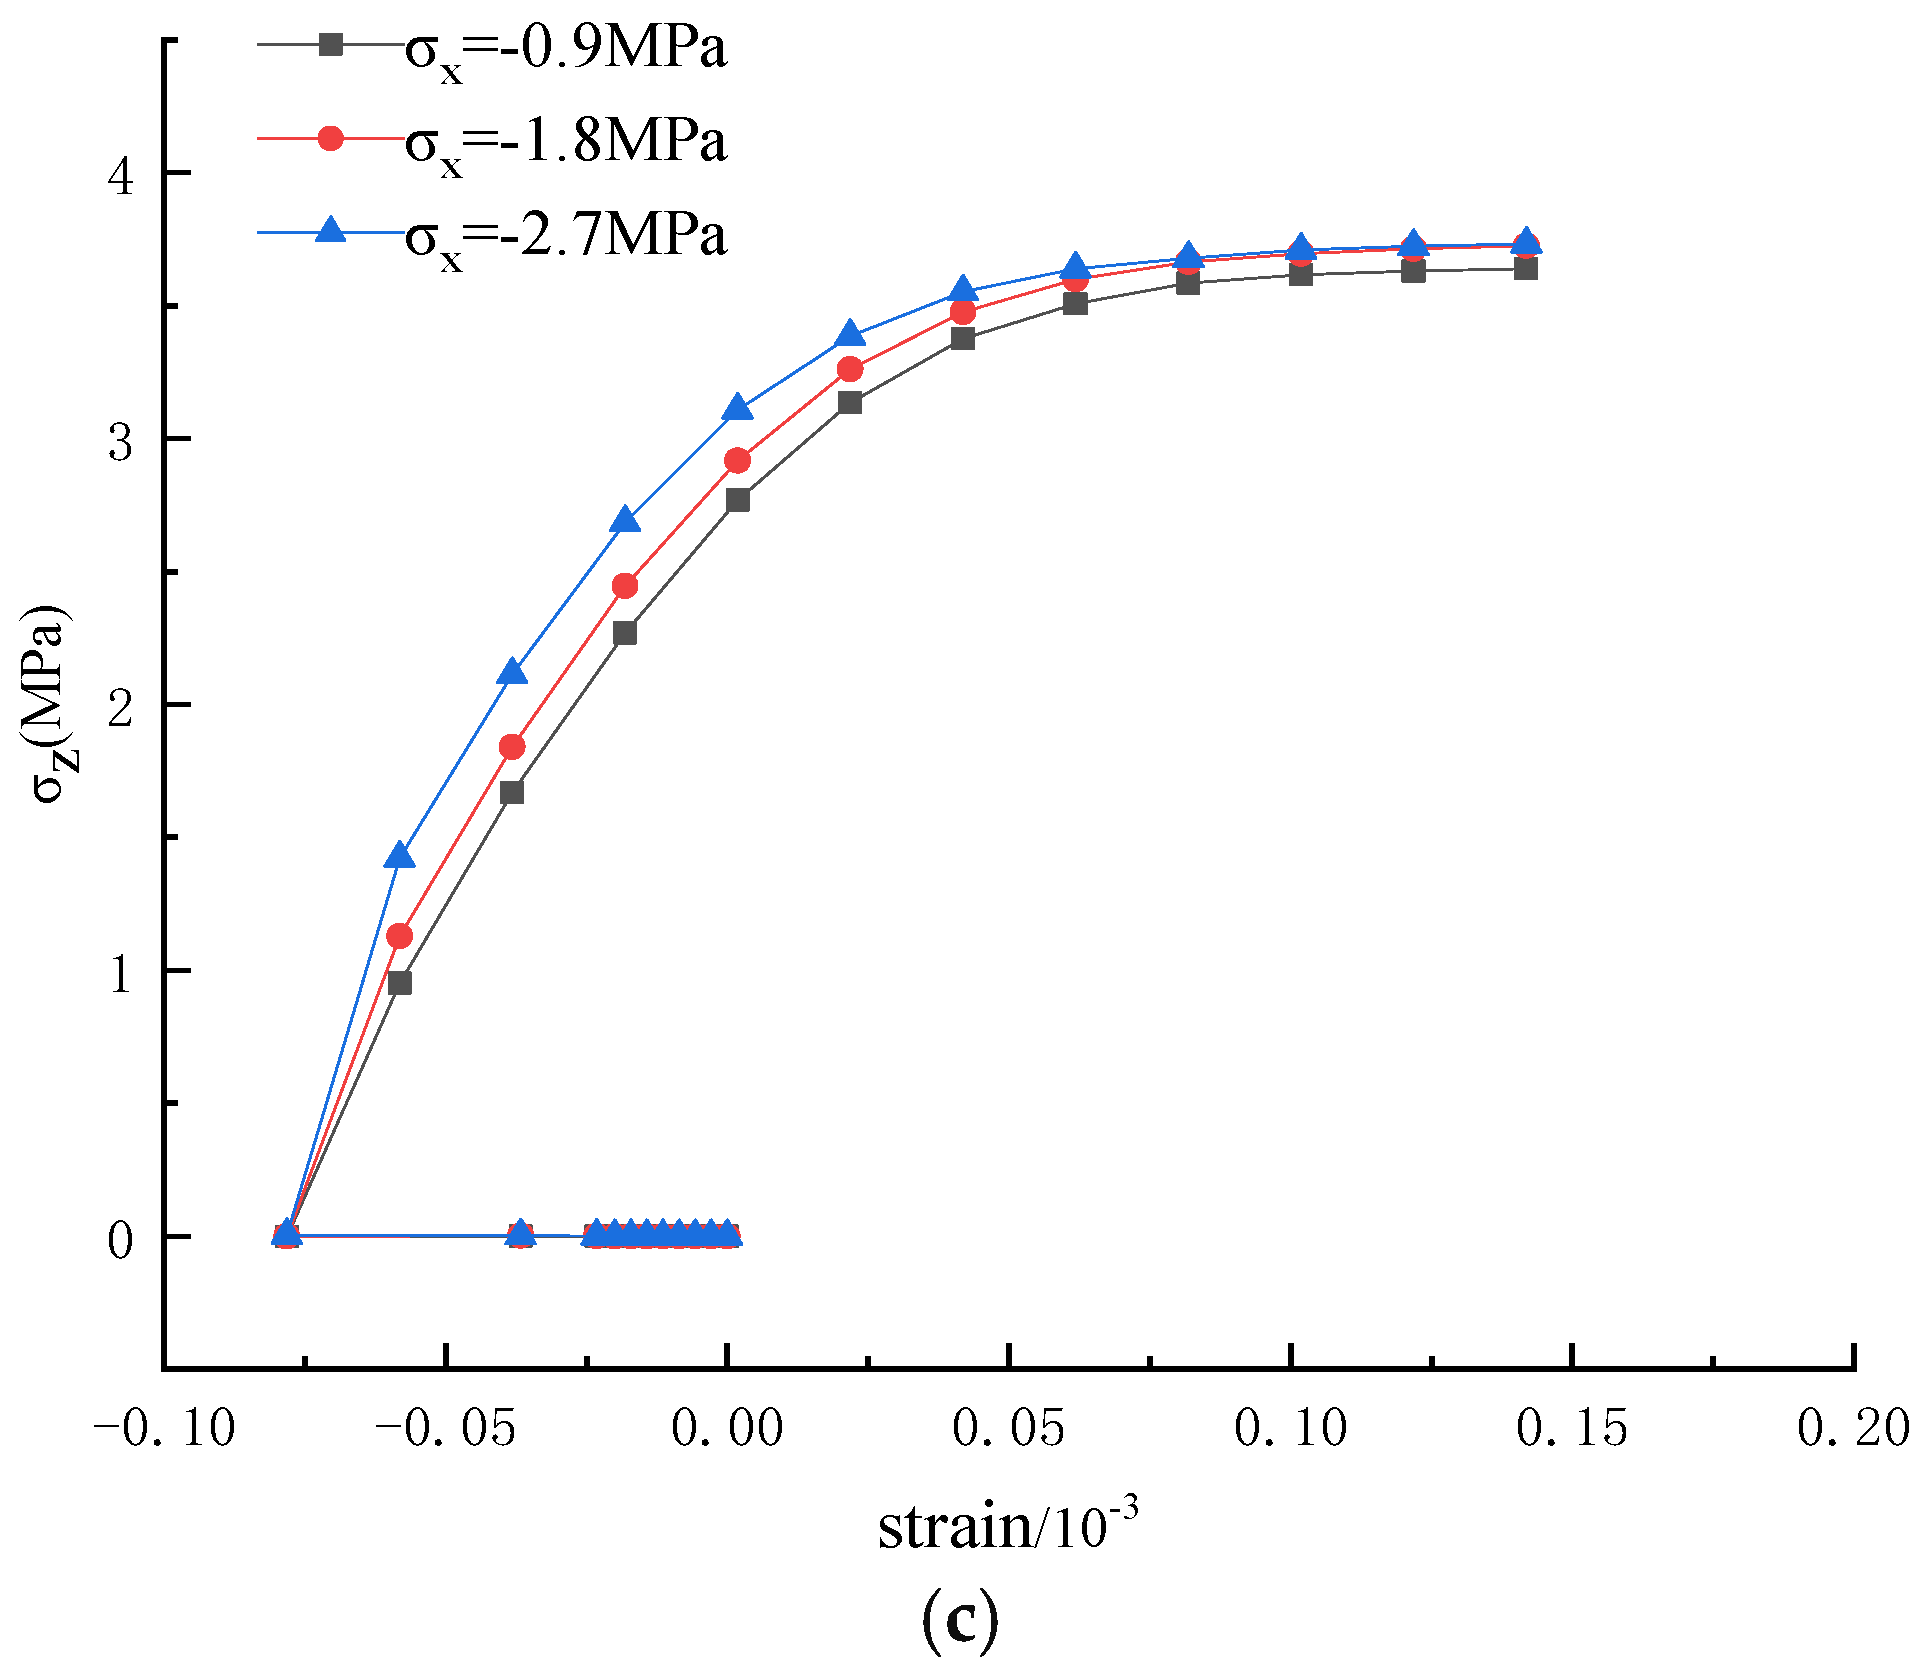
5.2. Strength Changing

Table 4 is a table of the experiment data for the direct tensile strength of the model with different tensile confining pressures, σx and σy. It clearly reflects that when the tensile confining pressure is small, it has little influence on the tensile strength of rock. Only when the tensile confining pressure is close to the uniaxial tensile strength of rock, the tensile strength value decreases significantly.
The strength curve in Figure 10a is drawn using the experimental results. When the rock is in the three-direction tension stress state, the tensile strength of the specimen decreases with the increase in the confining pressure σx, but the change is very small. When σy is in the range of −1 MPa to −3 MPa, the tensile strength of the specimen has no obvious change, but when σy is greater than −3 MPa, the tensile strength value suddenly decreases. The reason for the sudden drop is that the tensile stress in the σy direction is close to the uniaxial tensile strength of the specimen, so the rock has been partially damaged before the tensile load in the z direction is applied, and the tensile strength of the whole rock is reduced.
The experimental data were processed to some extent. The negative strain was taken when the granite model expanded, the positive strain was taken when the shrinkage occurred, and the absolute value of the tensile strength was taken. Figure 10b shows the stress–strain curves of different σy when σx = −2.7 MPa. The straight-line segment parallel to the strain axis represents the deformation of rock caused by the confining pressure in the σy and σx directions before the loading of the tensile load in the z direction. When σy = −4 MPa, the tensile stress–strain curve of the rock reaches the peak faster, and the other curves almost overlap. This shows that when σy = −4 MPa (close to the uniaxial tensile strength value of the rock), without applying a tensile load in the z direction, the stress in the y direction has partially damaged the rock specimen and reduced the overall tensile strength value. Figure 10c shows the stress–strain curves of different σx when σy = −4 MPa. The variation trends of the curves are basically the same. Compared with Figure 10b, there is no obvious elastic stage, and the whole curve is for plastic failure. The reason for this is that the tensile confining pressure in the y direction is close to the uniaxial tensile value, and the failure criterion in the rock mass changes, so the curve does not have the characteristics of the yield stage. In addition, Figure 10c shows that the Poisson effect (the tensile confining pressure applied in the x and y directions before the experiment makes the rock specimen deform without the control of the displacement load in the z direction) before the experiment is more obvious than that shown in Figure 10b.

5.3. Change of the Elastic Modulus and Poisson’s Ratio

The curves of the elastic modulus and Poisson’s ratio with the tensile confining pressure are shown in Figure 11. The elastic modulus changes with the confining pressures σy and σx, and then basically remain constant, but when the tensile confining pressure is close to the uniaxial tensile strength of the granite model, the elastic modulus drops instantaneously, as shown in Figure 11a. This is because when the tensile confining pressure is 4 MPa (close to the uniaxial tensile strength value), the rock has been partially damaged before the tensile load in the z direction is applied, resulting in a sudden decrease in the overall elastic modulus of the rock. Figure 11b shows that the Poisson’ s ratio first decreases with the increase in the confining pressures σy and σx, but when σy = −4 MPa, the Poisson’s ratio suddenly increases, and the change characteristics are the same as the elastic modulus. The characteristic of this mutation may be that the internal mechanical properties of the granite are changed when the tensile confining pressure in the y direction is close to the uniaxial tensile strength of the rock.

6. Conclusions

The tensile strength decreases with the increase in confining pressure σy and σx, the tensile elastic modulus decreases with the increase in confining pressure σy and σx, Poisson’s ratio increases with the increase in confining pressure σx and decreases with the increase in confining pressure σy. Failure surface changes from multiple failure surfaces at low confining pressure to one at high confining pressure. The dip angle of failure surface changes from low confining pressure θ = 20° to high confining pressure θ = 35°, and the dip angle increases with the increase in confining pressure σx.
When the confining pressure in one direction is close to the uniaxial tensile strength of rock, the tensile strength of rock will appear a sudden drop. The tensile elastic modulus first keeps constant and then decreases, Poisson’s ratio first decreases and then increases, while the number of failure surfaces is large, and the dip angle of failure surface θ ≈ 0° is approximately horizontal.
In this paper, the correctness of CASRock software is verified by two-dimensional direct tensile numerical experiment and Brazilian splitting numerical experiment. On this basis, multi-directional tensile numerical experiment of granite model is designed to study the variation of tensile strength, elastic modulus, Poisson’s ratio and failure surface of rock when it is unstable. However, at present, there is no experimental device that can be used for multidirectional tensile, laboratory experiments of multidirectional tensile are not involved in this paper, and the conclusions need to be verified by subsequent scholars. On the basis of this paper, the failure strength criterion and constitutive model of rock under multidirectional tensile stress state are derived.

Author Contributions

Conceptualization, Z.M.; methodology, L.Z. and W.Y.; software, L.Z.; validation, H.X. and H.Z.; writing—original draft preparation, L.Z.; writing—review and editing, Z.M. All authors have read and agreed to the published version of the manuscript.

Funding

The authors of this paper would like to express their gratitude for the National Natural Science Foundation of China (No. 51904080 and No. 52164003) and the Science and Technology Project of Guizhou Province (No. 2021 general 352 and No. [2021]5610) during the research.

Institutional Review Board Statement

Not applicable.

Informed Consent Statement

Not applicable.

Data Availability Statement

Not applicable.

Acknowledgments

All individuals have consented to the acknowledgement.

Conflicts of Interest

The authors declared that they have no conflict of interest.

References

  1. Asem, P.; Wang, X.; Hu, C.; Labuz, J.F. On tensile fracture of a brittle rock. Int. J. Rock Mech. Min. Sci. 2021, 144, 104823. [Google Scholar] [CrossRef]
  2. Pan, Y.; Luo, H.; Tang, Z.; Li, Z.; Zhao, Y. Study on charge induction rule of tensile instability failure of coal and rock mass. Rock Mech. Eng. Rep. 2013, 32, 1297–1303. [Google Scholar]
  3. Liang, H.; Guo, P.; Sun, D.; Ye, J.; Zou, B.; Yuan, Y. Research on stress wave propagation and crack propagation rule of different cohesive blasting modes. Vib. Impact 2020, 39, 157–164. [Google Scholar] [CrossRef]
  4. Guo, F.; Liang, Z.; Gong, B.; Li, G. Tensile failure in slope stability analysis of geotechnical engineering. Rock Mech. Eng. 2017, 36, 3192–3205. [Google Scholar] [CrossRef]
  5. Liao, Z.; Zhu, J.; Tang, C. Numerical investigation of rock tensile strength determined by direct tension, Brazilian and three-point bending tests. Int. J. Rock Mech. Min. Sci. 2019, 115, 21–32. [Google Scholar] [CrossRef]
  6. Carmona, S.; Aguado, A. New model for the indirect determination of the tensile stress–strain curve of concrete by means of the Brazilian test. Mater. Struct. 2012, 45, 1473–1485. [Google Scholar] [CrossRef]
  7. You, M.; Su, C. Theory and experiment of plate splitting. J. Rock Mech. Eng. 2004, 1, 170–174. [Google Scholar]
  8. Su, B.; Wang, Q. Experimental study on dynamic tensile properties of Brazilian disc specimens. Constr. Build. Mater. 2004, 1, 22–25. [Google Scholar]
  9. Kliot, K.; Charney, I. The geography of suicide terrorism in Israel. GeoJournal 2006, 66, 353–373. [Google Scholar] [CrossRef]
  10. Sha, S.; Rong, G.; Peng, J.; Li, B.; Wu, Z. Effect of Open-Fire-Induced Damage on Brazilian Tensile Strength and Microstructure of Granite. Rock Mech. Rock Eng. 2019, 52, 4189–4202. [Google Scholar] [CrossRef]
  11. Li, L.R.; Deng, J.H.; Zheng, L.; Liu, J.F. Dominant Frequency Characteristics of Acoustic Emissions in White Marble During Direct Tensile Tests. Rock Mech. Rock Eng. 2017, 50, 1337–1346. [Google Scholar] [CrossRef]
  12. Wille, K.; Xu, M.; El-Tawil, S.; Naaman, A.E. Dynamic impact factors of strain hardening UHP-FRC under direct tensile loading at low strain rates. Mater. Struct. 2015, 49, 1351–1365. [Google Scholar] [CrossRef]
  13. Hou, Z.; Yuan, R.; Li, C.; Wang, Y.; Wei, X. Analysis of Kaiser effect and spectral characteristics of marble and sandstone under direct tensile load. J. Coal 2019, 44, 41–51. [Google Scholar] [CrossRef]
  14. Peng, S.; Wang, Z.; Xu, J.; Tang, Y.; Chen, C.; Ma, T. Experimental study on uniaxial tensile strain rate effect and energy evolution characteristics of rocks. Min. Res. Dev. 2018, 38, 77–83. [Google Scholar] [CrossRef]
  15. Yuan, R.; Hou, Z. Analysis of direct tensile mechanical properties and acoustic emission activities of rock specimens. J. Henan Univ. Technol. (Nat. Sci. Ed.) 2017, 36, 122–128. [Google Scholar] [CrossRef]
  16. Li, D.; Li, X.; Li, C. Experimental Study on Mechanical Properties of Two Rocks under Direct Tension and Compression. Rock Mech. Eng. J. 2010, 29, 624–632. [Google Scholar]
  17. Li, T.; Liu, J.; Chen, L.; Xu, J.; Wang, L. Acoustic emission characteristics of granite under tensile stress. Rock Mech. Eng. 2013, 32, 3215–3221. [Google Scholar]
  18. You, M.; Zhou, S.; Su, C. Direct tensile experiment of rock specimens under confining pressure. J. Henan Univ. Technol. (Nat. Sci. Ed.) 2006, 4, 255–261. [Google Scholar] [CrossRef]
  19. Liu, S. Research on Dynamic Direct Tensile Mechanical Properties of Granite with Lateral Pressure. Master’s Thesis, The Graduate School of Chinese Academy of Sciences (Wuhan Institute of Geotechnical Mechanics), Wuhan, China, 2007. [Google Scholar]
  20. Yuan, C. Dynamic Direct Tensile Experiment and Dynamic Fracture Mechanics of Rock with Lateral Pressure. Master’s Thesis, Hunan University of Science and Technology, Xiangtan, China, 2013. [Google Scholar]
  21. Wu, B.; Xia, K. Dynamic Tensile Failure of Rocks under Triaxial Stress State; Springer International Publishing: Cham, Switzerland, 2018; pp. 632–635. [Google Scholar]
  22. Xia, K.; Cai, Y.; Xu, Y.; Wang, S.; Pan, Y. Study on dynamic tensile properties of thermally damaged marble under hydrostatic pressure. J. Tianjin Univ. (Nat. Sci. Eng. Technol. Ed.) 2020, 53, 1136–1145. [Google Scholar]
  23. Pan, P.; Feng, X.; Zhou, H. Three-dimensional cellular automata simulation of brittle rock fracture evolution process. Geotech. Mech. 2009, 30, 1471–1476. [Google Scholar] [CrossRef]
  24. Pan, P.; Feng, X.; Qiu, S.; Zhou, H. Influence of multiaxial stress on fracture behavior of deep hard rock. Rock Mech. Eng. J. 2011, 30, 1116–1125. [Google Scholar]
  25. Pan, P.; Ding, W.; Feng, X.; Yao, H.; Zhou, H. Research on the influence of geometry and material properties of prefabricated cracks on rock crack propagation. Rock Mech. Eng. J. 2008, 09, 1882–1889. [Google Scholar]
  26. Zhang, H.; Deng, Q.; Hou, J.; Zhao, G.; Lei, M. Numerical simulation of rock fracture initiation and propagation under uniaxial tension. Gold 2016, 37, 35–39. [Google Scholar]
  27. Tang, S.-B.; Dong, Z.; Wang, J.-X.; Mahmood, A. A numerical study of fracture initiation under different loads during hydraulic fracturing. J. Central South Univ. 2020, 27, 3875–3887. [Google Scholar] [CrossRef]
Figure 1. Schematic chart of the model loading (the arrow indicates the direction of the confining pressure).
Processes 10 00949 g001
Figure 2. Results of the Brazilian splitting experiment. (a) Failure cloud chart; (b) Stress–strain curve.
Processes 10 00949 g002
Figure 3. Results of the uniaxial direct tension experiment. (a) Failure cloud chart; (b) Stress–strain curve.
Processes 10 00949 g003
Figure 4. Granite rock failure under different confining pressures.
Processes 10 00949 g004
Figure 5. The crack propagation morphology of rock was sliced from Y direction.
Processes 10 00949 g005aProcesses 10 00949 g005b
Figure 6. Two-way tension experiment results. (a) Strength curve with biaxial tension; (b) Stress–strain curves of different σy at σx = 5 MPa; (c) Stress–strain curves of different σx at σy = −2 MPa.
Processes 10 00949 g006
Figure 7. Variation curves of elastic modulus and Poisson’s ratio with confining pressure. (a) Curve of elastic modulus versus confining pres-sure; (b) Curve of Poisson’s ratio versus confining pressure.
Processes 10 00949 g007
Figure 8. σx = −0.9 MPa, σy = −1 MPa, failure cloud chart of the model. (a) Step 44 damage cloud chart; (b) Step 82 damage cloud chart.
Processes 10 00949 g008
Figure 9. σx = −2.7 MPa step 38 failure cloud chart. (a) σy = −1 MPa; (b) σy = −4 MPa.
Processes 10 00949 g009
Figure 10. Three-direction tension experiment results. (a) Tensile strength of specimens in the triaxial tensile stress state; (b) Stress–strain curves of different values of σy at σx = −2.7 MPa; (c) Stress–strain curves of different σx at σy = −4 MPa.
Processes 10 00949 g010aProcesses 10 00949 g010b
Figure 11. Effect of the confining pressure σx on the elastic modulus and Poisson’s ratio. (a) Elastic modulus; (b) Poisson’s ratio.
Processes 10 00949 g011
Table 1. Basic mechanical property parameters of the granite model.
Strength parametersCohesive force/MPa15
Internal friction angle/°49
Shear dilatancy/°49
Tensile strength /MPa5.0
Deformation and physical parametersElastic modulus/GPa47.8
Poisson ratio0.25
Density/kg/m32260
Heterogeneous coefficient4
Table 2. Experimental scheme and parameter settings.
The Load-Directionσx/MPaσy/MPa
σy stretch, σx compression5, 10, 150
−1
−2
−3
σy, σx stretch−0.9, −1.8, −2.7−1
−2
−3
−4
Table 3. Direct tensile strength of granite model for different confining pressures σx and σy..
Order Numberσx/MPaσy/MPaσz/MPa
150−4.12
2−1−4.11
3−2−4.10
4−3−4.05
5100−3.93
6−1−3.92
7−2−3.89
8−3−3.82
9150−3.74
10−1−3.71
11−2−3.69
12−3−3.60
Table 4. Statistical table of the experiment data for direct tensile strength with different confining pressures.
Order Numberσx/MPaσy/MPaσz/MPa
1−0.9−1−4.17
2−2−4.20
3−3−4.16
4−4−3.68
5−1.8−1−4.14
6−2−4.18
7−3−4.16
8−4−3.76
9−2.7−1−4.12
10−2−4.12
11−3−4.14
12−4−3.75
Publisher’s Note: MDPI stays neutral with regard to jurisdictional claims in published maps and institutional affiliations.

