Abstract
A computational study was conducted on the addition of nitrogen (0–60 vol%) to stoichiometric hydrogen–nitrous oxide flames at various initial pressures (1–10 bar) and temperatures (300–500 K), with a special emphasis on NO, which is a major pollutant that is generated by these flames. The detailed kinetic modeling of H2–N2O–N2 flames, which was performed using the GRI 3.0 mechanism, produced the structure of the H2–N2O–N2 flames for the temperature and mass fraction profiles of 53 species, which participated in 325 elementary reactions. The NO profiles that were computed by the detailed kinetic modeling followed the trend of experimental NO profiles that have been reported in the literature for laminar premixed flames at sub-atmospheric pressures. For the examined H2–N2O–N2 flames, an increase in initial pressure resulted in a significant reduction in the NO mass fraction of the burned gas. The increase in initial temperature was also accompanied by an increase in the mass fractions of the generated NO, as well as the flame temperature.
1. Introduction
Nowadays, hydrogen has become an important alternative energy source as energy consumption has steadily increased worldwide. Hydrogen combustion in air only generates water vapor and has zero carbon emissions, which makes hydrogen an environmentally friendly fuel. The use of hydrogen instead of conventional fossil carbon-based fuels is an efficient way to reduce emissions that are harmful to the environment, such as nitrogen oxides, sulfur oxides and organic acids.
Nitrous oxide is frequently used as an oxidizer in rocket engines and gas turbines due to its exothermal decomposition, which results in the development of elevated flame temperatures that are higher than those that are produced by fuel–air combustion [1]. At the same time, N2O is also used to promote oxidation in the air flames of various fuels [2,3]. The high thermal exothermicity of N2O flames improves the energy conversion and combustion efficiency of hydrogen and hydrocarbons.
Hydrogen combustion with nitrous oxide has been extensively studied because it is the simplest case of a flame that is controlled by nitrogen chemistry. Hydrogen–nitrous oxide flames that are generated by combustion produce significant amounts of nitrogen oxides, which are regulated pollutants. The emission of nitrogen oxides (NO, NO2, N2O, etc., which are usually named NOx) into the atmosphere plays a key role in tropospheric chemistry and influences air quality by generating ozone, acid rain and aerosols [4]. The efficient way to control these emissions is through the understanding of their generation, which is important for improving air quality.
Interest in the combustion chemistry of nitrogen-containing fuels and oxidants has been growing, mainly concerning the formation of NO in flames and the operation of various NO control methods [5]. The chemistry of NOx generation has been described by various mechanisms [6,7,8,9,10], which have allowed for the development of strategies to limit NOx emission during combustion. A frequently used method that is recommended for use in IC (internal combustion) engines to diminish NOx emissions is EGR (“exhaust gas recirculation”) [11,12], which consists of recirculating the exhaust gases within the combustion chamber. This decreases the combustion temperature and, subsequently, decreases the amount of NOx, according to the Zeldovich thermal mechanism [6]. However, this method also reintroduces NOx into the fresh charge, which changes the combustion properties of the unburnt mixture.
Experimental studies on hydrogen–nitrous oxide combustion have been conducted using both burner-stabilized, premixed diffusion flames [13,14,15,16,17,18,19,20,21,22,23] and laminar flames, which are propagated in closed vessels that utilize side or central ignition [24,25,26,27,28]. As well as the burning velocities, the measurements of the freely propagating flames deliver profiles of the temperature and species concentrations of non-diluted H2–N2O and H2–N2O that is diluted with various inert gases (N2, Ar, He, etc.). The results of these studies paved the way for the development and validation of mechanisms that are adequate for hydrogen or hydrocarbon combustion with N2O or for hydrocarbon combustion with air, which is sensitized by nitrogen oxides [14,15,17,18,19,20,26,27,28]. Most of the measurements in these studies were taken at sub-atmospheric pressures because at pressures and/or temperatures that are near to or above ambient levels, H2–N2O mixtures can easily develop a deflagration to detonation transition (DDT), especially when they contain N2O in excess [28]. Numerous studies have focused on the detonation of diluted H2–N2O mixtures and have reported self-ignition limits, ignition delay times and detonation cell sizes using experiments that incorporated the static method or the shock tube method [8,25,29,30,31,32,33,34,35,36,37,38,39]. These contributions have also delivered important data for the kinetic modeling of H2–N2O reactions at elevated temperatures and pressures.
The measurement of H2–N2O and inert-diluted H2–N2O premixed flames has revealed the influences of various operational parameters on the flame temperature and burned gas composition, including: the initial ratio of H2–N2O; the presence of additives (inert or reactive); the initial pressure and temperature; and the burning conditions (isobaric or isochoric) [13,14,15,16,17,18,19,20]. Many experiments on H2–N2O combustion have been conducted using premixed flames at 20–70 mm Hg of total pressure [14,18,19,20,24,25] and have allowed for the characterization of flame structure using the profiles of temperature and active species concentrations. Balakhnine et al. [14] studied a low pressure (0.05 atm), lean H2–N2O flame that was stabilized on a Spalding–Botha-type burner. Using a molecular beam sampling method coupled with mass spectrometer detection, they determined the concentrations of N2, N2O, H2, NO and O2 in the flame front, as well as those of H, O and OH radicals. In experiments that are performed at low initial pressures, the flames have a wider front width compared to flames at a normal pressure, so they afford a convenient space resolution for probing and product analysis [14,18]. Gray et al. [24,25] examined H2–N2O flame propagation in elongated vessels at 70 torr and 60 °C with (and without) oxygen or air traces and they reported the adiabatic flame temperatures and computed the equilibrium compositions of the burned gas.
Many other studies on laminar premixed flames have been conducted at ambient initial pressures. Duval and Van Tiggelen [13] reported a comprehensive dataset for the flame speed of H2–N2O mixtures that were diluted with N2, CO2, Ar and He, using flames that were anchored on a Bunsen burner. The effects of the initial temperature, equivalence ratio and the amount of diluent were investigated. Using laser fluorescence and absorption spectroscopy, Cattolica et al. [15] reported the space profiles of OH, NH and NO concentrations and the temperature profile of a stoichiometric H2–N2O flame that was stabilized on a porous-plug flat-flame burner. The temperature and concentration profiles of several important chemical species were reported by Vanderhoff et al. [16] for several lean hydrogen–nitrous oxide premixed flames (equivalence ratios ϕ: 0.45, 0.70 and 0.89, where and the index “st” refers to the stoichiometric concentration of the H2–N2O mixture, for which both the hydrogen and nitrous oxide reacted completely to form H2O and N2) using Raman spectroscopy and flat flames, which were anchored on a porous-plate burner. The data that were measured by Cattolica et al. [15] and Vanderhoff et al. [16] were further used by Coffee [40] to test the validity of several mechanisms that describe the H2–N2O reaction. Premixed flat flames of neat H2–N2O and H2–N2O that was doped with NH3 were examined by Powell et al. [21,22,23] at near-atmospheric pressure (0.8 atm) to measure laminar burning velocities, which were further used together with data on flame structure (temperature and concentration profiles) to model the high temperature combustion of H2 with N2O. Sensitivity and reaction path analyses were employed to elucidate the important pathways of H2 and N2O to their products.
Various kinetic mechanisms that are used to describe N2O consumption in the flames of hydrogen or hydrocarbons [41,42,43,44,45] were critically examined by Zhang et al. [46], who found that each of the mechanisms performed well for certain systems but exhibited noticeable deviations compared to others. Zhang et al. suggested that these deviations could be attributed to differences in the H2–NOx and H2–CO sub-mechanisms and to the different thermochemical input data that were used for these species.
In spite of the practical interest in the polluting effects of NO, few studies have focused on its generation in H2–N2O–N2 flames at pressures that are equal to or higher than ambient levels. Earlier data have described the structure of flames that were stabilized at 0.05–0.80 bar and the corresponding modeling studies predicted NO concentrations under these conditions. Among them, only the study of Venizelos et al. [19] reported NO being obtained using MB/MS (molecular beam mass spectroscopy) and LIF (laser-induced fluorescence) measurements in flames that were stabilized at 30 mm Hg. Other studies have delivered the profiles of radical species, e.g., H, O and OH, which are used to determine laminar burning velocity.
The present paper intends to fill this gap by presenting the results of a computational study of NO generation in premixed H2–N2O–N2 flames, using a kinetic model with a detailed reaction mechanism [43] for mixtures with variable initial pressures, temperatures and diluent concentrations. The GRI 3.0 mechanism has been proven to deliver reliable burning velocities for premixed H2–N2O–N2 [47] and CH4–N2O–N2 flames [48,49,50] with extended ranges of initial pressures and temperatures and it can be used to obtain the end concentrations of nitric oxide within the burned gas of H2–N2O–N2 flames. From these runs, the mass fractions of NO were extracted and analyzed as functions of operational parameters (the composition, pressure and temperature of unburned gas). The stoichiometric H2–N2O mixtures were examined both neat and diluted with various amounts of nitrogen. The following parameters were chosen: nitrogen concentrations of 20, 30, 40 and 60 vol% (the volume percentages refer to the total gas amounts); initial temperatures between 300 and 500 K; and initial pressures between 1 and 10 bar. For the examined flammable mixtures, at elevated initial pressures of between 1 and 10 bar, the reported end NO concentrations represented an original contribution, thereby completing the actual pool of available data for ambient and sub-atmospheric pressures.
2. Computational Methodology
The kinetic modeling of N2-diluted stoichiometric H2–N2O flames was performed using the COSILAB-1D package [51] and the GRI 3.0 mechanism, including 53 chemical species and 325 elementary reactions [43]. The GRI 3.0 mechanism, which has been validated in many modeling studies, includes the reactions of NOx: a fact which prompted us to use it.
The software that we used included a steady Newton solver (usually: 25 iterations; relative tolerance 10−5; absolute tolerance 10−8), an unsteady Newton solver (usually: 15 iterations; relative tolerance 10−4; absolute tolerance 10−6) and an unsteady Euler solver. Adaptive grid parameters (GRAD = 0.1; CURV = 0.2) and maximum ratios of adjacent cell size of between 1.1 and 1.3 were also used. The runs were performed for the isobaric combustion of hydrogen–nitrous oxide–nitrogen mixtures at various pressures between 1 and 10 bar, at various initial temperatures between 300 K and 500 K and with various amounts of nitrogen between 0 and 60 vol%. The input data were taken from the thermodynamic and molecular databases of the Sandia National Laboratories, USA, according to the international standard (format for CHEMKIN). The modeling delivered the laminar burning velocities of the gaseous mixtures, along with profiles of the temperature, rate of heat release and species across the flame front.
More details have been presented in earlier publications [48,49,50].
3. Results and Discussion
A set of representative results that were obtained using the kinetic modeling of a H2–N2O–N2 flame are shown in Figure 1a,b, wherein the profiles of temperature and several species concentrations across the flame front are also plotted. In the presented case, a flame that was propagating in an H2–N2O stoichiometric mixture that was diluted with 40% N2 was examined under ambient initial conditions. Here, d represents the distance from the ignition point to the bulk of the burned gas (the limit of the integration boundary), at which all concentrations reach a steady value [52]. As proven by experiments and computations on any fuel–oxidizer mixture [53], the reagents in the burned gas zone were consumed and their mass fractions decreased, whereas the temperature and the mass fractions of the reaction products increased. These profiles are shown in Figure 1a,b for a H2–N2O flame that included N2 as diluent. The plots only present the variations in mass fractions for the reagents and some of reaction products (H2O, N2, NO and radical species, such as OH, O and H). The concentration profiles of the participating species were typical for these flames: H2 and N2O reacted in the low temperature zone of the flame and were completely consumed when the flame temperature reached its maximum. Following the temperature variation, the amount of generated NO increased steadily, along with mass fractions of H, OH and O, and reached constant values in the post-flame (burned) gas. It was interesting to observe the appearance of H atoms early in the process, which were already in the preheating zone. The other radical species appeared and increased much later, reaching their end values synchronously with the temperature. From the temperature profile, the width δ of the flame front could be determined, according to Jarosinski [52], as:
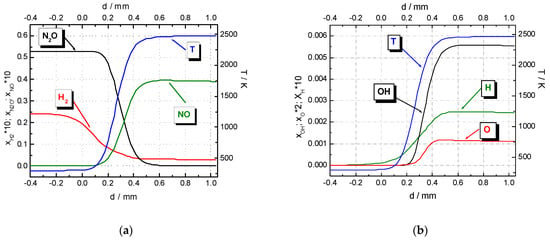
Figure 1.
Temperature and mass fraction profiles of representative species in the flame front of a N2–diluted stoichiometric H2–N2O flame under ambient initial conditions (N2 = 40 vol%): (a) H2, N2O and NO; (b) H, OH and O.
Along with the laminar burning velocity, the flame width is also relevant for the reactivity of flammable mixtures [53].
The variations in initial conditions (temperature, pressure, presence of added inert gas) determined important changes in the end values and rates of variation for these properties. The most important variations in the end temperature and mass fractions of NO were observed when different amounts of nitrogen were added to the H2–N2O mixture. The corresponding plots of their profiles are shown in Figure 2 and Figure 3.
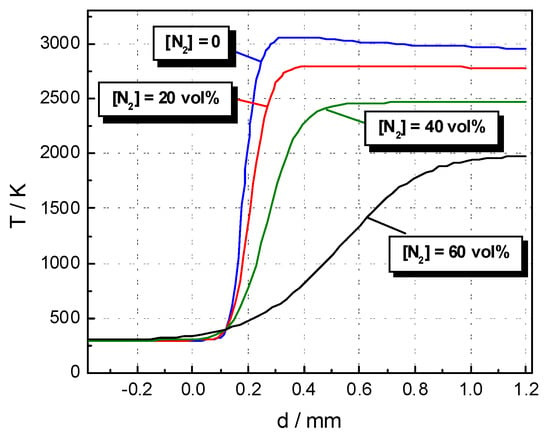
Figure 2.
Temperature profiles of the flame front of N2-diluted stoichiometric H2–N2O flames with various nitrogen concentrations under ambient initial conditions.
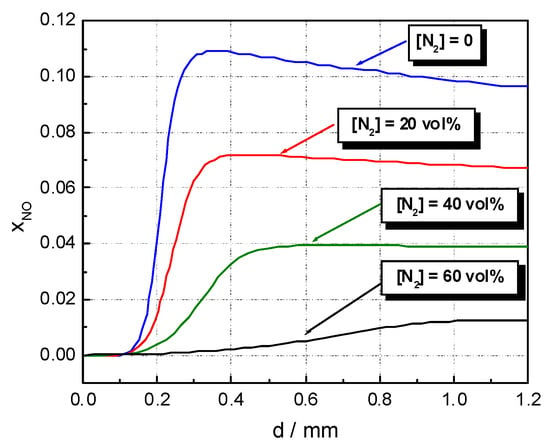
Figure 3.
NO mass fraction profiles of the flame front of N2-diluted stoichiometric H2–N2O flames with various nitrogen concentrations under ambient initial conditions.
The computed NO profiles of the front of the neat stoichiometric H2–N2O flames under ambient initial conditions were similar to the measured NO profiles that were reported by Venizelos et al. for the same flames, which was stabilized at 30 mmHg [19]: close xNO,end but different flame front widths, as determined by the different pressure conditions.
Literature reports have presented the computed NO and temperature profiles of the front of neat H2–N2O and H2–N2O-inert flames and compared them to measured profiles for the validation of the reaction mechanisms. A good agreement between the measured and computed NO profiles of flames that were stabilized at sub-atmospheric pressures was reported by Balakhnine et al. [14] using molecular beam sampling and mass spectrometric analyses on lean H2–N2O flames that were burning at 40 torr and also by Venizelos et al. [19] and Sausa et al. [18,20], using mass spectrometry and the laser-induced fluorescence measurements of H2–N2O–Ar flames that were stabilized at 30 torr. In these experiments, a wide flame front was available for the measurements (δ = 7–10 mm at 20–30 torr [18,20] compared to δ = 0.5–0.6 mm for the flames at 750 torr) and produced a good spatial resolution for the sampling.
Measured temperature and NO concentration profiles at atmospheric pressure were reported by Vanderhoff et al. [16] for only a few lean premixed laminar H2–N2O flames using Raman spectroscopy. No measurements of the NO concentration of the flame fronts of high-pressure premixed flames have been published so far. Other recent studies on the premixed flames of neat H2–N2O and H2–N2O inert mixtures have been concerned with the measurements of radical species and temperature profiles in order to validate the updated mechanisms of H2 combustion with N2O [20,21,22,23,26,27,28,29,38,39,42,44,54,55].
The changes in temperature profiles that were determined by the variations in initial temperature and pressure are shown in Figure 4a,b, respectively, for a H2–N2O flame with 40 vol% of N2. Similar plots were obtained for different degrees of N2 dilution. At each constant initial composition, the increase in the initial temperature resulted in an increase in the flame temperature; however, the flame front width seemed to be constant under the examined temperature range. The initial pressure increase determined the increase in flame temperature as well; nonetheless, the temperature rise was very steep as the pressure increased from 1 to 10 bar and the flame front width decreased.
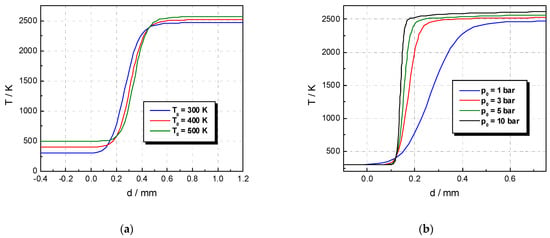
Figure 4.
Temperature profiles of the flame front of a N2–diluted stoichiometric H2–N2O flame (N2 = 40 vol%): (a) mixtures at 1 bar and various initial temperatures; (b) mixtures at 300 K and various initial pressures.
The changes in the NO profiles that were determined by the variations in initial temperature and pressure are shown in Figure 5a,b, respectively, for mixtures with a constant initial composition. The increase in initial temperature resulted in the increase in the nitric oxide mass fraction (Figure 5a); however, the flame front width seemed to be constant under the examined temperature range. The increase in the initial pressure determined the stepwise change in the NO profiles. The peak mass fraction of NO remained almost constant, whereas the peak concentration decreased toward the end concentration and reached its limit at the integration boundary. As the pressure increased from 1 to 10 bar, the rate of NO variation increased from 0 to the peak value as the flame front width decreased.
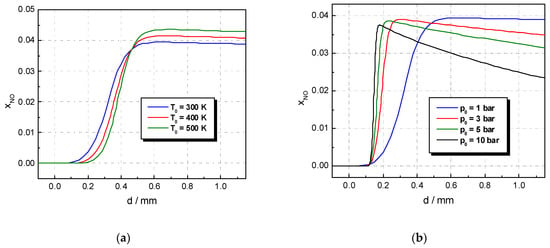
Figure 5.
NO profiles of the flame front of a N2–diluted stoichiometric H2–N2O flame (N2 = 40 vol%): (a) mixtures at 1 bar and various initial temperatures; (b) mixtures at 300 K and various initial pressures.
It was also worth examining the end temperature and mass fraction of NO of the burned gas as functions of the initial conditions of the fresh, unburned gas. The addition of nitrogen into the H2–N2O mixture resulted in a decrease in the mass fraction of NO (Figure 6a,b) and the flame temperature in the burned gas (Figure 7a,b), as shown by data that were obtained at several different initial temperatures and pressures. The inerting effect was due both to dilution (the decrease in the amount of fuel determines the decrease in the heat that is released by the combustion) and the change in the heat capacity of the mixture, since the inert component acted as a heat sink.
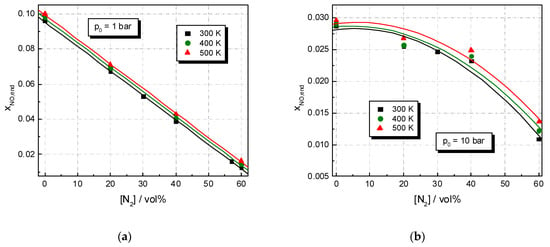
Figure 6.
The influence of the added nitrogen on the end mass fraction of NO of stoichiometric H2–N2O–N2 mixtures that were burning under various initial conditions: (a) mixtures at 1 bar and various initial temperatures; (b) mixtures at 10 bar and various initial temperatures.
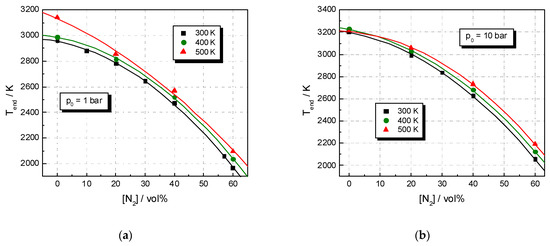
Figure 7.
The influence of the added nitrogen on the end flame temperatures of stoichiometric H2–N2O–N2 mixtures that were burning under various initial conditions: (a) mixtures at 1 bar and various initial temperatures; (b) mixtures at 10 bar and various initial temperatures.
According to Mével et al. [27], the conversion of N2O into products within stoichiometric H2–N2O flames occurs mostly by the following reactions:
and
N2O + H = N2 + OH
N2O + H = NO + NH
OH + H2 = H2O + H
The sensitivity and reaction pathway analyses of the detailed kinetic modeling of the H2–N2O flames proved that Reaction (2) (highly exothermic) dominates the chemistry of the H2–N2O mixtures [20,21,22,23,27]. Reaction (2) transforms almost all N2O into N2, with the contribution of Reaction (3) being much smaller. The O element is converted from N2O into H2O through the sequence of Reactions (2) and (4). The decomposition of nitrous oxide only has a small contribution to the conversion of the oxygen from N2O into H2O through the sequence of Reactions (4)–(6):
N2O (+M) = N2 + O (+M)
O + H2 = OH + H
In their paper, Mével et al. [27] mentioned that a large proportion of the initial hydrogen molecules react with OH radicals to form H2O through Reaction (4).
As well as Reaction (3), another reaction also generates NO:
and competes with Reaction (2) for H consumption. Then, the consumption of the NH radical occurs by the following reactions:
and
N2O + H = NH + NO
NH + OH = HNO + H
NH + NO = N2 + OH
Reaction (4), which is also exothermic, regenerates H atoms and thus, contributes to the temperature increase.
These mechanistic aspects show that the thermal Zeldovich mechanism is effective in NO formation [6,27,53], so a decrease in flame temperature is followed by a decrease in the amount of generated NO. Similar data were found by Gray et al. [25], who reported adiabatic flame temperatures and calculated equilibrium gas compositions from H2–N2O and H2–N2O inert (Ar, N2) combustion.
The influence of initial pressure on Tend and xNO,end is shown in Figure 8a,b, wherein data regarding the H2–N2O–N2 mixtures that were burned at T0 = 300 K are presented. Similar plots were obtained for mixtures that were burned at 400 and 500 K. At each constant initial temperature, the pressure variation resulted in the opposite variation in the end temperature and NO mass fraction, as shown in Figure 8a. The trend of each variation could be explained by the specific influence of pressure. Thus, the increase in pressure was equivalent to the increase in the amount of flammable mixture in the volume unit, which resulted in the increase in the amount of generated heat and the end temperature. At the same time, the increase in pressure influenced the chemical equilibrium in the gas phase, thereby determining the important reduction in the concentration of NO in the burned gas.
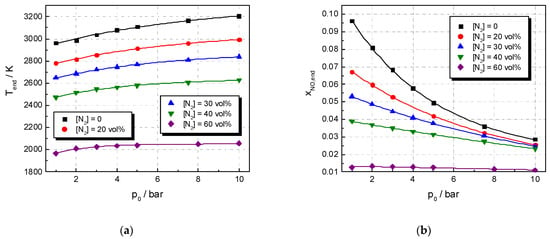
Figure 8.
Influence of initial pressure on: (a) the end flame temperature (the increase in pressure caused an increase in the amount of flammable mixture in the volume unit, resulting in a temperature increase) and (b) end mass fraction of NO of stoichiometric H2–N2O mixtures that were diluted with various amounts of N2 at an ambient initial temperature (the pressure increase resulted in a decrease in NO due to the flame temperature increase).
For the same N2-diluted H2–N2O mixtures, the plots of the end mass fraction of NO and flame temperature against the initial temperature are shown in Figure 9a,b. At each constant initial pressure, both the end flame temperature and mass fraction of NO decreased as the initial temperature decreased, as shown in Figure 9.
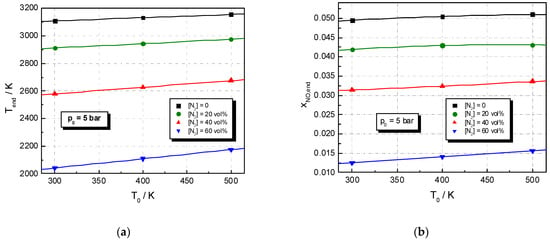
Figure 9.
Influence of initial temperature on: (a) the end temperature and (b) end mass fraction of NO of stoichiometric H2–N2O mixtures that were diluted with various amounts of N2 at a constant initial pressure of p0 = 5 bar.
A review of xNO,end variation according to different initial pressures and temperatures of a N2-diluted H2–N2O mixture is shown in Figure 10a,b, using data that were obtained for a mixture that contained 40 vol% of N2. At a constant initial temperature, the end mass fraction of NO decreased with the initial pressure. At a constant initial pressure, the end mass fraction of NO increased with the initial temperature.
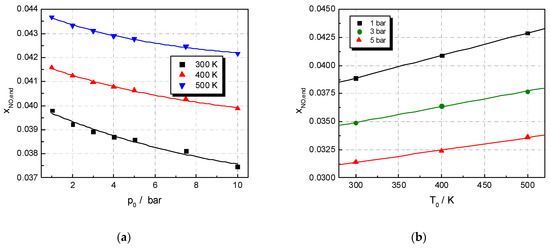
Figure 10.
Influence of initial pressure and temperature on NO mass fraction of a stoichiometric H2–N2O–40%N2 flame: (a) mixtures at a constant initial temperature (T0 = 300, 400 and 500 K); (b) mixtures at a constant initial pressure (p0 = 1, 3 and 5 bar).
4. Conclusions
This examination of hydrogen–nitrous oxide flames provided useful information for the understanding of propellant combustion and the generation of NOx in various combustors and engines. The knowledge of H2–N2O interaction mechanisms allows the improvement of combustion devices and reductions in NOx emissions from hydrogen-fueled engines.
The goal of the present study was to perform a numerical investigation of the nitric oxide formation in N2-diluted H2–N2O flames using a validated and detailed kinetic scheme from the literature. To this end, a set of temperature and NO profiles of stoichiometric H2–N2O–N2 mixtures was presented for initial temperatures of between 298 K and 500 K, initial pressures of between 1 and 10 bar and amounts of N2 of between 0 and 60 vol%. The results that were obtained by mapping this wide range of initial conditions represent a scientific novelty since they cover a much more extended field of conditions than actual experimental studies.
The study showed that a decrease in combustion temperature is efficient for lowering NO concentrations. This decrease in flame temperatures can be realized by adding a diluting inert gas into the neat H2–N2O mixture or by maintaining a lower initial temperature for the unburned mixture. These methods could count, in fact, among the various methods for the control of NO in exhaust gases. At a constant initial temperature, the increase in initial pressure also resulted in a reduction in the concentration of NO in the burned gas.
The observed trends and correlations were obtained from the computed flame structure and were valid for the examined ranges of initial composition, pressure and temperature. Future studies should request further measurements of NO concentrations in the flames of the same H2–N2O–N2 mixtures in order to validate the predicted data from the present paper.
Author Contributions
Conceptualization, D.R. and M.M.; software, D.R., V.G., C.M. and M.M.; data curation, V.G. and C.M.; writing—original draft preparation, D.R. and M.M.; visualization, D.R. and M.M.; formal analysis, V.G. and C.M. All authors have read and agreed to the published version of the manuscript.
Funding
This research received no external funding.
Data Availability Statement
This statement is not applicable for our study.
Acknowledgments
The present study was partially financed by the Romanian Academy under the research project “Dynamics of fast oxidation and decomposition reactions in homogeneous systems” at the Ilie Murgulescu Institute of Physical Chemistry.
Conflicts of Interest
The authors declare no conflict of interest.
References
- Kramlich, J.C.; Linak, W.P. Nitrous oxide behavior in the atmosphere, and in combustion and industrial systems. Prog. Energy Combust. Sci. 1994, 20, 149–202. [Google Scholar] [CrossRef]
- Mathieu, O.; Pemelton, J.M.; Bourque, G.; Petersen, E.L. Shock-induced ignition of methane sensitized by NO2 and N2O. Combust. Flame 2015, 162, 3053–3070. [Google Scholar] [CrossRef] [Green Version]
- Mével, R.; Shepherd, J.E. Ignition delay-time behind reflected shock waves of small hydrocarbons–nitrous oxide (–oxygen) mixtures. Shock Waves 2015, 25, 217–229. [Google Scholar] [CrossRef]
- Air Quality in Europe—2020; Technical Report No. 9/2020; European Environment Agency: Copenhagen, Denmark, 2020.
- Brown, M.J.; Smith, D.B. Aspects of nitrogen flame chemistry revealed by burning velocity modelling. In Proceedings of the Symposium International on Combustion, Irvine, CA, USA, 31 July–5 August 1994; Elsevier: Amsterdam, The Netherlands, 1994; Volume 25, pp. 1011–1018. [Google Scholar]
- Zeldovich, Y.B. The oxidation of nitrogen in combustion and explosions. Acta Physicochim. 1946, 21, 577–628. [Google Scholar]
- Dagaut, P.; Glarborg, P.; Alzueta, M.U. The oxidation of hydrogen cyanide and related chemistry. Prog. Energy Combust. Sci. 2008, 34, 1–46. [Google Scholar] [CrossRef]
- Mével, R.; Javoy, S.; Lafosse, F.; Chaumeix, N.; Dupré, G.; Paillard, C.E. Hydrogen–nitrous oxide delay times: Shock tube experimental study and kinetic modeling. Proc. Combust. Inst. 2009, 32, 359–366. [Google Scholar] [CrossRef]
- Glarborg, P.; Miller, J.A.; Ruscic, B.; Klippenstein, S.J. Modeling nitrogen chemistry in combustion. Prog. Energy Combust. Sci. 2018, 67, 31–68. [Google Scholar] [CrossRef] [Green Version]
- Ahmed, S.F.; Santner, J.; Dryer, F.L.; Padak, B.; Farouk, T.I. Computational study of NOx formation at conditions relevant to gas turbine operation, part 2: NOx in high hydrogen content fuel combustion at elevated pressure. Energy Fuels 2016, 30, 7691–7703. [Google Scholar] [CrossRef]
- Heffel, J.W. NOx emission and performance data for a hydrogen fueled internal combustion engine at 1500 rpm using exhaust gas recirculation. Intern. J. Hydrogen Energy 2003, 28, 901–908. [Google Scholar] [CrossRef]
- Dagaut, P.; Nicolle, A. Experimental study and detailed kinetic modeling of the effect of exhaust gas on fuel combustion: Mutual sensitization of the oxidation of nitric oxide and methane over extended temperature and pressure ranges. Combust. Flame 2005, 140, 161–171. [Google Scholar] [CrossRef]
- Duval, A.; Van Tiggelen, P. Kinetical study of hydrogen–nitrous oxide flames. Bull. Acad. Royale Belge 1967, 53, 366–402. [Google Scholar]
- Balakhnine, V.P.; Vandooren, J.; Van Tiggelen, P.J. Reaction mechanism and rate constants in lean hydrogen-nitrous oxide flames. Combust. Flame 1977, 28, 165–173. [Google Scholar] [CrossRef]
- Cattolica, R.J.; Smooke, M.D.; Dean, A.M. A Hydrogen-Nitrous Oxide Flame Study; Sandia National Laboratories Techical Report SAND 82–8776; Elsevier: Amsterdam, The Netherlands, 1982. [Google Scholar]
- Vanderhoff, J.A.; Bunte, S.W.; Kotlar, A.J.; Beyer, R.A. Temperature and concentration profiles in hydrogen-nitrous oxide flames. Combust. Flame 1986, 65, 45–51. [Google Scholar] [CrossRef]
- Drake, M.C.; Ratcliffe, J.W.; Blint, R.J.; Campbell, M.; Carter, D.; Laurendeau, N.M. Measurements and modeling of flame front no formation and superequilibrium radical concentrations in laminar high-pressure premixed flames. In Proceedings of the 23rd Symposium on Combustion, Orleance, France, 22–27 July 1990; pp. 387–395. [Google Scholar]
- Sausa, R.C.; Anderson, W.R.; Dayton, D.C.; Faust, C.M.; Howard, S.L. Detailed structure study of a low pressure, stoichiometric H2/N2O/Ar flame. Combust. Flame 1993, 94, 407–425. [Google Scholar] [CrossRef]
- Venizelos, D.T.; Sausa, R.C. Laser-induced fluorescence, mass spectrometric, and modeling studies of neat and NH3-doped H2-N2O-Ar flames. Combust. Flame 1998, 115, 313. [Google Scholar] [CrossRef]
- Sausa, R.C.; Venizelos, D.T. Flame structure studies of burner-stabilized N2O-and NO2-containing flames by mass spectrometry, laser-induced fluorescence, and modeling. In Optical Diagnostics for Fluids, Solids, and Combustion; International Society for Optics and Photonics: San Diego, CA, USA, 2001; Volume 4448, pp. 1–7. [Google Scholar]
- Powell, O.A.; Papas, P.; Dreyer, C. Laminar burning velocities for hydrogen-, methane-, acetylene-, and propane-nitrous oxide flames. Combust. Sci. Technol. 2009, 181, 917–936. [Google Scholar] [CrossRef]
- Powell, O.A.; Dreyer, C.; Papas, P. Laser-induced fluorescence studies of nitric oxide formed in hydrogen-nitrous oxide, premixed flames. In Proceedings of the 45th AIAA/ASME/SAE/ASEE Joint Propulsion Conference & Exhibit, Denver, CO, USA, 2–5 August 2009. [Google Scholar]
- Powell, O.A.; Papas, P.; Dreyer, C.B. Hydrogen and C1–C3 hydrocarbon-nitrous oxide kinetics in freely propagating and burner-stabilized flames, shock tubes, and flow reactors. Combust. Sci. Technol. 2010, 182, 252–283. [Google Scholar] [CrossRef]
- Gray, P.; Mackinven, R.; Smith, D.B. Combustion of hydrogen and hydrazine with nitrous oxide and nitric oxide: Flame speeds and flammability limits of ternary mixtures at sub-atmospheric pressures. Combust. Flame 1967, 11, 217–226. [Google Scholar] [CrossRef]
- Gray, P.; Holland, S.; Smith, D.B. The effect of isotopic substitution on the flame speeds of hydrogen/oxygen and hydrogen/nitrous oxide flames. Combust. Flame 1970, 14, 361–374. [Google Scholar] [CrossRef]
- Mével, R.; Lafosse, F.; Chaumeix, N.; Dupre, G.; Paillard, C.E. Spherical expanding flames in H2–N2O–Ar mixtures: Flame speed measurements and kinetic modeling. Intern. J. Hydrogen Energy 2009, 34, 9007–9018. [Google Scholar] [CrossRef]
- Mével, R.; Lafosse, F.; Chaumeix, N.; Dupre, G.; Paillard, C.E. Flame speed measurement in H2-N2O-Ar mixtures. In Proceedings of the 4th European Combustion Meeting, Vienna, Austria, 14–17 April 2009. [Google Scholar]
- Bane, S.P.M.; Mével, R.; Coronel, S.A.; Shepherd, J.E. Flame burning speeds and combustion characteristics of undiluted and nitrogen-diluted hydrogen-nitrous oxide mixtures. Intern. J. Hydrogen Energy 2011, 36, 10107–10117. [Google Scholar] [CrossRef]
- Henrici, H.; Bauer, S.H. Kinetics of the nitrous oxide–hydrogen reaction. J. Chem. Phys. 1969, 50, 1333–1342. [Google Scholar] [CrossRef]
- Soloukhin, R.I. High-temperature oxidation of hydrogen by nitrous oxide in shock waves. In Proceedings of the 14th Symposium on Combustion, Pennsylvania, PA, USA, 20–25 August 1972; Elsevier: Amsterdam, The Netherlands, 1973; pp. 77–82. [Google Scholar]
- Baldwin, R.R.; Gethin, A.; Plaistowe, J.; Walker, R.W. Reaction between hydrogen and nitrous oxide. J. Chem. Soc. Faraday Trans. 1975, 71, 1265–1284. [Google Scholar] [CrossRef]
- Borisov, A.A.; Zamanskii, V.M.; Skachkov, G.I. Kinetics and mechanism of reaction of hydrogen with nitrous oxide. Kinetika i Kataliz 1978, 19, 38–46. [Google Scholar]
- Golovichev, V.I.; Soloukhin, R.I. Combustion kinetics of a mixture of hydrogen and nitrous oxide in shock waves. Combust. Explos. Shock Waves 1975, 11, 675–677. [Google Scholar] [CrossRef]
- Hidaka, Y.; Takuma, H.; Suga, M. Shock-tube studies of N2O decomposition and N2O-H2 reaction. Bull. Chem. Soc. Jpn. 1985, 58, 2911–2916. [Google Scholar] [CrossRef] [Green Version]
- Allen, M.T.; Yetter, R.A.; Dryer, F.L. Hydrogen/nitrous oxide kinetics-Implications of the NxHy species. Combust. Flame 1998, 112, 302–311. [Google Scholar] [CrossRef]
- Kosarev, I.N.; Starikovskaia, S.M.; Starikovskii, A.Y. The kinetics of autoignition of rich N2O–H2–O2–Ar mixtures at high temperatures. Combust. Flame 2007, 151, 61–73. [Google Scholar] [CrossRef]
- Mével, R.; Lafosse, F.; Catoire, L.; Chaumeix, N.; Dupré, G.; Paillard, C.E. Induction delay times and detonation cell size prediction of hydrogen-nitrous oxide-diluent mixtures. Combust. Sci. Technol. 2008, 180, 1858–1875. [Google Scholar] [CrossRef]
- Mathieu, O.; Levacque, A.; Petersen, E.L. Effects of N2O addition on the ignition of H2–O2 mixtures: Experimental and detailed kinetic modeling study. Intern. J. Hydrogen Energy 2012, 37, 15393–15405. [Google Scholar] [CrossRef]
- Mével, R.; Davidenko, D.; Lafosse, F.; Chaumeix, N.; Dupré, G.; Paillard, C.É.; Shepherd, J.E. Detonation in hydrogen–nitrous oxide–diluent mixtures: An experimental and numerical study. Combust. Flame 2015, 162, 1638–1649. [Google Scholar] [CrossRef] [Green Version]
- Coffee, T.P. Kinetic mechanisms for premixed, laminar, steady state hydrogen/nitrous oxide flame. Combust. Flame 1986, 65, 53–60. [Google Scholar] [CrossRef]
- Glarborg, P.; Kubel, D.; Kristensen, P.G.; Hansen, J.; Dam-Johansen, K. Interactions of CO, NOx and H2O under post-flame conditions. Combust. Sci. Technol. 1995, 110, 461–485. [Google Scholar] [CrossRef]
- Mueller, M.; Yetter, R.; Dryer, F. Flow reactor studies and kinetic modeling of the H2/O2/NOx and CO/H2O/O2/NOx reactions. Intern. J. Chem. Kinet. 1999, 31, 705–724. [Google Scholar] [CrossRef]
- Smith, G.P.; Golden, D.M.; Frenklach, M.; Moriary, N.W.; Eiteneer, B.; Goldenberg, M.; Bowman, C.T.; Hanson, R.K.; Song, S.; Gardiner, W.C.; et al. GRI-Mech 3.0. Available online: http://combustion.berkeley.edu/gri-mech/version30/text30.html (accessed on 10 January 2022).
- Dayma, G.; Dagaut, P. Effects of air contamination on the combustion of hydrogen effect of NO and NO2 addition on hydrogen ignition and oxidation kinetics. Combust. Sci. Technol. 2006, 178, 1999–2024. [Google Scholar] [CrossRef]
- Kovacs, M.; Papp, M.; Zsely, I.G.; Turanyi, T. Determination of rate parameters of key N/H/O elementary reactions based on H2/O2/NOx combustion experiments. Fuel 2020, 264, 116720. [Google Scholar] [CrossRef]
- Zhang, Y.; Mathieu, O.; Petersen, E.L.; Bourque, G.; Curran, H. Assessing the predictions of a NOx kinetic mechanism on recent hydrogen and syngas experimental data. Combust. Flame 2017, 182, 122–141. [Google Scholar] [CrossRef] [Green Version]
- Razus, D.; Mitu, M.; Giurcan, V.; Movileanu, C. Laminar flame propagation in nitrogen-diluted stoichiometric H2-N2O mixtures—A numerical study. Revue Roumaine de Chimie 2021, 66, 255–265. [Google Scholar] [CrossRef]
- Razus, D.; Mitu, M.; Giurcan, V.; Movileanu, C.; Oancea, D. Methane-unconventional oxidant flames. Laminar burning velocities of nitrogen-diluted methane-N2O mixtures. Process Saf. Environm. Prot. 2018, 114, 240–250. [Google Scholar] [CrossRef]
- Giurcan, V.; Mitu, M.; Movileanu, C.; Razus, D.; Oancea, D. Numerical study of laminar flame propagation in CH4-N2O-N2 at moderate pressures and temperatures. Combust. Explos. Shock Waves 2022, 58, 22–33. [Google Scholar] [CrossRef]
- Mitu, M.; Giurcan, V.; Movileanu, C.; Razus, D.; Oancea, D. Propagation of CH4-N2O-N2 flames in a closed spherical vessel. Processes 2021, 9, 851–866. [Google Scholar] [CrossRef]
- Cosilab. version 3.0.3; Rotexo-Softpredict-Cosilab GmbH & Co KG: Bad Zwischenhahn, Germany, 2012; Available online: https://www.rotexo.com/index.php/en/ (accessed on 10 January 2019).
- Jarosinski, J. The thickness of laminar flames. Combust. Flame 1984, 56, 337–342. [Google Scholar] [CrossRef]
- Glassman, I.; Yetter, R.A. Combustion, 4th ed.; Academic Press Elsevier: Cambridge, MA, USA, 2008. [Google Scholar]
- Miller, J.A.; Bowman, C.T. Mechanism and modeling of nitrogen chemistry in combustion. Prog. Energy Combust. Sci. 1989, 15, 287–338. [Google Scholar] [CrossRef]
- Tsang, W.; Heron, J.T. Chemical kinetic database for propellant combustion. 1, Reactions involving NO, NO2, HNO, HNO2, HCN and N2O. J. Phys. Chem. Ref. Data 1991, 20, 609–663. [Google Scholar] [CrossRef]
Publisher’s Note: MDPI stays neutral with regard to jurisdictional claims in published maps and institutional affiliations. |
© 2022 by the authors. Licensee MDPI, Basel, Switzerland. This article is an open access article distributed under the terms and conditions of the Creative Commons Attribution (CC BY) license (https://creativecommons.org/licenses/by/4.0/).