Abstract
Process chromatography modelling for process development, design, and optimization as well as process control has been under development for decades. Still, the discussion of scientific potential and industrial applications needs is open to innovation. The discussion of next-generation modelling approaches starting from Langmuirian to steric mass action and multilayer or thermodynamic consistent real and ideal adsorption theory or colloidal particle adsorption approaches is continued.
1. Introduction
Chromatography modelling started in the 1980s and reached its main application and boom especially for simulated moving bed enantiomer separations [1]. Equilibrium phase description proved to be the most sensitive for technical operation in overloaded regions [2,3].
Modelling has been focussed on process design and optimization to reduce experimental efforts with regards to a fully experimental pilot plant operation [2]. Afterward, ideas for process control came up [4,5,6]; even the first artificial neuronal networks (ANN) approaches were proposed [7] and compared with fuzzy-logic methods, which was quite fancy in those times, with regards to standard process control systems (PCS) [8]. These PCS actions were not transferred in industrial applications as to our knowledge [9].
In process development and design, the most-often utilized approach for equilibrium phase separation description is the Langmuir isotherm [10], which can be enlarged for ion exchange, hydrophobic interaction, or mixed-mode resins of large protein-type molecules to a steric-mass-action (SMA) model [11]. All modelling approaches have in common a thermodynamic inconsistency. Therefore, some research was focussed on transferring approaches from gas to liquid phase adsorption [12,13] and to gain thermodynamically consistence [14,15,16]. Nevertheless, in daily project work, these more sophisticated models were not applied due to numerical complexity and higher efforts of experimental parameter determination. As of this day, SMA-based models are the gold standard with modifications for all macro-molecular chromatography units [17].
Nevertheless, besides the broad and successful utilization in industrial project work, due to efficiency the academic discussion, whether there are better—i.e., thermodynamically consistent—model descriptions on hand, has to be allowed.
The analytical diluted operation regions have been described and even retentions times predicted by many approaches such as [18,19,20,21] based on quantum mechanics and molecular structures as well as experimental databases. Other approaches include the Derajaguin–Landau–Verwey–Overbeck (DLVO) theory, which was able to predict retention times in diluted analytical mode [15]. In addition, the porous media structures with regards to appropriate material design have been analysed and modelled in more detail [22,23,24,25,26,27].
Artificial neural network ANN and evolutionary algorithm machine learning techniques do have a revival either for evaluation of high-throughput process development (HTPD) data from titration robotics [28,29,30], process design [31] or automation via process control [32].
Two recent papers deal with the phenomena in overloaded manufacturing operation conditions on the example of monoclonal antibody purification on ion-exchange again [33,34]. Here, the colloidal particle adsorption (CPA) model is proposed as a solution to map the course of manufacturing chromatograms, while stating that in typical manufacturing overloaded conditions the peak shape could not even be met with SMA-type models. Focussing in this discussion on the appropriate description not on thermodynamic consistence. In one of the latest works [34], it is claimed that CPA is the superior adsorption model, as it enables peak fronting to be described, which SMA cannot.
Form daily project work, we have observed that Langmuir, as well as SMA isotherms, are able to describe peak shoulders. This is why we have decided to examine this claim and to evaluate them based on the data given in the above-mentioned publication.
2. Materials and Methods
To carry out the calculations needed to evaluate the mentioned claims, a lumped pore diffusion model for chromatography was used [10,35,36]. This is the same model as is used in [34]. The mass balance of the stationary phase for the lumped pore diffusion model is [10]:
where is the porosity of the component, is the concentration of the component in the pores, is the time, is the loading, is the mean diameter of the resin particle, is the voidage, is the effective mass transport coefficient, and is the concentration in the continuous phase.
Different approaches for the modelling of adsorption have been described by different working groups [10,11,35,37,38]. In this study, adsorption is modelled using a steric-mass action isotherm as well as a Langmuir isotherm [37,39]; see (2).
Here, is the maximum loading capacity of the component and is the Langmuir coefficient of the component. and are related by the Henry coefficient ; see (3) [10]. Salt influence can be described by (4) and (5) defining , , , and as material constants [35,40].
To evaluate the claims made about the steric mass action model, Equations (2)–(5) were substituted with the SMA isotherm for ion exchange chromatography [41].
In this model represents the initial slope of the isotherm if . A comprises of the equilibrium constant . and the relation between the ligand density Λ, the salt ion charge , and the salt concentration .
The mass transfer coefficient is given by Equation (8). Here, is the film mass transfer coefficient, the particle radius, and the pore diffusion coefficient.
is calculated according to the correlation of Carta [42] and according to Wilson and Geanoplis [43].
3. Results
To examine this claim, we took a Langmuirian adsorption model as well as an SMA model to describe the experimental chromatograms given (dashed lines right); see Figure 1b from the original publication [34].
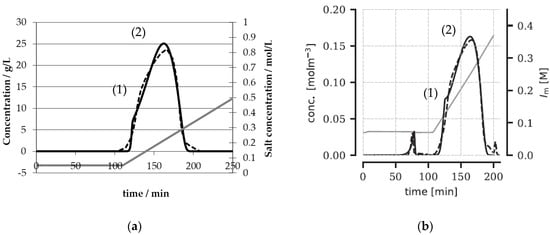
Figure 1.
Comparison of the Langmuirian adsorption model (a) with the data given in [34] (b). A similar course can be noted, especially at the shoulder (1) and the maximum (2).
As a result, the Langmuir isotherm (left) is able to describe the same effects as the colloidal particle adsorption (right). To examine the adsorption behavior, the Langmuir isotherms at different salt concentrations are given in Figure 2.
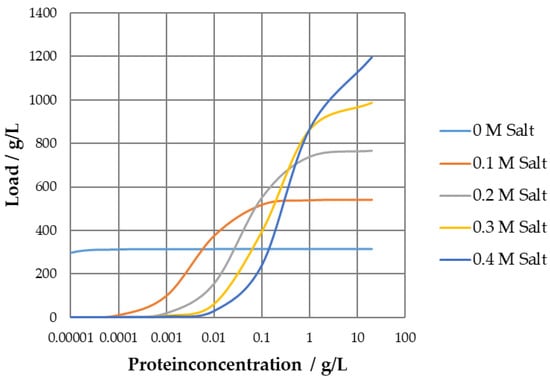
Figure 2.
Langmuir isotherm at salt concentrations of 0–0.4 M.
The parameters obtained result in a concave Langmuir isotherm for 0 M modifier concentration and convex runs for higher salt concentrations, which is a result of the positive incline of qmax over the salt concentration in conjunction with the sharp drop in the Henry coefficient, plotted in Figure 3 for visualization.
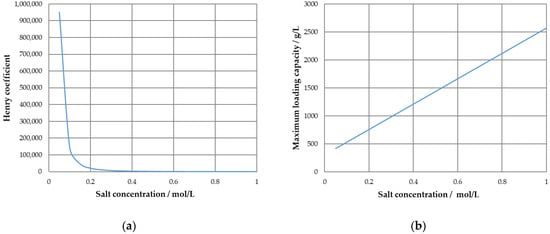
Figure 3.
Salt dependency of the Henry coefficient (a) and the maximum loading capacity for the Langmuir isotherm (b).
While the course of the Henry coefficient is typical, the increase in maximum loading capacity helps to depict the change from a concave to a convex shape as is the major influence in low concentration regions; see Equations (2) and (3).
This helps to describe the elution behavior of the protein; however, it suggests an unrealistic behavior outside of the standard working range, as the maximum loading capacity increases indefinitely with a higher salt concentration.
Trying to describe the Langmuir isotherm family using an SMA isotherm approach, it can be seen that the SMA parameters are able to describe the concave–convex change, but do not show the same unrealistic behavior for higher salt concentrations, as the maximum loading capacity is not increased with higher salt concentrations. This effect is depicted in Figure 4. Here, the SMA approach results are summarized as a comparison to the Langmuirian dataset.
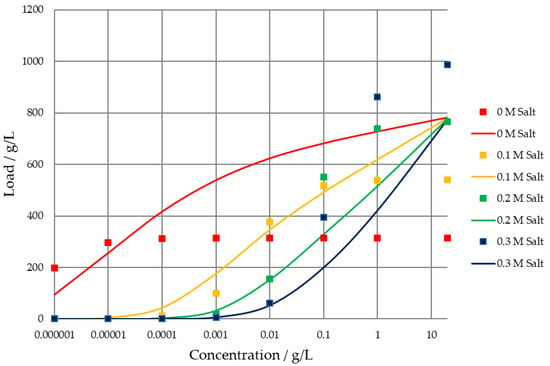
Figure 4.
Comparison of the SMA isotherm data (solid lines) and Langmuir isotherm data (symbols).
Therefore, it could be proven that the behavior of the Langmuir isotherm, which leads to the shoulder observed in the experimental data (see Figure 1b), can be emulated using the SMA model. When modelling the chromatography with SMA parameters determined via a least square error estimation scheme, the experimentally obtained data can be simulated quite accurately. These SMA simulation results using the test chromatogram from publication [34] are compared in Figure 5.
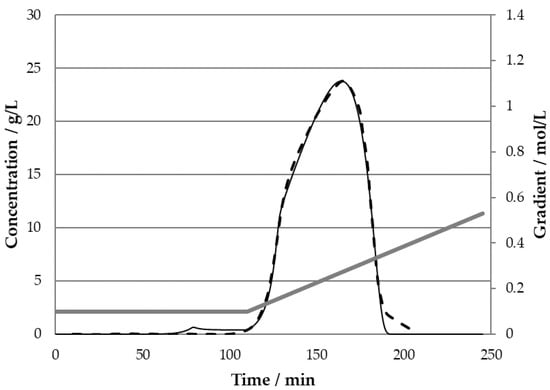
Figure 5.
Chromatogram comparison of experimental data from [33] (dashed) with SMA model simulation (solid line).
This proves that an SMA isotherm is able to depict the shoulder of the overloaded chromatogram quite well. Experimental data are calculated accurately with R2 = 99.6%. It could even be stated that the fit is quite a bit better than the CPA data shown.
Moreover, the SMA approach q over c isotherm diagram show the same shift from a classical Langmuir isotherm to an anti-Langmuirian course for higher salt concentrations as shown in Figure 6.
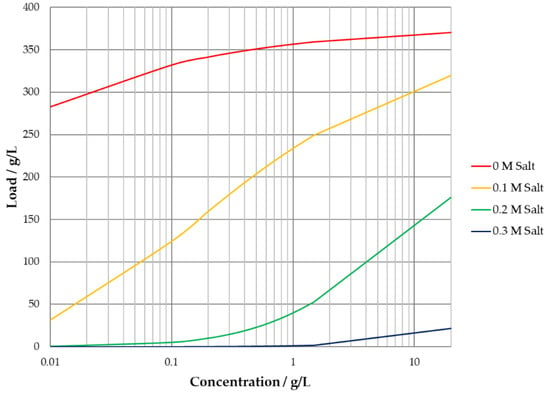
Figure 6.
Steric-mass-action isotherm for different salt concentrations.
4. Discussion
Thermodynamic consistency is needed, but the prediction of mixture behaviour from single component data is in most technical cases experimentally not feasible or inefficient as only mixtures are at first available. However, the appropriate prediction of separation performance in overlapping and highly loaded conditions within a broad operation range is needed. In process control, the calculation speed for set-point parameter optimization and the ability to be adopted easily to any operational parameter shifts with the aid of detector signals is dominating. Following the regulatory demanded quality-by-design approach, the model accuracy and precision have to be proven distinctly. If magnitudes of about 1000 over the full range of equally distributed datasets are not experimentally or operational available, then physical–chemical-based rigorous process models are capable of training machine learning algorithms well. In this context, process models gain new application hype as digital twins.
The SMA approach is able to describe even overloaded preparative/technical chromatography peak shapes well. This is supported by the fact that the model parameter values are all in typical realistic ranges and, moreover, that the experimental procedure for a consistent model parameter determination for the SMA approach is straightforward.
In this case, a simple parameter determination by, e.g., numerical estimation routines such as the minimization of the sum of least-square errors between a simulated and experimental chromatogram does work well without prior parameter estimation or additional experiments. As for the timeline, a few hours of work based only on one chromatogram leads to a sufficient description of the underlying thermodynamic system.
Moreover, when following the necessity for validation of the data due to accuracy and precision distinctly [44] for quantitative process predictions as needed in regulated industries and especially manufacturing conditions, the typical range of SMA parameter values is able to predict with sufficient validity due to pre-existing studies [36].
Author Contributions
Conceptualization, J.S.; methodology, F.L.V. and J.S.; calculations, F.L.V.; writing, editing, and reviewing, F.L.V. and J.S.; supervision, J.S. All authors have read and agreed to the published version of the manuscript.
Funding
This research received no external funding. We kindly acknowledge the support of Open Access Publishing Fund of the Clausthal University of Technology.
Data Availability Statement
Data cannot be made publicly available.
Conflicts of Interest
The authors declare no conflict of interest. The funders had no role in the design of the study, in the collection, analyses or interpretation of data; in the writing of the manuscript or in the decision to publish the results.
References
- Strube, J.; Jupke, A.; Epping, A.; Schmidt-Traub, H.; Schulte, M.; Devant, R. Design, optimization, and operation of SMB chromatography in the production of enantiomerically pure pharmaceuticals. Chirality 1999, 11, 440–450. [Google Scholar] [CrossRef]
- Strube, J. Technische Chromatographie: Auslegung, Optimierung, Betrieb und Wirtschaftlichkeit; Zugl.: Dortmund, Univ., Habil.-Schr., 1999, Als Ms. gedr; Shaker: Aachen, Germany, 2000; ISBN 978-3-8265-6897-8. [Google Scholar]
- Seidel-Morgenstern, A. Mathematische Modellierung der Präparativen Flüssigchromatographie; Zugl.: Berlin, Techn. Univ., Habil.-Schr., 1994; DUV Dt. Univ.: Wiesbaden, Germany, 1995; ISBN 9783824420643. [Google Scholar]
- Dünnebier, G.; Engell, S.; Epping, A.; Hanisch, F.; Jupke, A.; Klatt, K.-U.; Schmidt-Traub, H. Model-based control of batch chromatography. AIChE J. 2001, 47, 2493–2502. [Google Scholar] [CrossRef]
- Engell, S.; Toumi, A. Optimisation and control of chromatography. Comput. Chem. Eng. 2005, 29, 1243–1252. [Google Scholar] [CrossRef]
- Klatt, K.-U.; Hanisch, F.; Dünnebier, G.; Engell, S. Model-based optimization and control of chromatographic processes. Comput. Chem. Eng. 2000, 24, 1119–1126. [Google Scholar] [CrossRef] [Green Version]
- Wang, C.; Klatt, K.-U.; Dünnebier, G.; Engell, S.; Hanisch, F. Neural network-based identification of SMB chromatographic processes. Control. Eng. Pract. 2003, 11, 949–959. [Google Scholar] [CrossRef]
- Erdem, G.; Abel, S.; Morari, M.; Mazzotti, M.; Morbidelli, M.; Lee, J.H. Automatic Control of Simulated Moving Beds. Ind. Eng. Chem. Res. 2004, 43, 405–421. [Google Scholar] [CrossRef]
- Strube, J.; Zobel-Roos, S.; Ditz, R. Process-Scale Chromatography. Ullmann’s Encyclopedia of Industrial Chemistry; Wiley-VCH GmbH & Co. KGaA: Weinheim, Germany, 2000; pp. 1–47. ISBN 9783527306732. [Google Scholar]
- Guiochon, G.; Felinger, A.; Shirazi, D.G.; Katti, A.M. Fundamentals of Preparative and Nonlinear Chromatography, 2nd ed.; Elsevier Academic Press: Amsterdam, The Netherlands, 2006; ISBN 9780123705372. [Google Scholar]
- Brooks, C.A.; Cramer, S.M. Steric mass-action ion exchange: Displacement profiles and induced salt gradients. AIChE J. 1992, 38, 1969–1978. [Google Scholar] [CrossRef]
- Rajendran, A.; Maruyama, R.T.; Landa, H.O.R.; Seidel-Morgenstern, A. Modelling binary non-linear chromatography using discrete equilibrium data. Adsorption 2020, 26, 973–987. [Google Scholar] [CrossRef]
- Ortner, F.; Ruppli, C.; Mazzotti, M. Description of Adsorption in Liquid Chromatography under Nonideal Conditions. Langmuir 2018, 34, 5655–5671. [Google Scholar] [CrossRef]
- Ilić, M.; Flockerzi, D.; Seidel-Morgenstern, A. A thermodynamically consistent explicit competitive adsorption isotherm model based on second-order single component behaviour. J. Chromatogr. A 2010, 1217, 2132–2137. [Google Scholar] [CrossRef]
- Guélat, B.; Ströhlein, G.; Lattuada, M.; Morbidelli, M. Electrostatic model for protein adsorption in ion-exchange chromatography and application to monoclonal antibodies, lysozyme and chymotrypsinogen A. J. Chromatogr. A 2010, 1217, 5610–5621. [Google Scholar] [CrossRef] [PubMed]
- Streb, A.; Mazzotti, M. Adsorption for efficient low carbon hydrogen production: Part 1—Adsorption equilibrium and breakthrough studies for H2/CO2/CH4 on zeolite 13X. Adsorption 2021, 27, 541–558. [Google Scholar] [CrossRef]
- Subramanian, G. (Ed.) Process Control, Intensification, and Digitalisation in Continuous Biomanufacturing; Wiley-VCH: Weinheim, Germany, 2022; ISBN 3-527-82734-X. [Google Scholar]
- Bendersky, M.; Davis, J.M. DLVO interaction of colloidal particles with topographically and chemically heterogeneous surfaces. J. Colloid Interface Sci. 2011, 353, 87–97. [Google Scholar] [CrossRef] [PubMed]
- Galushko, S.V.; Shishkina, I.; Urtans, E.; Rotkaja, O. ChromSword®: Software for Method Development in Liquid Chromatography. In Software-Assisted Method Development in High Performance Liquid Chromatography; Fekete, S., Molnár, I., Eds.; World Scientific (Europe): London, UK, 2018; pp. 53–94. ISBN 978-1-78634-545-5. [Google Scholar]
- Mazza, C.B.; Sukumar, N.; Breneman, C.M.; Cramer, S.M. Prediction of protein retention in ion-exchange systems using molecular descriptors obtained from crystal structure. Anal. Chem. 2001, 73, 5457–5461. [Google Scholar] [CrossRef]
- Salvalaglio, M.; Paloni, M.; Guelat, B.; Morbidelli, M.; Cavallotti, C. A two level hierarchical model of protein retention in ion exchange chromatography. J. Chromatogr. A 2015, 1411, 50–62. [Google Scholar] [CrossRef]
- Grimes, B.A.; Skudas, R.; Unger, K.K.; Lubda, D. Pore structural characterization of monolithic silica columns by inverse size-exclusion chromatography. J. Chromatogr. A 2007, 1144, 14–29. [Google Scholar] [CrossRef]
- Liapis, A.I.; Grimes, B.A. Modeling the velocity field of the electroosmotic flow in charged capillaries and in capillary columns packed with charged particles: Interstitial and intraparticle velocities in capillary electrochromatography systems. J. Chromatogr. A 2000, 877, 181–215. [Google Scholar] [CrossRef]
- Skudas, R.; Grimes, B.A.; Thommes, M.; Unger, K.K. Flow-through pore characteristics of monolithic silicas and their impact on column performance in high-performance liquid chromatography. J. Chromatogr. A 2009, 1216, 2625–2636. [Google Scholar] [CrossRef]
- Leinweber, F.C.; Lubda, D.; Cabrera, K.; Tallarek, U. Characterization of silica-based monoliths with bimodal pore size distribution. Anal. Chem. 2002, 74, 2470–2477. [Google Scholar] [CrossRef]
- Ndocko Ndocko, E.; Ditz, R.; Josch, J.-P.; Strube, J. New Material Design Strategy for Chromatographic Separation Steps in Bio-Recovery and Downstream Processing. Chem. Ing. Tech. 2011, 83, 113–129. [Google Scholar] [CrossRef]
- Reich, S.-J.; Svidrytski, A.; Höltzel, A.; Wang, W.; Kübel, C.; Hlushkou, D.; Tallarek, U. Transport under confinement: Hindrance factors for diffusion in core-shell and fully porous particles with different mesopore space morphologies. Microporous Mesoporous Mater. 2019, 282, 188–196. [Google Scholar] [CrossRef]
- Walther, C.; Voigtmann, M.; Bruna, E.; Abusnina, A.; Tscheließnig, A.-L.; Allmer, M.; Schuchnigg, H.; Brocard, C.; Föttinger-Vacha, A.; Klima, G. Smart process development: Application of machine-learning and integrated process modeling for inclusion body purification processes. Biotechnol. Prog. 2022, e3249. [Google Scholar] [CrossRef] [PubMed]
- Jiang, Q.; Seth, S.; Scharl, T.; Schroeder, T.; Jungbauer, A.; Dimartino, S. Prediction of the performance of pre-packed purification columns through machine learning. J. Sep. Sci. 2022, 1–13. [Google Scholar] [CrossRef] [PubMed]
- Hubbuch, J. Editorial: High-throughput process development. Biotechnol. J. 2012, 7, 1185. [Google Scholar] [CrossRef]
- Mouellef, M.; Vetter, F.L.; Zobel-Roos, S.; Strube, J. Fast and Versatile Chromatography Process Design and Operation Optimization with the Aid of Artificial Intelligence. Processes 2021, 9, 2121. [Google Scholar] [CrossRef]
- Mouellef, M.; Szabo, G.; Vetter, F.L.; Siemers, C.; Strube, J. Artificial Neural Network for Fast and Versatile Model Param-eter Adjustment utilizing PAT signals of Chromatography Processes for Process Control under Production Conditions. Processes 2022, 10, 709. [Google Scholar] [CrossRef]
- Briskot, T.; Hahn, T.; Huuk, T.; Hubbuch, J. Protein adsorption on ion exchange adsorbers: A comparison of a stoichiometric and non-stoichiometric modeling approach. J. Chromatogr. A 2021, 1653, 462397. [Google Scholar] [CrossRef]
- Briskot, T.; Hahn, T.; Huuk, T.; Wang, G.; Kluters, S.; Studts, J.; Wittkopp, F.; Winderl, J.; Schwan, P.; Hagemann, I.; et al. Analysis of complex protein elution behavior in preparative ion exchange processes using a colloidal particle adsorption model. J. Chromatogr. A 2021, 1654, 462439. [Google Scholar] [CrossRef]
- Zobel-Roos, S. Entwicklung, Modellierung und Validierung von Integrierten Kontinuierlichen Gegenstrom-Chromatographie-Prozessen. Ph.D. Thesis, Universitätsbibliothek der TU Clausthal, Clausthal-Zellerfeld, Germany, 2018. [Google Scholar]
- Zobel-Roos, S.; Mouellef, M.; Ditz, R.; Strube, J. Distinct and Quantitative Validation Method for Predictive Process Modelling in Preparative Chromatography of Synthetic and Bio-Based Feed Mixtures Following a Quality-by-Design (QbD) Approach. Processes 2019, 7, 580. [Google Scholar] [CrossRef] [Green Version]
- Carta, G.; Jungbauer, A. Protein Chromatography: Process Development and Scale-Up; Wiley-VCH: Weinheim, Germany, 2010; ISBN 978-3-527-31819-3. [Google Scholar]
- Seidel-Morgenstern, A.; Guiochon, G. Modelling of the competitive isotherms and the chromatographic separation of two enantiomers. Chem. Eng. Sci. 1993, 48, 2787–2797. [Google Scholar] [CrossRef]
- Langmuir, I. The adsorption of gases on plane surfaces of glass, mica and platinum. J. Am. Chem. Soc. 1918, 40, 1361–1403. [Google Scholar] [CrossRef] [Green Version]
- Seidel-Morgenstern, A. Experimental determination of single solute and competitive adsorption isotherms. J. Chromatogr. A 2004, 1037, 255–272. [Google Scholar] [CrossRef] [PubMed]
- Mollerup, J.M. A Review of the Thermodynamics of Protein Association to Ligands, Protein Adsorption, and Adsorption Isotherms. Chem. Eng. Technol. 2008, 31, 864–874. [Google Scholar] [CrossRef]
- Carta, G.; Rodrigues, A.E. Diffusion and convection in chromatographic processes using permeable supports with a bidisperse pore structure. Chem. Eng. Sci. 1993, 48, 3927–3935. [Google Scholar] [CrossRef]
- Wilson, E.J.; Geankoplis, C.J. Liquid Mass Transfer at Very Low Reynolds Numbers in Packed Beds. Ind. Eng. Chem. Fund. 1966, 5, 9–14. [Google Scholar] [CrossRef]
- Sixt, M.; Uhlenbrock, L.; Strube, J. Toward a Distinct and Quantitative Validation Method for Predictive Process Modelling—On the Example of Solid-Liquid Extraction Processes of Complex Plant Extracts. Processes 2018, 6, 66. [Google Scholar] [CrossRef] [Green Version]
Publisher’s Note: MDPI stays neutral with regard to jurisdictional claims in published maps and institutional affiliations. |
© 2022 by the authors. Licensee MDPI, Basel, Switzerland. This article is an open access article distributed under the terms and conditions of the Creative Commons Attribution (CC BY) license (https://creativecommons.org/licenses/by/4.0/).