Abstract
The remediation of bromate in water is a concern due to the reported health issues caused by its ingestion. Catalytic processes, wherein bromate is reduced to non-hazardous bromide, have been studied. In the present work, catalysts of 1% palladium supported in electrospun carbon fibers (Pd-CFs) using different methods for palladium incorporation were prepared. The textural properties, morphology, crystalline structure, and hydrogenation capacity by H2 chemisorption analysis of the Pd-CFs catalysts were characterized. The catalytic tests were performed in a semi-batch reactor, and the obtained results showed different catalytic activity by each prepared Pd-CFs catalyst. The catalysts prepared by incipient wetness impregnation—1% Pd/CF1 and 1% Pd/CF2, using CFs obtained with electrospinning flow rates of 0.5 mL h−1 and 2 mL h−1, respectively—achieved total bromate reduction after 120 min of operation; however, 1% Pd/CF1 obtained total reduction as early as 30 min. Taking into account the catalyst properties, 1% Pd/CF1 showed a good catalytic activity due to CFs morphology obtained using a low electrospinning flow rate, while the Pd incorporation method allowed a high availability of active sites with hydrogenation properties for bromate reduction.
1. Introduction
Bromate (BrO3−) is classified as a contaminant according to the pollution concept by Geert Potters: “any form of contamination in an ecosystem with a harmful impact upon the organisms in this ecosystem, by changing the growth rate and reproduction of plant or animal species, or by interfering with human amenities, comfort, health, or property values” [1]. BrO3− as a pollutant is extensively reported, wherein harmful effects in human health such as cancerous diseases, gastrointestinal irritations, depressions of the central nervous system, and renal failure have been identified [2,3]. Its ecotoxicity has also been studied and the reported results demonstrated that fish exposed to bromate developed chronic pathological disorders [4,5]. This compound is not reported as occurring naturally in surface waters [6] but exists as salts (KBrO3 and NaBrO3) with high solubility in water [4]. However, recently, it has been detected after industrial or urban oxidation/disinfection processes for water treatment, such as ozonation [7] and disinfection with concentrated hypochlorite solutions [8], wherein BrO3− is formed in water when bromide ions in the reduced form, Br−, are present [9]. The International Agency for Research on Cancer (IARC), a part of the World Health Organization (WHO), classified BrO3− as a Group 2B or “possible human” carcinogen [10] and as consequence of this classification, the WHO and the United States Environmental Protection Agency (USEPA) have established a provisional guideline for BrO3− in drinking water of 0.01 mg L−1 [11,12]. On the other hand, the recent introduction of parts-per-billion drinking water standards may raise concerns about further contaminated sites within potable water supplies, leading to increased requirements for remediation of BrO3− [4] and the development of efficient water treatment technologies.
BrO3− removal methods have been researched since 1990s [13] and can be divided into physical techniques (nanofiltration and inverse osmose [14], UV [15]); chemical techniques (coagulation [16], reducing agents [17], zero-valent iron [18] and photocatalytic decomposition [19]) and biological techniques (biological remediation [20]). All the previously mentioned techniques demonstrated more disadvantages than advantages, even if some of them achieved promising results [4]. The imbalance of cost vs. efficiency, the formation of undesirable by-products and the high levels of system complexity that are difficult to scale-up with high efficiency of these solutions, have pushed the scientific community to invest in the study of low-cost catalytic processes for BrO3− reduction. Catalytic processes are a promising solution due to their economic and ecological character, ease of scaling up, and the possibility to develop technologies that are compact, transportable, and easily manageable [21]. Remediation of water contamination using heterogeneous catalytic technologies to convert oxyanions into less toxic or innocuous end products (e.g., Br−, Cl− and N2) are treatments that completely convert the pollutant instead of trapping it, as is the case in membrane filtration [22,23,24,25]. The best heterogeneous catalysts are composed of a support, which could play an active or passive role, a noble metal with hydrogenation properties that promotes the reduction of the contaminants, and a promoter metal used in bimetallic formulations for specific cases in the enhancement of the reduction, for example in NO3− reduction [23,26,27,28,29]. The support (active such as zero-valent iron [30] or passive such as carbon materials [31,32], zeolites [33,34], TiO2 [32,35] and alumina [32,36]), the noble metal (Pd, Pt, Ru or Rh [33,34,37,38,39]), and the promoter metal (Cu, Ni, Sn or Zn [40,41,42,43]) are adjusted according to the type of contaminants to be reduced and the aqueous matrix [36]. The presence of a reducing agent is necessary for a better electron transfer to noble metals, which permits efficient and fast reductions, generally achieved using gaseous hydrogen [40,44]. The solution pH also must be adjusted to the catalyst because some noble metals have better activity at low pH, such as Pd [45,46].
Focusing on BrO3− conversion into Br−, the noble metal that has demonstrated the most promising results, independently of the support used, is Pd [44,47,48,49]. However, the particle size and morphology of Pd are also parameters to be studied because they are reported to influence catalysis [50]. The support effect has been widely studied due to the activity effect and chemical and textural properties. Restivo et al. [44] reported that Pd catalyst supported on TiO2, multiwalled carbon nanotubes (MWCNT) and activated carbon (AC) achieved different results in BrO3− reduction. The activity of the studied supports followed the trend TiO2 > MWCNT > AC. The high activity of TiO2 was attributed to the electron transfer from Ti3+ centers on the support lattice and a strong metal support interaction, which resulted in the transfer of electrons to the metallic particles. The results of the catalyst supported on MWCNT were influenced by their mesoporous nature, which contributed to a decrease in diffusional limitations. AC as a support could also contribute to bromate removal by adsorption. Soares et al. [51] demonstrated the influence of chemical and textural surface properties of the catalyst support using as-received and modified MWCNT, wherein N-doped MWCNTs were the best support, while acid samples presented the worst performances, since electrostatic interactions with BrO3− were enhanced in the presence of basic supports. Nanocarbon fibers (CFs) have been achieving promising results when used as a support for noble metals in catalytic BrO3− reduction [31,52,53]. In this type of support, the diameter of the fibers, the textural properties and the method used for noble metal incorporation are important parameters that have been studied. CFs are usually synthesized by the electrospinning method, which allows control of the polymeric solution flow, which is a determinant of CF properties. Demir et al. [52] prepared CFs by electrospinning from solutions of poly/acrylonitrile-co-acrylic acid) (PAN) and PdCl2 and Pd metal dissolved in N,N-dimethylformamide (DMF). In this study, the effect of the concentration of PAN and the amounts of PdCl2 and Pd were evaluated. The prepared catalysts were tested in the catalytic hydrogenation of dehydrolinalool, and the obtained results demonstrated that the increase in PAN concentration leads to a decrease in the reaction rate because the polymer layer size decreased the availability of the catalytic active Pd surface. Increasing the PdCl2 concentration increases the number of nucleation sites of Pd particles, namely the particle density on the fibers. Consequently, particle size and dispersion can be tuned by the amount of salt and the composition of the copolymer. In addition, the authors demonstrated that small particles have larger surface area and increase the reaction rate. Wang et al. [53] used a wet impregnation method for Pd incorporation in CFs for catalytic performance. The authors studied the influence of the polymer and solvent ratio in electrospinning synthesis of CFs and identified an optimum ratio of 35:53, which provided an increase in specific surface area, average pore diameter and pore volume. Therefore, these achieved the most promising results in catalytic processes compared with the other CFs with different ratios and textural properties, because the wet impregnation of Pd nanoparticles (NPs) in CFs demonstrated better dispersion at the optimum ratio. Marco et al. [54] prepared Pd and Ru catalysts supported in monoliths coated with CFs, wherein CFs were synthesized by chemical vapor deposition and Pd incorporation was carried by two different methods: incipient wetness impregnation, which permitted to control the amount of the noble metal incorporated, and wet impregnation. Pd exhibited one order of magnitude higher specific activity than Ru in BrO3− reduction and the catalyst prepared by incipient wetness impregnation demonstrated high activity in the initial time instants, but activity loss was recorded after 7 h of reaction, due to the monolith crushing in the Pd incorporation step in catalyst synthesis which caused poor CF adhesion to the substrate (observed in scanning electron microscope analysis). The other catalyst demonstrated lower activity, but deactivation was not observed. The advantages of using electrospun CFs as physical support for noble metals to produce catalysts with hydrogenation properties instead of other supports, such as CNT and TiO2 are: (i) the versatility of the electrospinning procedure, which allows the synthesis of different types of CFs varying only a few parameters (voltage, feed rate, polymer, etc.) [55]; (ii) low cost and simple handling [56]; low resistance to internal diffusion [57]; (iii) more available catalytical phases which permits good activity and selectivity [58,59]; (iv) less agglomeration [55,60] and (v) prevention of active phase oxidation [55,61]. In the present study, Pd-CFs catalysts for BrO3− reduction were prepared, wherein the CFs were prepared by electrospinning with different feed solution flows, different Pd precursors and different incorporation methods. The synthesis of catalysts with varying characteristics by careful control of the preparation method aims at obtaining insights on the relationship between the Pd-CFs catalysts properties and their performance in bromate reduction.
2. Materials and Methods
2.1. Materials
Polyacrylonitrile (average Mw 150,000, Sigma-Aldrich, PAN), N,N-Dimethylformamide (puriss. p.a., ACS reagent, reag. Ph. Eur., >99.8% DMF, Sigma-Aldrich) were used for CFs synthesis and Palladium (II) chloride (99%, Sigma-Aldrich, St. Louis, MO, USA), Palladium (II) nitrate hydrate (Sigma-Aldrich) and HCl (37%, VWR Chemicals®, Radnor, PA, USA) were used for the Pd incorporation on CFs. Sodium bromate (≥99%, Sigma-Aldrich Co., St. Louis, MO, USA) was used to prepare bromate solutions for the catalytic reduction experiments. Sodium bromide (≥99%, Sigma-Aldrich Co., St. Louis, MO, USA) was used to prepare bromide solutions for ionic chromatography calibration and sodium carbonate (≥99.5%, Sigma-Aldrich Co., St. Louis, MO, USA) as chromatography separation mobile phase. Ultrapure water was used throughout this work.
2.2. Catalysts Synthesis
2.2.1. Preparation of Carbon Nanofibers
In a typical experiment, 12 g of PAN was dissolved in 88 g of DMF. After being stirred at 60 °C for 12 h, the precursor solution was transferred to a syringe for electrospinning. The custom-made electrospinning apparatus, consisting of a high voltage supply, a peristaltic pump, a syringe with a metal needle (23 G) and a drum collector, was used to fabricate the nanofibers. In a typical electrospinning process, the precursor solution was electrospun at 23 kV voltage, 15 cm working distance, and 0.5 or 2 mL h−1 flow rate at room temperature. A nonwoven mat of PAN nanofibers was collected on the drum. The as-spun nanofibers were heat treated at 300 °C for 2 h and then at 900 °C for 1 h under hydrogen atmosphere. The samples prepared with a flow rate of 0.5 and 2 mL h−1 were denoted as CF1 and CF2, respectively (see Figure 1).
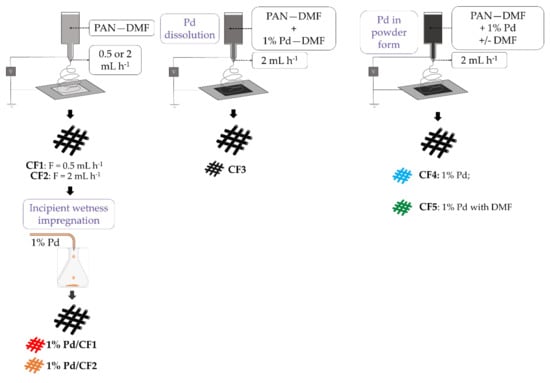
Figure 1.
Schematic illustration of the synthesis of Pd-CFs catalysts.
2.2.2. Preparation of Pd/CFs by Incipient Wetness Impregnation Method
Incipient wetness impregnation was used for Pd incorporation in CF supports, wherein the noble metal was dispersed on the surface of CFs. The procedure used was adapted from previous works [38,51] using CF1 and CF2 as supports. Firstly, CF1 and CF2 were ground to a controlled particle diameter between 0.1 and 0.3 mm and placed under ultrasonic mixing. 1 wt.% of Pd (from PdCl2 precursor) was dissolved in HCl and added dropwise to the supports, maintained under ultrasonic mixing for 90 min. Then, the materials were dried at 100 °C for 24 h and heat treated under N2 and H2 flow at 200 °C for 1 h and 3 h, respectively, using optimized conditions from previous works [62,63]. The obtained composites were 1% Pd/CF1 and 1% Pd/CF2. With these materials, it was possible to evaluate not only the influence of the method of Pd incorporation used but also the activity between CFs synthesized with different electrospinning flow rates (see Figure 1).
2.2.3. Preparation of Pd/CFs by the sol-gel Method
Nanofibers were prepared by electrospinning of a polymer and metal precursor gel formed by a sol-gel method. Briefly, 12 wt.% of PAN (with respect to DMF) were mixed with 1 wt.% of Pd (from Pd(NO3)2 precursor), previously dissolved in DMF. The sample was denoted as CF3. Another catalyst was prepared with a 12 wt.% PAN-DMF solution, and after the total dissolution of the polymer, 1 wt.% of Pd (from Pd(NO3)2 precursor) in powder form was added. The solution was kept under stirring 12 h and denoted as sample CF4. For the preparation of sample CF5, the 12 wt.% PAN-DMF solution and the palladium precursor in powder form (1 wt.%) were stirred for 24 h, and after that, the DMF solvent was added and stirring continued for 6 h. The precursor solutions were electrospun at 23 kV voltage, 15 cm working distance, and 2 mL h−1 flow rate at room temperature. The heat treatment was performed under the same conditions described in Section 2.1. These different catalysts will allow evaluation of the influence of the Pd precursors in DMF solution and powder forms and the effect of DMF after stirring (see Figure 1).
2.3. Materials Characterization
The N2 adsorption–desorption isotherms at –196 °C were collected using a Quantachrome NOVA 4200e multi-station apparatus. Before the physisorption analysis, the samples (c.a. 100 mg) were degassed at 350 °C for 3 h. The surface area (SBET) was calculated by the Brunauer–Emmett–Teller (BET) method [64]. The pore size distribution was evaluated by the BJH-method. Ash content was determined by thermogravimetric analysis (TGA) using a Mettler-Toledo TGA/DSC 1 STAR apparatus, by heating the samples under Ar flow from 50 to 900 °C, at a heating rate of 10 °C min−1, while performing two isothermal steps: 7 min under Ar and 13 min under air. Powder X-ray diffraction (XRD) analysis was performed using a PANanalytical X’Pert PRO diffractometer with Ni filtered Cu Kα radiation and a PIXcel detector. The sample was ground to a fine powder and placed in the sample holder. A Bragg Brentano configuration was used in a 2θ range from 20 to 80° with a step size of 0.01° and a time per step of 300 s. Collected data was analyzed using PANanalytical High Score software. The samples morphology was examined by a field-emission scanning electron microscope (FE-SEM, FEI Quanta 650 FEG) equipped with an INCA 350 spectrometer for energy dispersive X-ray spectroscopy (EDX) and by transmission electron microscopy (TEM, JEOL JEM-2100). The palladium content was determined by inductively coupled plasma–optical emission spectroscopy (ICP−OES) carried out on an ICPE-9000 multitype ICP emission spectrometer from Shimadzu, equipped with a nebulizing system, and using optical emission spectroscopy for detection. Samples were digested by dispersing 20 mg in 12 g of concentrated HNO3 (65%) in an autoclave, which was kept at 180 °C for 12 h to completely decompose the sample. Measurements were repeated three times and the results are the mean value with relative standard deviation. H2 chemisorption experiments were carried out in an Altamira Instruments AMI-300 apparatus at 200 °C and atmospheric pressure. 64 µL of H2 from a calibrated loop were injected in succession in 25 cm3 min−1 Ar (carrier gas), which passed through a 300 mg catalyst bed until saturation of the catalyst surface. An online thermal conductivity detector (TCD) was used to measure non-adsorbed H2.
2.4. BrO3− Removal Experiments
BrO3− reduction was accomplished in a semi-batch reactor at room temperature and atmospheric pressure, using a system with continuous stirring rate of 700 rpm. H2 was used as reducing agent and it was continuously fed at 50 Ncm3 min−1 flow rate. All the assays were performed with a total volume of 400–395 mL of ultrapure water and 5 mL of a concentrated solution of sodium bromate, to obtain a concentration of 5 mg BrO3− L−1 in the reaction medium—and 100 mg of catalyst. Before initiating the reaction, i.e., adding BrO3−, the catalyst dispersion on the liquid phase with H2 flow was maintained for 15 min for catalyst activation and air purging. Sampling was carried out from the reactor at defined periods, followed by centrifugation at 45,000 rpm for 5 min and filtration using micromembranes (porosity of 0.2 µm) to ensure no solid particles on IC analysis. The BrO3− ions concentration was followed by IC using a Metrohm 881 Compact IC Pro apparatus equipped with a Metrosep A Supp 7 anion exchange column with a detection limit of 0.01 mg L−1 and 3.6 mM of sodium carbonate mobile phase.
3. Results and Discussion
3.1. Characterization of Pd-CFs Composite Catalysts
The influence of the preparation method on the textural properties of the different catalyst materials was evaluated. Table 1 shows that it has a strong influence on the textural properties of the obtained materials. The carbon fibers prepared with a flow rate of 0.5 mL h−1 present a very low surface area of 20 m2 g−1, but the incorporation of the palladium precursor in the polymer solution (CF3, CF4 and CF5) increased the surface area of materials. The obtained results suggest: (i) the dissolution of the Pd precursor in DMF before introduction into the polymer solution provided the catalyst with a higher surface area (CF3, 344 m2 g−1) and (ii) the dispersion of the Pd precursor in powder form (CF4 and CF5) decreased the overall surface area and pore size; however, CF5 obtained a higher surface area than CF4, probably by the addition of DMF after Pd precursor dispersion.

Table 1.
Textural properties of the carbon fibers and catalysts.
The samples were characterized by powder XRD analysis to confirm the as-prepared Pd carbon fibers’ crystallinity. Figure 2 presents the XRD patterns of the different carbon fibers prepared with palladium. The XRD pattern of Pd carbon fibers exhibited four distinct reflections at 40.02° (111), 46.49° (200), 68.05° (220), and 81.74° (311). These are the characteristic reflections of the face-centered cubic (fcc) structure of Pd (ICDD 04-05-0492). Among all the reflections, the reflection at 40.02° (111) is the most intense, which may indicate the preferred direction for the growth of the nanocrystals.
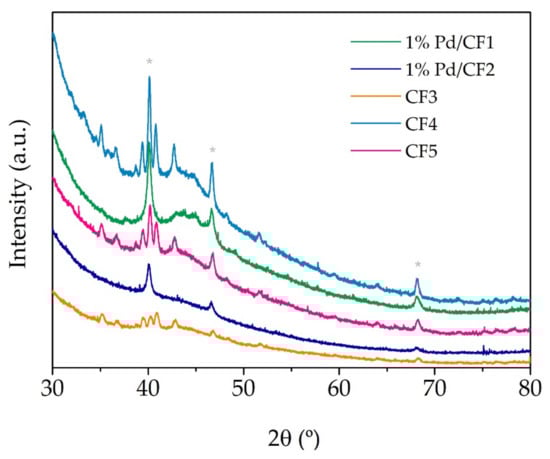
Figure 2.
XRD pattern of CFs prepared with palladium catalyst; * fcc reflections of Pd metal.
Figure 3 presents SEM images of the carbon fibers. The preparation conditions (feed flow, needle distance, and potential) applied here consistently produced a homogeneous material with no formation of beads. The carbonization of the polymeric fibers did not affect their morphology. Figure 3a,c presents SEM images of the carbon fibers prepared with only the polymer precursor, without the presence of the catalyst, using two different flow rates: 0.5 and 2 mL h−1, respectively. It is possible to conclude that the flow rate does not have a strong influence on the diameter of the obtained fibers (very similar diameter distribution) and the tested flow rates permitted availability of proper drying time prior to reaching the collector, avoiding beaded fibers [65,66]. Comparing the pore diameter of these two CFs, determined by physisorption analysis (see Table 1), it is possible to conclude that increasing the flow rate provided an increase in pore diameter (CF1: 0.5 mL h−1 and dpores of 1.2 nm, and CF2: 2 mL h−1 and dpores of 2.1 nm), which is in accordance with the literature [67,68]. When palladium was introduced into these samples by incipient impregnation, a slight decrease in the diameter of the fibers was observed. The use of HCl acid seemed to destroy some fibers, as it is possible to observe in Figure 3b,d the presence of some agglomerates. However, when the palladium was introduced in the spinnable solution, carbon fibers with a different distribution of diameters were obtained. The sample CF3, wherein the Pd precursor was dissolved in DMF and then mixed with the PAN-DMF solution, obtained the smallest diameter distribution, 0.5 µm (Figure 3e), due to the higher concentration of DMF (from Pd dissolution and PAN dissolution) in the electrospinning mixture. Following the reported studies about the influence of the solvent (DMF, in this case) concentration, the obtained results of CF3 were in accordance with literature, i.e., that an increase in the DMF concentration produces thinner CFs [69,70]. These results also explain the high surface area of CF3 (344 m2 g−1) due to the low fiber diameters [71]. Samples CF4 and CF5 (Pd precursor stirred in powder form) present mean diameters of 1.0 and 1.9 µm, respectively (Figure 3f,g) corresponding to the largest prepared CFs. In addition, it was observed in CF5, wherein DMF was added after Pd dispersion in PAN-DMF solution, that in this case the increase in DMF concentration did not provide CFs with thinner morphology but the opposite effect (a diameter almost double of CF4 and quadruple of CF3), although CF5’s surface area increased to 143 m2 g−1 when compared with CF4 (75 m2 g−1). These results show a different effect on CFs textural properties and morphology when adding DMF before or after Pd dispersion. In Figure 3g, it is possible to observe the presence of palladium particles on the surface of CF5, which leads to the conclusion that the method of introducing palladium, the concentration, and the method of adding DMF have strong influences on the morphological and textural properties of the materials and provided large Pd particles. In Figure 4, where TEM images of Pd-CFs are presented, different dispersions and sizes of Pd particles in each CF can be seen. For instance, CF3 and CF5 (Figure 4b,d, respectively) show heterogenous Pd dispersion and particles with different sizes, along with some particle agglomeration in CF3, while CF4 (Figure 4c) presents a homogenous dispersion with large particles. The 1% Pd/CF1 catalyst did not show visible Pd particles but comparing it with H2 chemisorption particles, it was possible to conclude that it had an efficient dispersion with Pd small particles.
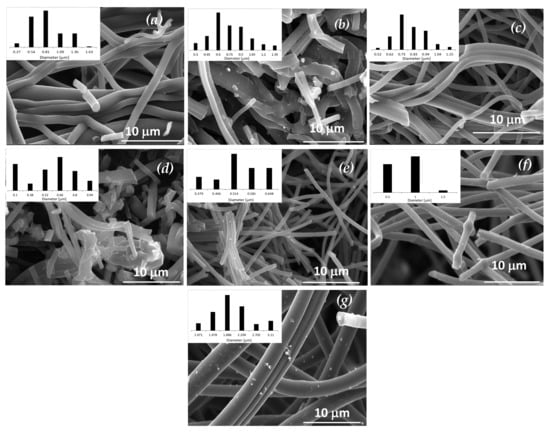
Figure 3.
SEM images of samples: (a) CF1, (b) 1% Pd/CF1, (c) CF2, (d) 1% Pd/CF2, (e) CF3, (f) CF4, and (g) CF5.
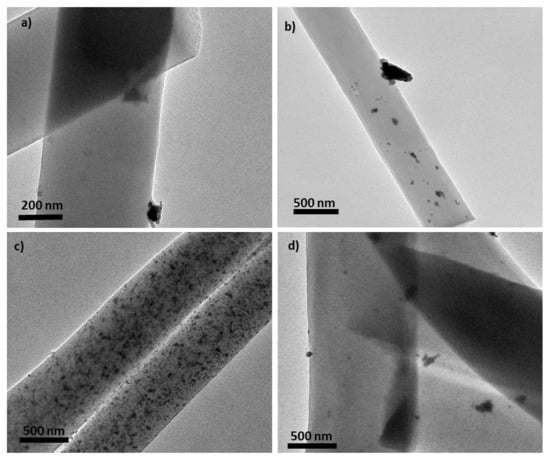
Figure 4.
TEM images of the following samples: (a) 1% Pd/CF1, (b) CF3, (c) CF4, and (d) CF5.
The immediate analysis experiments consisted of the thermal decomposition of the samples in inert and oxidizing atmospheres, allowing determination of the content of volatiles, fixed carbon, and ashes (Table 2). It appeared that the samples have very similar chemical compositions, in agreement with the XRD and ICP analyses, but varied in textural properties and morphology. The chemical composition determined with TG/DSC was similar for all catalysts, and any relationship between catalytic activity and this characterization was not identified.
Table 2.
Immediate analysis of the carbon fibers and H2 consumption.
The H2 chemisorption results, shown in Table 2, were analyzed considering that the meaning differences in hydrogen uptake are related directly with the Pd particle size or availability of the active sites for hydrogen chemisorption, as they have the same Pd loading in accordance with ICP results, which in turn result from differences in CFs morphology and the Pd impregnation approach. The results obtained clearly show that the method used for Pd incorporation on the CF supports influenced the H2 adsorption by Pd particles. For example, CF3, which was prepared by dissolution of Pd in DMF, obtained a H2 consumption of 0.11 mmol g−1, whereas CF4 and CF5, for which Pd was incorporated in powder form, achieved lower H2 consumption than CF3. Comparing these results with SEM, and textural properties, it was possible to verify that dissolution of Pd precursor in the PAN-DMF solution permitted obtaining CFs with different diameters, and low fiber diameters achieved better availability of Pd active sites (higher values of H2 adsorption). The catalysts 1% Pd/CF1 and 1% Pd/CF2 prepared by incipient wetness impregnation permitted a larger hydrogen chemisorption on Pd than the other catalysts, confirming more available Pd active sites for H2 adsorption. In these samples, it is not feasible to establish a direct correlation between H2 chemisorption and fiber diameter as SEM analysis showed a disordered structure of these samples; however, the destroyed structure by HCl in Pd dispersion may contribute to a good dispersion of Pd on the surface of CFs, showing the highest values of H2 chemisorption. The high values of H2 chemisorption by Pd-CFs catalysts prepared by incipient wetness impregnation compared with the other catalysts can be understood by taking into account the TEM results. For example, CF4 and CF5 with larger Pd particles and CF3 with heterogeneous dispersion of Pd obtained lower H2 consumption since these characteristics contribute to a lower available metal surface area [52]; however, 1% Pd/CF1 (Figure 4a), which showed non agglomeration of Pd particles and high values of H2 chemisorption, demonstrated that there was good dispersion of Pd particles.
Another observed difference in H2 consumption was noticed for different electrospinning flow rates used in catalysts synthesis, i.e., fixing the same method of Pd incorporation on CFs, but with an electrospinning flow rate of 2 mL min−1 allowed to obtain higher H2 consumption than the others with 0.5 mL min−1 (1% Pd/CF2 > 1% Pd/CF1). This also could be related to the textural properties of these catalysts, which were observed to present a higher surface area in 1% Pd/CF2 than 1% Pd/CF1, resulting in higher availability of Pd particles for H2 chemisorption. Table 3 shows that all catalysts demonstrated loadings of ~1% of Pd independently of the impregnation method used. The small deviations from the nominal value are consistent with those expected for the techniques used, including the analytical technique requiring sample digestion.
Table 3.
Palladium concentration by ICP-OES analysis for each tested catalyst.
3.2. Catalytic Tests
The BrO3− reduction results over 3 h are represented in Figure 5. Each catalyst exhibited different catalytic activity, demonstrating well-defined concentration profiles. Once more, the differences between catalysts, i.e., Pd dispersion and support morphology, were reflected in the BrO3− reduction efficiency. A relationship between H2 chemisorption and BrO3− reduction could be inferred, since a clear distinction between the samples prepared by incipient wetness impregnation and the other catalysts was noted. Despite the ICP-OES (Table 3) analysis demonstrating similar loadings of Pd in each catalyst, it was confirmed that the amount of available Pd active sites in 1% Pd/CF1 and 1% Pd/CF2 in contact with liquid phase was higher than the other catalysts, which is an important parameter for H2 adsorption in BrO3− reduction [72], providing the greatest performance in BrO3− reduction. However, the catalysts with different electrospinning flow rates demonstrated distinct activity with a non-correlated H2 chemisorption, wherein 1% Pd/CF1 prepared with 0.5 mL h−1 obtained lower H2 chemisorption than 1% Pd/CF2 prepared with 2 mL h−1 but with better performance in BrO3− reduction. In addition, these catalysts showed a disordered structure in SEM analysis which probably contributed to a better catalytic activity due to the observed Pd-CF agglomerates. Moreover, low fiber diameters result in low catalytic activity (CF3 having the worst activity). Comparing the surface areas of CF1 and CF2 without Pd, it was possible to conclude that these materials, prepared with the aforementioned electrospinning conditions, have low surface area. The observed variance of surface area values was related to the different Pd incorporation methods. Dispersing Pd in the electrospinning solution (CF3, CF4, and CF5) contributed to an increase in the specific surface area, likely due to the carbonization of precursors and solvents, creating some porosity. The influence of the applied form of Pd precursors resulted in different catalytic activities, wherein dispersing powder Pd precursor in PAN-DMF solutions permitted obtaining catalysts (CF4 and CF5) with better catalytic performance than CF3 where the Pd precursor was dissolved in DMF before being added to the PAN-DMF solution. In addition, using DMF for Pd dissolution provided a catalyst (CF3) with lower catalytic activity than using DMF as a solvent added to the polymeric-Pd powder precursor solution (CF5). Similar H2 chemisorption was obtained by CF3 and CF4; however, the increase in the porosity of CF3 (with the highest surface area) could not promote the catalytic activity of CF3, and the enhancement of BrO3− reduction by CF4 may be explained by the absence of DMF and a better Pd dispersion in powder form. CF5, as mentioned before, obtained better catalytic activity than CF3, validating that Pd powder dispersion permitted to obtain catalysts with better performance than the ones prepared by Pd dissolution in DMF. Adding DMF after the dispersion of Pd powder precursor in PAN-DMF solution (CF5) may cause an inefficient stabilization of Pd particles by DMF, resulting in a loss in catalytic activity over the reaction time (see Figure 5). Additionally, this solvent also had an important role in the CF structure, which was observed in SEM analysis (fiber diameters), and, consequently, an influence on catalytic activity because it affects Pd dispersion [65]. Two hypotheses to explain the CF5 deactivation after 45 min of reaction were considered: (i) a probable phenomenon of Pd leaching and (ii) Pd migration creating larger Pd particles during the reaction that provided worse catalytic activity than small particles [52]. In addition, comparing the CF morphology of CF5 and CF4, SEM analysis demonstrated that CF5 had the highest fiber diameters, mostly 1.9 µm, which probably exceeds the optimum diameter for an optimal catalytic performance, because 1% Pd/CF1, 1%Pd/CF2, and CF4, with better catalytic activity, had lower fiber diameters. TEM analysis can also explain the worse performance of CF3 and CF5 due to the larger size and heterogeneous dispersion of Pd particles. Sample CF5 in particular seemed to present some Pd particles inside the carbonized fiber matrix, which contributed to the poor availability of metallic active sites.
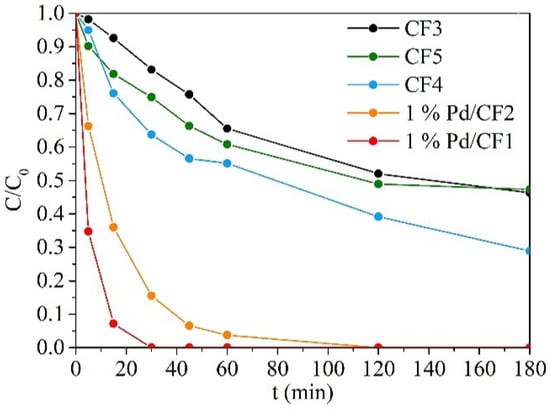
Figure 5.
Dimensionless concentration of BrO3− during catalytic experiments using Pd-CFs composite catalysts.
A comparison in catalytic performance of each catalyst was carried out by calculating the turn-over-frequency (TOF) values, taking into account the first-order rate constant (k) for each catalyst reaction and the metallic specific surface area (SM). Pd dispersion was not used as some Pd-CF catalysts had Pd particles inside the fibers contributing to metal loading but not to hydrogen chemisorption or BrO3− hydrogenation. The kinetics were calculated as a first-order reaction considering 15 min of reaction and SM and TOF values following the Equation (1) from Figueiredo et al. [73] and Equation (2).
The variables for SM calculation were , corresponding to the adsorbed moles of H2 per gram of catalyst, which was obtained from the H2 chemisorption measurement (Table 2); N, Avogadro’s constant; n, the number of metal atoms per adsorbed hydrogen molecule that in this case corresponds to 1; and ns, the number of atoms in the surface per area units. This last variable depends on the noble metal, and for Pd corresponds to 1.27 × 10¹⁹ m−2 [73]. Table 4 shows the obtained TOF values from calculations of k and SM. As expected, 1% Pd/CF1 obtained the highest rate constant value. However, comparing the TOF values, CF4 and CF5 obtained higher values than 1% Pd/CF1 but, as demonstrated in catalytic tests, worse catalytic activity. Both catalysts presented low SM and H2 chemisorption; however, the high TOF values indicate that all dispersed Pd particles are active sites for hydrogenation—high intrinsic catalytic activity—even if the used methods for Pd dispersion were not effective in obtaining high catalytic activity due to the poor availability of the active sites. Although 1% Pd/CF1 did not obtain the highest TOF value, it must be noted that the textural properties and fiber morphology seem to play important roles in catalytic activity, as discussed before.
Table 4.
Determination of TOF values for each Pd-CF catalyst in BrO3− reduction.
For a better view of the performance of each studied material, Figure 6 summarizes the BrO3− conversion after 30 min of reaction. The catalytic activity from the best to worst was as follows: 1% Pd/CF1 (100% of BrO3− conversion) > 1% Pd/CF2 > CF4 > CF5 > CF3. It also shows that 1% Pd/CF1, after 30 min of reaction, achieved a total conversion of BrO3− (100%). The obtained results demonstrate that CFs synthesized with an electrospinning flow of 0.5 mL min−1 followed with incipient wetness impregnation of Pd as a noble metal with catalytic properties for BrO3− reduction are promising materials to be applied in water treatment technologies.
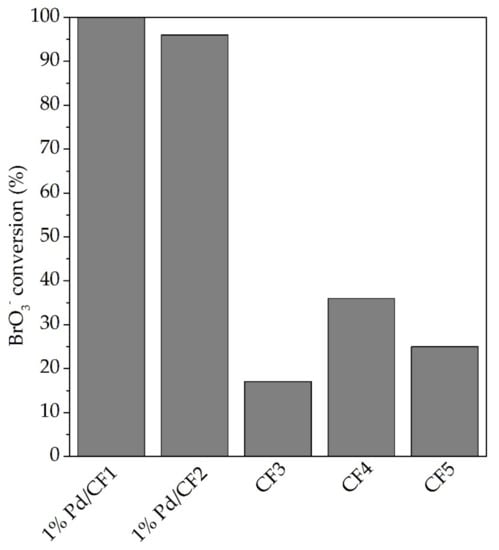
Figure 6.
BrO3− conversion after 30 min of reaction of each tested catalyst.
The different conditions in electrospinning (flow rate, solvent concentration, others reported elsewhere [70,74]) contributed to different types of CFs with different textural properties and morphology, and different methods for Pd dispersion, displayed distinct performance in BrO3− reduction, as reported in previous studies [53,75].
The stability of the 1% Pd/CF1 sample in catalytic reduction of BrO3− was assessed with three reutilization assays. Figure 7 presents the dimensionless bromate removal curves for each run of reutilization. In the second round, deactivation of the catalyst was observed, maintaining a similar performance in the third run. In the second and third runs, it could be observed that total removal of BrO3− was still achieved after 180 min of reaction. To understand the observed deactivation, SEM/EDS was carried out. The obtained results are in Figure 8 and did not clarify the deactivation phenomenon after the initial run. SEM images show similar morphology of CFs before and after reaction and EDS signals also demonstrated the presence of Pd in the catalysts in both cases. The migration of Pd particles that gives rise to large particles may explain the deactivation of this catalyst. It should be noted that the silica signal seen in EDS analysis of the catalyst before reaction corresponds to contamination by the porous plate used during the thermal treatment of the catalyst.
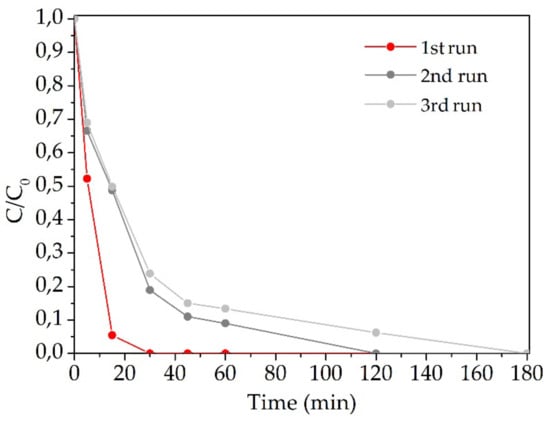
Figure 7.
Dimensionless concentration of BrO3− during reutilization experiments using 1% Pd/CF1.
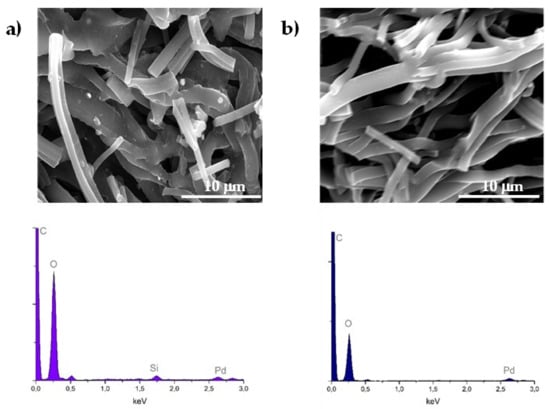
Figure 8.
SEM/EDS results of 1% Pd/CF1 (a) before catalytic reaction and (b) after a third run of the reutilization experiment.
Table 5 summarizes some catalysts with 1% Pd as a hydrogenation metal for BrO3− reduction supported on different physical supports, as well as the catalysts prepared in this study. Comparing the reported Pd catalysts with the ones prepared in this study it is possible to conclude that 1% Pd/CF1 is a promising catalyst for BrO3− reduction due to the low-cost procedure of CF synthesis when compared with other supports with good catalytic activity (e.g., MWCNT, TiO2) as well as the ease of manipulating the morphology of CFs which permits the upgrade of catalytic performance through the control of synthesis conditions.
Table 5.
Catalysts with a loading of 1 wt.% Pd used for BrO3− reduction in semi-batch reaction.
4. Conclusions
Catalysts of Pd supported on electrospun CFs were prepared by varying the method of Pd incorporation, the Pd precursor and the flow rate of the electrospinning process. Characterization of the catalysts allowed us to verify that the feed flow rate used during synthesis influences the textural properties. Furthermore, the Pd incorporation method influenced the textural properties as it was observed that the use of DMF for Pd dissolution increased the surface area of the catalyst, and that the order of addition also played an important role. SEM analysis enabled observation of the morphology of each catalyst and it was noted that the catalyst prepared by incipient wetness impregnation demonstrated a disordered structure, probably due to the presence of HCl used for Pd precursor dissolution; however, this phenomenon provided an increase in the pore diameter. TEM images enabled observation of different dispersions and sizes of Pd particles in each Pd-CFs catalyst, and allowed us to conclude that Pd incorporated in the electrospun mixture produced large Pd particles. H2 chemisorption tests demonstrated that incipient wetness impregnation provided the catalyst with a higher available amount of Pd active sites for H2 adsorption, proving that this method of Pd incorporation is the most promising to obtain catalysts with high hydrogenation properties for bromate reduction. The catalytic tests showed that 1% Pd/CF1 was the most promising catalyst, achieving total reduction of bromate after 30 min of reaction. Although a deactivation of 1% Pd/CF1 in the reutilization tests was observed, all the bromate was removed after 180 min of reaction. A low flow rate in the electrospinning feed and incipient wetness impregnation was shown to be the preferred method for Pd-CFs catalyst preparation for bromate reduction. The dissolution of Pd in the electrospun polymeric solution does not provide catalysts that achieve a total reduction of bromate due to poor accessibility of the metallic active sites.
Author Contributions
Conceptualization, O.S.G.P.S. and J.R.; methodology, O.S.G.P.S., J.R. and J.P.S.S.; investigation, J.R.M.B. and J.P.S.S.; resources, O.S.G.P.S., M.F.R.P. and J.P.S.S.; writing—original draft preparation, J.R.M.B.; writing—review and editing, J.R.M.B., J.P.S.S., J.R., O.S.G.P.S. and M.F.R.P.; supervision, O.S.G.P.S. and M.F.R.P.; funding acquisition, O.S.G.P.S., M.F.R.P. and J.P.S.S. All authors have read and agreed to the published version of the manuscript.
Funding
InTreat-PTDC/EAM-AMB/31337/2017—POCI-01-0145-FEDER-031337-funded by FEDER funds through COMPETE2020-Programa Operacional Competitividade e Internacionalização (POCI). NanoCatRed—NORTE-01-0247-FEDER-045925-co-financed by the ERDF—European Regional Development Fund through the Operation Program for Competitiveness and Internationalization—COMPETE 2020, and the North Portugal Regional Operational Program—NORTE 2020 and by the Portuguese Foundation for Science and Technology—FCT under UT Austin Portugal. This work was financially supported by: LA/P/0045/2020 (ALiCE), Base-UIDB/50020/2020 and Programmatic-UIDP/50020/2020 Funding of LSRE-LCM, funded by national funds through FCT/MCTES (PIDDAC). OSGPS acknowledges FCT funding under the Scientific Employment Stimulus—Institutional Call CEECINST/00049/2018.
Conflicts of Interest
The authors declare no conflict of interest.
References
- Potters, G. What is pollution? In Marine Pollution; Oxford University Press: Oxford, UK, 2013. [Google Scholar]
- Quick, C.; Chole, R.; Manuer, S. Deafness and renal failure due to potassium bromate poisoning. Arch. Otolaryngol. 1975, 101, 494–495. [Google Scholar] [CrossRef] [PubMed]
- Health Canada. Overview and application. In Guidelines for Canadian Drinking Water Quality: Guideline Technical Document-Bromate; Water and Air Quality Bureau, Healthy Environments and Consumer Safety Branch, Health Canada: Ottawa, ON, Canada, 2016. [Google Scholar]
- Butler, R.; Godley, A.; Lytton, L.; Cartmell, E. Bromate Environmental Contamination: Review of Impact and Possible Treatment. Crit. Rev. Environ. Sci. Technol. 2005, 35, 193–217. [Google Scholar] [CrossRef]
- Dodd, D.E.; Layko, D.K.; Cantwell, K.E.; Willson, G.A.; Thomas, R.S. Subchronic toxicity evaluation of potassium bromate in Fischer 344 rats. Environ. Toxicol. Pharmacol. 2013, 36, 1227–1234. [Google Scholar] [CrossRef] [PubMed]
- Hutchinson, T.; Hutchings, M.; Moore, K. A Review of the Effects of Bromate on Aquatic Organisms and Toxicity of Bromate to Oyster (Crassostrea gigas) Embryos. Ecotoxicol. Environ. Saf. 1997, 38, 238–243. [Google Scholar] [CrossRef]
- Kruithof, J.; Meijers, R. Bromate formation by ozonation and advanced oxidation and potential options in drinking water treatment. Water Supply 1995, 13, 93–103. [Google Scholar]
- IPCS. Chemistry of disinfectants and disinfectant by-products. In Disinfectants and Disinfectant by-Products; World Health Organization, Internation Programme on Chemical Safety: Geneva, Switzerland, 2000. [Google Scholar]
- Haag, W.; Hoigne, J. Ozonation of bromide-containing waters: Kinetics of formation of hypobromous acid and bromate. Environ. Sci. Technol. 1983, 17, 261–267. [Google Scholar] [CrossRef]
- IARC. Potassium Bromate (Summary of Data Reported and Evaluation); IARC: Lyon, France, 1999. [Google Scholar]
- USEPA. Public Health Goals for Chemicals in Drinking Water-Bromate; United States Environmental Protection Agency: San Francisco, CA, USA, 2009.
- World Health Organization. Guidelines for Drinking-Water Quality; WHO Press: Geneva, Switzerland, 2008; Volume 1. [Google Scholar]
- Meijers, R.; Kruithof, J. Potential treatment options for restriction of bromate formation and bromate removal. Water Supply 1995, 13, 183–189. [Google Scholar]
- Prados-Ramirez, M.; Ciba, N.; Bourbigot, M. Available techniques for reducing bromate in drinking water. Water Supply 1995, 13, 61–70. [Google Scholar]
- Peldszuz, S.; Andrews, S.; Souza, R.; Smith, F.; Douglas, I.; Bolton, J.; Huck, P. Effect of medium-pressure UV irradiation on bromate concentrations in drinking water, a pilot-scale study. Water Res. 2004, 38, 211–217. [Google Scholar] [CrossRef]
- Siddiqui, M.; Amy, G.; Ozekin, K.; Zhai, W.; Westerhoff, P. Alternative strategies for removing bromate. J. Am. Water Work. Assoc. 1994, 86, 81–96. [Google Scholar] [CrossRef]
- Gordon, G.; Gauw, R.; Emmert, G.; Walters, B.; Bubnis, B. Chemical reduction methods for bromate ion removal. J. Am. Water Work. Assoc. 2002, 94, 91–98. [Google Scholar] [CrossRef]
- Westerhoff, P. Reduction of nitrate, bromate, and chlorate by zero-valent iron (Fe0). J. Environ. Eng. 2003, 129, 10–16. [Google Scholar] [CrossRef]
- Siddiqui, M.S.; Amy, G.L.; Cooper, W.J. Bromate ion removal by electric-arc discharge and high-energy electron beam processes. In Water Disinfection and Natural Organic Matter; American Chemical Society: Washington, DC, USA, 1996; Volume 649, pp. 366–383. [Google Scholar]
- Hijnen, W.; Jong, R.; van der Kooij, D. Bromate removal in a denitrifying bioreactor used in water treatment. Water Res. 1999, 33, 1049–1053. [Google Scholar] [CrossRef]
- Centi, G.; Perathoner, S. Remediation of water contamination using catalytic technologies. Appl. Catal. B Environ. 2003, 41, 15–29. [Google Scholar] [CrossRef]
- McAdam, E.J.; Judd, S.J. Biological treatment of ion-exchange brine regenerant for re-use: A review. Sep. Purifcation Technol. 2008, 62, 264–272. [Google Scholar] [CrossRef]
- Liu, J.; Choe, J.; Sasnow, Z.; Werth, C.; Strathmann, T. Application of a Re–Pd bimetallic catalyst for treatment of perchlorate in waste ion-exchange regenerant brine. Water Res. 2013, 47, 91–101. [Google Scholar] [CrossRef]
- Choe, J.K.; Mehnert, M.H.; Guest, J.S.; Strathmann, T.J.; Werth, C.J. Comparative Assessment of the Environmental Sustainability of Existing and Emerging Perchlorate Treatment Technologies for Drinking Water. Environ. Sci. Technol. 2013, 47, 4644–4652. [Google Scholar] [CrossRef]
- Choe, J.; Bergquist, A.; Jeong, S.; Guest, J.; Werth, C.; Strathmann, T. Performance and life cycle environmental benefits of recycling spent ion exchange brines by catalytic treatment of nitrate. Water Res. 2015, 80, 267–280. [Google Scholar] [CrossRef]
- Prüsse, U.; Vorlop, K. Supported bimetallic palladium catalysts for water-phase nitrate reduction. J. Mol. Catal. A Chem. 2001, 173, 313–328. [Google Scholar] [CrossRef]
- Liu, J.; Choe, J.K.; Wang, Y.; Shapley, J.R.; Werth, C.J.; Strathmann, T.J. Bioinspired Complex-Nanoparticle Hybrid Catalyst System for Aqueous Perchlorate Reduction: Rhenium Speciation and Its Influence on Catalyst Activity. ACS Catal. 2015, 5, 511–522. [Google Scholar] [CrossRef]
- Perez-Coronado, A.M.; Soares, O.S.G.P.; Calvo, L.; Rodriguez, J.J.; Gilarranz, M.A.; Pereira, M.F.R. Catalytic reduction of bromate over catalysts based on Pd nanoparticles synthesized via water-in-oil microemulsion. Appl. Catal. B Environ. 2018, 237, 206–213. [Google Scholar] [CrossRef]
- Tokazhanov, G.; Ramazanova, E.; Hamid, S.; Bae, S.; Lee, W. Advances in the catalytic reduction of nitrate by metallic catalysts for high efficiency and N2 selectivity: A review. Chem. Eng. J. 2020, 384, 123252. [Google Scholar] [CrossRef]
- Hamid, S.; Bae, S.; Lee, W.; Amin, M.T.; Alazba, A.A. Catalytic Nitrate Removal in Continuous Bimetallic Cu–Pd/Nanoscale Zerovalent Iron System. Ind. Eng. Chem. Res. 2015, 54, 6247–6257. [Google Scholar] [CrossRef]
- Thakur, D.B.; Tiggelaar, R.M.; Weber, Y.; Gardeniers, J.G.E.; Lefferts, L.; Seshan, K. Ruthenium catalyst on carbon nanofiber support layers for use in silicon-based structured microreactors. Part II: Catalytic reduction of bromate contaminants in aqueous phase. Appl. Catal. B Environ. 2011, 102, 243–250. [Google Scholar] [CrossRef]
- Sakamoto, Y.; Kamiya, Y.; Okuhara, T. Selective hydrogenation of nitrate to nitrite in water over Cu-Pd bimetallic clusters supported on active carbon. J. Mol. Catal. A Chem. 2006, 250, 80–86. [Google Scholar] [CrossRef]
- Freitas, C.M.A.S.; Soares, O.S.G.P.; Órfão, J.J.M.; Fonseca, A.M.; Pereira, M.F.R.; Neves, I.C. Highly efficient reduction of bromate to bromide over mono and bimetallic ZSM5 catalysts. Green Chem. 2015, 17, 4247–4254. [Google Scholar] [CrossRef]
- Soares, O.S.G.P.; Freitas, C.M.A.S.; Fonseca, A.M.; Órfão, J.J.M.; Pereira, M.F.R.; Neves, I.C. Bromate reduction in water promoted by metal catalysts prepared over faujasite zeolite. Chem. Eng. J. 2016, 291, 199–205. [Google Scholar] [CrossRef]
- Bae, S.; Jung, J.; Lee, W. The effect of pH and zwitterionic buffers on catalytic nitrate reduction by TiO2-supported bimetallic catalyst. Chem. Eng. J. 2013, 232, 327–337. [Google Scholar] [CrossRef]
- Chen, X.; Huo, X.; Liu, J.; Wang, Y.; Werth, C.J.; Strathmann, T.J. Exploring beyond palladium: Catalytic reduction of aqueous oxyanion pollutants with alternative platinum group metals and new mechanistic implications. Chem. Eng. J. 2017, 313, 745–752. [Google Scholar] [CrossRef] [Green Version]
- Soares, O.S.G.P.; Órfão, J.J.M.; Pereira, M.F.R. Activated Carbon Supported Metal Catalysts for Nitrate and Nitrite Reduction in Water. Catal. Lett. 2008, 126, 253–260. [Google Scholar] [CrossRef]
- Restivo, J.; Soares, O.S.G.P.; Órfão, J.J.M.; Pereira, M.F.R. Metal assessment for the catalytic reduction of bromate in water under hydrogen. Chem. Eng. J. 2015, 263, 119–126. [Google Scholar] [CrossRef]
- Restivo, J.; Soares, O.S.G.P.; Órfão, J.J.M.; Pereira, M.F.R. Bimetallic activated carbon supported catalysts for the hydrogen reduction of bromate in water. Catal. Today 2015, 249, 213–219. [Google Scholar] [CrossRef] [Green Version]
- Zhao, W.; Zhu, X.; Wang, Y.; Ai, Z.; Zhao, D. Catalytic reduction of aqueous nitrates by metal supported catalysts on Al particles. Chem. Eng. J. 2014, 254, 410–417. [Google Scholar] [CrossRef]
- Bae, S.; Hamid, S.; Jung, J.; Sihn, Y.; Lee, W. Effect of promoter and noble metals and suspension pH on catalytic nitrate reduction by bimetallic nanoscale Fe0 catalysts. Environ. Technol. 2016, 37, 1077–1087. [Google Scholar] [CrossRef] [PubMed]
- Hamid, S.; Kumar, M.A.; Lee, W. Highly reactive and selective Sn-Pd bimetallic catalyst supported by nanocrystalline ZSM-5 for aqueous nitrate reduction. Appl. Catal. B Environ. 2016, 187, 37–46. [Google Scholar] [CrossRef]
- Hamid, S.; Bae, S.; Lee, W. Novel bimetallic catalyst supported by red mud for enhanced nitrate reduction. Chem. Eng. J. 2018, 348, 877–887. [Google Scholar] [CrossRef]
- Restivo, J.; Soares, O.S.G.P.; Órfão, J.J.M.; Pereira, M.F.R. Catalytic reduction of bromate over monometallic catalysts on different powder and structured supports. Chem. Eng. J. 2017, 309, 197–205. [Google Scholar] [CrossRef]
- Chen, H.; Xu, Z.; Wan, H.; Zheng, J.; Yin, D.; Zheng, S. Aqueous bromate reduction by catalytic hydrogenation over Pd/Al2O3 catalysts. Appl. Catal. B Environ. 2010, 96, 307–313. [Google Scholar] [CrossRef]
- Wang, Y.; Liu, J.; Wang, P.; Werth, C.J.; Strathmann, T.J. Palladium Nanoparticles Encapsulated in Core–Shell Silica: A Structured Hydrogenation Catalyst with Enhanced Activity for Reduction of Oxyanion Water Pollutants. ACS Catal. 2014, 4, 3551–3559. [Google Scholar] [CrossRef]
- Bruning-Fann, C.S.; Kaneene, J.B. The effects of nitrate, nitrite and N-nitroso compounds on human health: A review. Vet. Hum. Toxicol. 1993, 35, 521–538. [Google Scholar]
- Boorman, G.A.; Dellarco, V.; Dunnick, J.K.; Chapin, R.E.; Hunter, S.; Hauchman, F.; Gardner, H.; Mike, C.; Sills, R.C. Drinking water disinfection byproducts: Review and approach to toxicity evaluation. Environ. Health Perspect. 1999, 107, 207–217. [Google Scholar] [PubMed]
- Greer, M.A.; Goodman, G.; Pleus, R.C.; Greer, S.E. Health effects assessment for environmental perchlorate contamination: The dose response for inhibition of thyroidal radioiodine uptake in humans. Environ. Health Perspect. 2002, 110, 927–937. [Google Scholar] [CrossRef] [PubMed] [Green Version]
- Shuai, D.; McCalman, D.C.; Choe, J.K.; Shapley, J.R.; Schneider, W.F.; Werth, C.J. Structure Sensitivity Study of Waterborne Contaminant Hydrogenation Using Shape- and Size-Controlled Pd Nanoparticles. ACS Catal. 2013, 3, 453–463. [Google Scholar] [CrossRef]
- Soares, O.S.G.P.; Ramalho, P.S.F.; Fernandes, A.; Órfão, J.J.M.; Pereira, M.F.R. Catalytic bromate reduction in water: Influence of carbon support. J. Environ. Chem. Eng. 2019, 7, 103015. [Google Scholar] [CrossRef]
- Demir, M.M.; Gulgun, M.A.; Menceloglu, Y.Z.; Erman, B.; Abramchuk, S.S.; Makhaeva, E.E.; Khokhlov, A.R.; Matveeva, V.G.; Sulman, M.G. Palladium Nanoparticles by Electrospinning from Poly(acrylonitrile-co-acrylic acid)-PdCl2 Solutions. Relations between Preparation Conditions, Particle Size, and Catalytic Activity. Macromolecules 2004, 37, 1787–1792. [Google Scholar] [CrossRef] [Green Version]
- Wang, C.; Yin, J.; Han, S.; Jiao, T.; Bai, Z.; Zhou, J.; Zhang, L.; Peng, Q. Preparation of Palladium Nanoparticles Decorated Polyethyleneimine/Polycaprolactone Composite Fibers Constructed by Electrospinning with Highly Efficient and Recyclable Catalytic Performances. Catalysts 2019, 9, 559. [Google Scholar] [CrossRef] [Green Version]
- Marco, Y.; García-Bordejé, E.; Franch, C.; Palomares, A.E.; Yuranova, T.; Kiwi-Minsker, L. Bromate catalytic reduction in continuous mode using metal catalysts supported on monoliths coated with carbon nanofibers. Chem. Eng. J. 2013, 230, 605–611. [Google Scholar] [CrossRef]
- Guerrero-Pérez, M.O. Research Progress on the Applications of Electrospun Nanofibers in Catalysis. Catalysts 2021, 12, 9. [Google Scholar] [CrossRef]
- Barakat, N.A.M.; Motlak, M.; Elzatahry, A.A.; Khalil, K.A.; Abdelghani, E.A.M. NixCo1−x alloy nanoparticle-doped carbon nanofibers as effective non-precious catalyst for ethanol oxidation. Int. J. Hydrog. Energy 2014, 39, 305–316. [Google Scholar] [CrossRef]
- Reichelt, E.; Heddrich, M.P.; Jahn, M.; Michaelis, A. Fiber based structured materials for catalytic applications. Appl. Catal. A Gen. 2014, 476, 78–90. [Google Scholar] [CrossRef]
- Sin, D.-Y.; An, G.-H.; Ahn, H.-J. Improved Methanol Electro-Oxidation of Pt Electrocatalysts on Porous Carbon Nanofiber—Ruthenium Core—Shell Supports. J. Nanosci. Nanotechnol. 2016, 16, 10535–10540. [Google Scholar] [CrossRef]
- Alvi, M.A.; Akhtar, M.S. An effective and low cost Pd Ce bimetallic decorated carbon nanofibers as electro-catalyst for direct methanol fuel cells applications. J. Alloy. Compd. 2016, 684, 524–529. [Google Scholar] [CrossRef]
- Jiang, S.; Li, J.; Fang, J.; Wang, X. Fibrous-Structured Freestanding Electrodes for Oxygen Electrocatalysis. Small 2021, 17, 1903760. [Google Scholar] [CrossRef] [PubMed]
- Liu, C.-K.; Lai, K.; Liu, W.; Yao, M.; Sun, R.-J. Preparation of carbon nanofibres through electrospinning and thermal treatment. Polym. Int. 2009, 58, 1341–1349. [Google Scholar] [CrossRef]
- Soares, O.S.G.P.; Órfão, J.J.M.; Pereira, M.F.R. Nitrate reduction with hydrogen in the presence of physical mixtures with mono and bimetallic catalysts and ions in solution. Appl. Catal. B Environ. 2011, 102, 424–432. [Google Scholar] [CrossRef]
- Soares, O.S.G.P.; Órfão, J.J.M.; Ruiz-Martínez, J.; Silvestre-Albero, J.; Sepúlveda-Escribano, A.; Pereira, M.F.R. Pd–Cu/AC and Pt–Cu/AC catalysts for nitrate reduction with hydrogen: Influence of calcination and reduction temperatures. Chem. Eng. J. 2010, 165, 78–88. [Google Scholar] [CrossRef]
- Lowell, S.; Shields, J.E.; Thomas, M.A.; Thommes, M. Surface area analysis from the langmuir and BET theories. In Characterization of Porous Solids and Powders: Surface Area, Pore Size and Density; Springer: Dordrecht, The Netherlands, 2004; Volume 16, pp. 58–81. [Google Scholar]
- Wannatong, L.; Sirivat, A.; Supaphol, P. Effects of solvents on electrospun polymeric fibers: Preliminary study on polystyrene. Polym. Int. 2004, 53, 1851–1859. [Google Scholar] [CrossRef]
- Zuo, W.; Zhu, M.; Yang, W.; Yu, H.; Chen, Y.; Zhang, Y. Experimental study on relationship between jet instability and formation of beaded fibers during electrospinning. Polym. Eng. Sci. 2005, 45, 704–709. [Google Scholar] [CrossRef]
- Megelski, S.; Stephens, J.S.; Chase, D.B.; Rabolt, J.F. Micro- and Nanostructured Surface Morphology on Electrospun Polymer Fibers. Macromolecules 2002, 35, 8456–8466. [Google Scholar] [CrossRef]
- Zong, X.; Kim, K.; Fang, D.; Ran, S.; Hsiao, B.S.; Chu, B. Structure and process relationship of electrospun bioabsorbable nanofiber membranes. Polymer 2002, 43, 4403–4412. [Google Scholar] [CrossRef]
- Geng, X.; Kwon, O.; Jang, J. Electrospinning of chitosan dissolved in concentrated acetic acid solution. Biomaterials 2005, 26, 5427–5432. [Google Scholar] [CrossRef] [PubMed]
- Bhardwaj, N.; Kundu, S.C. Electrospinning: A fascinating fiber fabrication technique. Biotechnol. Adv. 2010, 28, 325–347. [Google Scholar] [CrossRef] [PubMed]
- Horzum, N.; Boyacı, E.; Eroğlu, A.E.; Shahwan, T.; Demir, M.M. Sorption Efficiency of Chitosan Nanofibers toward Metal Ions at Low Concentrations. Biomacromolecules 2010, 11, 3301–3308. [Google Scholar] [CrossRef] [PubMed] [Green Version]
- Formo, E.; Peng, Z.; Lee, E.; Lu, X.; Yang, H.; Xia, Y. Direct Oxidation of Methanol on Pt Nanostructures Supported on Electrospun Nanofibers of Anatase. J. Phys. Chem. C Lett. 2008, 112, 9970–9975. [Google Scholar] [CrossRef]
- Figueiredo, J.L.; Ribeiro, F.R. Actividade e selectividade. In Catálise Heterogénea, 2nd ed.; Fundação Calouste Gulbenkian: Lisbon, Portugal, 2007. [Google Scholar]
- Hedden, R.; Bauer, B.J.; Smith, A.P.; Gröhn, F.; Amis, E. Templating of inorganic nanoparticles by PAMAM/PEG dendrimer–star polymers. Polymer 2002, 43, 5473–5481. [Google Scholar] [CrossRef]
- Ye, J.-S.; Liu, Z.-T.; Lai, C.-C.; Lo, C.-T.; Lee, C.-L. Diameter effect of electrospun carbon fiber support for the catalysis of Pt nanoparticles in glucose oxidation. Chem. Eng. J. 2016, 283, 304–312. [Google Scholar] [CrossRef]
- Cerrillo, J.L.; Lopes, C.W.; Rey, F.; Palomares, A.E. The Influence of the Support Nature and the Metal Precursor in the Activity of Pd-based Catalysts for the Bromate Reduction Reaction. ChemCatChem 2021, 13, 1230–1238. [Google Scholar] [CrossRef]
- Sun, W.; Li, Q.; Gao, S.; Shang, J.K. Highly efficient catalytic reduction of bromate in water over a quasi-monodisperse, superparamagnetic Pd/Fe3O4 catalyst. J. Mater. Chem. A 2013, 1, 9215. [Google Scholar] [CrossRef]
Publisher’s Note: MDPI stays neutral with regard to jurisdictional claims in published maps and institutional affiliations. |
© 2022 by the authors. Licensee MDPI, Basel, Switzerland. This article is an open access article distributed under the terms and conditions of the Creative Commons Attribution (CC BY) license (https://creativecommons.org/licenses/by/4.0/).