Article

Adsorbent Minimization for Removal of Ibuprofen from Water in a Two-Stage Batch Process

by
Hajar Farzaneh
1,
Jayaprakash Saththasivam
2,
Gordon McKay
1,* and
Prakash Parthasarathy
1,*
1
Division of Sustainable Development, College of Science and Engineering, Hamad Bin Khalifa University, Qatar Foundation, Doha 34110, Qatar
2
Qatar Environment & Energy Research Institute, Hamad Bin Khalifa University, Qatar Foundation, Doha 34110, Qatar
*
Authors to whom correspondence should be addressed.
Processes 2022, 10(3), 453; https://doi.org/10.3390/pr10030453
Submission received: 29 December 2021 / Revised: 14 February 2022 / Accepted: 16 February 2022 / Published: 24 February 2022

Abstract

:
Pharmaceutical products in water, also known as personal pharmaceutical products or PCPPs, are developing contaminants that have the potential to impair human health and the environment in a variety of ecosystems. In this work, waste date stones, a waste product obtained from the seedless dates manufacturing industry, were used to make acid-activated carbon. This material has been utilized to extract the medicinal component ibuprofen from water, with a high adsorption capacity of 126 mg ibuprofen per g of waste date stone-generated activated carbon. A design study was conducted to minimize the amount of activated carbon required, utilizing a two-stage batch adsorption system to optimize the usage of the activated carbon. To test the model and compare the quantities of adsorbent required in the two-stage and single-stage systems under various conditions, several variables were entered into the design model.

1. Introduction

In recent decades, a myriad of pharmaceutical personal care products (PPCPs) and endocrine-disrupting substances (EDCs) have been frequently identified in the aquatic environment and various water bodies such as treated sewage effluents, surface water, groundwater, and drinking water [1,2,3]. The presence of these emerging contaminants, despite being trace amounts, is a growing concern due to their potential adverse toxic effects on aquatic organisms and human health [4,5]. One of the primary pathways for these compounds to enter and contaminate potable water resources is via treated sewage effluents. As the majority of wastewater treatment plants are designed to remove waste solids, carbon, nitrogen, and phosphorus, the conventional treatment processes deployed in these plants are only capable of partially eliminating emerging contaminants as some of these compounds are non-biodegradable, highly stable, resist precipitation, and remain soluble in the effluent stream [6]. Studies have indicated that estrogenic compounds found in treated sewage effluents led to the feminization of fish and amphibians. It has also been reported that estrogenic compounds could negatively affect and alter the self-endocrine regulation of humans. Another serious concern caused by emerging contaminants is the development of antibiotic-resistant bacteria and genes [7] that could pose a severe health risk to humans and animals.
Advanced tertiary treatment processes, namely advanced oxidation operations, membrane filtration, and adsorption, can be used to enhance the removal of contaminants of emerging concern such as PPCPs and EDCs. Advanced oxidation processes such as ozone, ozone-hydrogen peroxide, and UV-hydrogen peroxide have been reported as some of the most effective processes in removing emerging contaminants [8], but these operations may incur higher capital and operating costs for full-scale operation [1,9]. The formation of by-products of higher toxicity is another concern that is often associated with the usage of advanced oxidation processes [10]. Membrane filtration processes using nanofiltration and reverse osmosis membranes are also capable of removing emerging contaminants. However, the removal efficiency of membrane technologies is greatly governed by the properties of the membrane (molecular weight cutoff (MWCO), hydrophobicity, and surface charge) and the contaminants (MW distribution, hydrophobic/hydrophilic, and charge groups of organic material) [11]. The high membrane fouling potential due to the presence of organic matter is another drawback of using membrane technologies [12]. Adsorption is another efficient treatment process that can remove organic contaminants and does not produce any toxic by-products [13,14,15].
In this study, ibuprofen is used as a reference compound to evaluate the performance of activated carbon synthesized from local date stones. The data presented below prompted the researchers to pursue the production of activated carbon from date stones. According to the FAO, approximately 9,248,033 tonnes of dates were produced worldwide in 2019 [16]. Given that a date stone contributes 10% of the total weight of date fruit, the total amount of date stone available in the world is 900,000 tonnes [17]. With 10% of the available date stone, an activated carbon production capacity of 90,000 tonnes is possible globally.
Various studies have reported that the concentrations of ibuprofen in wastewater were usually in the range of ng/L to µg/L (703–1673 µg/L [18], 2500–45,000 ng/L [19], and 0.004–603 µg/L [20]. According to Almanassra et al. (2020), carbide-derived carbon (CDC) can be utilized as an adsorbent to remove ibuprofen from deionized water and treated sewage effluent successfully [21]. Guedidi et al. (2013) claimed that the surface modification of commercial granular-activated carbon, using hydrogen peroxide as an oxidant, led to the formation of carbonyl groups that aid the adsorption uptake of ibuprofen [22]. Another investigation by Guedidi et al. (2017) that investigated the performance of an activated-carbon cloth in removing ibuprofen showed the adsorption kinetics of ibuprofen was higher at a lower pH [23]. An investigation by Baccar et al. (2012), wherein the contaminant removal effectiveness was reduced at alkaline pH when utilizing olive-waste cake waste, derived activated carbon to remove ibuprofen and other medications such ketoprofen, naproxen, and diclofenac [24]. In a comparative study applying activated carbon obtained from local plant waste, Mestre et al. (2011) reported that ibuprofen had a higher removal efficiency than paracetamol [25]. This was attributed to the electrostatic interactions between the ibuprofen and surface charges of the carbon. Many other studies have reported high-quality activated carbons and chars have been produced from waste biomass and other wastes, including olive stones [26], bagasse [27], chitosan [28], waste bamboo furniture/scaffolding [29], and vehicle tyres [30]. Palm kernel shell was used to investigate the adsorption of three pharmaceuticals [31], namely atenolol, acebutolol, and carbamazepine with adsorption capacities of 154, 165, and 154 mg/g, respectively. Some studies have reported the synthesis of activated carbons from date stones, often termed date pits [32,33] using phosphoric acid [34], zinc chloride [35], and carbon dioxide [36]. The methodologies of converting date stones into activated carbons have yielded a variety of pollutant-removal applications for this material, such as pesticides [37], dyes [38,39,40], heavy metals [38,41,42], and pharmaceuticals [43,44].
In the current study, activated carbon has been produced by thermally treating phosphoric-acid-impregnated powdered waste date stone chars (by pyrolysis at 350–600 °C) at 550 °C for two hours. This carbon has been tested experimentally for its adsorption capacity towards ibuprofen, and the experimental equilibrium data were analyzed using seven isotherm models. Finally, utilizing a design study to minimize the amount of carbon required, using a two-stage batch adsorption system, a model was constructed and utilized to identify the best use of the activated carbon. To test the model and compare the quantities of adsorbent required in the two-stage and single-stage systems under various conditions, several variables were entered into the design model.

2. Materials and Experimental

2.1. Raw Materials Treatment

A manufacturer (Bateel Ltd., Doha, Qatar) of stoneless date food products provided the dates stones. To remove soluble contaminants from the raw date stones, they were rinsed twice with water. To remove organic and inorganic debris from the date stone surface, these washed stones were submerged in nitric acid (0.1 M) for 1 h and subsequently in methyl alcohol for 60 min. This processed date stone material was dried for 12 h at 140 °C, then crushed/powdered in a hammer mill, then sieved using BSS-25 sieves, and stored in a desiccator.
The production methods of activated carbons from date stones have been reviewed [45], and the particular activation method of the current date stone powder has been described previously [46]. The activated carbon from discarded date stones utilized in this work was produced using a modified phosphoric acid activation (PAA) technique developed by Hijab et al. (2020) [47].
The first-stage treatment was thermal treatment to produce a char product. The charred date stone powdered material was then chemically activated with 30 percent (w/w) orthophosphoric acid in a 1:1 (w/w) ratio of acid to date stone char.

2.2. Ibuprofen

Ibuprofen (IBU) obtained from Sigma-Aldrich was used in the preparation of 40 mg/L concentration stock solution in Type I ultrapure water (PW) with a resistivity value of 18.0 MΩ cm. The characteristic properties of the pharmaceuticals are shown in Table 1. The stock solution of ibuprofen, IBU, was prepared using sonication for one hour at 60 °C, and HPLC analysis was performed to measure and confirm the concentration of the ibuprofen stock solution. The concentrations of all ibuprofen solutions in this study were measured and calibrated using IBU standard solutions prepared in 100% methanol. The stock solutions were maintained and stored at 4 °C.

2.3. Derived Date Stone Adsorbents Preparation

The product was made from an acidified date stone powder that was heated to 550 °C to activate it. The raw date stone powder was first thermally treated between 350 and 600 °C in a Carbolite furnace purged with nitrogen to produce an intermediate char product. The acid/char combination was then heated in an inert muffle furnace supplied by Carbolite and purged with nitrogen at 100 cm3/min, followed by adding 30% (w/w) orthophosphoric acid in a 1:1 (w/w) ratio of acid: date stone char. The acid activation process creates a large surface area on the date stone carbon and deposits H + ions onto it. At a higher pH, the H + ions at the surface can diffuse into the solution, providing some accessible sites with a surplus negative charge to attract the positively charged basic species. Prior to pyrolysis, nitrogen gas was pumped through the apparatus for 30 min. After the activation process, the furnace was cooled to room temperature while the nitrogen flow was running. The acid-activated material was water-washed to eliminate any surplus phosphoric acid and reach a pH of 6.5–7.5 in the wash water. The washed material was now filtered and placed in an air-drying oven set to 115 °C overnight.

2.4. Microwave and Thermally Treated Date Stone Characterization

In order to investigate whether the raw date stone was suitable as a precursor material for activated carbon production, a thermo-gravimetric analysis, TGA, was carried out with a TA instrument supplied by New Castle, DE, USA. During the analysis, the temperature was increased from room temperature to 600 °C at a rate of 10 °C/min while maintaining a N2 flow rate of 100 mL/min. The analysis used approximately 20–25 mg of samples, and it was performed in triplicate to ensure that the TG–DTG curves were consistent [48]. Furthermore, the pore volume and BET surface area of the raw date stones were measured in order to compare and assess the effect of the phosphoric acid activation at 550 °C on these characteristic properties. The characterization of the phosphoric-acid-activated carbon product was performed by a Micromeritics ASAP 2020 surface area analyzer (Micromeritics, Norcross, GA, USA), and the nitrogen-based pore volume and specific surface area were obtained, and these values were compared with the raw feed date stone data. The IBU adsorption capacities were determined by measuring ibuprofen in solution concentrations by HPLC analysis as previously mentioned in Section 2.3.

2.5. Equilibrium Isotherm Studies

The experimental equilibrium isotherms were performed at 20 °C in a temperature-controlled water bath shaker by accurately weighing amounts of date-stone-derived activated carbon to solutions of the adsorbate IBU containing specific concentrations in plastic jars. The shaker’s agitation speed was set to 250 rpm, and the initial and final concentrations of IBU in solution were determined using HPLC.
All adsorption experiments were carried out at 20 °C under controlled temperature conditions by adding 5 mg date carbon to 100 mL IBU solutions of the specified concentration in plastic jars. The agitation speed of the shaker was set to 250 rpm. As previously stated, the concentrations of both the final and initial sample solutions were determined. The amount of IBU adsorbed was calculated using the material balance Equations (1) and (2). The amount of pharmaceutical removed from the initial solution concentration, C0, is equal to the amount of IBU adsorbed, that is:
Quantity of IBU adsorbed on carbon = Quantity of IBU removed from solution
m   ( q 0 q e ) = V   ( C 0 C e )
Rearranging the equation for q e :
q e = V m   ( C 0 C e )
where   q e is the quantity of IBU adsorbed on the solid carbon at equilibrium in mg/g,   q 0 is the quantity adsorbed on carbon at time zero, t = 0, and this is equal to 0, C0 and Ce represent the initial and the final (equilibrium) IBU solution concentrations (mg/L), respectively, V is the volume of IBU solution in liters, L, and m is the mass of the carbon adsorbent, g. The IBU removal effectiveness increases with increasing contact time until the equilibrium/saturation capacity on the adsorbent is reached. The quantity of adsorbed IBU on the activated carbon surface rises quickly in the early phase of the process and then decreases continually, slowing down and eventually reaching a plateau in the final stage. The duration of the IBU-activated carbon adsorption process to achieve equilibrium was monitored and found to be 12 h. However, the isotherm experiments were continued for a 24 h cycle to ensure that equilibrium was achieved. The ibuprofen concentration range under investigation varied between 1 and 20 mg/L.

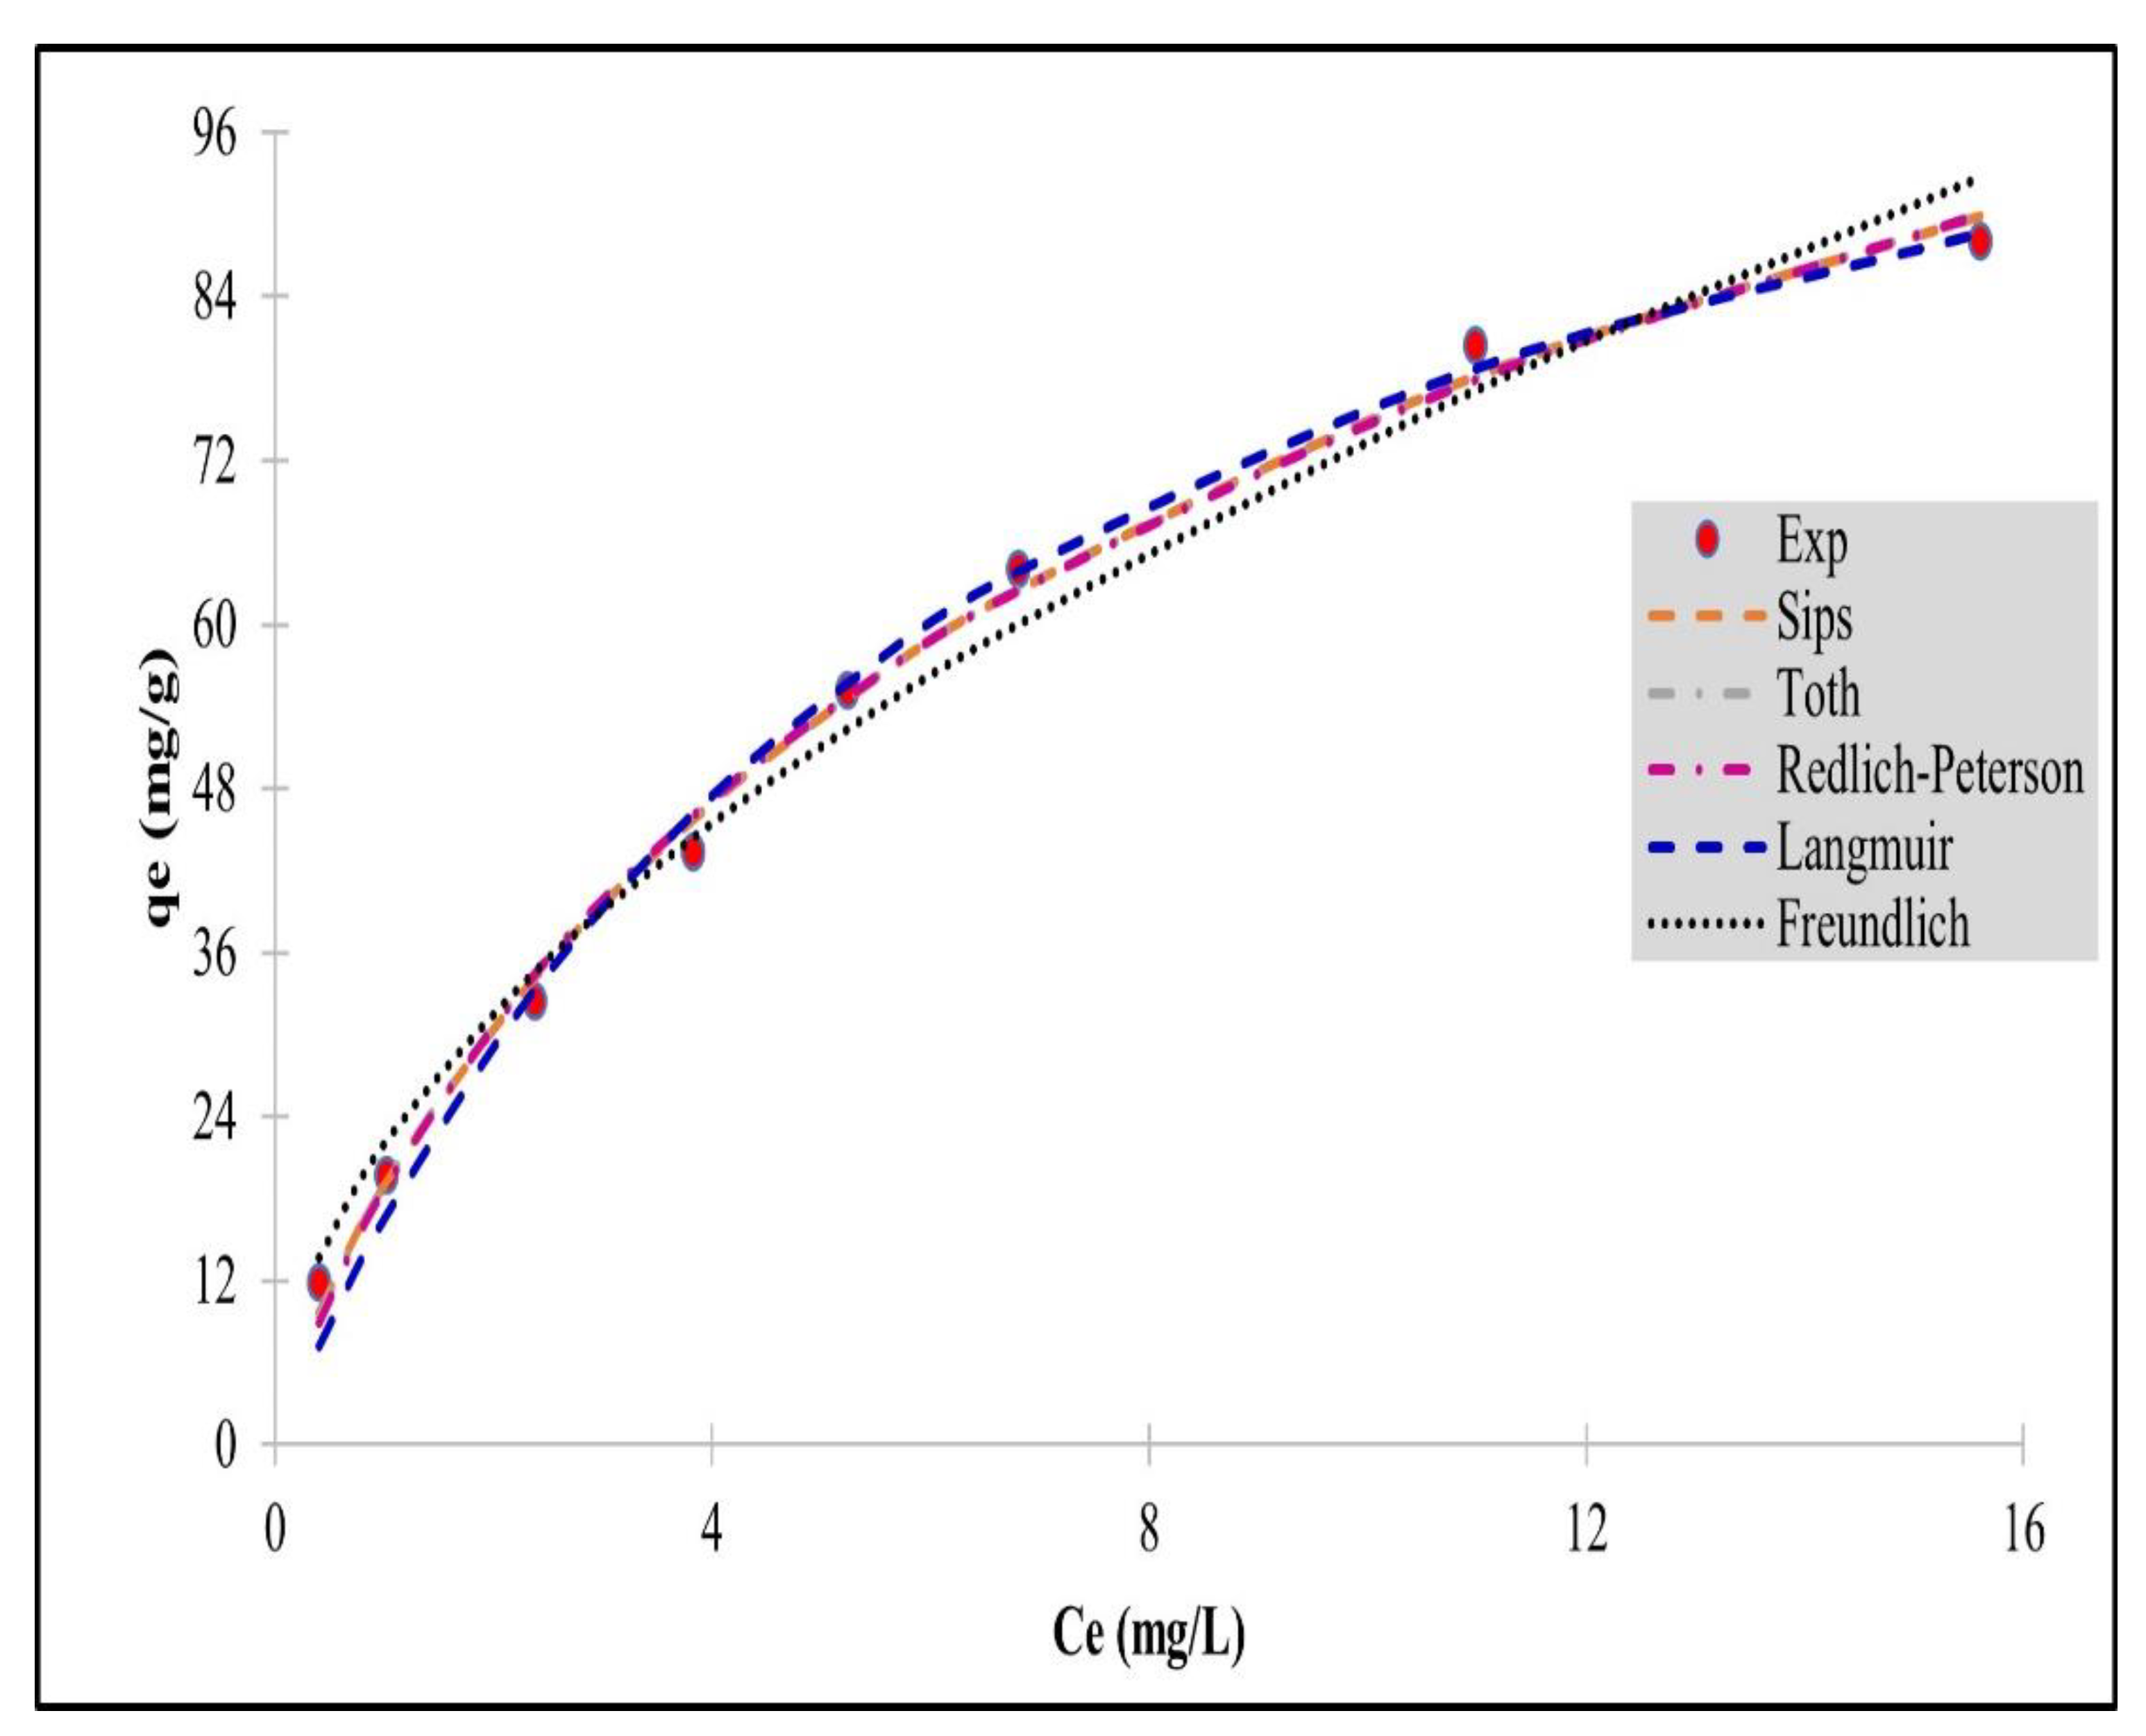
3. Equilibrium Isotherms

3.1. Isotherm Models

Equilibrium isotherm equations provide a mathematical description of the correlation between qe (mg/g), the quantity of IBU pollutant/solute removed/adsorbed onto the date-stone-activated carbon adsorbent material, and Ce (mg/L), the IBU pollutant/solute remaining in the aqueous phase at equilibrium. For treatment system design purposes, an effective adsorption correlation/model must be developed based on the actual equilibrium experimental data. It is important to test a range of isotherm correlations to determine the most appropriate, best-fitting isotherm correlation to predict the most-accurate design capacity and develop the optimization equations for both batch and column adsorption processes. In the present study, the experimental data were tested and correlated using seven of the widely accepted isotherm model equations, and the best-fit parameters were evaluated based on error analyses using the sum of the square of the errors (SSE) method to determine the best-fitting equilibrium model and the isotherm constants. The data are presented in Section 4.2 and the isotherm model equations are also presented.

3.1.1. Langmuir Isotherm Model

In the Langmuir isotherm, it is assumed that there is constant energy of adsorption, and it is independent of the surface coverage (Langmuir, 1916). In addition, any interactions between adjacent adsorbed species are assumed to be independent between adjacent adsorbed species; and finally, the maximum adsorption capacity or saturation capacity takes place due to the adsorbent surface being occupied by a monolayer of the adsorbate species. The amount of adsorbed IBU at the equilibrium point, qe, is given by Equation (4):
q e = q m b L C e 1 + b L C e
qe, mg IBU/g, is the amount of IBU adsorbed per g of date carbon at equilibrium, Ce, mg IBU/L solution, is the equilibrium concentration of the IBU-adsorbed pharmaceutical in the liquid phase. The constant qm represents the maximum quantity of IBU adsorbed in the Langmuir model, and is usually called the monolayer capacity, and b (L/mg) is the energy of the adsorption process.
To evaluate the Langmuir model constants, Equation (4) can be transposed into a linear expression and is presented in Equation (5):
C e q e = 1 q m b L + C e q m  
A plot of qe versus Ce for the linearized Langmuir equation format shows the plateau as a point defining the equilibrium monolayer capacity value at which no further adsorption will occur because of the absence of free surface sites.

3.1.2. Freundlich Isotherm Model

Freundlich developed an isotherm correlation to explain the heterogeneous nature and behavior in adsorbents [49]. The Freundlich equation has been widely applied for heterogeneous systems and has been frequently found to explain the adsorption of many organic molecules with different interactions onto heterogeneous surface sites. In the Freundlich Equation (6), the ratio of the amount of adsorbate adsorbing onto a specific mass of date carbon adsorbent to the IBU solute concentration in solution is not constant, with varying increasing adsorbate solution concentrations, which implies there is no monolayer formation. Freundlich developed this multi-site equilibrium correlation for application in heterogeneous adsorption processes and the mathematical form of this model is shown in Equation (6):
q e = K F C e 1 / n
In Equation (6), qe represents the amount of IBU adsorbing on the solid date carbon adsorbent at equilibrium (mg/g), Ce represents the IBU concentration in solution at equilibrium (mg/L), KF represents the Freundlich coefficient or constant (L/g), and 1/n represents the Freundlich isotherm exponent. The Freundlich equation is logarithmic and empirical in nature, describing the non-ideal case of adsorption. It can be applied to multilayer adsorption with a non-uniform energy distribution pattern. The amount of adsorbed material represents all-site adsorption and accounts for the range of individual bond energies.
The adsorption energy values decrease in an exponential manner until the adsorption step is finished. Consequently, the Freundlich model has proved popular for heterogeneous adsorption, where the potential forces and enthalpies of adsorption are varying along the surface of the adsorbent, and the slope of the linearized equation designates the heterogeneity level; its linear form is shown in Equation (7):
log q e = l o g K F + 1 n log C e  
For this equation, KF (L/g) and 1/n are indicators of the capacity of the adsorbent and the surface heterogeneity, respectively. The exponential term, 1/n, ranges between 0 for the more heterogeneous cases and 1 for the more homogeneous systems.

3.1.3. Redlich–Peterson Isotherm Model

Redlich and Peterson developed a three-parameter empirical isotherm equation, which comprises a numerator term with a linear dependence on Ce, as in the Langmuir model, and an exponential function in the denominator term demonstrating an exponential dependence on Ce, in the form CebR, as in the Freundlich expression (Redlich and Peterson, 1959). Thus, this model involves incorporating features of both the Freundlich and Langmuir isotherms, and therefore, the Redlich–Peterson expression in Equation (8) represents a hybrid model mechanism.
q e = K R P C e 1 + a R P C e b R
In Equation (8), qe and Ce are defined as previously. KRP is the Redlich–Peterson equilibrium constant term (L/g), a R P is an isotherm constant (L/mg), and bRP is the Redlich–Peterson exponential parameter, which values must fall in the range of 0 to 1. When bR = 1, it becomes the Langmuir equation; when bR = 0, it becomes Henry’s law.

3.1.4. Langmuir–Freundlich or SIPS Isotherm Model

This isotherm model, termed the Langmuir–Freundlich correlation, is frequently referred to as the SIPS correlation [50]. Again, this model is a combination comprising the Langmuir and Freundlich expressions to include heterogeneous system mechanisms that are not as extreme as the Freundlich process. The Langmuir–Freundlich isotherm is reduced to the Freundlich equation format at low concentrations; however, moving to higher concentrations, the model and its parameters approximate more towards the monolayer Langmuir model isotherm. The SIPS or Langmuir–Freundlich isotherm is presented in Equation (9), and substituting the equilibrium constant, KLF, Equation (10) is obtained:
q e = q s a s C e n L F   1 + a s C e n L F
q e = K L F   C e n L F 1 + a L F C e n L F
Ce and qe are defined as before; qs (L/g) and aS (L/mg) are the Langmuir–Freundlich isotherm capacity and isotherm constant, respectively, whereas KLF is an equilibrium constant and nLF is the isotherm exponent. Moreover, qsas = KLF is the Langmuir–Freundlich equilibrium constant.

3.1.5. Temkin Isotherm Model

The Temkin isotherm was developed to explain hydrogen adsorption during electrolysis in acidic solutions. Consequently, the Temkin isotherm became a preferential isotherm to describe gas-phase equilibrium but has not been applied much for liquid processes. The Temkin equation assumption is that the heat of adsorption decreases in a linear manner with adsorbate surface coverage as a result of adsorbent/adsorbate interactions [51]. The model is not suitable for the more extreme concentrations at both low and high values. It assumes that the binding energies between the adsorbate and adsorbent are evenly distributed. The Temkin isotherm can be represented by Equations (11) and (12):
q e = ( R T b ) ln ( K T e C e )
  q e = R T b T l n K T e + R T b T l n   C e  
where K T e (L/g) is the isotherm-binding constant at equilibrium, bT is the Temkin constant, R is the universal gas constant (8.314 kJ/mol K), and T is the absolute temperature at 298 K.

3.1.6. Toth Isotherm Model

A modification of the Langmuir equation was proposed by Toth (1971) [52] and comprised a linear Ce-dependent term in the numerator in the Langmuir format, with an exponential term in the denominator as per the Freundlich expression. The Toth model can be represented by Equation (13):
q e = K t C e ( a t + C e t ) 1 / t
where Kt, at, and t are Toth constants.

3.1.7. Dubinin–Radushkevic Isotherm Model

Another model, particularly useful for isotherms of a high degree of rectangularity, such as ion exchange, has been developed by Dubinin and Radushkevich [53]. The Dubinin–Radushkevich isotherm is based on the potential theory and is expressed in Equation (14) as:
q e = q s e x p ( B D R ε 2 )  
where ε can be expressed as:
ε = R T l n ( 1 + 1 C e )
Substituting Equation (15) into Equation (14) produces Equation (16):
q e = q m exp ( ( R T l n ( 1 + 1 C e ) ) 2 2 E 2 )
Taking the logarithm of Equation (16) yields Equation (17):
l n q e = l n q s B D R R 2 T 2 [ ln ( 1 + 1 C e ) ] 2
and upon substituting KDB into BDRR2T2, Equation (14) becomes Equation (18):
l n q e = l n q s K B R [ ln ( 1 + 1 C e ) ] 2
R is the universal gas constant and T is the absolute temperature; BDR is a constant depending on, ε , the mean free energy of sorption per adsorbate molecule transferred to the surface of the solid from infinity in the solution. The free energy is evaluated using Equation (15), and BDR is obtained by rearranging Equation (19):
ε = 1 2 B D R

3.2. Error Analysis

3.2.1. Sum of Squared Error Analysis Method (SSE)

The sum of the square of the errors, SSE, is one of the most popular and widely applied error functions by many researchers to evaluate the optimum or best-fitting equilibrium relationship correlation [54], and this SSE method is based on evaluating the sum of the squares for the residuals. The method incorporates both the variance and variance bias in its solution. In the present application, the SSE is based on comparing the square of the correlation between the experimental and calculated adsorbed data values and can be expressed by Equation (20):
SSE = i = 1 N ( q e , e x p q e , i s o ) i 2  
The subscripts “exp” and “iso” represent the experimental and calculated adsorbed capacity values, respectively. The results of the SSE analysis demonstrated that the SIPS, that is the Langmuir–Freundlich isotherm, describes the experimental data extremely accurately. Consequently, the Langmuir–Freundlich model is the preferred equation for application in the adsorbent minimization model presented in Section 4.3.

3.2.2. Correlation Coefficient (R2)

In addition to the SSE, the correlation coefficient (R2) of each model was analyzed using Equation (21) to better evaluate the best fit.
R 2 =   ( q e . e x p q e , i s o ¯ ) 2   ( q e . e x p q e , i s o ¯ ) 2 +   ( q e . e x p q e , i s o ¯ ) 2
The R2 values obtained for different models were very close, with the highest for Langmuir–Freundlich and Toth models; therefore, the final decision for the best fit was made based on the lowest SSE. The selection of the best fit and equilibrium isotherm studies is discussed in Section 4.2.

4. Results and Discussion

4.1. Adsorbent Characterization

A previous TGA study by Hijab et al., (2017) [48] has shown that date stones have a low moisture content, <10%, and high contents of cellulose and hemicellulose The char experimental yield values were confirmed by TGA studies, which showed a steady decrease with increasing pyrolysis temperatures, with yields finally reaching approximately 25% w/w. Consequently, raw date stones possess the considerable potential to be successfully activated, requiring only a small amount of energy for drying. A number of publications have reported the results of activating date stones with various activating agents and at various temperatures [32,33,34,35,36]. In order not to duplicate previous work and focus this study on the water treatment application, optimum literature criteria were selected to provide a high surface area at a relatively low temperature to keep energy costs low. In this study, the date pits were impregnated with a mass ratio of 2:1 of phosphoric acid to date stone char and activated at 550 °C for 2 h with a nitrogen flow of 100 mL/min. The resulting activated carbon had a yield of 30%, a BET-N2 surface area of 727 m2/g, a pore volume 0.70 cm3/g, and a mean pore diameter size = 3.89 nm. The raw date stone possessed a relatively low surface area of 86.0 m2/g and a pore volume of 0.22 cm3/g, proving the beneficial suitability of the activation method.
The BET surface area studies show a similar trend to data retrieved from the literature by Girgis and El-Hendawy (2002) [34], who obtained the highest surface area of 740 m2/g using phosphoric-acid-treated date stone impregnated with 30 vol.% of phosphoric acid followed by pyrolysis at 700 °C. A higher impregnation ratio of 2:1 and the lower temperature utilized in this study yielded a similar surface area value. The results of the TGA analysis indicated a moisture content of 8% (w/w), a residual solids content of 22% (w/w), and a soluble extractive component of 7% (w/w). The most rapid and principal mass loss occurred at 250 °C to 350 °C, which was representative of a large percentage of cellulose and hemicellulose. Furthermore, in the region of 400 °C, 70% of the mass was lost. In the range from 400 °C to 600 °C, the mass-loss rate decreased significantly due to the slow breakdown of the large lignin compounds, as seen in Table 2 (char yield at various temperatures). Consequently, date stones have demonstrated strong potential to be successfully applied in activation and pyrolysis.
The char product yields decrease as the pyrolysis temperature increases. At lower temperatures, the differences in the product yields are significantly higher. It can be observed that the extent of mass loss decreased with increasing temperature and is much lower at high temperatures because of the large lignin molecules, which are difficult to fracture.

4.2. Equilibrium Studies

Based on the SSE and correlation coefficient (R2) values in Table 3, the Langmuir–Freundlich or SIPS isotherm provides the best correlation with the experimental equilibrium data values. The type of isotherm provides information about the type and nature of the adsorption mechanism. In the case of phosphoric-acid-treated date stone chars, in this study, the SIPS or Langmuir–Freundlich is the best-fitting equilibrium isotherm followed by Toth, RedlichPeterson, and Langmuir in terms of the lowest SSE with R2 > 0.99. The DR (Dubinin–Radushkevich), Freundlich, and Tempkin isotherm equations were excluded for the remainder of the analysis due to their large SSE values. The isotherm data points in Figure 1 follow a smooth continuous curve with a steadily decreasing slope and do not form a saturated monolayer plateau typical of the Langmuir isotherm. Consequently, the isotherms that are hybrids between the Langmuir and the Freundlich isotherms, namely the SIPS or Langmuir–Freundlich, Toth, and Redlich–Peterson isotherms, provide the lowest SSEs and the best fits, which are also confirmed by the highest R2 values. The Langmuir–Freundlich model indicates the variance of this mechanism, showing some degree of heterogeneous adsorption, but the site energy levels are still similar. The constants aLF and nLF are the Langmuir–Freundlich isotherm constant and the heterogeneity index, respectively. When nLF is lower, the heterogeneity is higher, according to the obtained data in Table 3, and nLF is closer to unity, which indicates a more homogeneous adsorption process, and the model becomes closer to the Langmuir equation. The Toth and Redlich–Peterson models are also modifications of both Langmuir and Freundlich isotherms, where the Toth model equation involves the Langmuir model in the numerator with an exponent term in the denominator similar to the Freundlich model. The n exponent for the Toth model in this study was slightly higher than 0.5 and shows that the model has a slightly higher value than the Langmuir model. In the Redlich–Peterson model, the inaccuracies in the Langmuir and Freundlich models are amended where the mechanism process does not follow the ideal monolayer adsorption. When the Redlich–Peterson exponent bRP advances closer to unity, the model becomes closer to the Langmuir model. Based on the results obtained in this study, the SSE related to the Langmuir model was higher than that for the Freundlich model. This confirms that the results obtained from the models that combine Langmuir and Freundlich, such as the Langmuir–Freundlich, Toth, and Redlich–Peterson models, will have exponent values that cause the equation to be closer to Langmuir rather than Freundlich. The results show that after the phosphoric acid treatment, the capacity of IBU adsorption onto date stones increased significantly. According to the Langmuir isotherm, the maximum IBU adsorption capacity for the phosphoric-acid-activated date stone carbon is 126 mg/g; extrapolating the experimental data yields a value of 125.3 mg/g, and the best-fitting Langmuir–Freundlich isotherm also yields a capacity value of 126 mg/g (qLF = KLF/aLF). As a result, this is the maximum adsorption capacity used in subsequent discussions and design modeling.
Other studies (see Table 4) for the adsorption of IBU using various adsorbents obtained a wide range of capacities; for carbide-derived carbon [21], commercial activated carbon [23], and olive waste cake-derived activated carbon [24], the IBU adsorption capacities were 367, 160, and 14.4 mg IBU/g adsorbent, respectively. Two of the values are very high but they were performed at very acidic pH to optimize the capacity. In practice, the effluents and treated sewage waters where these emerging pollutants are prominent generally have pH values in the range of 6 to 8.5. The capacity of our phosphoric-acid-activated date stone carbon at 126 mg/g is lower but still in the same range of magnitude; however, the treatment process was performed with a pH value of 7.

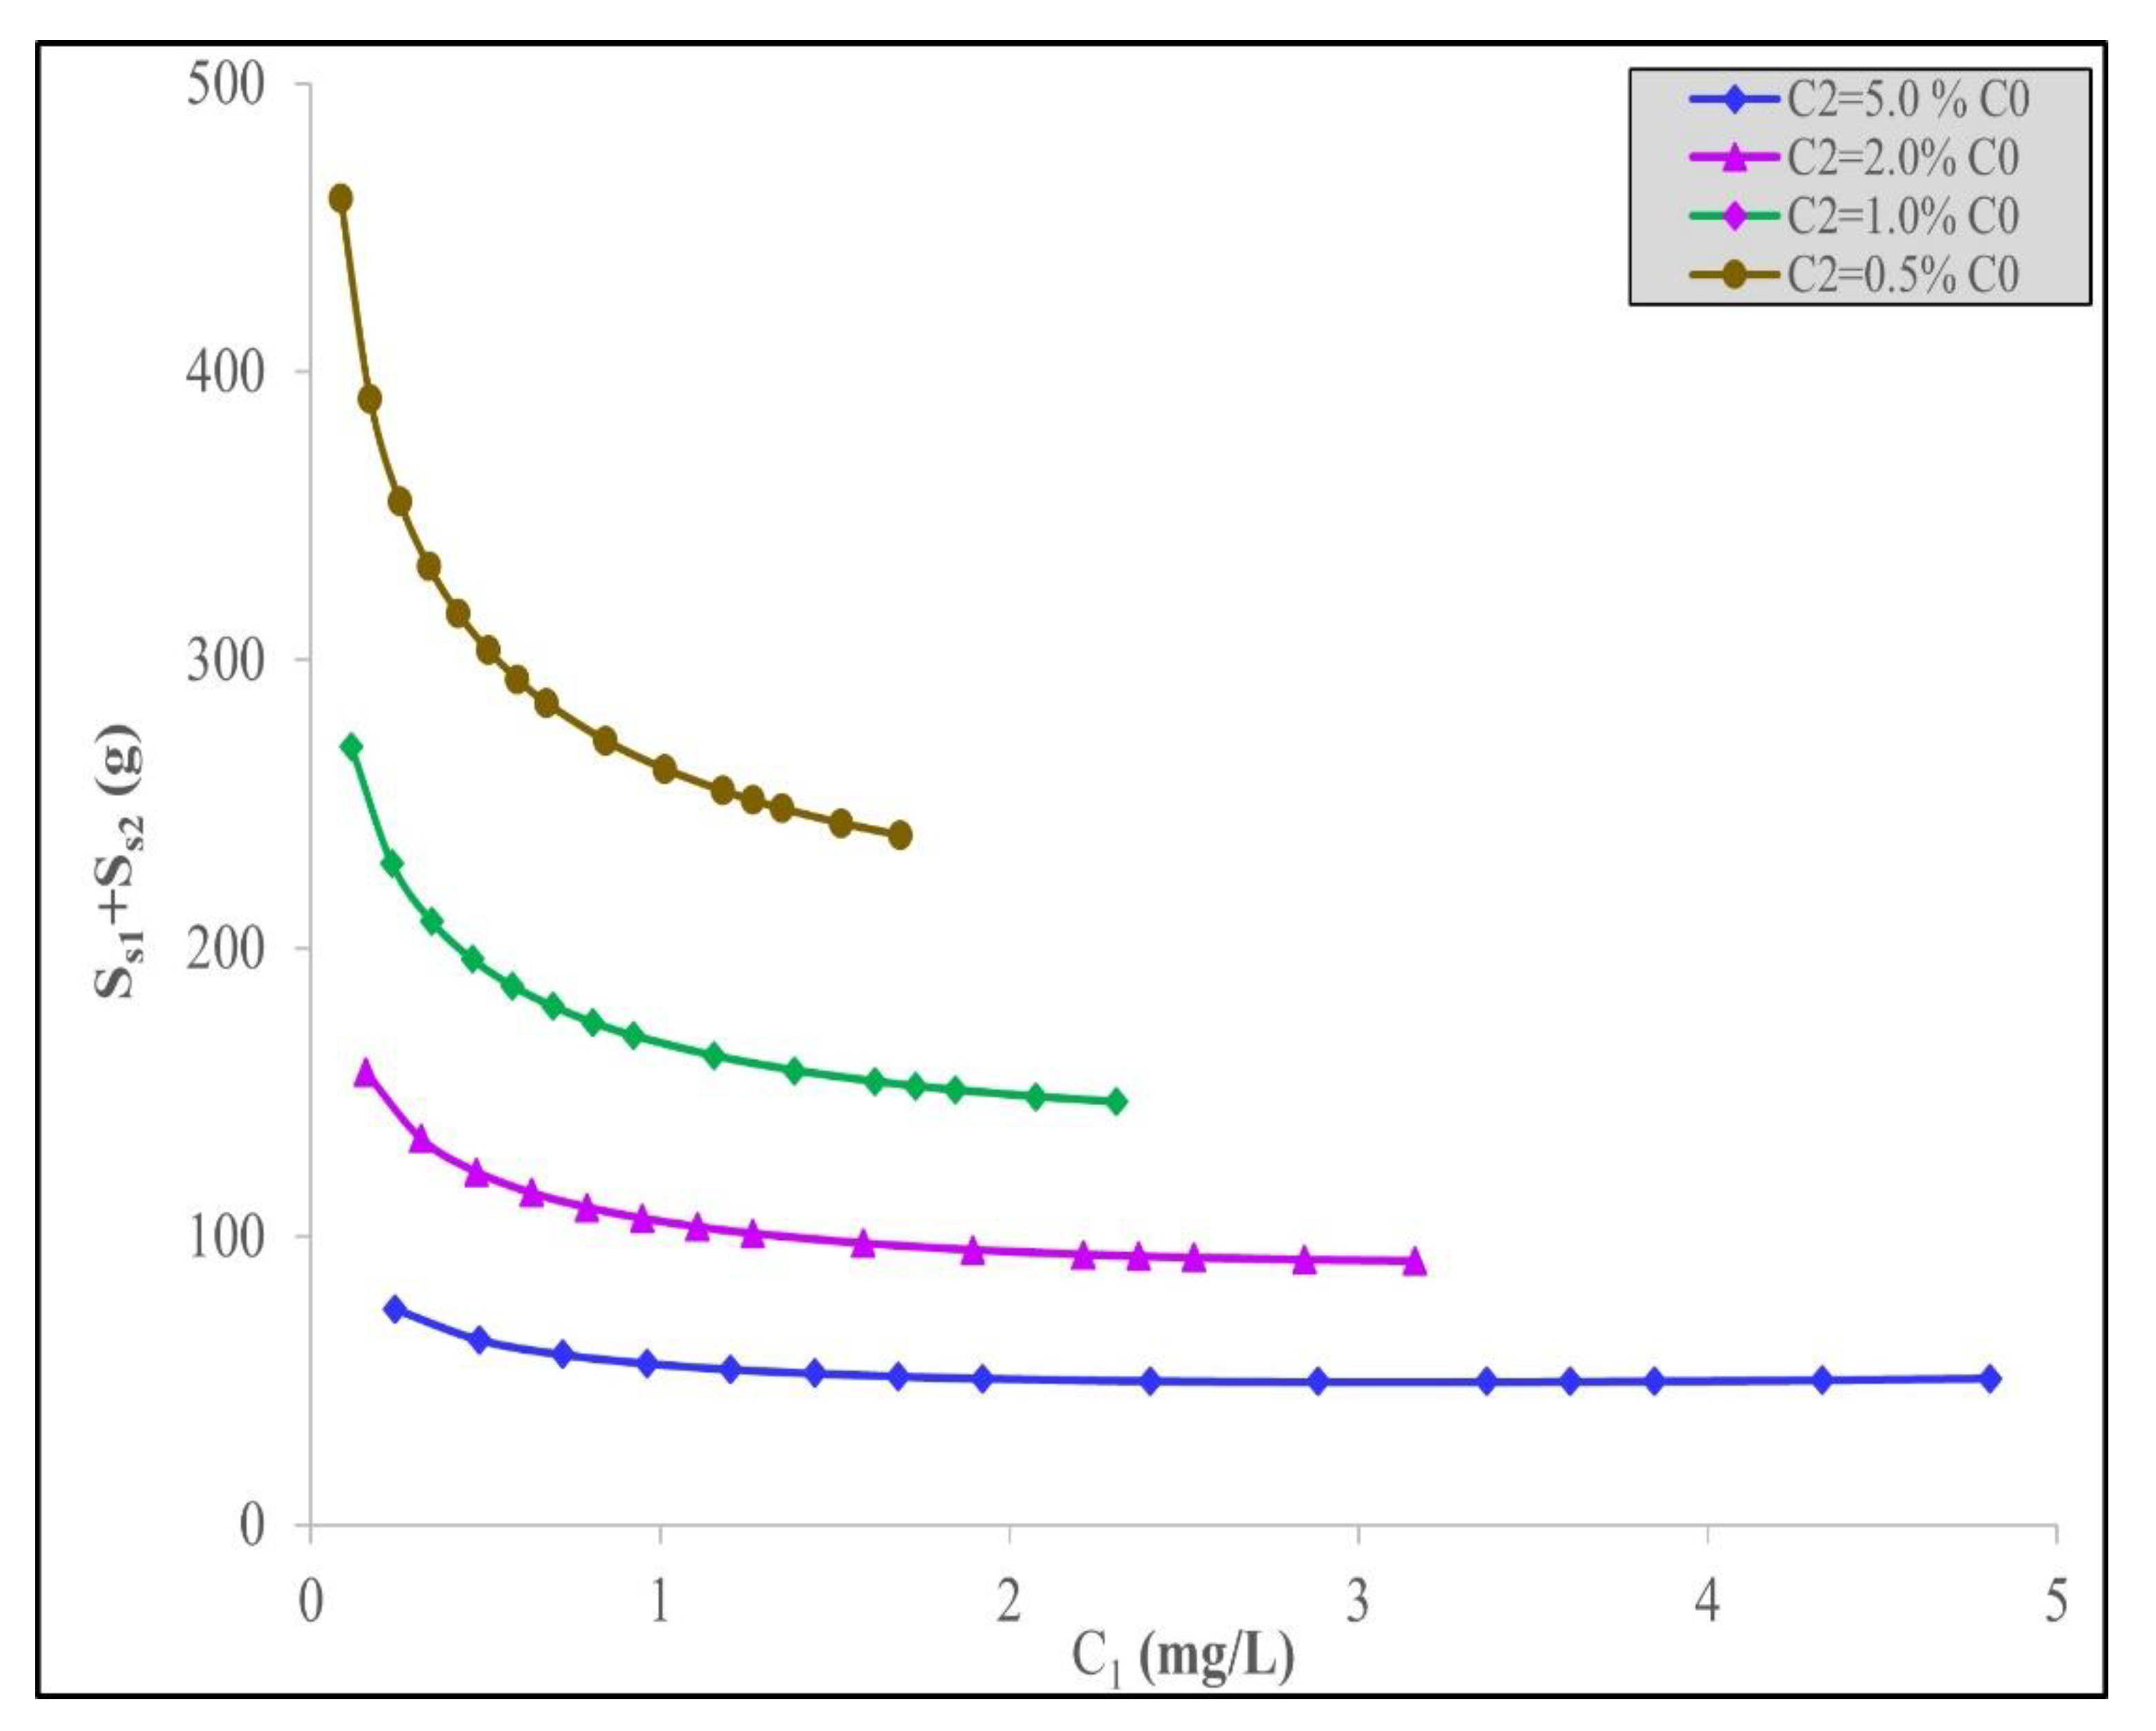
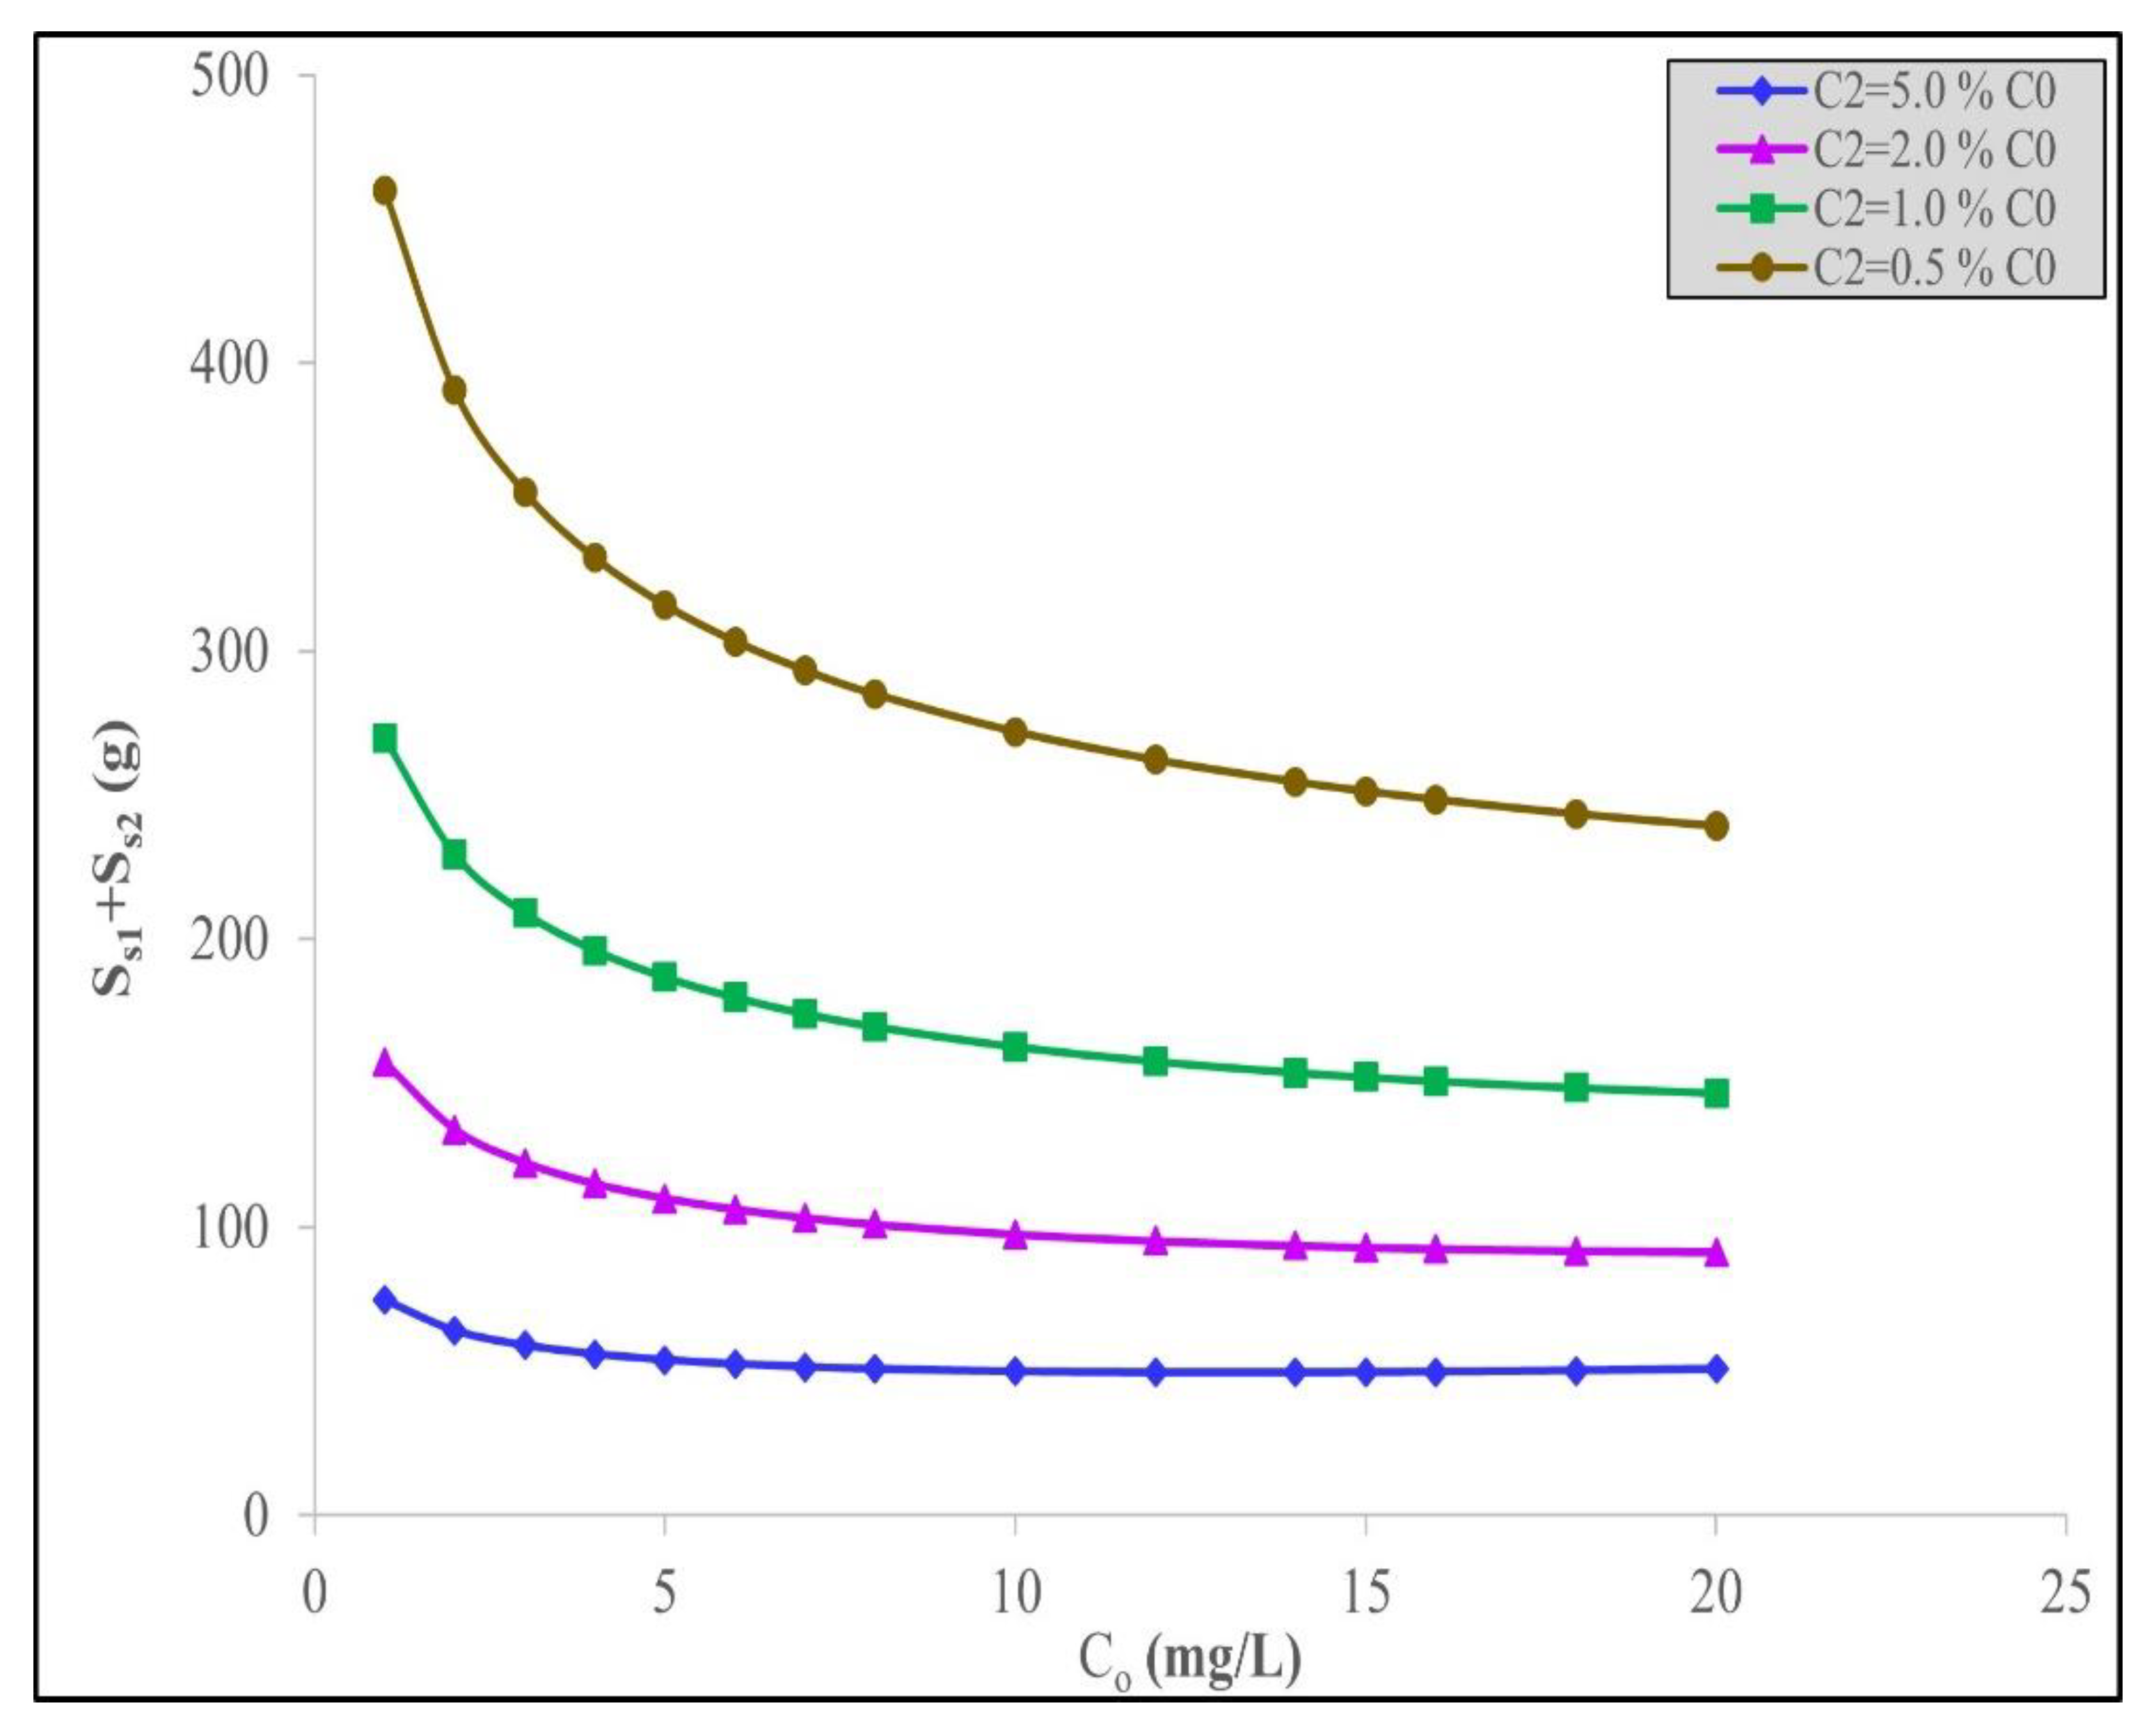
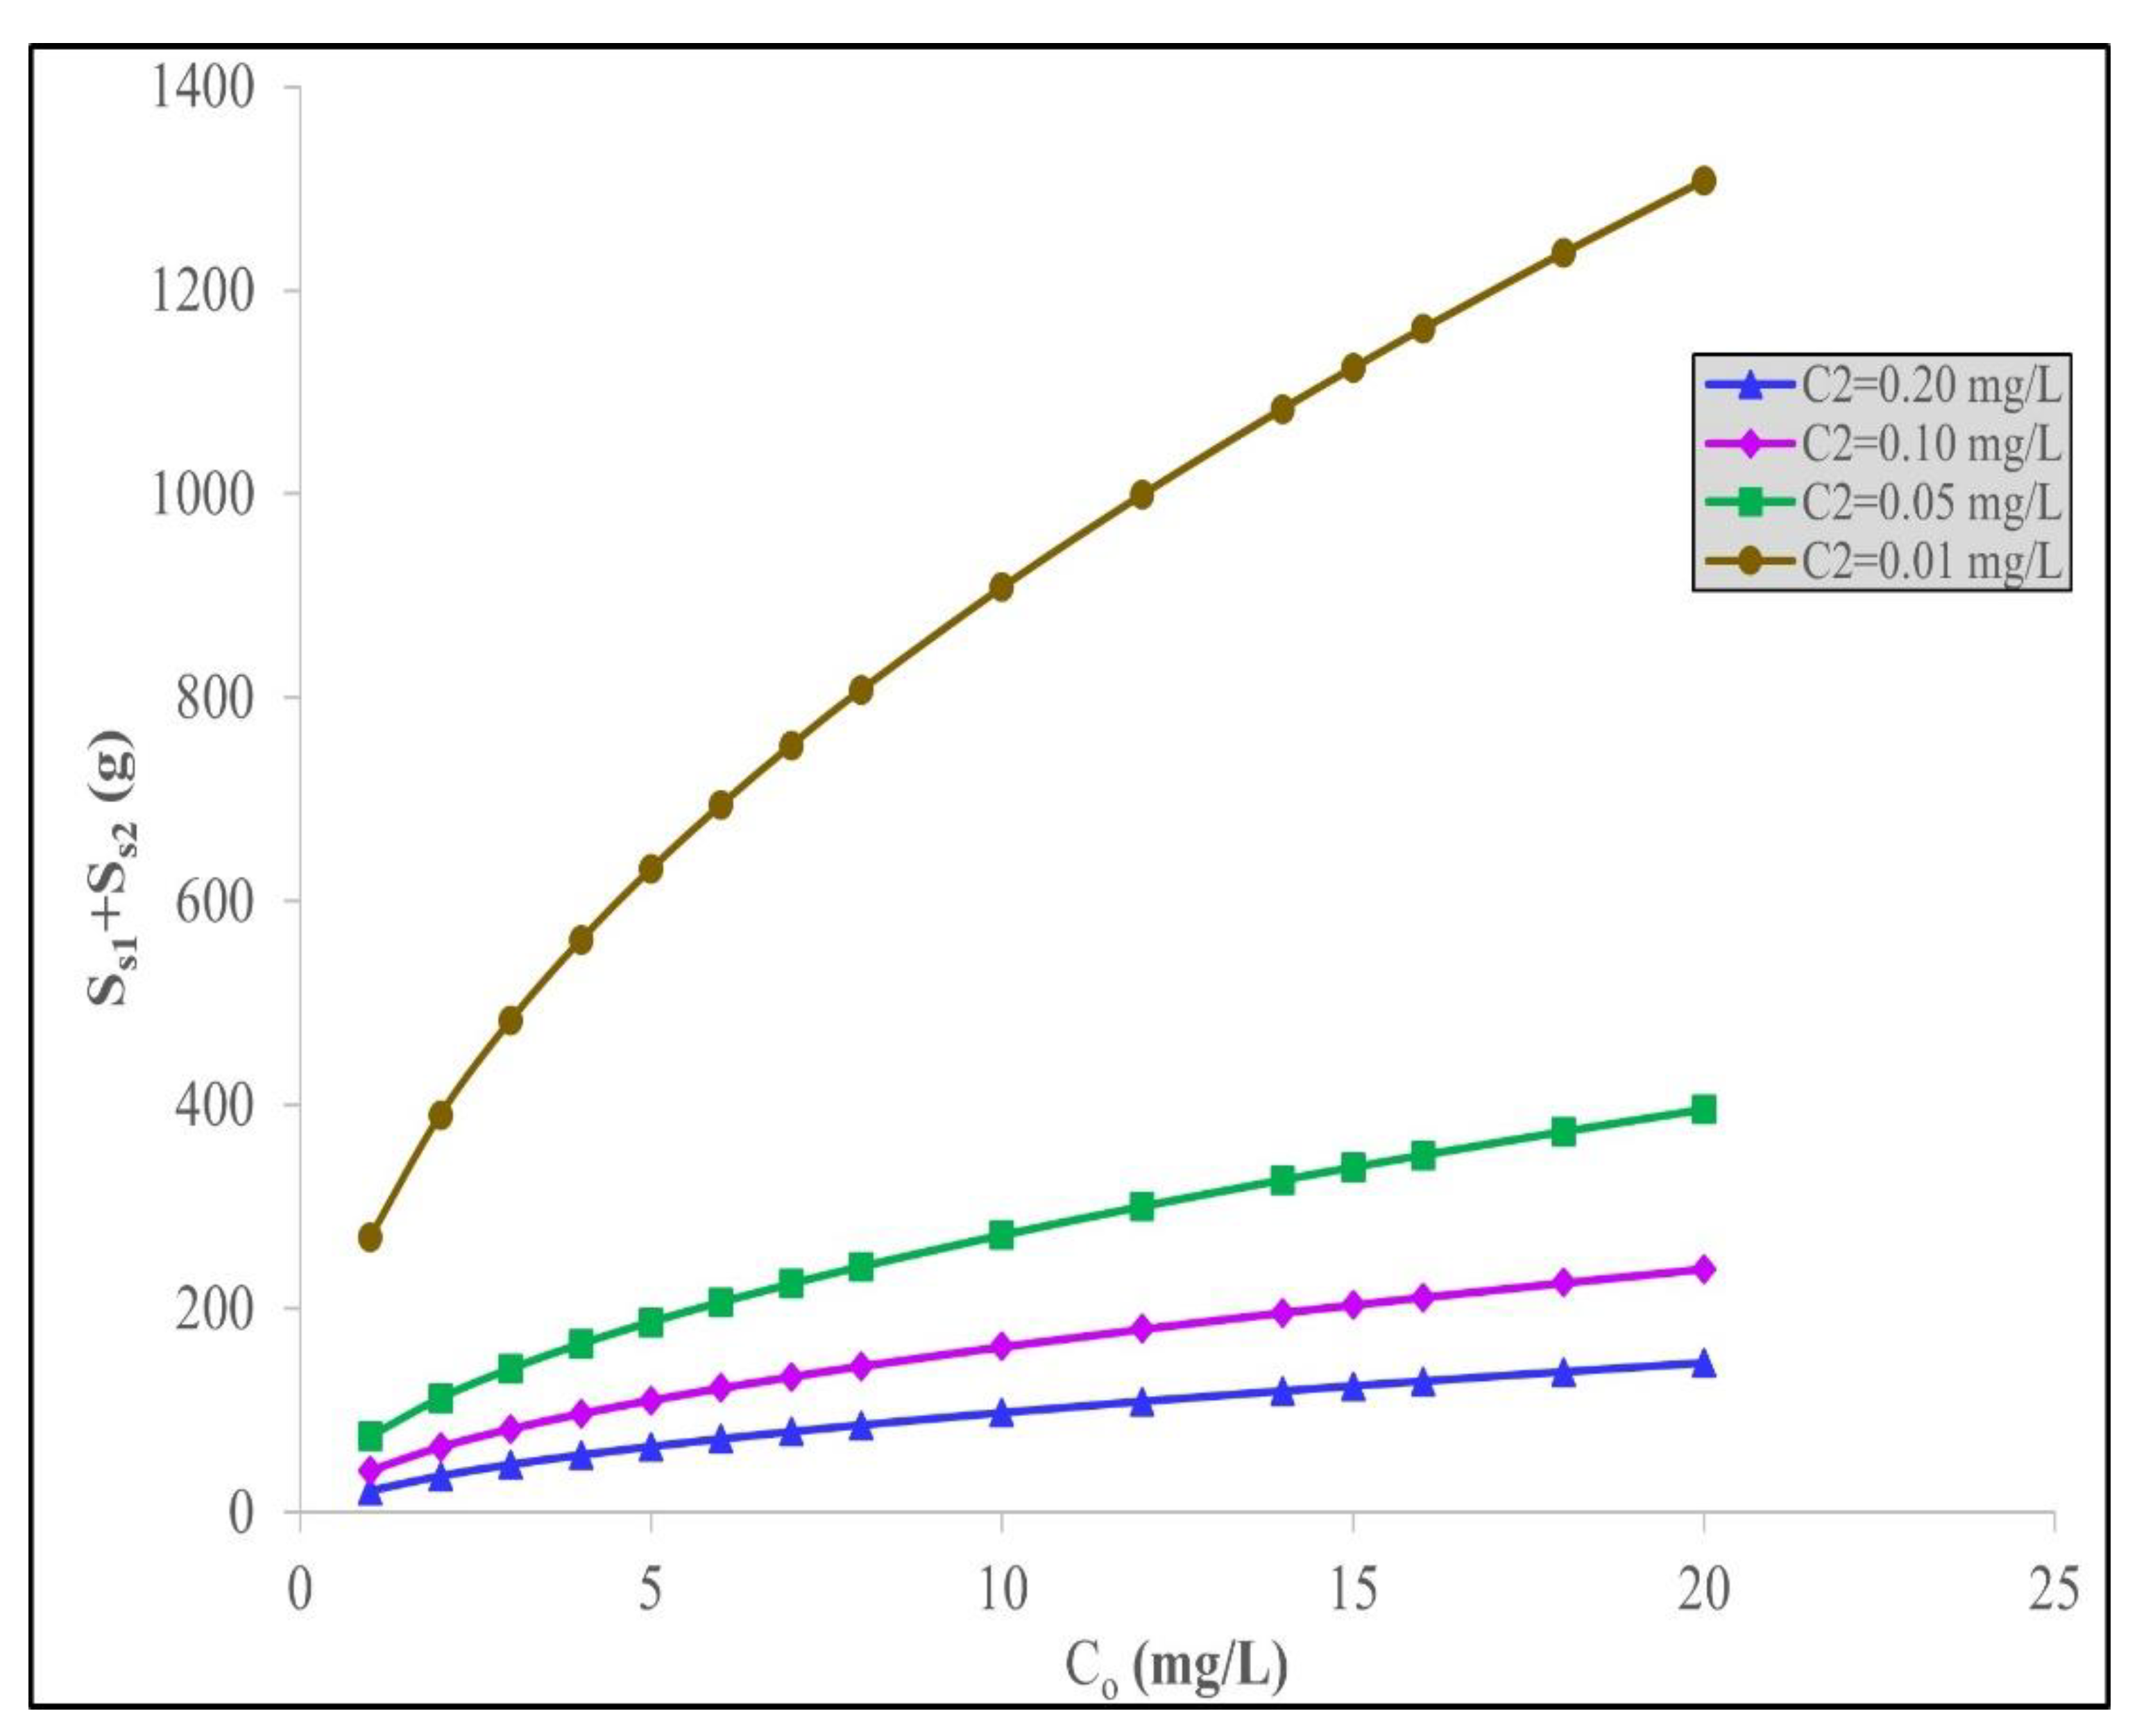
4.3. Optimization Procedure for Minimizing the Quantity of Adsorbent in a Two-Stage Batch Process

Our optimization study is based on minimizing the amount of activated date stone carbon adsorbent using a two-stage batch process represented in the schematic in Figure 2. The IBU capacities will be calculated using the best-fitting equilibrium isotherm for the phosphoric-acid-treated date stone activated carbon, and the concentration, Ce, or C2 is the IBU concentration in the treated effluent to be discharged from the two-stage process. This concentration value is typically significant because it is the maximum effluent pollutant concentration limit allowed by legislative authorities in their effluent discharge limits for process licensing to be permitted into receiving waters. It is of the utmost importance to determine the adsorbent IBU uptake capacity at this Ce/C2 value because it is this capacity that controls the quantity of adsorbent required in the operating wastewater facility. It is almost certain that this corresponding qe value will not correspond to the maximum isotherm adsorption capacity, qmax, because its value is determined by C2 and the system operating line gradient. The isotherm equation representing the adsorbate uptake mass balance provides the corresponding adsorption capacity value at C2. Consequently, it becomes of great significance to evaluate this design capacity at the plant design stage, because the mass of adsorbent will be less than the qe, max capacity and therefore the adsorber plant units’ sizes will need to be increased.
Optimization analyses and design calculations have been performed for the IBU removal treatment systems by adsorption processes for two-stage batch and single-stage batch operations. The batch adsorption stage is typically utilized for the removal of pollutants produced by industrial operations at a relatively small scale. However, the application of single-stage batch adsorption processes has difficulty meeting the required legislative effluent limit discharge value, although the single-stage batch operation is highly flexible. This is due to the stringent and steadily intensifying final low-level discharge concentrations imposed by the environmental legislation authorities, because it implies very large quantities of the adsorbent, as shown later in this study. The system modelling for the two-stage batch adsorber is now presented. The process schematic for the two-stage batch adsorber unit is presented in Figure 2.
A two-stage adsorption scheme is presented in Figure 2, showing Ss1 and Ss2 are the quantities of the adsorbent in each adsorber vessel, namely stage 1 and stage 2, respectively; hence, the total date stone carbon adsorbent required is Ss1 + Ss2. To estimate the minimum total quantity adsorbent to be applied, we obtain the final effluent discharge concentration leaving stage 2, that is C2. Then, it is required to minimize this quantity, namely Ss1 + Ss2, and this value may be obtained from d(Ss1 + Ss2)Vs/dC1, equating to zero for the maximum or minimum values. The derived solution equation then requires the interstage intermediate concentration, C1, to be obtained, and using this value, the two adsorbers requiring carbon quantities can be determined using Equations (22) and (24).
Using the most accurate isotherm correlation, namely Langmuir–Freundlich, as it is the best-fitting isotherm, the general mass balance equation for adsorber stage 1 is:
S s 1 V s = C 0 C 1 q 1 q 0
Substituting the isotherm equation for q1, and since q0 = 0, Equation (22) becomes Equation (23):
S s 1 V s = ( C 0 C 1 ) ( 1 + a L F C 1 b L F ) K L F C 1 b L F
For the stage 2 adsorber unit, represented by Equation (24):
S s 2 V s = C 1 C 2 q 2 q 0
via an analogous substitution as before, but for q2, Equation (24) becomes Equation (25):
S s 2 V s = ( C 1 C 2 ) ( 1 + a L F C 2 b L F ) K L F C 2 b L F
The total amount of adsorbent used is given by Equation (26):
S S 1 + S s 2 V s = 1 K L F ( ( C 0 C 1 ) ( 1 + a L F C 1 b L F ) C 1 b L F + ( C 1 C 2 ) ( 1 + a L F C 2 b L F ) C 2 b L F )
Then, this differential term d [ ( S s 1 + S s 2 ) / V s ] d C 1 is set equal to zero to determine the minimum total adsorbent required. Rearranging this, (26) becomes Equation (27):
0 = 1 K L F [ b L F 1 C 1 b L F b L F C 0 C 1 b L F + 1 + 1 C 2 b L F ]
Multiplying this by C 1 b L F and rearranging it produces Equation (28):
0 = ( C 1 C 2 ) b L F b L F ( C 0 C 1 1 ) 1
The intermediate concentration, C1, may be evaluated by solving Equation (28) and applying the Microsoft Excel solver function. Consequently, the optimized value for the minimum quantity of date stone activated carbon required for each unit can be obtained using Equations (23) and (25). In Section 4.4, various limitations for the extent of IBU removal have been applied such as percentage removal in terms of the absolute final concentrations of IBU in the effluent, e.g., fixing effluent limit discharge values. This allows the eventual comparison of the quantity of date stone carbon required for the single-stage process with the amount required for a two-stage adsorber in Section 4.5.2. This adsorbent quantification has been undertaken to evaluate the optimized minimum adsorbent amounts for the phosphoric-acid-treated date stone.

4.4. Model Results and Discussion

The first target was to assess the amount of phosphoric-acid-treated date stone carbon required in order to achieve the final discharge limit values in terms of percentage removals of IBU for 0.5% C0, 1% C0, 2% C0, and 5% C0. The second target was to determine the quantities of this carbon necessary to achieve certain fixed set discharge concentration limits of IBU to meet the set values of 0.5, 1, 2, and 5 mg/g. The Langmuir–Freundlich (SIPS) isotherm parameters, as the best-fitting equation data, were applied to model the process optimization and minimize the quantity of the acid-activated date stone carbon, which was used in the model to optimize the system by minimizing the total date carbon to be used. Table 5 is the summary of the optimized amounts of the acid-activated date carbon required when the final effluent concentration of IBU is 0.5% of the initial concentration, C0. The tables for the other four percentages are presented in Supplementary Information Table S1 for 5.0% C0, Table S2 for 2.0% C0, and Table S3 for 1.0% C0.
The trends in Table 5 and the Supplementary Information files, Tables S1–S3, are similar but have different individual amounts of date activated carbon adsorbent requirements. All the data values are plotted in Figure 3 to enable a comparison.
In Table 5, it can be observed that more date stone activated carbon is required for the second-stage adsorber, S2, than in the case of the first adsorber stage, S1. For example, at C0 = 1 mg/L, the removal target is 0.05% C0 and S1 = 1192 g and S2 = 3408 g. In all the cases tested, the ratio of the adsorbent used, namely S2:S1, is in the range of 2.0 to 2.5. Furthermore, for the same initial concentrations, the target% C0 removal significantly affects the total quantity of date carbon required. This requirement occurs because the final concentration, C2, required to be achieved is steadily increasing as the% C0 increases; therefore, the percentage change in the C2 discharge is also being relaxed as C2 is allowed to increase. Consequently, the percentage decrease requirement in the IBU concentration is larger in the first condition (total carbon requirement = 4600 g adsorbent for 0.5% C0 at C0 = 1 mg/L) than that in the second condition (total carbon requirement = 2700 g adsorbent for 1.0% C0 at C0 = 1 mg/L), the third stage (total carbon requirement = 1570 g adsorbent for 2.0% C0 at C0 = 1 mg/L), and finally, the fourth condition (total carbon requirement = 746 g adsorbent for 5.0% C0 at C0 = 1 mg/L) as the% C0 increases, therefore allowing an increase in C2 and, consequently, relaxing the total amount of adsorbent needed. This trend is seen in Figure 3 for the four% C0 changes at a range of C0 values. The variation in the total adsorbent quantity required as a function of the intermediate concentration, C1, between the two stages is shown in Figure 4. It is interesting to note that there is a levelling out in the total adsorbent mass required at each% C0 target discharge level at around C1 = 2 mg/L.
A further correlation of particular interest to the water treatment plant design engineer is the relationship between the total quantity of date carbon required and the initial concentration, C0, of the pollutant material. Figure 5 presents the curves for the present system of S1 + S2 against C0 for the range of final discharge levels based on% C0 for IBU removal using the waste date stone-derived activated carbon. Again, the figure shows an interesting trend by levelling out at relatively constant fixed adsorbent quantities at C0 = 10 mg/L at the individual% C0 removal values.
Table 6 summarizes the optimum amounts of the date acid activated carbon (S1 + S2) needed to achieve a final effluent concentration, C2, when C2 IBU is 0.20 mg/L for a range of initial IBU concentrations from C0 = 1.0 to 20 mg/L. The tables for the other three specified final discharge concentrations, namely C2 = 0.10, 0.050 and 0.10 mg/L concentration percentages, are presented in the Supplementary Information Table S4 for 0.5% C0, Table S5 for 0.20 mg/L, and Table S6 for 0.10 mg/L. The trends in Table 6 and the Supplementary Information files are similar to the general trends in Table 5 and its associated values but with different individual amounts of date carbon adsorbent requirements. All the data values are plotted in Figure 6 to enable a comparison due to the effect of the initial discharge concentration C0 and its influence on the mass of adsorbent required for a fixed, final treated effluent discharge concentration of 0.20 mg/L.
In Figure 6, the required total quantity of date-activated carbon increases either with an increasing initial IBU concentration or with a decreasing IBU concentration in the final solution discharge, C2. The optimization results for the total quantity of acid-treated date stone carbon for removing IBU to comply with certain set values of C2 provides an important reference point, for example, when there is a legislative or imposed effluent discharge standard for treating effluent containing IBU that must be achieved.
Inspection of Table 6 shows that more adsorbent is needed for the second-stage adsorber, S2, than for the first-stage adsorber, S1, for example at C0 = 10 mg/L the removal target is 0.20 mg/L, then S1 = 353.0 g and S2 = 622.5 g. In all the cases tested, the ratio of the adsorbent used, namely, S2:S1 is in the range of 1.4 to 2.0. Furthermore, for the same initial concentrations, the discharge concentration, C2, significantly affects the total quantity of date carbon required. This requirement occurs because the final discharge concentration, C2, is decreasing from 0.20 to 0.01 mg/L and the total amount of adsorbent required is steadily increasing as C2 is decreasing. Consequently, the change/decrease taking place in the IBU concentration (C0C2) at a set C0 value is lowest for the highest C2 (total carbon requirement = 975.5 g adsorbent for C2 = 0.20 mg/L at C0 = 10 mg/L) followed by the second highest initial concentration (total carbon requirement = 1626.2 g adsorbent for C2 = 0.10 mg/L at C0 = 10 mg/L), the third-highest value of C2 = 0.05 mg/L (total carbon requirement = 2720.0 g adsorbent for C2 = 0.05 mg/L at C0 = 10 mg/L), and finally, the fourth and lowest discharge condition of C2 = 0.01 mg/L requiring the highest mass (total carbon requirement = 9082.1 g adsorbent for C2 = 0.05 mg/L at C0 = 10 mg/L). Therefore, as the C2 design value decreases, an increase in the total adsorbent mass, S1 + S2, is required. The trend is seen in Figure 5 for the four C2 changes at a range of C0 values.
The variation in the total adsorbent quantity required as a function of the interstage concentration, C1, between the two stages is shown in Figure 7 for the four different set effluent IBU discharge values for the final IBU concentrations in the effluent, C2. It is interesting to observe that there is an almost linear trend in the total adsorbent mass required at each C2 discharge level value. The minimum total quantity of acid-treated date stone, S1 + S2, to remove IBU against the interstage IBU concentration, C1, using the Langmuir–Freundlich model for the four different fixed IBU discharge concentration values permitted in the final effluent, C2, is shown in Figure 7.
Two data tables, Table 5 and Table 6, are shown and presented in this manuscript, and the remaining tables are presented in the Supplementary Information (Tables S7 and S8); however, all the consolidated results are depicted in Figure 3, Figure 4, Figure 5, Figure 6 and Figure 7.
Figure 7 shows the interstage concentrations, C1, for acid-treated date stone carbon to remove IBU using the Langmuir–Freundlich model for different initial IBU concentrations, C0, for different fixed, final IBU concentrations, C2.

4.5. Some Economic Implications

To a large extent, the benefits or disadvantages of the system described are largely based on the balance between the costs associated with the adsorbent savings versus the additional CAPEX and OPEX costs of installing the two-stage adsorption reactors with a corresponding reduction in the adsorption time.

4.5.1. Plant Equipment Costs

In the case of the multistage adsorption system, smaller adsorber vessel reactors would be involved, e.g., these vessel units would contain the activated adsorbent and incorporate an interstage filter unit in order to separate the spent adsorbent material. Hence, from a practical viewpoint, the multistage plant is better at enhancing the process efficiency by minimizing the total amount of adsorbent to be applied and reducing the overall bath processing time. Therefore, this makes the multistage process potentially attractive in economic terms. The larger the number of stages, the greater the savings in adsorbent costs will be, but the total capital equipment costs—for multiple units—will increase, and the handling costs will also be increased. Due to these competing influencing factors, the number of batch stages is usually limited to two or three in order to optimize the economic benefits. For this reason, it is usually required to evaluate the minimum quantity of adsorbent and the associated savings in a two-stage process.

4.5.2. Adsorbent Savings

On the basis of the adsorbent quantities and the data listed in Table 5 and Table 6, the quantity of the date-stone-based carbon that can be conserved by the application of the two-stage adsorber batch reactor versus a single-stage batch adsorber is shown. Regarding the total adsorbent quantity applied for the two-stage optimization adsorber based on 99.5% IBU removal and initial IBU concentrations of 1.0, 2.0, 5.0, 10.0, and 20.0 mg/L, the amount of activated carbon falls in the range of 4.60 to 2.39 kg of adsorbent as shown in Table 7 for the treatment of 1000 L, 1 m3, of solution. For a single-stage adsorption unit, the quantity of the treated date stone carbon required is in the range of 43.3 to 21.2 kg as shown in Table 7 using Equations (6) and (22):
S s V s = C 0 C 2 q 2 q 0
The extra quantity of adsorbent necessary to perform the single-stage treatment ranges from 9.4 to 8.8 times more than the optimized two-stage batch adsorber amount, which is rather substantial.
Table 8 presents the total quantity of date-stone-derived activated carbon applied for the two-stage batch optimized system to produce a fixed, treated effluent limit concentration value of 0.20 mg/L IBU removal for initial IBU concentrations of 1.0, 2.0, 5.0, 10.0, and 20.0 mg/L—the quantities of the derived activated carbon adsorbent are 0.206, 0.353, 0.643, 0.976, and 1.47 kg for 1000 L of solution.
For the single-stage batch system equivalency, the quantity of date stone carbon is 9.04, 4.47, 2.19, 0.822, and 0.365 kg using Equations (6) and (21). The additional quantity of the activated carbon adsorbent necessary for the single-stage batch adsorption system ranges from 6.1 times to 1.8 times higher, demonstrating the advantages of a two-stage process over a single-stage process in terms of adsorbent utilization.
In Table 8, the effect of a lower effluent discharge concentration has a major impact on the additional amount of adsorbent required in the case of the single stage-batch adsorption process; that is, at a discharge limit concentration of 0.005 mg/L, 43.3 kg of adsorbent is required, which is 9.4 times the quantity required for the optimized two-stage system. In Table 8, the influence of the initial concentration is demonstrated and shows that the higher the initial IBU concentration is, the greater the extra amount of carbon is: 6.1 times more at C0 = 20 mg/L and Ce = 0.20 mg/L and only 1.8 times the amount of additional carbon at C0 = 1.0 mg/L and Ce = 0.20 mg/L.

4.6. Activated Carbon Production Cost

The production cost of date-stone-activated carbon was estimated and analyzed referring to previous investigations [55,56]. For this purpose, the cost of the utilities required for the production of activated carbon was estimated according to recent available data. The calculations were made per one kg of AC as illustrated in Table 9. The raw date stones are considered to be free of charge, but the transportation cost is added at 0.025 $/kg [57]. Th cost of the phosphoric acid used for the activation is assumed to be 0.74 $/kg based on the latest data [58]. Water costs were assumed to be 1.48 $/m3, which is required for washing the produced activated carbon, assuming a water usage value of 40 L/kg with the energy cost assumed to be 0.1 $/kWh [55,56]. The energy requirement was estimated referring to a study by Liao et al. (2020) [59]. For maintenance and other operation costs, a value of 20% of the total costs of energy, water, phosphoric acid, and transportation is added. According to these assumptions, the cost for the production of 1 kg of activated carbon from date stones is estimated to be $4.457 per kg as seen in Table 9. The cost obtained in this study is relatively higher than the reported values in the literature as a result of the increased phosphoric acid cost in recent years. For instance, Ng et al. (2003) reported a cost of $2.89 per kg of phosphoric-acid-activated pecan shell carbons [55], while Nowrouzi et al. (2017) estimated a cost of $1.68 per kg of Persian ironwood biomass carbon activated by phosphoric acid [60]. Recently, a study by Lai and Ngu (2020) [56] on the production of activated carbon from oil palm waste by acid activation reported a higher cost of $3.22 per kg. Although the cost of date-stone-activated carbon in this study is higher than other acid-activated carbons from waste materials, according to the optimization procedure in this study in Section 4.3, the quantity of adsorbent can be minimized in a two-stage batch process with significant cost reductions.

4.7. Regeneration

Regeneration tests have not been performed due to the issue of available time, but conventional regeneration technologies could be applicable for several pharmaceuticals that are often recalcitrant in nature. Although studies were not conducted due to time constraints, standard regeneration methods could be considered for this type of recalcitrant compound. IBU does not have any nitrogen or halogen groups, therefore regeneration by combustion burning of the pharmaceutical directly is feasible. However, combustion has inherent disadvantages associated with it, including energy/fuel requirements, greenhouse gas emissions since carbon dioxide is produced, thus contributing to global warming, typically there is a loss of carbon from carbon-based adsorbents of the order of 10–12%, and the destruction/loss of the adsorbed IBU. Steam or hot gas stripping has gained popularity, enabling volatile organic solvents to be recovered and recycled, but the high boiling and melting points of pharmaceutical IBU would render this technique almost impossible. Treatment using microbial slurry to biodegrade IBU is a possible alternative approach, but IBU is reasonably microbiologically stable against most micro-organisms; in addition, this methodology requires a rather lengthy period to implement and complete. Solvent extraction seems to be a reasonable approach by using volatile alcohol with a high solubility for IBU. Then, by making use of one of the on-site batches adsorber units for dissolving the IBU, followed by pumping the IBU solution to a vacuum-driven evaporation system or vacuum-driven stripping column, the solvent can be recovered for recycling, as can IBU. Several toxic-loaded adsorbents are frequently disposed of in hazardous landfill sites after stabilization by encapsulation or vitrification, although this procedure is expensive and there is no recovery of the adsorbent and IBU. Longer-term detrimental effects of hazardous landfilling include the production of landfill leachate, creating environmental problems in situ and site anaerobic degradation to produce methane biogas emissions. Consequently, the application of a volatile solvent-extraction stage incorporating solvent recovery, adsorbent regeneration, and re-use with potential IBU recovery offers the most attractive technology opportunity for further investigation.

5. Conclusions

Phosphoric acid has been used to treat waste date-stone-derived char and heated to 550 °C to produce activated carbon. The BET-N2 surface area of this date-stone-derived activated carbon is 727 m2/g and has a pore volume of 0.70 cm3/g and a pore diameter size = 3.89 nm. The adsorption capacity of the activated carbon was tested for the adsorption of the ibuprofen, and the maximum adsorption capacity of the carbon product was 126 mg/g, which compared favorably with the very few IBU capacities reported in the literature. Experimental equilibrium data have been modelled applying seven isotherm equations, namely Langmuir, Freundlich, Langmuir–Freundlich, Redlich–Peterson, Temkin, Dubinin–Radushkevic, and Toth isotherm models. Based on an SSE error analysis, the Langmuir–Freundlich isotherm provided the best-fitting correlation that was optimized. This correlation was then used to reduce the amount of date carbon adsorbent required when designing a two-stage batch adsorber system for IBU removal. The amount of activated carbon derived from date stones was calculated for a two-stage batch adsorber and an equivalent single-stage process. The quantity of activated carbon adsorbent required was greatly reduced in the two-stage system, sometimes by a factor of more than 9-fold. This optimization study also demonstrated the amount of adsorbent strongly depends on both the IBU concentration and especially the effluent discharge limit value adopted or imposed. The results demonstrate the potential at an industrial scale for designing and performing economic and technical feasibility studies on two-stage and multi-stage batch adsorption process units for the treatment of emerging pollutants.
In terms of regeneration, the current trend for large organic compounds with high molecular weights is using thermal treatment, converting the compounds to carbon dioxide and water and typically losing 10% of the original activated carbon in the combustion process. However, due to its impact on global warming, as a result of the CO2 emissions, more research on the regeneration of these compounds is necessary. For future work, we recommend that solvent extraction using volatile solvents such as methanol should be studied, whereby the methanol can be evaporated at a low temperature and the ibuprofen could possibly be recovered for recycling/re-use.

Supplementary Materials

The following supporting information can be downloaded at: https://www.mdpi.com/article/10.3390/pr10030453/s1.

Author Contributions

H.F.—investigation, validation, writing—original draft. J.S.—conceptualization, project administration, methodology, writing—review and editing. G.M.—funding acquisition, conceptualization, resources, project administration, supervision, methodology, data curation, visualization, writing—review and editing. P.P.—formal analysis. All authors have read and agreed to the published version of the manuscript.

Funding

The authors would like to thank the Qatar National Research Fund for their support of this research through the award NPRP-11S-0117-180328, the Supreme Committee for Delivery and Legacy (SCDL), and Hamad Bin Khalifa University, Qatar Foundation, for an award to H.F. Any opinions, findings and conclusions, or recommendations expressed in this material are those of the author(s) and do not necessarily reflect the views of HBKU, QF, or SCDL.

Institutional Review Board Statement

Not applicable.

Informed Consent Statement

Not applicable.

Data Availability Statement

All data generated or analyzed during this study are included in this published article and its supplementary information files.

Acknowledgments

The authors wish to thank Hamad Bin Khalifa University (HBKU), Qatar Environment & Energy Research Institute (QEERI), and the Qatar Foundation (QF) for their patronage.

Conflicts of Interest

The authors declare that they have no competing interest in this section.

References

  1. Camacho-Muñoz, D.; Martín, J.; Santos, J.L.; Aparicio, I.; Alonso, E. Effectiveness of Conventional and Low-Cost Wastewater Treatments in the Removal of Pharmaceutically Active Compounds. Water Air Soil Pollut. 2011, 223, 2611–2621. [Google Scholar] [CrossRef]
  2. Izário Filho, H.J.; Aguiar, L.G.; Siqueira, A.F.; Alcântara, M.A.K.; Da Rós, P.C.M.; Rocha, R.S.; Napoleão, D.A.S.; Brandão, J.J. Degradation of Organic Carbon in Pharmaceutical Wastewater: A Kinetic Approach. Water Air Soil Pollut. 2021, 232, 85. [Google Scholar] [CrossRef]
  3. Paredes-Quevedo, L.C.; González-Caicedo, C.; Torres-Luna, J.A.; Carriazo, J.G. Removal of a Textile Azo-Dye (Basic Red 46) in Water by Efficient Adsorption on a Natural Clay. Water Air Soil Pollut. 2021, 232, 4. [Google Scholar] [CrossRef]
  4. Nassiri Koopaei, N.; Abdollahi, M. Health risks associated with the pharmaceuticals in wastewater. DARU J. Pharm. Sci. 2017, 25. [Google Scholar] [CrossRef] [PubMed] [Green Version]
  5. Unugul, T.; Nigiz, F.U. Preparation and Characterization an Active Carbon Adsorbent from Waste Mandarin Peel and Determination of Adsorption Behavior on Removal of Synthetic Dye Solutions. Water Air Soil Pollut. 2020, 231, 538. [Google Scholar] [CrossRef]
  6. Mestre, A.S.; Pires, J.; Nogueira, J.M.F.; Parra, J.B.; Carvalho, A.P.; Ania, C.O. Waste-derived activated carbons for removal of ibuprofen from solution: Role of surface chemistry and pore structure. Bioresour. Technol. 2009, 100, 1720–1726. [Google Scholar] [CrossRef] [PubMed] [Green Version]
  7. Rodriguez-Mozaz, S.; Chamorro, S.; Marti, E.; Huerta, B.; Gros, M.; Sànchez-Melsió, A.; Borrego, C.M.; Barceló, D.; Balcázar, J.L. Occurrence of antibiotics and antibiotic resistance genes in hospital and urban wastewaters and their impact on the receiving river. Water Res. 2015, 69, 234–242. [Google Scholar] [CrossRef]
  8. Ponnusamy, G.; Francis, L.; Loganathan, K.; Ogunbiyi, O.O.; Jasim, S.; Saththasivam, J. Removal of cyanotoxins in drinking water using ozone and ozone-hydrogen peroxide (peroxone). J. Water Supply Res. Technol. 2019, 68, 655–665. [Google Scholar] [CrossRef]
  9. Farzaneh, H.; Loganathan, K.; Saththasivam, J.; McKay, G. Selectivity and competition in the chemical oxidation processes for a binary pharmaceutical system in treated sewage effluent. Sci. Total Environ. 2021, 765, 142704. [Google Scholar] [CrossRef]
  10. Kudlek, E. Decomposition of Contaminants of Emerging Concern in Advanced Oxidation Processes. Water 2018, 10, 955. [Google Scholar] [CrossRef] [Green Version]
  11. Shon, H.K.; Vigneswaran, S.; Snyder, S.A. Effluent Organic Matter (EfOM) in Wastewater: Constituents, Effects, and Treatment. Crit. Rev. Environ. Sci. Technol. 2006, 36, 327–374. [Google Scholar] [CrossRef]
  12. Mateus, G.A.P.; Formentini-Schmitt, D.M.; Nishi, L.; Fagundes-Klen, M.R.; Gomes, R.G.; Bergamasco, R. Coagulation/Flocculation with Moringa oleifera and Membrane Filtration for Dairy Wastewater Treatment. Water Air Soil Pollut. 2017, 228, 1–13. [Google Scholar] [CrossRef]
  13. Golovko, O.; de Brito Anton, L.; Cascone, C.; Ahrens, L.; Lavonen, E.; Köhler, S.J. Sorption Characteristics and Removal Efficiency of Organic Micropollutants in Drinking Water Using Granular Activated Carbon (GAC) in Pilot-Scale and Full-Scale Tests. Water 2020, 12, 2053. [Google Scholar] [CrossRef]
  14. Mukhlish, M.Z.B.; Khan, M.R.; Bhoumick, M.C.; Paul, S. Papaya (Carica papaya L.) Leaf Powder: Novel Adsorbent for Removal of Methylene Blue from Aqueous Solution. Water Air Soil Pollut. 2012, 223, 4949–4958. [Google Scholar] [CrossRef] [Green Version]
  15. Wang, H.; Luo, P. Preparation, Kinetics, and Adsorption Mechanism Study of Microcrystalline Cellulose-Modified Bone Char as an Efficient Pb (II) Adsorbent. Water Air Soil Pollut. 2020, 231, 1–15. [Google Scholar] [CrossRef]
  16. FAO Fruit and Vegetables—Your Dietary Essentials. The International Year of Fruits and Vegetables. 2021. Available online: https://doi.org/10.4060/cb2395en (accessed on 21 November 2021).
  17. Alharbi, K.L.; Raman, J.; Shin, H.J. Date Fruit and Seed in Nutricosmetics. Cosmetics 2021, 8, 59. [Google Scholar] [CrossRef]
  18. Ashfaq, M.; Nawaz Khan, K.; Saif Ur Rehman, M.; Mustafa, G.; Faizan Nazar, M.; Sun, Q.; Iqbal, J.; Mulla, S.I.; Yu, C.P. Ecological risk assessment of pharmaceuticals in the receiving environment of pharmaceutical wastewater in Pakistan. Ecotoxicol. Environ. Saf. 2017, 136, 31–39. [Google Scholar] [CrossRef]
  19. Guerra, P.; Kim, M.; Shah, A.; Alaee, M.; Smyth, S.A. Occurrence and fate of antibiotic, analgesic/anti-inflammatory, and antifungal compounds in five wastewater treatment processes. Sci. Total Environ. 2014, 473–474, 235–243. [Google Scholar] [CrossRef]
  20. Luo, Y.; Guo, W.; Ngo, H.H.; Nghiem, L.D.; Hai, F.I.; Zhang, J.; Liang, S.; Wang, X.C. A review on the occurrence of micropollutants in the aquatic environment and their fate and removal during wastewater treatment. Sci. Total Environ. 2014, 473–474, 619–641. [Google Scholar] [CrossRef]
  21. Almanassra, I.W.; Kochkodan, V.; Ponnusamy, G.; Mckay, G.; Ali Atieh, M.; Al-Ansari, T. Carbide Derived Carbon (CDC) as novel adsorbent for ibuprofen removal from synthetic water and treated sewage effluent. J. Environ. Health Sci. Eng. 2020, 18, 1375–1390. [Google Scholar] [CrossRef]
  22. Guedidi, H.; Reinert, L.; Lévêque, J.M.; Soneda, Y.; Bellakhal, N.; Duclaux, L. The effects of the surface oxidation of activated carbon, the solution pH and the temperature on adsorption of ibuprofen. Carbon N. Y. 2013, 54, 432–443. [Google Scholar] [CrossRef]
  23. Guedidi, H.; Reinert, L.; Soneda, Y.; Bellakhal, N.; Duclaux, L. Adsorption of ibuprofen from aqueous solution on chemically surface-modified activated carbon cloths. Arab. J. Chem. 2017, 10, S3584–S3594. [Google Scholar] [CrossRef] [Green Version]
  24. Baccar, R.; Sarrà, M.; Bouzid, J.; Feki, M.; Blánquez, P. Removal of pharmaceutical compounds by activated carbon prepared from agricultural by-product. Chem. Eng. J. 2012, 211–212, 310–317. [Google Scholar] [CrossRef]
  25. Mestre, A.S.; Bexiga, A.S.; Proença, M.; Andrade, M.; Pinto, M.L.; Matos, I.; Fonseca, I.M.; Carvalho, A.P. Activated carbons from sisal waste by chemical activation with K 2CO 3: Kinetics of paracetamol and ibuprofen removal from aqueous solution. Bioresour. Technol. 2011, 102, 8253–8260. [Google Scholar] [CrossRef]
  26. Saleem, J.; Shahid, U.B.; Hijab, M.; Mackey, H.; McKay, G. Production and applications of activated carbons as adsorbents from olive stones. Biomass Convers. Biorefinery 2019, 9, 775–802. [Google Scholar] [CrossRef] [Green Version]
  27. Chen, B.; Chi, W.H.; McKay, G. Film-pore diffusion modeling and contact time optimization for the adsorption of dyestuffs on pith. Chem. Eng. J. 2001, 84, 77–94. [Google Scholar] [CrossRef]
  28. Wong, Y.C.; Szeto, Y.S.; Cheung, W.H.; McKay, G. Pseudo-first-order kinetic studies of the sorption of acid dyes onto chitosan. J. Appl. Polym. Sci. 2004, 92, 1633–1645. [Google Scholar] [CrossRef]
  29. Mui, E.L.K.; Cheung, W.H.; Valix, M.; McKay, G. Dye adsorption onto char from bamboo. J. Hazard. Mater. 2010, 177, 1001–1005. [Google Scholar] [CrossRef]
  30. Mui, E.L.K.; Cheung, W.H.; Lee, V.K.C.; McKay, G. Compensation effect during the pyrolysis of tyres and bamboo. Waste Manag. 2010, 30, 821–830. [Google Scholar] [CrossRef]
  31. To, M.H.; Hadi, P.; Hui, C.W.; Lin, C.S.K.; McKay, G. Mechanistic study of atenolol, acebutolol and carbamazepine adsorption on waste biomass derived activated carbon. J. Mol. Liq. 2017, 241, 386–398. [Google Scholar] [CrossRef]
  32. Danish, M.; Hashim, R.; Ibrahim, M.N.M.; Sulaiman, O. Optimized preparation for large surface area activated carbon from date (Phoenix dactylifera L.) stone biomass. Biomass Bioenergy 2014, 61, 167–178. [Google Scholar] [CrossRef]
  33. Merzougui, Z.; Azoudj, Y.; Bouchemel, N.; Addoun, F. Effect of activation method on the pore structure of activated carbon from date pits application to the treatment of water. Desalin. Water Treat. 2011, 29, 236–240. [Google Scholar] [CrossRef]
  34. Girgis, B.S.; El-Hendawy, A.N. Porosity development in activated carbons obtained from date pits under chemical activation with phosphoric acid. Microporous Mesoporous Mater. 2002, 52, 105–117. [Google Scholar] [CrossRef]
  35. Cherik, D.; Louhab, K. Preparation of microporous activated carbon from date stones by chemical activation using zinc chloride. Energy Sources Part A Recover. Util. Environ. Eff. 2017, 39, 1935–1941. [Google Scholar] [CrossRef]
  36. Suresh Kumar Reddy, K.; Al Shoaibi, A.; Srinivasakannan, C. A comparison of microstructure and adsorption characteristics of activated carbons by CO2 and H3PO4 activation from date palm pits. Carbon N. Y. 2013, 52, 623. [Google Scholar] [CrossRef]
  37. Hameed, B.H.; Salman, J.M.; Ahmad, A.L. Adsorption isotherm and kinetic modeling of 2,4-D pesticide on activated carbon derived from date stones. J. Hazard. Mater. 2009, 163, 121–126. [Google Scholar] [CrossRef] [PubMed]
  38. Al-Ghouti, M.A.; Li, J.; Salamh, Y.; Al-Laqtah, N.; Walker, G.; Ahmad, M.N. Adsorption mechanisms of removing heavy metals and dyes from aqueous solution using date pits solid adsorbent. J. Hazard. Mater. 2010, 176, 510–520. [Google Scholar] [CrossRef]
  39. Bouchemal, N.; Azoudj, Y.; Merzougui, Z.; Addoun, F. Adsorption modeling of orange G dye on mesoporous activated carbon prepared from algerian date pits using experimental designs. Desalin. Water Treat. 2012, 45, 284–290. [Google Scholar] [CrossRef]
  40. El Messaoudi, N.; El Khomri, M.; Bentahar, S.; Dbik, A.; Lacherai, A. Removal of crystal violet by biosorption onto date stones. Sci. Study Res. Chem. Chem. Eng. Biotechnol. Food Ind. 2016, 17, 151–167. [Google Scholar]
  41. Bouhamed, F.; Elouear, Z.; Bouzid, J. Adsorptive removal of copper (II) from aqueous solutions on activated carbon prepared from Tunisian date stones: Equilibrium, kinetics and thermodynamics. J. Taiwan Inst. Chem. Eng. 2012, 43, 741–749. [Google Scholar] [CrossRef]
  42. Mangwandi, C.; Kurniawan, T.A.; Albadarin, A.B. Comparative biosorption of chromium (VI) using chemically modified date pits (CM-DP) and olive stone (CM-OS): Kinetics, isotherms and influence of co-existing ions. Chem. Eng. Res. Des. 2020, 156, 251–262. [Google Scholar] [CrossRef]
  43. Belhamdi, B.; Merzougui, Z.; Trari, M.; Addoun, A. A kinetic, equilibrium and thermodynamic study of L-phenylalanine adsorption using activated carbon based on agricultural waste (date stones). J. Appl. Res. Technol. 2016, 14, 354–366. [Google Scholar] [CrossRef] [Green Version]
  44. Darweesh, T.M.; Ahmed, M. Ahmed, Batch and fixed bed adsorption of levofloxacin on granular activated carbon from date stones (Phoenix dactylifera L.) by KOH chemical activation. Environ. Toxicol. Pharmacol. 2017, 50, 159–165. [Google Scholar] [CrossRef] [PubMed]
  45. Hijab, M.; Saleem, J.; Parthasarathy, P.; Mackey, H.R.; McKay, G. Two-stage optimisation for malachite green removal using activated date pits. Biomass Convers. Biorefinery 2020, 11, 727–740. [Google Scholar] [CrossRef]
  46. Hijab, M.; Parthasarathy, P.; Mackey, H.R.; Al-Ansari, T.; McKay, G. Minimizing adsorbent requirements using multi-stage batch adsorption for malachite green removal using microwave date-stone activated carbons. Chem. Eng. Process. Process Intensif. 2021, 167, 108318. [Google Scholar] [CrossRef]
  47. Hijab, M.S.; Parthasarathy, P.; Li, P.; Mackey, H.R.; Al-Ansari, T.; Mohammed, R.R.; McKay, G. Active carbon from microwave date stones for toxic dye removal: Setting the design capacity. Chem. Eng. Technol. 2020, 43, 1841–1849. [Google Scholar] [CrossRef]
  48. Hijab, M.; MackeY, H.R.; Mohammed, R.R.; Mckay, G. Malachite Green Dye Removal from Water Using Date Pit Derived Activated Carbon. In Proceedings of the The Eighth Jordan International Chemical Engineering Conference (JIChEC 2017), Amman, Jordan, 7–9 November 2017; pp. 1–9. [Google Scholar]
  49. Freundlich, H.M.F. Over the adsorption in solution. J. Phys. Chem. 1906, 57, 385–470. [Google Scholar]
  50. Sips, R. Combined form of Langmuir and Freundlich equations. J. Phys. Chem. 1948, 16, 490–495. [Google Scholar] [CrossRef]
  51. Temkin, M.J.; Pyzhev, V. Recent Modifications to Langmuir Isotherms. Acta Physiochim. USSR 1940, 217–222. [Google Scholar]
  52. Toth, J. State equation of the solid gas interface layer. Acta Chim. 1971, 69, 311–317. [Google Scholar]
  53. Dubinin, M.M. The potential theory of adsorption of gases and vapors for adsorbents with energetically nonuniform surfaces. Chem. Rev. 1960, 60, 235–241. [Google Scholar] [CrossRef]
  54. Kumar, K.V.; Sivanesan, S. Pseudo Second Order Kinetics and Pseudo Isotherms for Malachite Green onto Activated Carbon: Comparison of Linear and Non-Linear Regression Methods. J. Hazard. Mater. 2006, 136, 721–726. [Google Scholar] [CrossRef] [PubMed]
  55. Ng, C.; Marshall, W.; Rao, R.M.; Bansode, R.R.; Losso, J.N.; Portier, R.J. Granular Activated Carbons from Agricultural By-Products: Process Description and Estimated Cost of Production; LSU Agricultural Center: Los Angeles, CA, USA, 2003. [Google Scholar]
  56. Lai, J.Y.; Ngu, L.H. The production cost analysis of oil palm waste activated carbon: A pilot-scale evaluation. Greenh. Gases Sci. Technol. 2020, 10, 999–1026. [Google Scholar] [CrossRef]
  57. Gonzales, D.; Searcy, E.M.; Ekşioĝlu, S.D. Cost analysis for high-volume and long-haul transportation of densified biomass feedstock. Transp. Res. Part A Policy Pract. 2013, 49, 48–61. [Google Scholar] [CrossRef]
  58. Phosphoric Acid Price Trend and Forecast. Available online: https://www.chemanalyst.com/Pricing-data/phosphoric-acid-1162 (accessed on 18 December 2021).
  59. Liao, M.; Kelley, S.; Yao, Y. Generating Energy and Greenhouse Gas Inventory Data of Activated Carbon Production Using Machine Learning and Kinetic Based Process Simulation. ACS Sustain. Chem. Eng. 2020, 8, 1252–1261. [Google Scholar] [CrossRef] [Green Version]
  60. Nowrouzi, M.; Younesi, H.; Bahramifar, N. High efficient carbon dioxide capture onto as-synthesized activated carbon by chemical activation of Persian Ironwood biomass and the economic pre-feasibility study for scale-up. J. Clean. Prod. 2017, 168, 499–509. [Google Scholar] [CrossRef]
Figure 1. Five isotherm models compared with the experimental IBU equilibrium data.
Processes 10 00453 g001
Figure 2. Schematic figure of a two-stage system.
Processes 10 00453 g002
Figure 3. Interstage concentrations, C1, to remove different fixed% C0 IBU using the Langmuir–Freundlich model.
Processes 10 00453 g003
Figure 4. Minimum quantity of acid-treated date stone activated carbon, S1 + S2, against the interstage concentrations, C1, to remove IBU using the Langmuir–Freundlich model for different removal values, % C0.
Processes 10 00453 g004
Figure 5. Minimum total quantity of acid-treated date stone activated carbon, S1 + S2, against the initial IBU concentration, C0, to remove a fixed% C0 IBU using the Langmuir–Freundlich model.
Processes 10 00453 g005
Figure 6. Minimum total quantity of acid-treated date stone carbon, S1 + S2, to remove IBU applying the Langmuir–Freundlich model at different initial IBU concentrations, C0, for different set values of final IBU concentrations, C2, in the effluent.
Processes 10 00453 g006
Figure 7. Minimum quantity of acid-treated date stone carbon, S1 + S2, to remove IBU against the interstage IBU concentration, C1, using the Langmuir–Freundlich model for the set values of final IBU concentrations in the effluent, C2.
Processes 10 00453 g007
Table 1. Ibuprofen properties.
PropertyIbuprofen
Chemical formulaC13H18O2
Chemical structure Processes 10 00453 i001
Physical state *Solid
Molecular weight (g/mol)206.28
Boiling point157 °C
Melting point76 °C
pKa4.91
log Kow3.97
Water solubility * 21 mg/L
* measured at 25 °C.
Table 2. Char yield at different temperatures.
Temperature (°C)Yield (%)
35055.1
40036.9
45028.6
50027.3
55026.2
60025.1
Table 3. Isotherm Parameters and SSE of IBU adsorption on date stone activated carbon.
LangmuirFreundlichTemkinDRRedlich-PetersonSIPS/LFToth
SSE42.172.3317.0727.033.025.030.0
R20.9940.9870.9400.9370.9940.9950.995
ParameterKL = 19.0,
aL = 0.151,
qm = 126
KF = 22.0,
nF = 1.91
B = 2.74,
AT = 112
qm = 83.4,
E = 550
KRP = 27.6,
aRP = 0.428,
bRP = 0.776
KLF = 16.4,
nLF = 1.24,
aLF =0.130
qm = 216,
KT = 2.84,
n = 0.552
Table 4. IBU adsorption capacities on various materials.
AdsorbentSurface Area (m2/g)IsothermEquilibrium Time (h)IBU Concentration (mg/L)Maximum IBU Adsorption Capacity (mg/g)Ref.
CDC1054Langmuir241–20367 at pH 3, 293 K[21]
Commercial granular AC800Langmuir-Freundlich675–100160 at pH 3, 298 K[22]
Olive waste cake AC793Langmuir261014.4 at pH 4.1, 298 K[24]
Table 5. Minimum total quantity of phosphoric-acid-treated date stone activated carbon to remove IBU using the Langmuir–Freundlich model to achieve C2 = 0.5% C0 for 1000 L of solution.
C0 (mg/L)C2 (mg/L)C1 (mg/L)Ss1 (kg)Ss2 (kg)Ss1 + Ss2 (kg)
10.0050.0841.193.414.60
20.0100.1691.022.883.90
30.0150.2530.9312.623.55
40.0200.3370.8802.453.32
50.0250.4210.8412.323.16
60.0300.5060.8132.223.03
70.0350.5900.7922.142.93
80.0400.6740.7762.072.85
100.0500.8430.7531.972.72
120.0601.0120.7381.882.62
140.0701.1800.7281.822.54
150.0751.2640.7251.792.51
160.0801.3490.7231.762.48
180.0901.5170.7201.712.43
200.1001.6860.7191.672.39
Table 6. Minimum total quantity of date stone acid-treated activated carbon to remove IBU using the Langmuir–Freundlich model to achieve C2 = 0.20 mg/L.
C0 (mg/L)C2 (mg/L)C1 (mg/L)Ss1 (kg)Ss2 (kg)Ss1+Ss2 (kg)
10.200.4580.0890.1170.206
20.200.6630.1450.2090.353
30.200.8240.1840.2810.465
40.200.9620.2160.3430.559
50.201.0850.2440.3990.643
60.201.1970.2690.4500.718
70.201.3020.2920.4970.789
80.201.4000.3130.5410.854
100.201.5800.3530.6220.975
120.201.7450.3890.6901.09
140.201.8980.4230.7661.19
150.201.9710.4400.7991.24
160.202.0420.4550.8311.29
180.202.1780.4860.8921.38
200.202.3070.5160.9501.47
Table 7. Minimum total amount of acid-activated date stone carbon for 99.5% removal of ibuprofen in single (SS) and two-stage (SS1 + SS2) operations for C0 values and 1000 L of solution.
Variable (C0) (mg/L)1.02.05.010.020.0
Effluent (C2) (mg/L)0.0050.0100.0250.0500.100
Single Stage (SS) (kg)43.336.729.425.021.2
Two-Stage (SS1 + SS2) (kg)4.603.903.162.722.39
qe for Single Stage (mg/g)0.02300.05430.1690.3980.937
Table 8. Minimum total amount of phosphoric-acid-activated date stone carbon for an IBU effluent concentration of 0.20 mg/L in both a single (SS) and two-stage (SS1 + SS2) system for various C0 values for 1000 L solution.
Variable (C0) (mg/L)1.02.05.010.020.0
Effluent (C2) (mg/L)0.200.200.200.200.20
Single Stage (SS) (kg)0.3650.8222.194.479.04
Two-Stage (SS1 + SS2) (kg)0.2060.3530.6430.9761.47
qe for Single Stage (mg/g)2.192.192.192.192.19
Table 9. Estimated production cost per kg of date-stone-activated carbon.
MaterialAmount Required to Produce One kg of ACCost ($/kg of AC)
Waste date stones5 kg0.125 (transportation cost)
Phosphoric acid2 kg1.48
Water0.04 m30.059
Energy20.5 kWh2.05
Other operation and maintenance costs-0.743
Estimated total cost-4.457
Publisher’s Note: MDPI stays neutral with regard to jurisdictional claims in published maps and institutional affiliations.

