Abstract
This research investigated the ability of two materials, which are waste generated during water treatment and wastewater treatment, to remove phosphates from water. The selected materials were quartz sand used in drinking water treatment plants (OQS) and incinerated (600 °C) sewage sludge (ISS). The materials were chosen for their composition: both contain aluminium, iron, and calcium. The experiments were carried out in the laboratory (in batch and in columns stand). Modelling of the sorption processes was performed on the basis of results from experiments in batches. The maximum adsorption capacity of the OQS was 1.14 mg/g obtained using the linearized Langmuir model and the maximum adsorption capacity of the ISS was 0.86 mg/g for the linearized Langmuir model (in batch). A pseudo-first-order model obtained using a nonlinear fit can accurately explain phosphate adsorption kinetics using both adsorbents: OQS and ISS. During the column filtration experiment, a higher sorption capacity of the ISS filter media was achieved −2.1 mg of phosphate phosphorus per gram of filter media. The determined adsorption capacity of the investigated materials was average, but the reuse of this waste would help to solve the issues of the circular economy.
1. Introduction
Untreated, or insufficiently treated, wastewater pollutes the natural environment: soil, lakes, rivers or other water bodies, groundwater [1,2,3]. Nutrients in the wastewater can get into surface water, cause eutrophication and destroy the water ecosystem [4]. Even very small amounts of phosphates (<0.1 mg/L) in treated wastewater can cause eutrophication. Conventional (biological) treatment methods allow efficient removal of organic matter from wastewater, but the removal efficiency of phosphorus compounds is only 20–40%. Phosphorus is used in biochemical processes of activated sludge, but this biological removal is influenced by various parameters of wastewater: the content of organic matter, the content of volatile fatty acids, the concentration of cations, the content of phosphorus compounds, the pH of wastewater, and the ratio of nutrients to microorganisms [5]. A proper temperature, activated sludge quality, and dissolved oxygen concentration are important factors for successful wastewater treatment; it is not always possible to maintain the right conditions [6]. If the required efficiency of phosphorus removal is not achieved during biological treatment, an additional wastewater treatment must be applied. New methods are being developed and materials are being sought to reduce the concentration of phosphorus in treated wastewater [7,8,9,10]. Phosphorus can be removed by dosing chemicals, by precipitation, or by coagulation. The incorporation of chemicals is costly and can lead to additional pollution [11]. In many cases, phosphorus compounds are quite soluble, so it is difficult to remove phosphorus by conventional mechanical cleaning. Dissolved phosphorus primarily exists in the form of phosphates [9,12]. Phosphates can be precipitated in wastewater by the insertion of at least one of the three metal ions that form low-soluble phosphates. These metals are divalent calcium, divalent or trivalent iron, and trivalent aluminium [9,13,14,15,16]. Phosphorus can be removed from aqueous solutions during physicochemical (adsorption and precipitation) processes [7,17,18,19]. Another problem is that phosphorus resources in the world are decreasing, so it is not only useful to remove phosphorus from wastewater, but also to save it for reuse [20]. Therefore, filtration of wastewater through suitable sorption materials is a good way to purify water from phosphates and to accumulate phosphorus in the filter fillers, and later recover it from the used filter media.
This research investigated the ability of two materials, which are waste generated during water treatment and wastewater treatment, to remove phosphates from the water. The selected materials were quartz sand used in drinking water treatment plants (OQS) and incinerated (600 °C) sewage sludge. The materials were chosen for their composition: both contain aluminium, iron, and calcium. The aim of the authors was to test these materials, perform modelling of sorption processes and, on the basis of research, make recommendations for the reuse of these waste materials for the removal of phosphates from aqueous solutions.
2. Materials and Methods
2.1. Selected Materials
The first selected material was quartz sand grains from drinking water treatment plants (Figure 1a). It is an inert material that fills the filters. Filtration through quartz sand of groundwater containing divalent iron, divalent manganese, calcium, and other elements forms an oxide layer on the surface of quartz sand grains [21]. Over time, the volume of the filter fillers increases, and the excess has to be removed. Quartz sand grains (1.5–3 mm in size) with the formed oxide layer (OQS—oxidized quartz sand) were obtained from Antaviliai water treatment plants in Vilnius. In the research, the OQS material was used dry—it was dried in an oven at 105 °C for about 2 h.
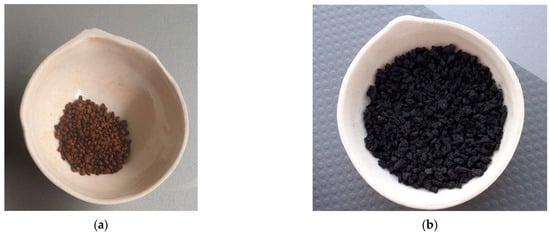
Figure 1.
Selected materials: (a) oxidized quartz sand grains (OQS); (b) incinerated sewage sludge grains (ISS).
The second selected material was grains from incinerated sewage sludge (ISS) (Figure 1b). The primary and excess sludge formed in the Vilnius city wastewater treatment plant was treated in the following stages: compaction, thermal hydrolysis, anaerobic digestion, dehydration, drying. The received sludge pellets were further burned in an oven for 2 h at a temperature of 600 °C. The incinerated sludge was crushed by mechanical grinding and sieving through sieves of appropriate mesh size to obtain a 1.0–2.0 mm grain size fraction.
2.2. Methodology for Determining the Composition of the Materials
The composition of elements in dry samples was analysed. Five samples of each material (OQS or ISS) were taken during the experimental studies. All samples were dried for 11 h at the temperature of 110 °C and disintegrated. The grains of quartz sand are extremely strong, so the external layer of oxide coating crumbled more during crushing. Phosphorus sorption takes place in this layer, so the samples were composed of it. Obtained samples were sieved through sieves, as required for X-Ray Fluorescence analysis. Sieved samples were analysed using a Thermo Scientific Niton® XL2 X-Ray fluorescence spectrometer. Analytical methods of X-ray fluorescence spectrometry and the Niton XL2 device were used.
2.3. Experiments Methodology
2.3.1. Batch Tests
Closed batch experiments were used to estimate the first predictions of phosphate phosphorus (PO4-P) retention. The experiments were performed in a laboratory at 18–20 °C. Aqueous solutions containing PO4-P concentrations ranging from 0.47 to 44.86 mg/L were prepared from distilled water and K2HPO4 salt. The pH of the prepared solution was determined using a WTW production pH-meter pH-330i (LST EN ISO 10523:2012), as the quality control of the measurements using Hamilton (Switzerland) certified reference buffers pH 7.00 ± 0.01 and pH 9.21 ± 0.02. For each individual test, 6 cylinders were used, loaded with 0.5 L aqueous solution and a certain mass of selected material (OQS or ISS), and mixed in an automatic mixer at 50 rpm. In separate experiments, the dry mass of each material (1, 2, 3, 4, 5, 6, 8, 10 g) was taken. Stirring was continued for 10 min, after which each cylinder was sampled and filtered through 0.45-micron glass fibre filters. Additional samples were taken after 10, 20, 30, 40, 160, 1600 min. The concentration of PO4-P in the filtrates was determined using MERCK Spectroquant® tests, pouring test samples into cuvettes (Hellma), and measuring them with a Genesys 10 UV-Vis spectrophotometer.
2.3.2. Column Research
An experimental stand was constructed in the laboratory to study the removal of PO4-P from an aqueous solution by filtration (Figure 2). The experiments were performed in a laboratory at 18–20 °C. The capacity, which is shown in the figure (Figure 2, (1)), was filled with drinking tap water in which 12 g of K2HPO4 salt was dissolved to give a PO4-P solution with a concentration of 13.42 mg/L. An equal volume (110 mL) of selected materials (OQS and ISS) was added to each filtration column (Figure 2, (2)). The OQS material weighed 150 g and the ISS material − 54 g.
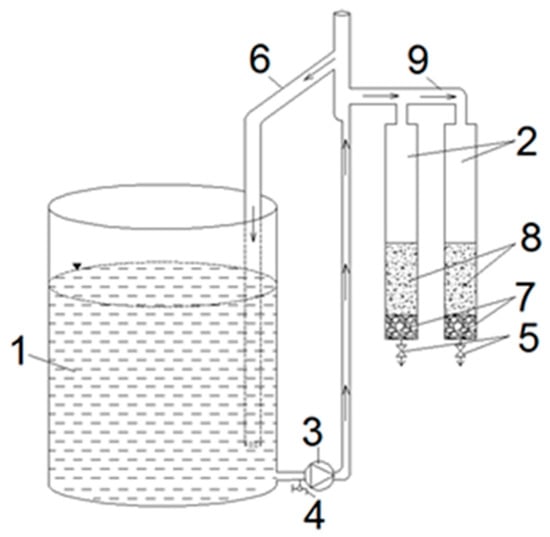
Figure 2.
Principal scheme for stand: (1)—capacity of phosphate solution, (2)—filtration columns, (3)—solution supply pump, (4)—solution sampling point (before filtration), (5)—filtrate collection point, (6)—overflow tube, (7)—retaining layer, (8)—filter media, (9)—solution distribution pipe to columns.
The pH of the prepared solution was determined using a WTW production pH meter pH-330i (LST EN ISO 10523:2012), as the quality control of the measurements using Hamilton (Switzerland) certified reference buffers pH 7.00 ± 0.01 and pH 9.21 ± 0.02. The concentration of sulphates in the solution was determined by the gravimetric method using barium chloride (LST ISO 9280: 1998) and the concentration of chlorides by Mohr’s method (LST ISO 9297: 1998). The concentration of PO4-P in the filtrates was determined using MERCK Spectroquant® tests, pouring test samples into cuvettes (Hellma), and measuring with a Genesys 10 UV-Vis spectrophotometer.
A pump ((3), Figure 2) was applied to supply two filters (using OQS and ISS as the filter media) with phosphate solution at a rate of 1.1 m/h (discharge of 1.4 L/h). The experiment lasted for 28.5 h. For conducting the longer study ((1), Figure 2), approximately 100 L of phosphate solution were added to the tank. Filtrate samples from ((5), Figure 2) were taken every 30 min to measure the concentration of PO4-P. The effectiveness of removing PO4-P Ei (%) from wastewater was calculated according to Formula (1):
where: C0—PO4-P concentration before treatment, (mg/L); Ci—PO4-P concentration after treatment, (mg/L).
The study was repeated two more times to present the mean results of three experiments.
2.4. Process Modelling
In order to analyse adsorption equilibrium, two isotherm models were used. Adsorption isotherms allow determining the equilibrium adsorption capacity. For the adsorption mechanism, the adsorption rate of PO4-P on the adsorbent in terms of adsorption capacity was modelled using pseudo-first- and pseudo-second-order adsorption kinetics models. The models were analysed using linearized forms and compared on non-transformed scales too. For this reason, the coefficient of determination and the average relative errors were calculated [22].
2.4.1. Adsorption Equilibrium
The equilibrium relation between the adsorbed amount of the adsorbate qe (mg/g) and the amount of the adsorbate in the solution Ce was determined using Equation (2):
where: C0—initial concentration of PO4-P (mg/L) and Ce—equilibrium phosphate concentration (mg/L), V—volume of PO4-P solution (mL), and m—mass of the adsorbent (g).
The adsorption process equilibrium data were fitted to the Langmuir and Freundlich isotherms. The isotherms represent the relation between the adsorbed amount of the adsorbate qe and the amount of the adsorbate in the solution Ce. The Langmuir isotherm,
and the Freundlich isotherm,
were used.
Here: qm is the maximum adsorption capacity (mg/g), KL is the Langmuir isotherm constant (L/g), Kf is the Freundlich isotherm constant (mg/g)/(mg/L)−1/n and n is the Freundlich exponent.
The linearized forms of the Langmuir and Freundlich isotherms were used for data fitting.
Then for the Langmuir isotherm, the linear relation is:
For the Freundlich isotherm, the linear relation is given as:
The separation factor for the Langmuir isotherm is:
where: C0 is the initial PO4-P concentration (mg/L).
The separation factor above 1 represents unfavourable adsorption and when the factor is less than 1 it implies that adsorption is favourable.
In the case of the Freundlich isotherm, the Freundlich exponent n is an indicator of the adsorption process. The Freundlich exponent values above 1 stand for favourable adsorption and values less than 1 for unfavourable adsorption.
2.4.2. Kinetics Analysis
In order to understand the mechanism of the adsorption process, the experimental data were fitted to well-known kinetic models: the pseudo-first-order (Lagergren), the pseudo-second-order (Ho and McKay), and the intra-particle diffusion (Morris-Weber) kinetic models. The model equations are:
and
respectively.
Here: qe and qt are the adsorption amount at equilibrium and time t respectively, is the pseudo-first-order model rate constant, k2 is the pseudo-second-order model rate constant, kp is the intra-particle diffusion rate constant and the constant C indicates the thickness of the boundary layer.
The model constants can be obtained using linearized forms of the kinetic models. The linear forms of the pseudo-first-order and the pseudo-second-order models are respectively:
In this research the model constants were determined in two ways: using nonlinear fit and minimizing the sum and using the linear forms of the models. In this way, the slope and intercept of the plot versus t for pseudo-first-order and versus t for pseudo-second-order model were obtained. The constants for the intra-particle diffusion model were calculated from the graph versus .
The average relative errors and the coefficient of determination were calculated as follows:
where: , experimental values of adsorption amount at the time moments .
3. Results and Discussion
3.1. Composition of the Materials
The elemental composition of the OQS and ISS grains is given in Table 1.

Table 1.
Composition of the materials.
As can be seen from Table 1, the OQS grains have almost no carbon; most of the mass consists of iron, silicon, further manganese, calcium, and aluminium. In the ISS grains, most of the mass consists of carbon, followed by silicon, calcium, phosphorus, aluminium, and iron.
3.2. Modelling Results
3.2.1. Adsorption Equilibrium
For analysing the two types of adsorbent (OQS and ISS), the Langmuir and Freundlich isotherms were fitted and the adsorption characteristics calculated. The model parameters (Table 2) were calculated using nonlinear and linear forms of the Langmuir and Freundlich isotherms.

Table 2.
The model parameters calculated using Formulas (2)–(5).
The constant values for the linearized models were obtained using the slope and intercept values of the plot versus of the Langmuir model for the OQS (Figure 3) and using the slope and intercept values of the plot versus of the Freundlich isotherm for the OQS (Figure 4). The constant values for the nonlinear models were obtained using the nonlinear curve fitting method in MS Excel solver. Then, the obtained values of the parameters were used in Models (2) and (3) and the adsorbed amount of the adsorbate was calculated. The lines of the Langmuir and Freundlich isotherms were drawn in Figure 5 for the OQS adsorbent. All actions were repeated with ISS adsorbent respectively (Figure 6, Figure 7 and Figure 8). Next, the obtained determination () and the average relative error (ARE) are presented in Table 3.
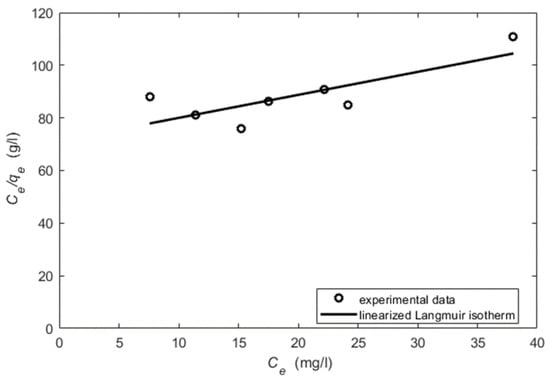
Figure 3.
The linearized form of the Langmuir isotherm for the OQS (regression coefficient ).
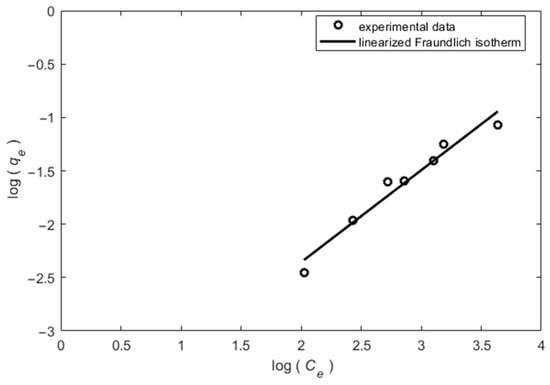
Figure 4.
The linearized form of the Freundlich isotherm for the OQS (regression coefficient ).
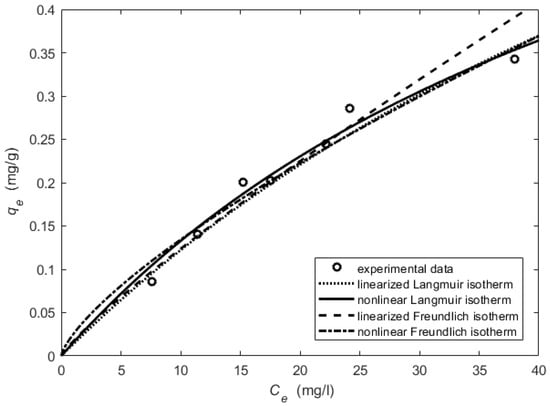
Figure 5.
Equilibrium analysis for the OQS.
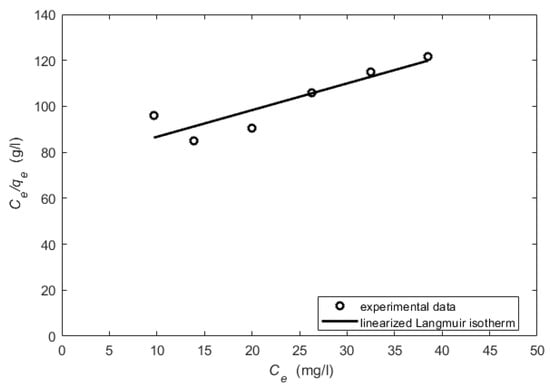
Figure 6.
The linearized form of the Langmuir isotherm for the ISS (regression coefficient ).
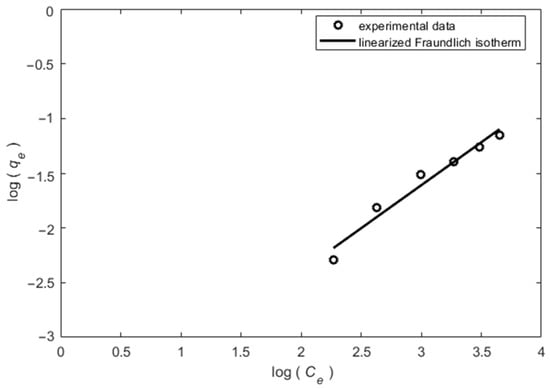
Figure 7.
The linearized form of the Freundlich isotherm for the ISS (regression coefficient ).
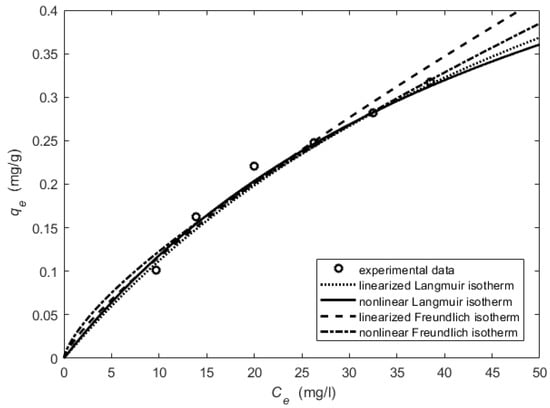
Figure 8.
Equilibrium analysis for the ISS.

Table 3.
Evaluation of the adsorption equilibrium.
3.2.2. OQS Adsorbent Results
The maximum adsorption capacity was 1.14 mg/g obtained using the linearized Langmuir model and 0.87 mg/g for the nonlinear model. The determination coefficient values for the Langmuir isotherm used in the form (2) were 0.96 and 0.97, respectively. The separation factor for the OQS was equal to 0.78 for the linearized model and 0.70 for the nonlinear model. The obtained values of indicated that the adsorption is favourable.
The Freundlich exponent for the linearized Freundlich model was 1.16 and for the nonlinear model was 1.37. The obtained values of n suggested favourable adsorption.
The higher values of the determination coefficient () also suggested that the experimental data were a very good fit for both models. The average relative error (ARE) had the smallest value 6.2% in the case of the Langmuir model when the model constants were obtained using the linear relation (4).
A better fit with the Langmuir isotherm model implies possible monolayer adsorption of PO4-P on the OQS adsorbent. As it was mentioned in [23], this presupposes homogeneity of the sorbing surface and no interactions, involving uniforms energies of sorption on the surface and no transmigration of metal cations in the plane of the surface.
3.2.3. ISS Adsorbent Results
The maximum adsorption capacity was 0.86 mg/g for the linearized Langmuir model and 0.74 mg/g for the nonlinear model. The separation factor was equal to 0.70 for the linearized model and 0.65 for the nonlinear model. The value of indicated that the adsorption is favourable.
The Freundlich exponent for the linearized Freundlich model was 1.27, and for the nonlinear model, 1.41. The obtained values of n indicated favourable adsorption.
The higher values of the determination coefficient () and lower values for average relative error (ARE) were determined for the ISS adsorbent compared to the OQS. For this type of adsorbent, we concluded that the nonlinear Langmuir model showed the best fit to the experimental data (), ARE = 4.1%. With this adsorbent, similar trends as mentioned for the OQS based on [23] were observed.
3.2.4. Kinetics Analysis
The kinetics models were fitted for two types of adsorbents and the obtained results were compared. In this way, solutions were selected with the close initial adsorbate concentration: C0 = 29.9 mg/L for the OQS adsorbent and C0 = 31.2 mg/L for the ISS adsorbent.
In the case of the OQS adsorbent, the results for the kinetics study are presented in Table 4 and Table 5. Here, next to the model constants, were the calculated coefficient of determination () and the average relative error (ARE) values. The lines of the pseudo-first-order and pseudo-second-order kinetic models with the obtained constants are presented in Figure 9.

Table 4.
Constants for the pseudo-first-order kinetic model.

Table 5.
Constants for the pseudo-second-order kinetic model.
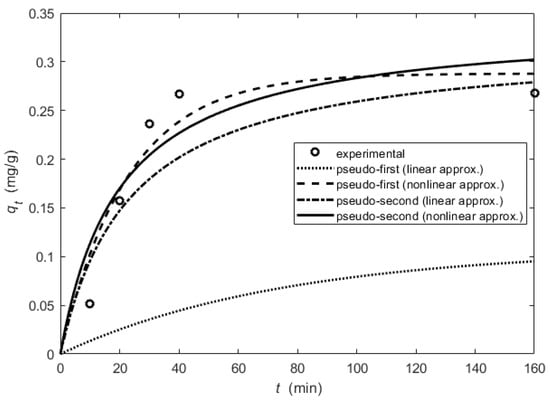
Only the pseudo-first-order kinetic model with the constants obtained using the linear form was not suitable for the OQS adsorbent. The smallest differences in adsorption amount were found for the pseudo-first-order kinetics model constructed using a nonlinear fit. The highest value for the determination and the smallest average relative error ARE = 26.94% are for this case. The intra-particle diffusion kinetics model constants (obtained using nonlinear fit) for the OQS adsorbent: . The determination was equal to 0.49 and the ARE = 48.18%. The experimental data and the line representing the intra-particle diffusion model are shown in Figure 10. In this case, the linear fit gives the multi-linear plots and it implies that intra-particle diffusion was not the sole rate-controlling step.
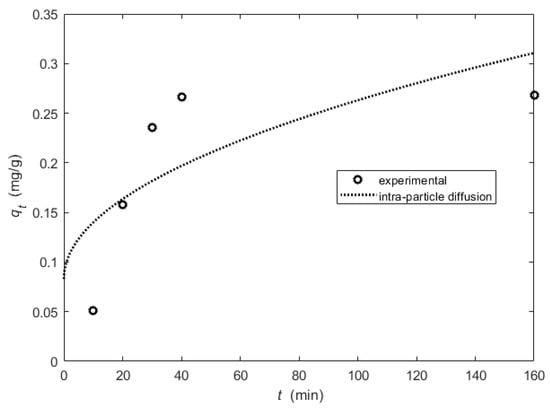
Figure 10.
The kinetic experimental data and intra-particle diffusion model for the OQS adsorbent.

Table 6.
Constants for the pseudo-first-order kinetic model (ISS adsorbent).

Table 7.
Constants for the pseudo-second-order kinetic model.
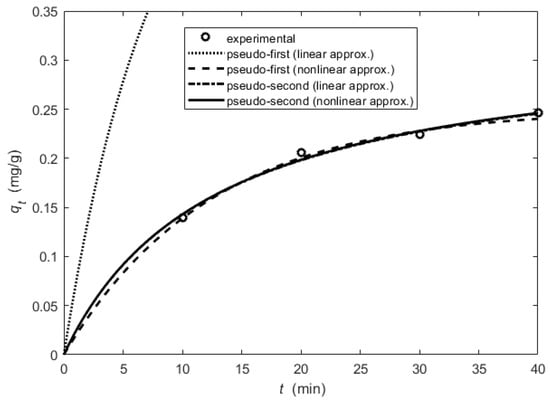
The best kinetics results for the ISS adsorbent were obtained with the pseudo-first-order model using a nonlinear fit. The highest determination coefficient and the smallest relative error were for this model.
The intra-particle diffusion kinetics model constants for the ISS adsorbent: . The determination was equal to 0.95 and the ARE = 4.05%. The experimental data and the line representing the intra-particle diffusion model are shown in Figure 12. The intra-particle diffusion model fit to experimental data for the ISS adsorbent well and in this case, the adsorption process is controlled by the intra-particle-diffusion.
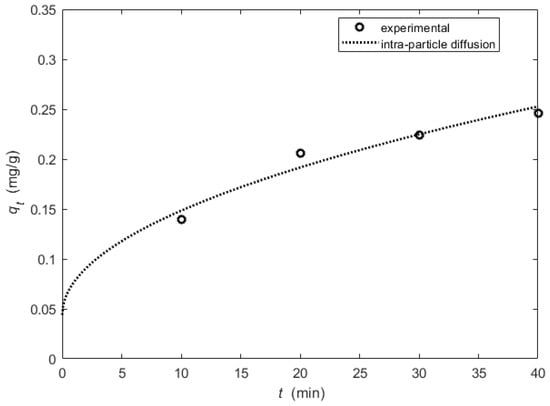
Figure 12.
The experimental data and the line representing intra-particle diffusion model.
3.3. Column Filtration Results
The temperature of the solution prepared for filtration was 17 ± 1 °C, the pH was 7.75 ± 0.1, the sulphate concentration was 38 ± 2 mg/L, and the chloride concentration was 20 ± 3 mg/L. Filtration through the columns continued for 28.5 h. During that time, 40 L of the solution was filtered through each filter media (Figure 13). During that time, the efficiency of the OQS filter media to remove PO4-P from the aqueous solution decreased from 93.5% to 23.5%, and the ISS filter media, from 76.3% to 30.0%. Filtration was performed with three breaks (the stand was turned off overnight). It has been observed that the efficiency of adsorbents to remove PO4-P increases when the filter is switched on after a break (8, 19, 23.5 h of filtration).
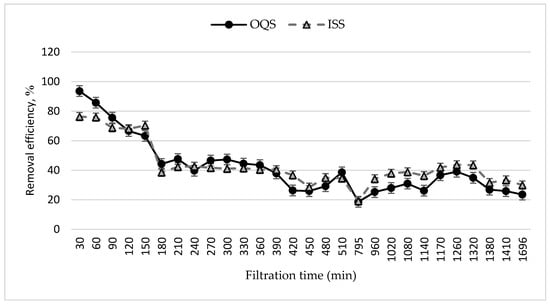
Figure 13.
Column filtration results (filtration rate—1.1 m/h, discharge—1.4 L/h, volume of filter media—110 mL).
Throughout the experiment, 1 g of the OQS adsorbent accumulated 0.78 mg of PO4-P, and 1 g of the ISS adsorbent accumulated 2.1 mg of PO4-P. The latter result is more than two times bigger than the previously calculated ISS sorption capacity (0.86 mg/g). The tap water used in the column experiment meets the requirements of the Lithuania hygiene standard HN 23:2017, but it cannot be equated with distilled water. Small amounts of substances dissolved in water may have affected the adsorption processes. Comparing the concentrations of anions (Cl−, SO42−) in the solution used in this experiment with the data of the authors [24], it can be seen that in this case there were 4.5 times fewer chlorine ions and 2 times fewer sulphate ions. The results given in [24] show no significant change in phosphate adsorption after adding coexisting anions with concentrations more than that of phosphate ions. It is assumed that chlorine and sulphate ions did not significantly affect phosphorus sorption in this experiment.
During the filtration experiment, it was observed that a whitish precipitate accumulated above the ISS filter media layer. Examination of the composition of the sediment (by dissolving the precipitate with nitric acid and measuring the phosphorus concentration) revealed that the sediment contained phosphorus. It is assumed that the ISS filler not only sorbs phosphorus but also traps phosphorus compounds on the filter surface. It should be noted that the ISS contains phosphorus (Table 1). By mixing the brittle ISS grains in solution (in the first study—in batch), phosphorus could be released from them into the liquid. During filtration, the ISS grains retained their shape, did not disintegrate, and retained 2.7 times more PO4-P (by weight) than the OQS adsorbent. The OQS adsorbent adsorbed slightly less PO4-P in the filtration experiment than obtained using the linearized Langmuir model (maximum adsorption capacity was 1.14 mg/g) or the nonlinear model (0.87 mg/g).
It was observed that in the column filtration experiment, the ability of this sorbent to remove PO4-P from the aqueous solution was not fully utilized, but the experiment was terminated due to the low PO4-P removal efficiency after 28 h (Figure 13).
The presence of aluminium, iron, magnesium, and calcium oxides is known to play an important role in phosphate removal. The negatively charged phosphate ions become attracted towards the surface of the grains, as shown in reaction (2), given by [24]:
M-OH2+ + H2PO4− → MH2PO4 + H2O,
The selected materials (OQS and ISS) contained Fe, Ca, Al, and other metals (Table 1). The difference is that the OQS can be classified as a mineral sorbent, while the ISS contains carbon (167 mg/g). Incineration of sewage sludge at 600 °C produces biochar. The functional groups in biochar can improve cation exchange capacity [25].
Comparing the obtained adsorbent sorption capacity (to adsorb phosphorus) with the capacity of other unmodified sorbents, it can be seen that for some tested substances it is lower; fragmented limestone waste—0.398 mg/g [26], ground burnt patties—0.41 mg/g [24], red soil—0.56 mg/g [27], kaolinite—0.32 mg/g, bentonite—0.28 mg/g [28]. There are also materials with a sorption capacity tens and hundreds of times higher: dolochar—399 mg/g, fine dolomite—277 mg/g, waste iron oxide material—72 mg/g [27]. Most studies of PO4-P sorption from solutions were performed at high concentrations of PO4-P (120–2000 mg/L), and high initial concentrations may have resulted in high sorption capacity. Efficient sorbents to be used as wastewater treatment filters must possess a high affinity to retain orthophosphate (phosphate) at low concentrations [29]. It should be noted that these sorption studies were performed at low initial concentrations of PO4-P (0.47 to 44.86 mg/L), which correspond to real conditions. It is also important that in this experiment the filtration took place at a relatively high rate, 1.1 m/h, and the solution in the filter fillers remained for only 4.7 min. Low filtration rates have been reported in the literature [24,27]: these authors used flow rates of 1.5 and 3 mL/min. In this work, the filtration rate was maintained at 24 mL/min. It is known that increasing the flow rate decreases the residence time that results in lower bed utilization. Therefore, bed capacity decreases with an increased flow rate. Under real conditions, an increase in the sorption efficiency of PO4-P can be expected by increasing the residence time of the water or effluent in the filter media.
Waste from water treatment plants (OQS) is a natural, clean adsorbent and can therefore be used in sensitive systems: for example, to remove phosphorus from rivers or stream water. We recommend incinerated sludge (ISS) for the removal of phosphorus from wastewater and garbage filtrates. It is not known whether this adsorbent releases undesirable substances into the environment, therefore leaching studies are recommended in the future. Urban sewage sludge management issues are particularly relevant today. Therefore, there is an urgent need to develop environmentally and economically acceptable novel approaches for the safe disposal and recovery of municipal sewage sludge in many cities. Pyrolysis is an alternative technology that is clean and cost-efficient for treating organic wastes [30]. Using this waste for wastewater treatment by adsorbing phosphorus would be a great solution for the circular economy.
4. Conclusions
This study evaluated the properties of two filter media (OQS and ISS) for removing PO4-P from aqueous solutions. The experiments were carried out in the laboratory (in batch and in columns stand). The maximum adsorption capacity of the OQS was 1.14 mg/g obtained using the linearized Langmuir model and 0.87 mg/g for the nonlinear model. The maximum adsorption capacity of the ISS was 0.86 mg/g for the linearized Langmuir model and 0.74 mg/g for the nonlinear model. The obtained values of indicate that the adsorption is favourable.
The analysis showed that the results of the adsorption equilibrium modelling obtained for the OQS adsorbent are very compatible with the experimental results: both the Langmuir and the Freundlich models can be successfully applied. The pseudo-first-order model obtained using a nonlinear fit can accurately explain PO4-P adsorption kinetics using both adsorbents: OQS and ISS. The intra-particle diffusion model fits the experimental data for the ISS adsorbent well and in this case, the adsorption process was controlled by intra-particle-diffusion.
During the column filtration experiment, 1 g of the OQS adsorbent accumulated 0.78 mg of PO4-P, and 1 g of the ISS adsorbent accumulated 2.1 mg of PO4-P. Although the filtration was relatively fast, at a rate of 1.1 m/h (discharge of 1.4 L/h), a higher sorption capacity was obtained than in the in-batch experiments. In this case, the mechanism of PO4-P retention was not completely clear, so further studies of the OQS and the ISS substances are recommended, taking into account more environmental and filtered solution parameters. Under the terms of this experiment, compared to other wastes, the ability to remove phosphorus from solutions was average. The advantage of the OQS is that it is a natural, clean adsorbent, so it can be used to remove phosphorus from rivers or stream water. Incinerated sewage sludge (ISS) is recommended for the treatment of wastewater and garbage filtrates containing phosphorus. The reuse of this waste would help to solve the issues of the circular economy.
Author Contributions
Conceptualization, J.Š., T.L. and A.M.; Data curation, J.Š., T.L. and A.M.; Formal analysis, J.Š., T.L. and A.M.; Investigation, J.Š., T.L. and A.M.; Methodology, J.Š., T.L. and A.M.; Supervision, J.Š., T.L. and A.M.; Validation, J.Š., T.L. and A.M.; Visualization, J.Š., T.L. and A.M.; Writing—original draft, J.Š., T.L. and A.M.; Writing—review & editing, J.Š., T.L. and A.M. All authors have read and agreed to the published version of the manuscript.
Funding
This research received no external funding.
Institutional Review Board Statement
Not applicable.
Informed Consent Statement
Not applicable.
Data Availability Statement
Not applicable.
Conflicts of Interest
The authors declare no conflict of interest.
References
- Environment Agency Reform of Regulatory System to Control Small Sewage Discharges from Septic Tanks and Small Sewage Treatment Plants in England; Environment Agency: Bristol, UK, 2015.
- McDowell, R.W.; Noble, A.; Pletnyakov, P.; Haggard, B.E.; Mosley, L.M. Global mapping of freshwater nutrient enrichment and periphyton growth potential. Sci. Rep. 2020, 10, 1–13. [Google Scholar] [CrossRef] [PubMed]
- Farkas, K.; Walker, D.I.; Adriaenssens, E.M.; McDonald, J.E.; Hillary, L.S.; Malham, S.K.; Jones, D.L. Viral indicators for tracking domestic wastewater contamination in the aquatic environment. Water Res. 2020, 181, 115926. [Google Scholar] [CrossRef]
- Dodds, W.K.; Smith, V.H. Nitrogen, phosphorus, and eutrophication in streams. Inland Waters 2016, 6, 155–164. [Google Scholar] [CrossRef]
- Gupta, V.K.; Ali, I. Wastewater Treatment by Biological Methods. In Environmental Water; Elsevier: Amsterdam, The Netherlands, 2013; pp. 179–204. [Google Scholar]
- Mažeikienė, A.; Grubliauskas, R. Biotechnological wastewater treatment in small-scale wastewater treatment plants. J. Clean. Prod. 2021, 279, 123750. [Google Scholar] [CrossRef]
- Du, X.; Han, Q.; Li, J.; Li, H. The behavior of phosphate adsorption and its reactions on the surfaces of Fe–Mn oxide adsorbent. J. Taiwan Inst. Chem. Eng. 2017, 76, 167–175. [Google Scholar] [CrossRef]
- Adera, S.; Drizo, A.; Twohig, E.; Jagannathan, K.; Benoit, G. Improving Performance of Treatment Wetlands: Evaluation of Supplemental Aeration, Varying Flow Direction, and Phosphorus Removing Filters. Water Air Soil Pollut. 2018, 229, 1–15. [Google Scholar] [CrossRef]
- Li, Y.; He, X.; Hu, H.; Zhang, T.; Qu, J.; Zhang, Q. Enhanced phosphate removal from wastewater by using in situ generated fresh trivalent Fe composition through the interaction of Fe(II) on CaCO3. J. Environ. Manag. 2018, 221, 38–44. [Google Scholar] [CrossRef]
- Hamisi, R.; Renman, A.; Renman, G. Performance of an On-Site Wastewater Treatment System Using Reactive Filter Media and a Sequencing Batch Constructed Wetland. Sustainability 2019, 11, 3172. [Google Scholar] [CrossRef] [Green Version]
- Bali, M.; Gueddari, M. Removal of phosphorus from secondary effluents using infiltration–Percolation process. Appl. Water Sci. 2019, 9, 3. [Google Scholar] [CrossRef] [Green Version]
- Erickson, A.J.; Gulliver, J.S.; Weiss, P.T. Capturing phosphates with iron enhanced sand filtration. Water Res. 2012, 46, 3032–3042. [Google Scholar] [CrossRef]
- Wilfert, P.; Kumar, P.S.; Korving, L.; Witkamp, G.J.; Van Loosdrecht, M.C.M. The Relevance of Phosphorus and Iron Chemistry to the Recovery of Phosphorus from Wastewater: A Review. Environ. Sci. Technol. 2015, 49, 9400–9414. [Google Scholar] [CrossRef] [PubMed]
- Chakraborty, T.; Gabriel, M.; Amiri, A.S.; Santoro, D.; Walton, J.; Smith, S.; Ray, M.B.; Nakhla, G. Carbon and Phosphorus Removal from Primary Municipal Wastewater Using Recovered Aluminum. Environ. Sci. Technol. 2017, 51, 12302–12309. [Google Scholar] [CrossRef] [PubMed]
- Lyngsie, G.; Penn, C.J.; Pedersen, H.L.; Borggaard, O.K.; Hansen, H.C.B. Modelling of phosphate retention by Ca- and Fe-rich filter materials under flow-through conditions. Ecol. Eng. 2015, 75, 93–102. [Google Scholar] [CrossRef]
- Kefeni, K.K.; Mamba, B.B.; Msagati, T.A.M. Application of spinel ferrite nanoparticles in water and wastewater treatment: A review. Sep. Purif. Technol. 2017, 188, 399–422. [Google Scholar] [CrossRef]
- Eveborn, D.; Gustafsson, J.P.; Elmefors, E.; Yu, L.; Eriksson, A.K.; Ljung, E.; Renman, G. Phosphorus in soil treatment systems: Accumulation and mobility. Water Res. 2014, 64, 42–52. [Google Scholar] [CrossRef] [PubMed] [Green Version]
- Huang, W.; Zhang, L.; Gao, J.; Li, J.; Zhang, J.; Zheng, Z. Removal of dissolved inorganic phosphorus with modified gravel sand: Kinetics, equilibrium, and thermodynamic studies. Desalin. Water Treat. 2016, 57, 3074–3084. [Google Scholar] [CrossRef]
- Huang, Y.; Yang, J.K.; Keller, A.A. Removal of arsenic and phosphate from aqueous solution by metal (hydr-)oxide coated sand. ACS Sustain. Chem. Eng. 2014, 2, 1128–1138. [Google Scholar] [CrossRef] [Green Version]
- Chowdhury, R.B.; Moore, G.A.; Weatherley, A.J.; Arora, M. Key sustainability challenges for the global phosphorus resource, their implications for global food security, and options for mitigation. J. Clean. Prod. 2017, 140, 945–963. [Google Scholar] [CrossRef]
- Kvartenko, O.; Sabliy, L.; Kovalchuk, N.; Lysytsya, A. The use of the biological method for treating iron containing underground waters. J. Water Land Dev. 2018, 39, 77–82. [Google Scholar] [CrossRef] [Green Version]
- Baltrėnaitė-Gedienė, E.; Leonavičienė, T.; Baltrėnas, P. Comparison of CU(II), MN(II) and ZN(II) adsorption on biochar using diagnostic and simulation models. Chemosphere 2020, 245, 125562. [Google Scholar] [CrossRef]
- Pehlivan, E.; Cetin, S.; Yanik, B.H. Equilibrium studies for the sorption of zinc and copper from aqueous solutions using sugar beet pulp and fly ash. J. Hazard. Mater. 2006, 135, 193–199. [Google Scholar] [CrossRef] [PubMed]
- Rout, P.R.; Bhunia, P.; Dash, R.R. Modeling isotherms, kinetics and understanding the mechanism of phosphate adsorption onto a solid waste: Ground burnt patties. J. Environ. Chem. Eng. 2014, 2, 1331–1342. [Google Scholar] [CrossRef]
- Prapagdee, S.; Tawinteung, N. Effects of biochar on enhanced nutrient use efficiency of green bean, Vigna radiata L. Environ. Sci. Pollut. Res. 2017, 24, 9460–9467. [Google Scholar] [CrossRef] [PubMed]
- Mateus, D.M.R.; Vaz, M.M.N.; Pinho, H.J.O. Fragmented limestone wastes as a constructed wetland substrate for phosphorus removal. Ecol. Eng. 2012, 41, 65–69. [Google Scholar] [CrossRef]
- Rout, P.R.; Bhunia, P.; Dash, R.R. Effective utilization of a sponge iron industry by-product for phosphate removal from aqueous solution: A statistical and kinetic modelling approach. J. Taiwan Inst. Chem. Eng. 2015, 46, 98–108. [Google Scholar] [CrossRef]
- Moharami, S.; Jalali, M. Removal of phosphorus from aqueous solution by Iranian natural adsorbents. Chem. Eng. J. 2013, 223, 328–339. [Google Scholar] [CrossRef]
- Vidal, B.; Hedström, A.; Herrmann, I. Phosphorus reduction in filters for on-site wastewater treatment. J. Water Process. Eng. 2018, 22, 210–217. [Google Scholar] [CrossRef]
- Tian, Y.; Cui, L.; Lin, Q.; Li, G.; Zhao, X. The sewage sludge biochar at low pyrolysis temperature had better improvement in urban soil and turf grass. Agronomy 2019, 9, 156. [Google Scholar] [CrossRef] [Green Version]
Publisher’s Note: MDPI stays neutral with regard to jurisdictional claims in published maps and institutional affiliations. |
© 2022 by the authors. Licensee MDPI, Basel, Switzerland. This article is an open access article distributed under the terms and conditions of the Creative Commons Attribution (CC BY) license (https://creativecommons.org/licenses/by/4.0/).