Abstract
Linamarin has been reported to have anticancer activities; however, its extraction and isolation using different solvents yield a low amount. Therefore, understanding the physical properties, such as solvents’ solubility, membrane permeability and lipophilicity and how they are associated with different solvents, is a paramount topic for discussion, especially for its potential as a drug. Linamarin has a sugar moiety with many polar groups responsible for its physical properties. Following current trends, a molecular dynamics simulation is performed to investigate its physical properties and how different solvents, such as water, methanol (MeOH), dimethyl sulfoxide (DMSO) and dichloromethane (DCM), affect such properties. In this work, we have investigated the influence of intermolecular and intramolecular hydrogen bonding and the influence of polar and non-polar solvents on the physical properties of linamarin. Furthermore, solvation free-energy and electronic structure analysis are performed. The structural analysis results show that the polar groups of linamarin have strong interactions with all solvents except the etheric oxygen groups. A detailed analysis shows intermolecular hydrogen bonding between polar solvents (water, MeOH and DMSO) and the hydroxyl oxygens of linamarin. Water exhibits the strongest interaction with linamarin’s functional groups among the investigated solvents. The findings show that within the first solvation shell, the number of water molecules is greatest, while MeOH has the fewest. Centrally to the structural analysis, solvation free energy confirms DMSO to be the best solvent since it prefers to interact with linamarin over itself, while water prefers to interact with itself. While the solute–solvent interactions are strongest between linamarin and water, the solvent–solvent interactions are strongest in water. As a result, the solvation free-energy calculations reveal that linamarin solvation is most favourable in DMSO.
1. Introduction
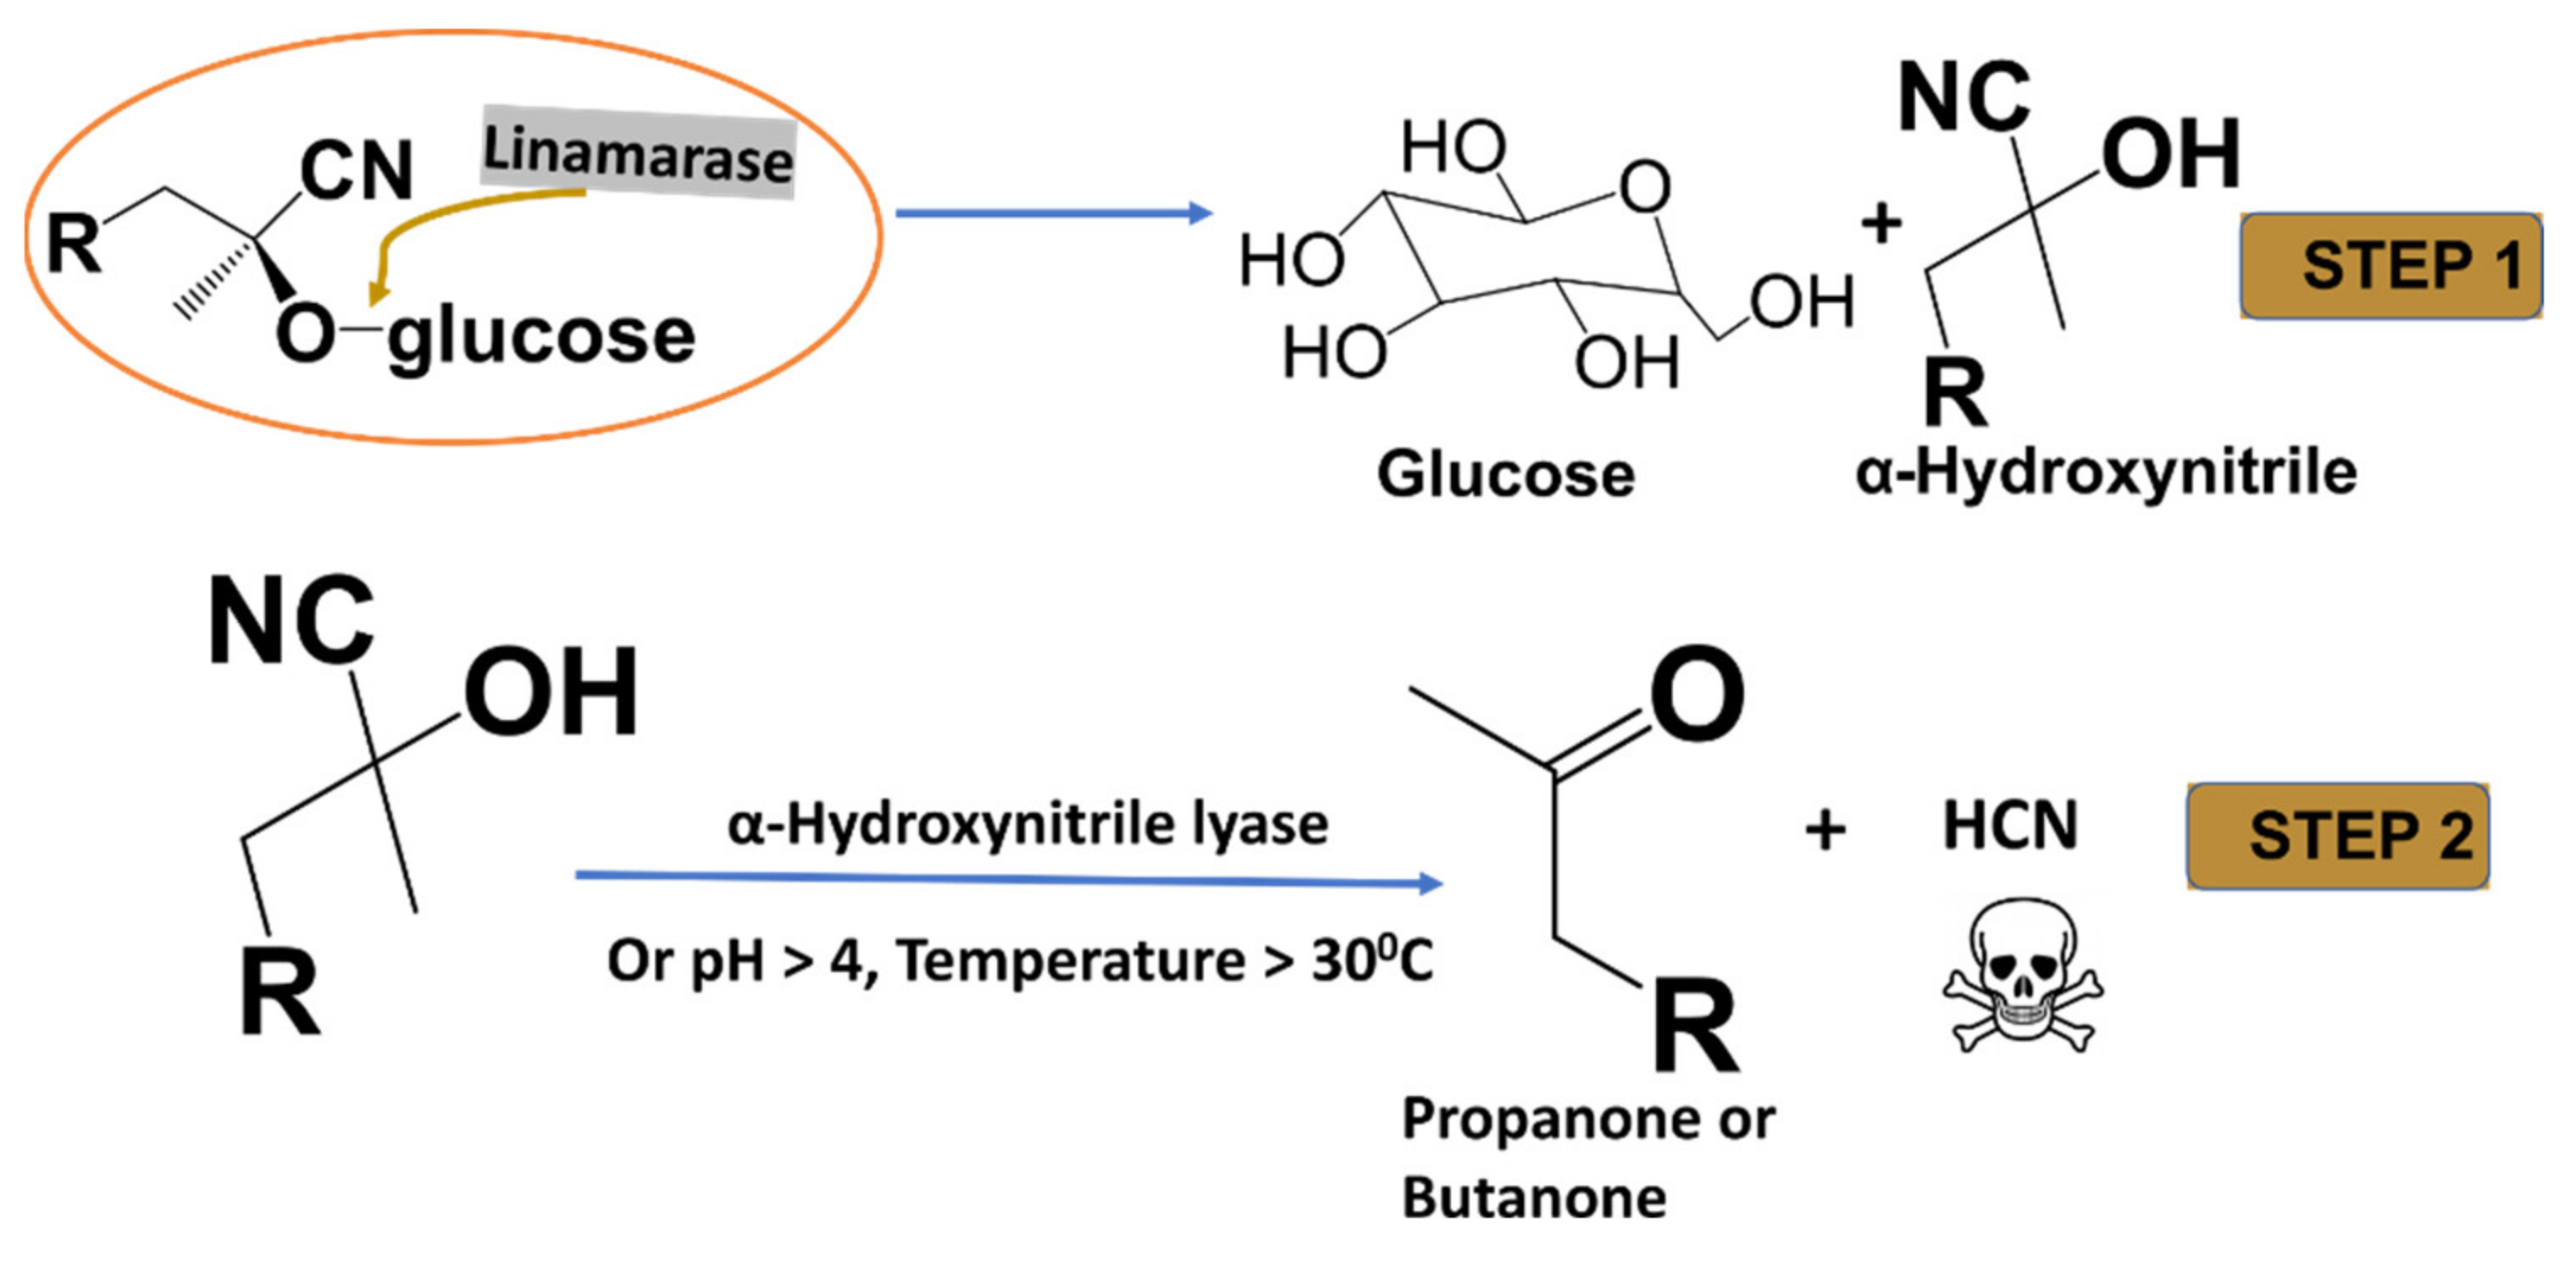
Linamarin and its methylated analogue lotaustralin, are cyanogenic glycosides found in the roots and leaves of cassava (Manihot esculenta), flax (Linum usitatissimum), lima beans (Phaseolus lunatus) and white clover (Trifolium repens) [1]. Cassava is estimated to contain a high amount—about 225 to 1830 mg/kg—of linamarin [1]. The plant’s disruption and damage cause its cells to rupture and allow the hydrolysis of cyanogenic by the enzyme (β-glucosidase) to release unstable cyanohydrin., onsequently, either at favourable conditions or in the presence of hydroxynitrile lyases, degrades to release ketone and toxic HCN (see Figure 1) [2,3,4].
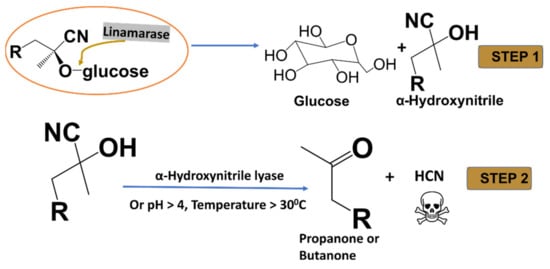
Figure 1.
A complete hydrolysis of linamarin and lotaustralin by linamarase.
Linamarin exhibits anticancer activities and its free cyanide is responsible for such properties [5,6,7]. Small organic compounds (drugs) are characterized by the presence of functional groups that can participate in hydrogen bond formation. These properties determine their solubilities and their interaction capabilities with their target receptors. The hydrogen bonding of a drug occurs conditionally; when the donor and receptor are at certain a proximity in the same compound, it leads to the existence of an equilibrium between the closed conformation (intramolecular hydrogen bonding) and an open conformation, where the polar groups interact with the surrounding solvents.
The closed conformation of linamarin prevents the polar groups from interacting with the surrounding environment, making the drug lipophilic and membrane-permeable, and vice versa for its water-soluble open conformation [8]. These conformations determine physical properties such as water solubility, membrane permeability and lipophilicity. In the study by Ashwood [9], the improved profile of the drug associated with intramolecular hydrogen bonding, is shown to increase brain penetration, pharmacological activities and lipophilicity. The Takeda team’s report finds better oral absorption and a favourable pharmacokinetic profile for luteinizing hormone-releasing hormone receptor antagonists when intramolecular hydrogen bonds are created. Research on cyclic peptides supports the knowledge that an internal hydrogen bond is the best solution to passive membrane permeability [10].
Despite its potential, linamarin suffers from difficulties in isolation and purification [7,11]. Relevantly, several studies have explored the role of solvents on the solvation and solubility of biomolecular compounds in different solvents. For instance, a study by Patsahan et al., reports the marginal solubility of curcumin in water [12]. To complement the study, they apply methanol (MeOH) and Dimethyl sulfoxide (DMSO) to curcumin and their findings confirm a bent conformation in water compared to methanol and DMSO. Thus, the low solubility of the compound is attributed to the increased hydrophobic character of curcumin in water [13].
Hydrogen bonds are vital in determining linamarin’s conformational structure and binding affinity to a receptor. Hydrogen bonding is a critical property in drug optimization, focusing on improving the potency and absorption, distribution, metabolism and excretion (ADME)-Tox profile. For example, the well-known small molecules amlodipine and sildenafil form intramolecular hydrogen bonds, which has been proved to improve their (ADME)Tox profiles [14].
There is very little data available on the solubility and phase equilibrium of linamarin. Modelling, can play an important role in developing efficient separation processes. Therefore, the present work focuses onunderstanding the structural behaviour of linamarin in a range of solvents in order to address challenges that are usually encountered during extraction and purification of linamarin. The work shows that the conformation of linamarin is sensitive to solvent type. Therefore, methods that can consider changes in conformation are necessary during extraction and purification processes. We demonstrate possible errors with solvation free energies, computed using electronic structure calculations. Since solubility is exponentially related to solvation free energy, small differences largely affect the predicted phase equilibrium.
2. Materials and Methods
2.1. Molecular Dynamic Computational Methods
We investigated the conformation and solvation of linamarin in a vacuum, water, methanol (MeOH), dimethyl sulfoxide (DMSO) and dichloromethane (DCM) by atomistic molecular dynamics simulation using Gromacs 2018 [15,16]. First, the structure of linamarin as a monomer was obtained from the PubChem database (CID: 11128) [17] and saved in Protein Data Bank (PDB) format. Next, the coordinates and topology of linamarin were obtained using the OPLS-AA force field [18] using the LigParGen tool developed by Jorgensen and co-workers [19,20,21]. Finally, the structural and topology files of solvents were obtained after submitting their SMILES to the LigParGen webserver [19,20,21], and water was modelled using TIP4P [22]. Solutes and solvents were modelled using a Lennard–Jones plus electrostatic class I potential model using OPLS-AA.
A molecule of linamarin was immersed in a cubic simulation box (using gmx editconf) and independently solvated with pre-equilibrated solvents (using gmx solvate), viz. DCM [23], MeOH [24], DMSO [25] and TIP4P water model [26] by using GROMACS 2018 [15,16]. Linamarin was centered at least 1.0 nm from the box edge, leaving a total of 2.0 nm between the two periodic images. The number of solvents filled in the box differed depending on their sizes; thus, we obtained 191, 779, 210 and 316 for DCM, water, DMSO and MeOH, respectively, and the initial box size was constant (24.1724 nm3) in all systems see (Table S1 in the Supplementary Materials accompanying the electronic version of this manuscript). The systems were energy-minimized using the steepest descent algorithm and then equilibrated, first in canonical ensemble (NVT) and then in isothermal-isobaric ensemble (NPT) for 2.5 ns. We used a stochastic velocity rescaling thermostat at 298 K and a Parrinello-Rahman barostat at 1 bar for temperature and pressure coupling, respectively [27,28]. The production run was performed at an NPT ensemble for 200 ns with an integration time step of 2 fs. The particle mesh Ewald (PME) Darden et al. [29] was used to treat long-range electrostatic interactions with the cut-off distance at 11 Å for electrostatic and van der Waals interactions, while the covalent bonds were constrained by the SHAKE, for DMSO, and LINCS for all other cases [30,31,32]. In all simulations, periodic boundary conditions (PBC) were applied in all directions. All the structural analysis was performed by using TRAVIS software [33]. The OPLS-AA force field was used to model both linamarin and the solvents consistently. For additional details, all simulation files may be found in the supporting information accompanying the electronic version of this manuscript.
2.2. Molecular Dynamics Free Energy Calculations
The final structure from the equilibrium simulations described in the previous section were used as the starting structure of our free energy calculations for linamarin in each solvent. The simulation parameters were the same except the equations of motion were integrated with the GROMACS “stochastic dynamics” integrator, which corresponds to stochastic or velocity Langevin dynamics integrated with the leap-frog algorithm [34]. This change is necessary as a local thermostat is required to correctly control the temperature of a decoupled and weakly coupled solute molecule. The calculations follow exactly the protocol of our recent work and will only be described briefly [35].
The solvation free energy for linamarin, infinitely diluted in each solvent, , was calculated using a multi-stage free energy perturbation method with the multi-state Bennett’s acceptance ratio method (MBAR) [36]. Stage (m)-dependent decoupling parameters, and , controlled the Lennard–Jones (LJ) and coulombic intermolecular interactions, respectively. The decoupling parameters varied from zero to one. When , the solute is fully coupled to the system. When , the solute is decoupled from the system. The LJ intermolecular interactions were decoupled using a “soft-core” potential and the electrostatic interactions were decoupled linearly [37]. The advantage of using a “soft-core” potential to decouple the LJ interactions is that while it yields the correct limiting values of the potential, it additionally allows nearly decoupled molecules to overlap with a finite energy (and, hence, finite probability).
At each stage m an independent MD simulation was performed. The simulation time for each stage m was 17.5 ns, where the first 1.5 ns was discarded from analysis as equilibration. The change in the Hamiltonian with the current configuration between stage m and the other stages was computed every 0.20 ps. This was saved for subsequent post-simulation analysis with MBAR to determine . This analysis was performed using the Python implementation of MBAR A Python implementation of the multistate Bennett acceptance ratio (PyMBAR) and the GROMACS analysis script distributed with it [36]. The GROMACS analysis script has implemented an autocorrelation analysis, so that only uncorrelated samples were used to determine and the corresponding uncertainty [36].
A total of 15 different stages were used for the free energy calculations, where m = 0 corresponds to a non-interacting (ideal gas) state and m = 14 is a fully interacting system. From m = 1 to 10 the LJ interactions were increased from from to 1.0 in 10 equal increments of 0.1. Electrostatic interactions were increased in a square root fashion following following from m = 11 to 14.
2.3. Electronic Structure Calculations
To further showcase the sensitive of the structure of linamarin to the solvent, and more importantly the sensitive of the computed solvation free energy (, or more generally phase equilibria) on small changes in the structure, we additionally performed solvation free-energy calculations using electronic structure calculations in the SMD universal solvent model [38] using Gaussian 16, Revision C.01 Frisch et al. [39].
We first obtained the Daylight SMILES [40] of linamarin from PubChem [17]. With the SMILES, the 3-D structure was generated with Open Babel 2.3.2 [41]. Subsequently, using Open Babel, we performed a systematic conformation search to identify the lowest-energy conformer followed by geometry optimization, all using the General Amber Force Field (GAFF) [42] with Gasteiger partial charges [43]. The force field was only used here to generate a starting structure, and the choice was restricted by Open Babel.
With the same initial structure, the structure was next optimized in vacuum, water, methanol, DMSO and DCM, where the solvents were modeled with the SMD universal solvent model (a continuum solvent model) using Gaussian. First, the structure was optimized using the PM6 semi-empirical method [44]. This was followed by optimization at the M06-2X/def2-tzvp level of the theory/basis set [45]. The equilibrium structure was confirmed by a frequency calculation.
Next, two sets of solvation free-energy calculations were performed. First, using only the vacuum-optimized structure, single-point energy calculations were performed in vacuum and in each solvent. The difference in energy in solution relative to vacuum was used to compute the solvation free energy. The use of the same structure in vacuum and solution was consistent with the original parameterization of SMD, which involved mostly small molecules and neglected conformational changes in solution [38].
In the second set of solvation free-energy calculations, the vacuum-optimized geometry was used for the single-point energy calculation in vacuum, and the geometry optimized in each solvent was used for the single-point energy calculation in the respective solvent. We further note that the difference in solvation free energy resulting from using the vacuum-optimized versus solvent-optimized structure may be obtained from the difference in the computed energy in solution with each structure.
3. Results
3.1. Connection Matrix Analysis (CMat)
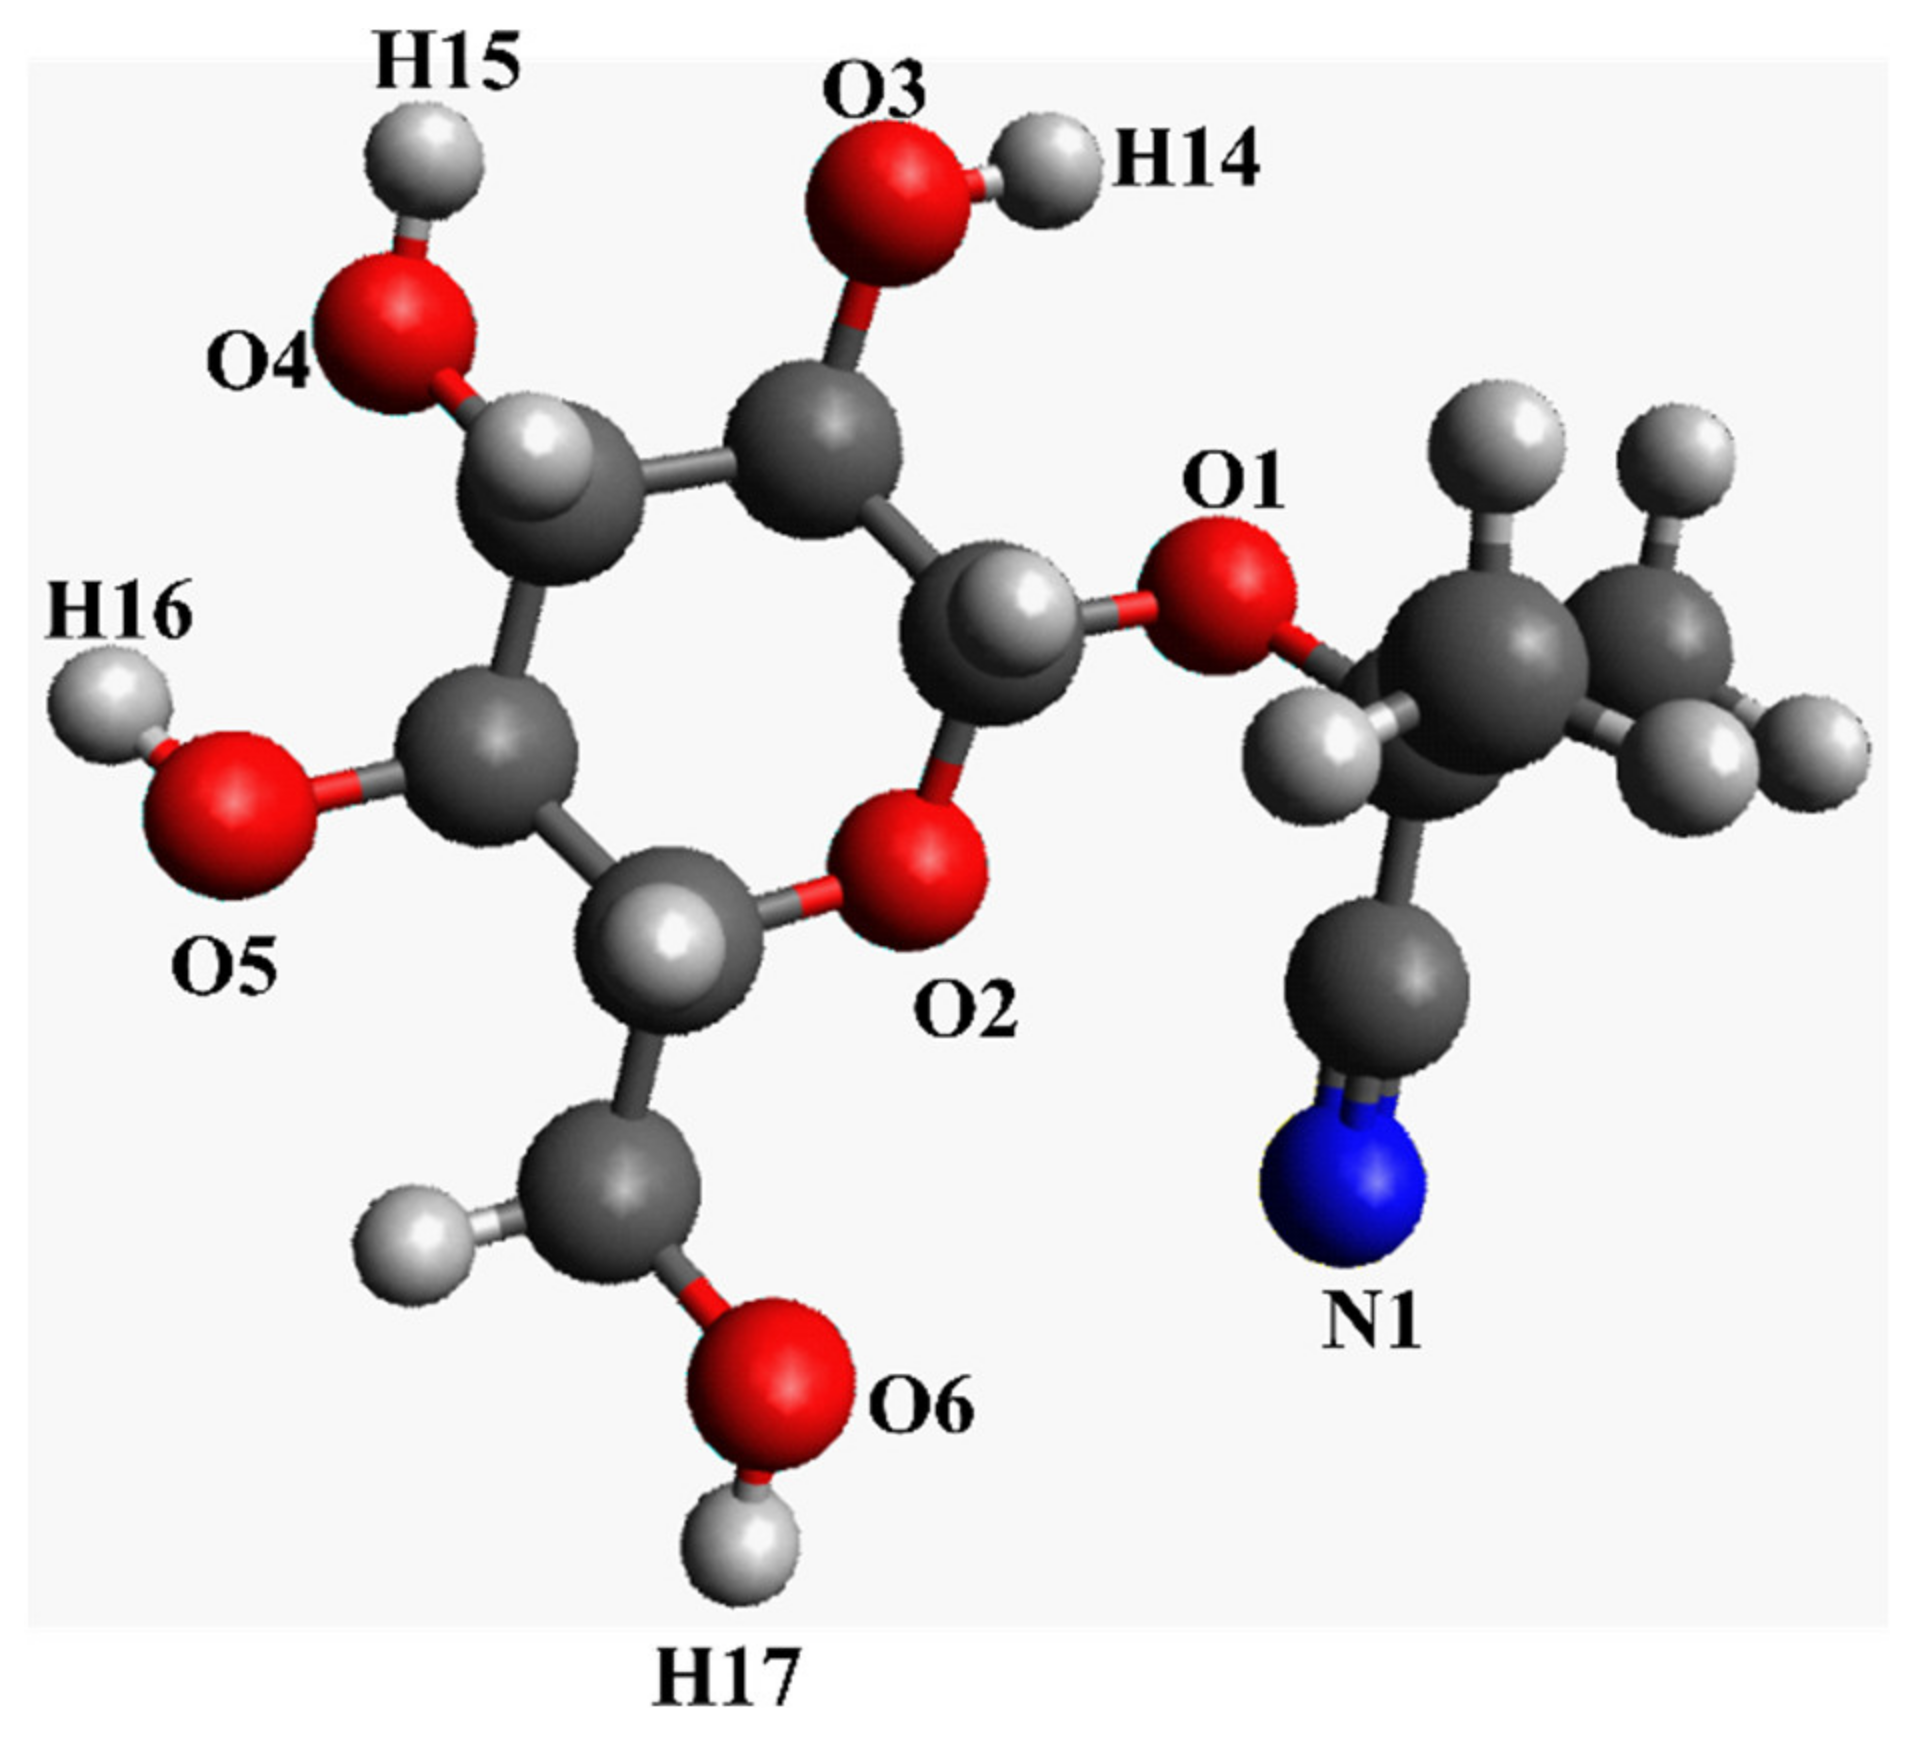
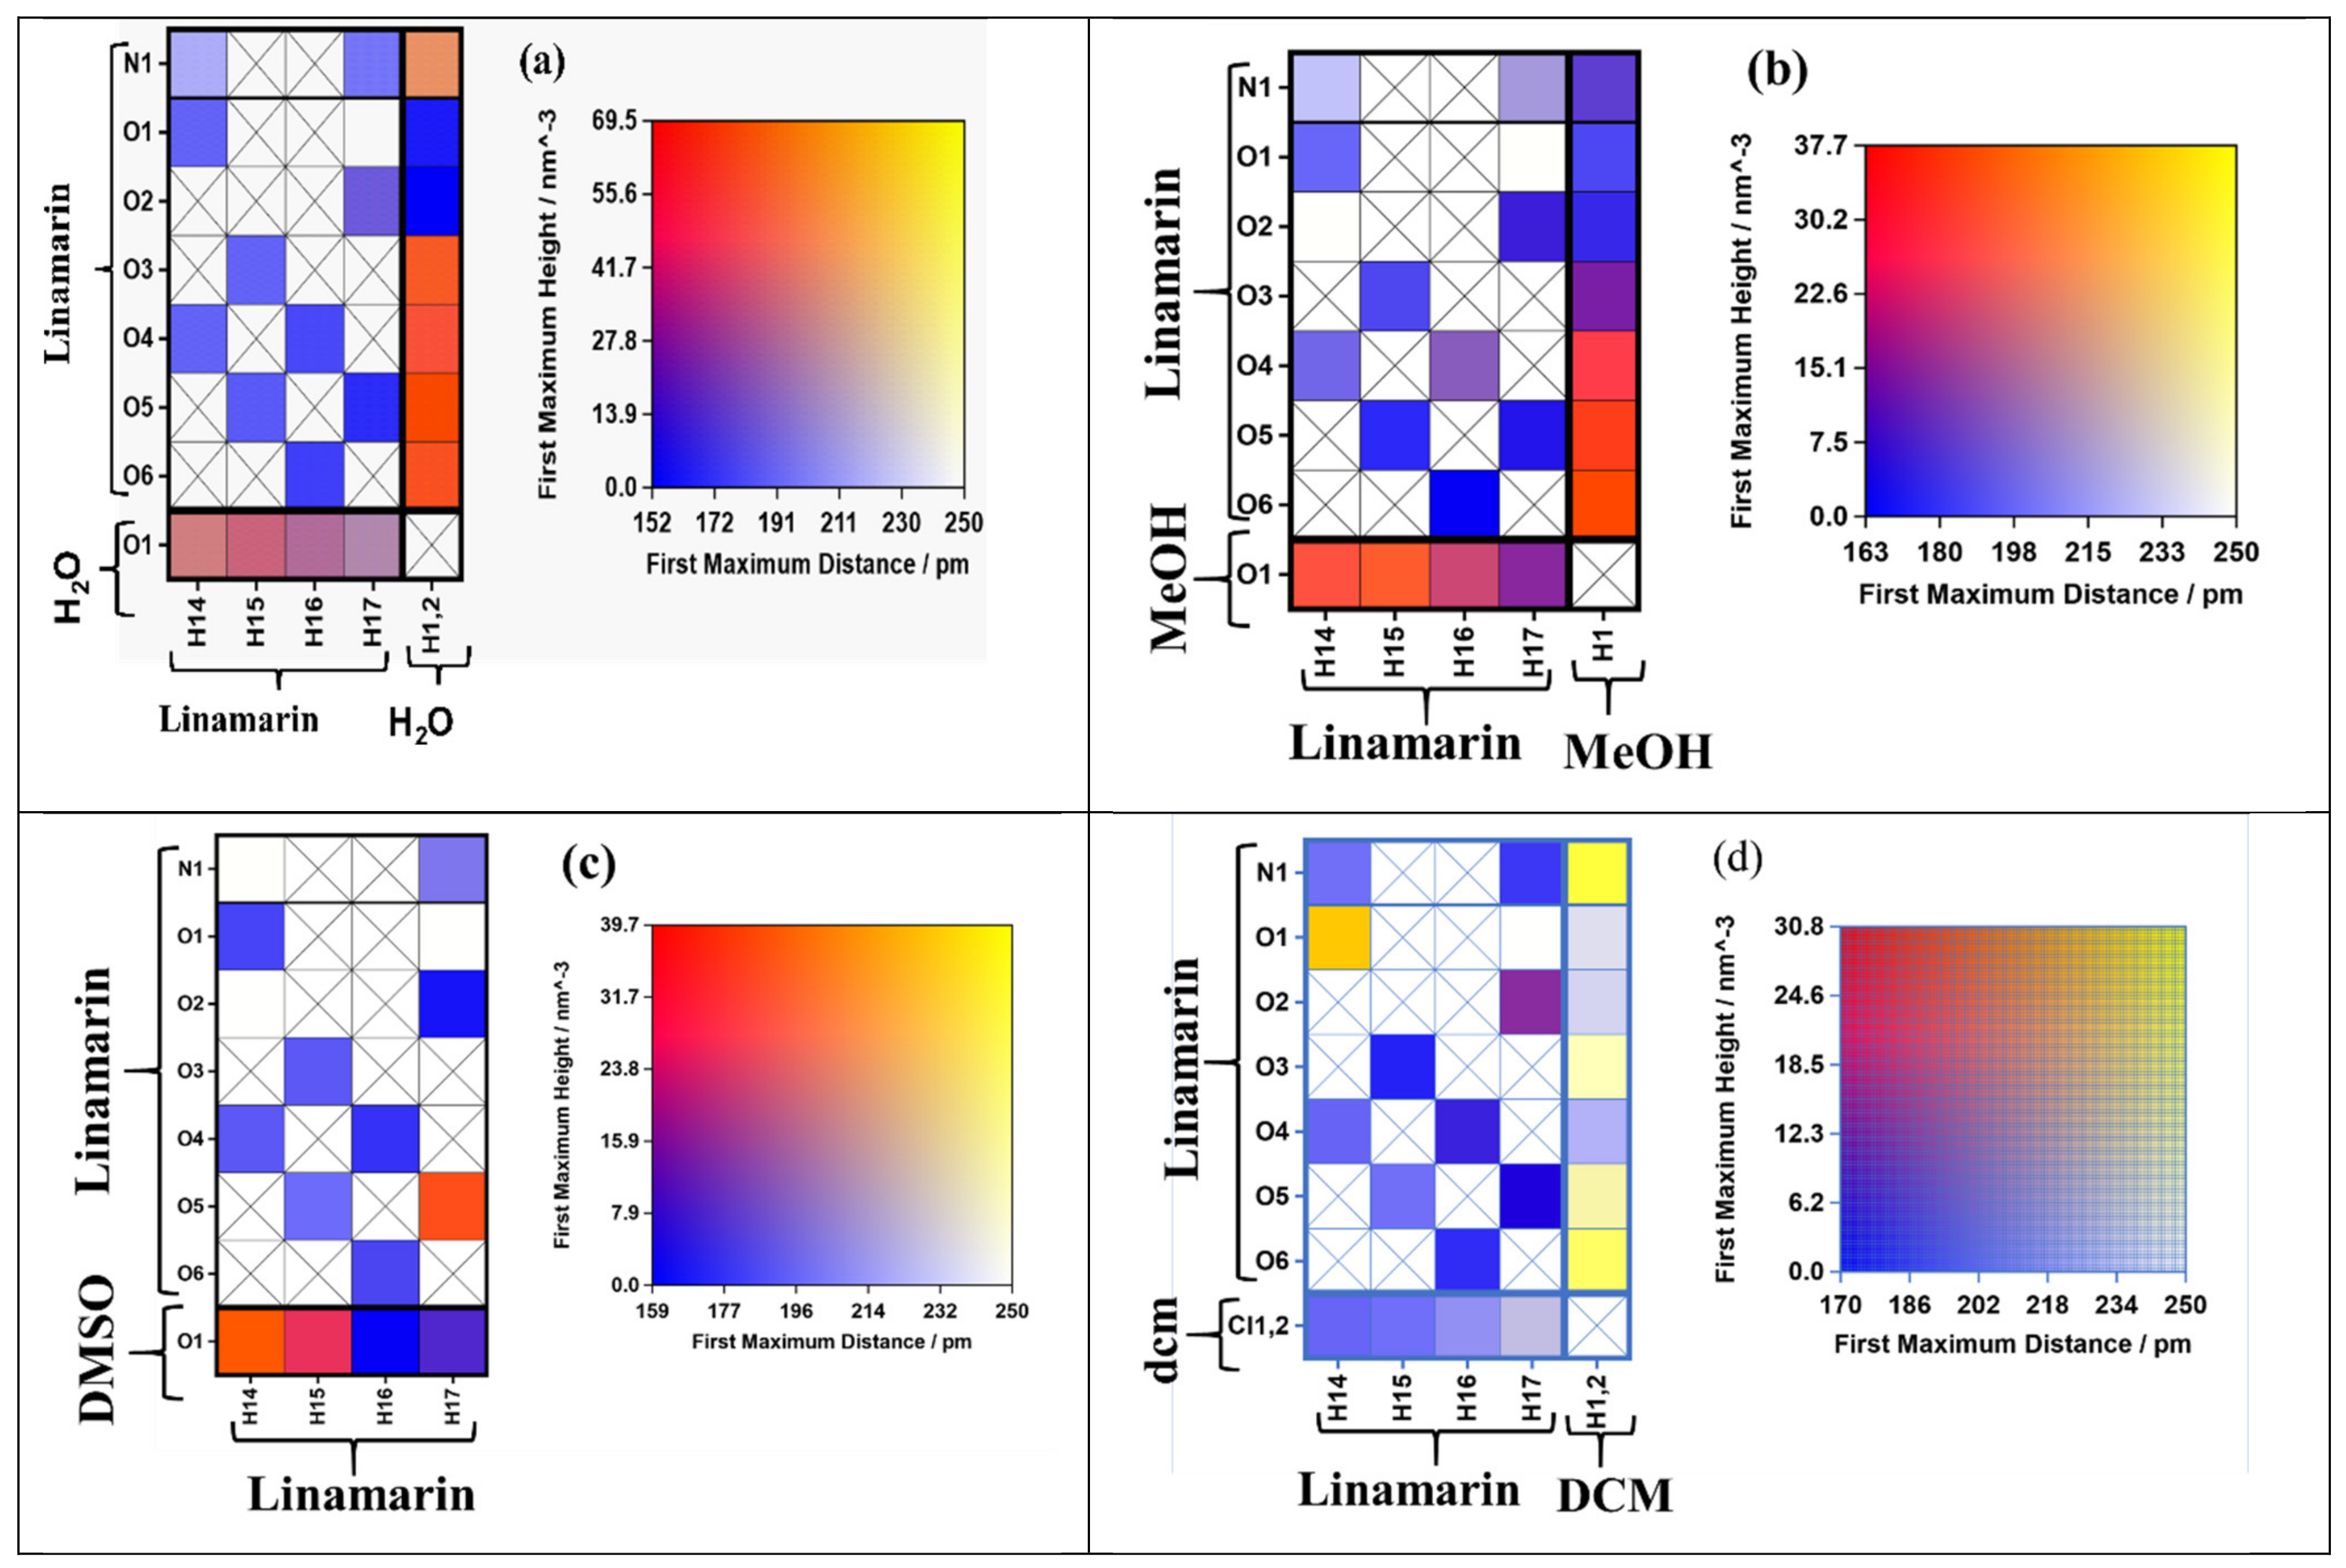
The linamarin molecule contains different atoms that form intramolecular hydrogen bonds as acceptors and donors. To have a precise analysis, we used connection matrix analysis [33] to determine the strength of the interactions of hydrogen and polar atoms within the linamarin compound in different solvents (see Figure 2). The matrix had: the left-hand and right-hand sides and the heat map depicting interaction strength [33]. The rows of the left-hand side matrix correspond to different hydrogen acceptors, while the columns are for all hydrogen donors. The analysis was computed using TRAVIS, which internally calculated the difference radial distribution function (RDF) and provided the height and distance of the first maximum. We exclude 1–2, 1–3 and 1–4 intermolecular interactions and a distance cutoff of 350 pm. The matrix was filled with a black cross if the computed RDF proved no interaction detected. However, if the interaction existed, the matrix was filled with a colour corresponding to the strength of the interaction. The colour scheme on the right panel has two dimensions, which correspond to the first difference RDF maximum’s observed height and distance. For example, the red colour shows firm hydrogen bonding because it is formed at a minimal distance and much larger maximum height. On the other hand, the blue indicates a bond formed at a very short distance but small maximum height, which proves the bond is weak. The yellow corresponds to the hydrogen bond formed at a considerable distance and significant maximum height; thus, the interaction moderated strong.
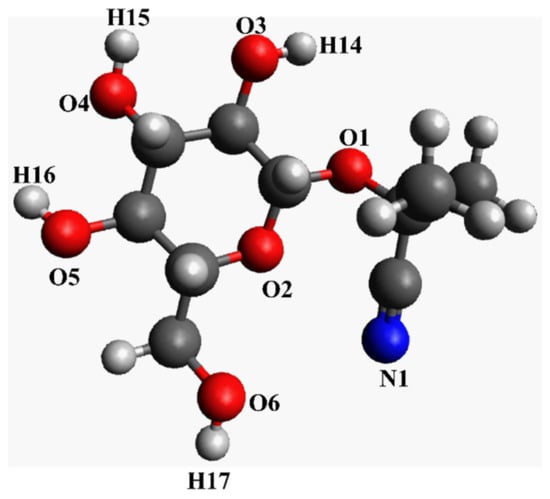
Figure 2.
Chemical structure of linamarin (simple drawing for illustrative purposes).
From the analysis computed properties at the matrix (see Figure 3), the intramolecular and intermolecular hydrogen bonding behaved differently in each solvent. For example, in MeOH, we have the column for receptor N1, O1, O2, O3, O4, O5, O6 from linamarin consider Figure 2 and O1 for MeOH, while the rows for donors are H14, H15, H16 and H17 for linamarin (consider Figure 2 and H1 for MeOH). The computed parameters were unnormalized RDF calculated out of 350 pm and calculated by looking at the height and distance of the first picka. Figure 3b, for linamarin in MeOH, indicates that H1 from MeOH had strong intermolecular hydrogen interaction with linamarin’s O4, O5 and O6. On the other hand, weak intramolecular hydrogen bonding is characterized by purple, which corresponds to short distance but lower intensity, specifically H16 with O4 (see Figure 1). For the analysis of linamarin in DMSO, see Figure 3c, the y axis has the hydrogen acceptors N1, O1, O2, O3, O4, O5 and O6 from linamarin and O1 for DMSO, and the x axis has only donors from linamarin.
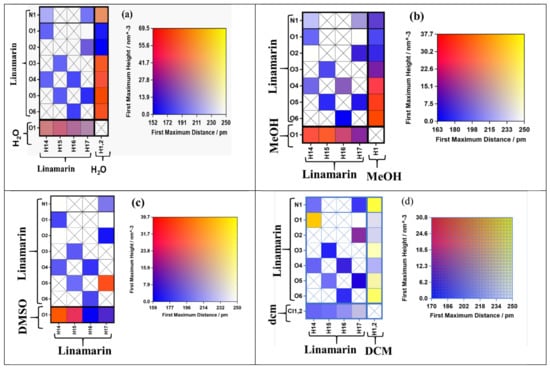
Figure 3.
The connection matrix analysis of linamarin in (a) water (b) Methanol (MeOH), (c) Dimethyl sulfoxide (DMSO) and (d) Dichloromethane (DCM). The columns correspond to hydrogen bond donors, and rows stand for hydrogen bond acceptors. The square boxes are filled with colours representing the intensity and distance of the maximum solvation shell of radial distribution function (RDF).
It is observed that O1 formed intermolecular hydrogen bonding with H14 and, to a lesser extent, with H15. In DMSO, there was a solid intramolecular hydrogen bonding between O5 and H17, the purple colour between N1 and H17, O5 and H15, O3 and H15 and O4 and H14 indicates weak intramolecular hydrogen bonding. More, analysis was performed in DCM; in Figure 3d, on the y axis, are the acceptors N1, O1, O2, O3, O4, O5 and O6 for linamarin and Cl1, 2 for DCM, while on the x-axis, are the donors H14, H15, H16 and H17 for linamarin and H1,2 for the carbon of DCM. There is no significant interaction by hydrogen bonding, except in some regions where yellow is observed between H1,2 and N1, which shows strong intensity at a considerable distance. On the other hand, there is some potential intramolecular hydrogen interaction between H14 and O1, shown in yellow colour, and between H14 and O4 and H15 and O5. Generally, DCM has Cl1,2 weak proton acceptors, and has H1,2 weak proton donors.
Another analysis was performed with linamarin in water; from Figure 3a, the y axis has N1, O1, O2, O3, O4, O5 and O6 for linamarin and O1 for water, while the x-axis has the hydrogen donors H14, H15, H16 andH17 for linamarin and H1,2 for water. There is more intermolecular hydrogen bonding in water than in any other solvent; the two hydrogens from water interacted strongly with all oxygens of linamarin, O3, O4, O5 and O6, but not O1 and O2, and, to some extent, with N1. On the other hand, the hydrogen of linamarin interacted poorly with the oxygen of water. There was also a weak intramolecular hydrogen bonding, indicated by purple colour, between N1 and H14, H17 and O4 and H16.
Generally, there was strong intermolecular compared with intramolecular hydrogen bonding in almost all the studied solvents. Moreover, the intensity of intermolecular hydrogen bonding was more observed in water and MeOH. Both water and MeOH worked by both principals—donors and acceptors—however, water has two potential hydrogens to be involved in intermolecular hydrogen bonding, while MeOH has only one hydrogen. The above observation contributed to the higher intensity of interaction observed in water when compared with MeOH.
It is important to notice that, in the interaction between some sites of linamarin and solvents, the solvents had strong contributions to both intermolecular and intramolecular hydrogen bonding, as these two properties complement and influence each other.
3.2. Plane Projection Analysis (PlProj)
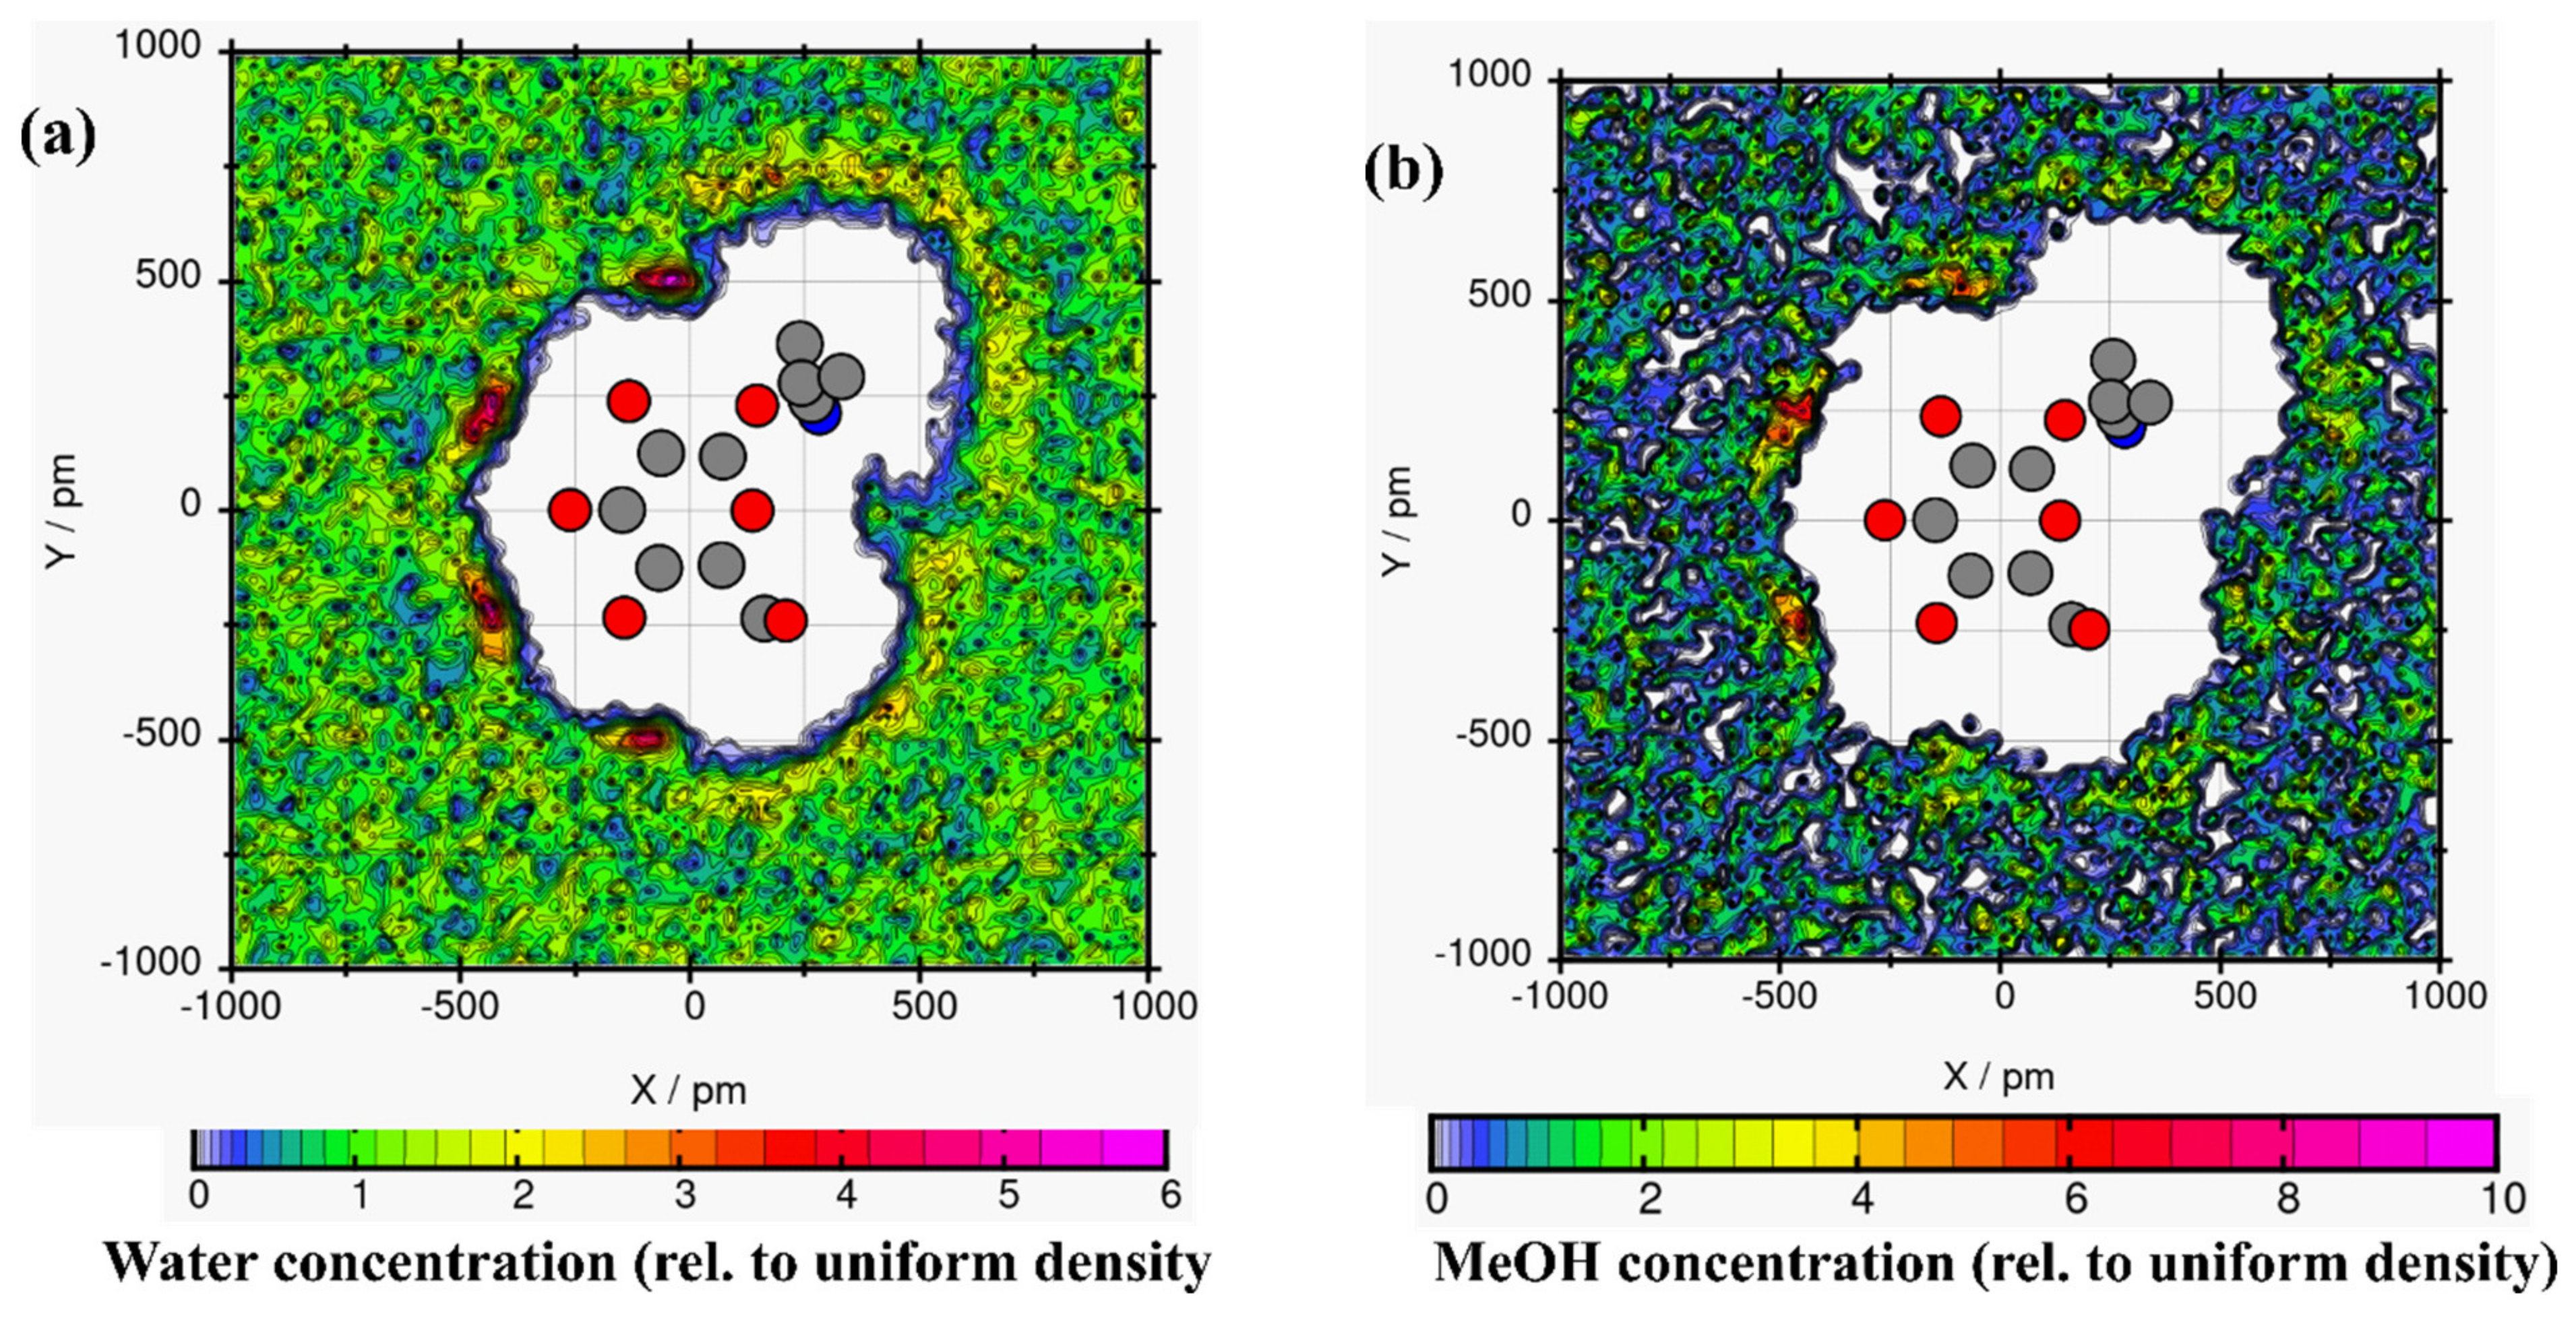
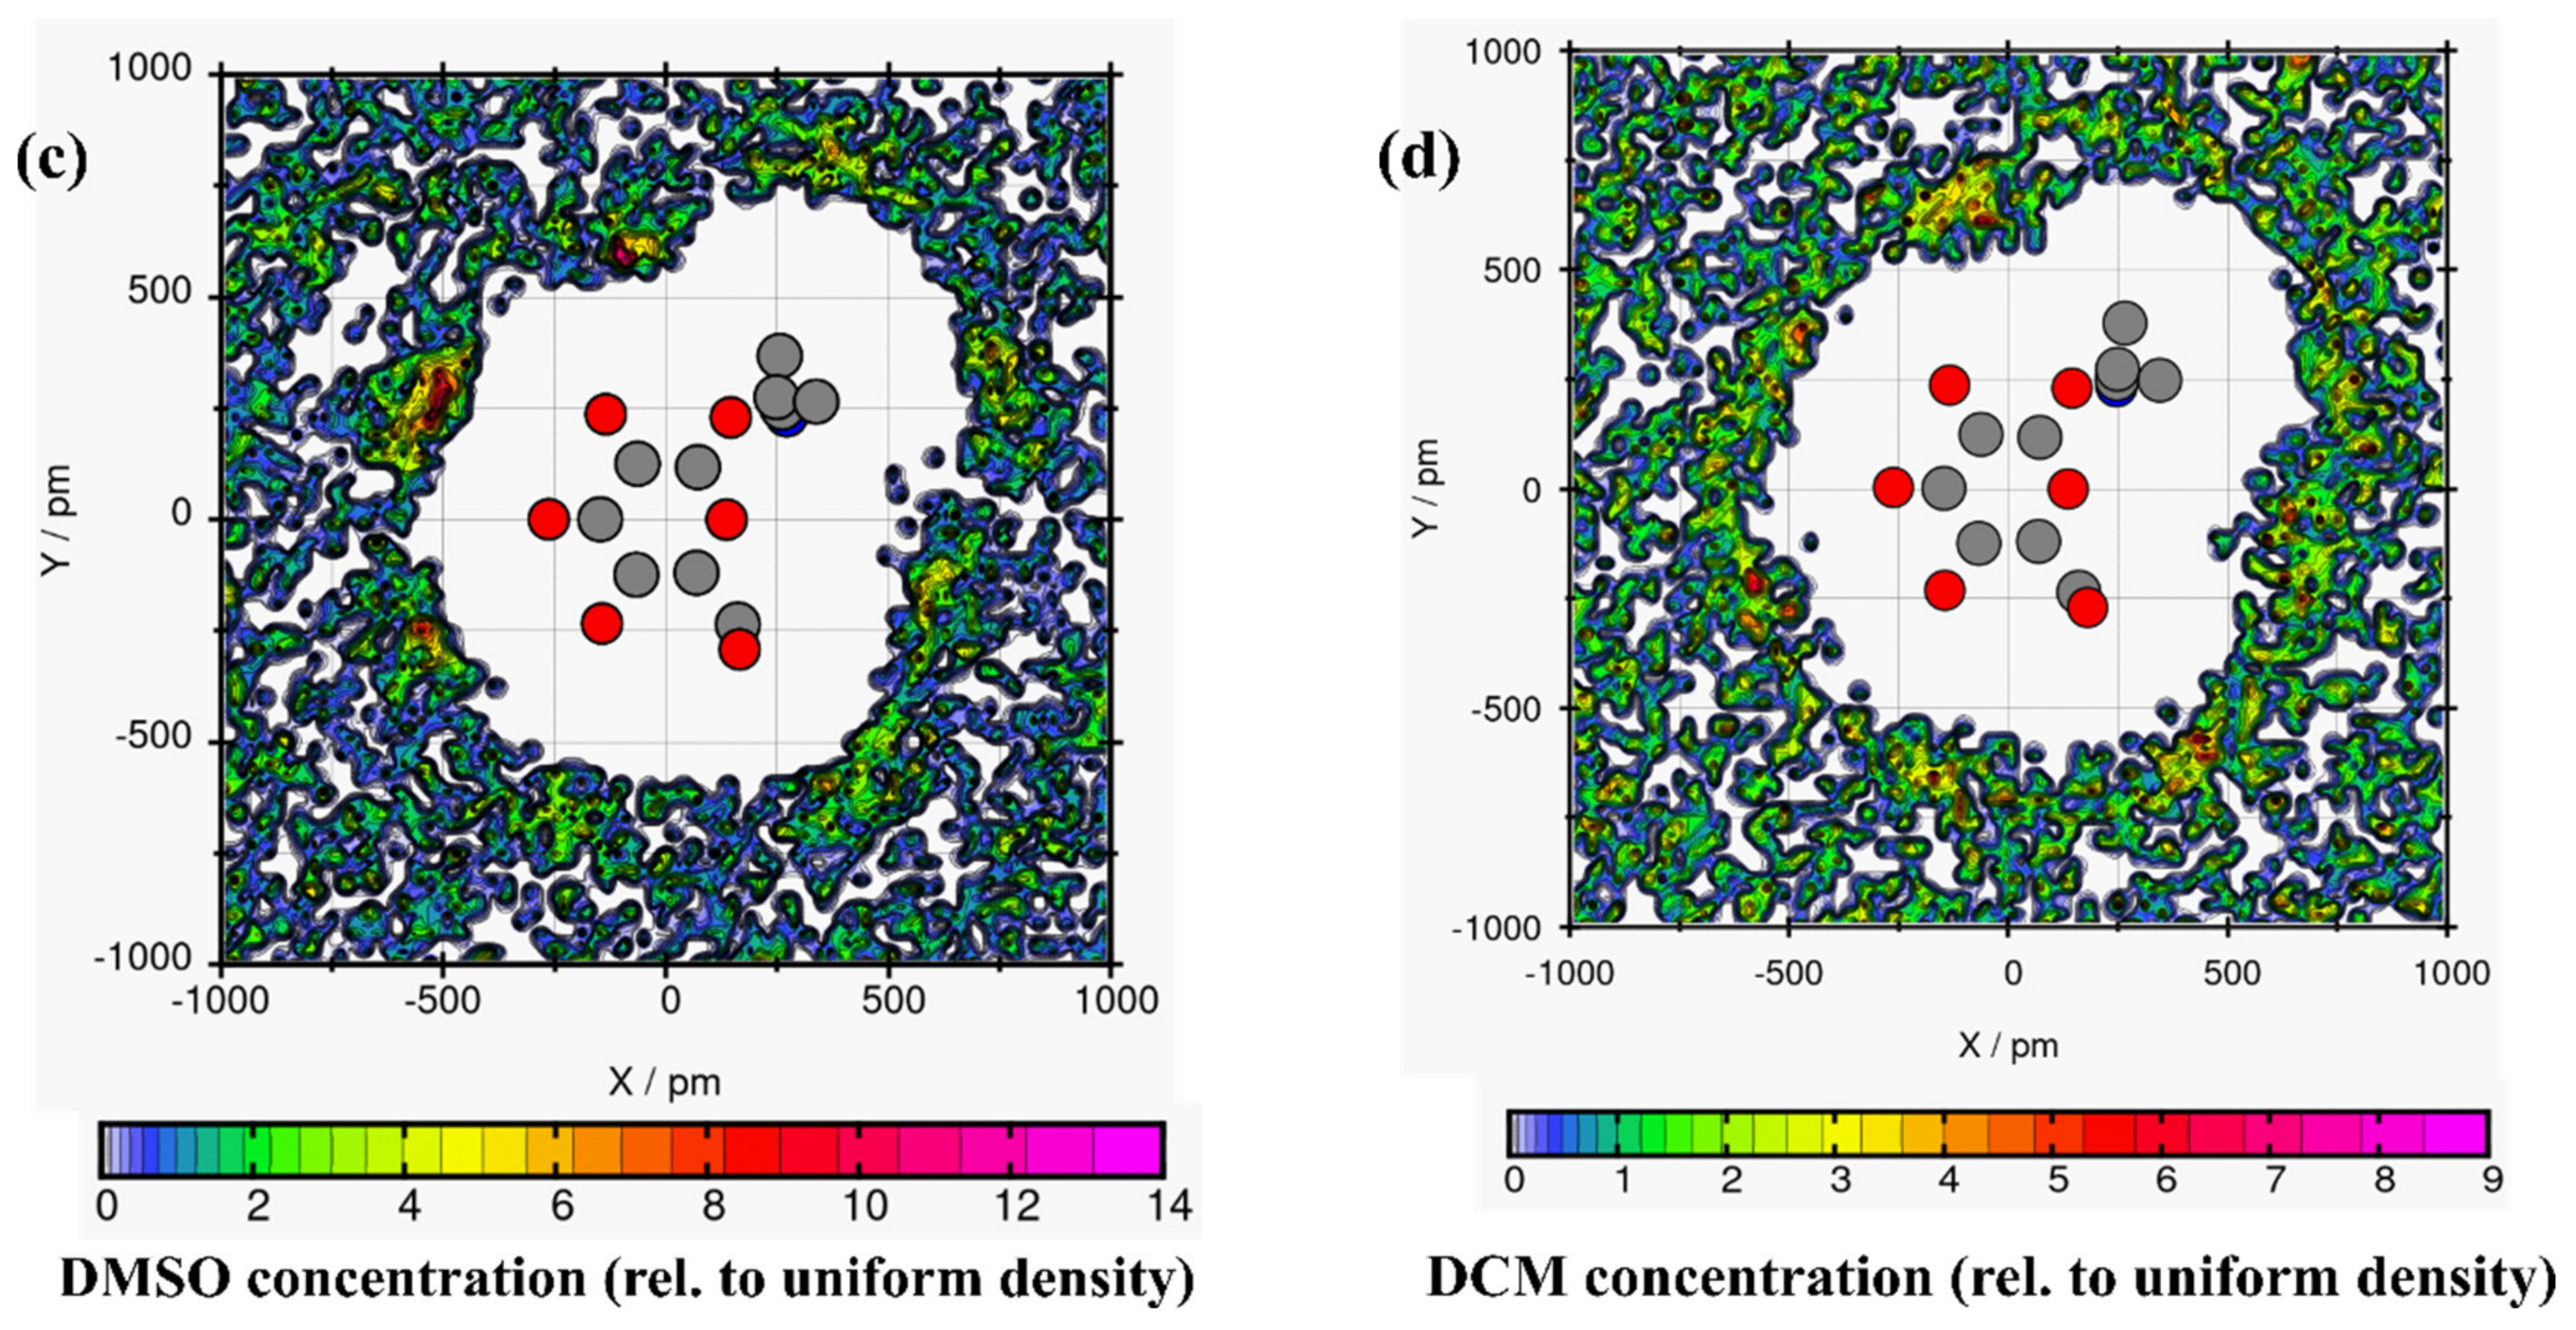
Plane projection analysis helped to understand the arrangement of the solvent molecules around linamarin [33]. Unfortunately, the common RDF and spatial distribution function (SDF) provided only the solvation shells around linamarin but not the in-depth analysis of the orientation of each solvent around it. For example, consider Figure 4, where linamarin in MeOH has three prominent regions of linamarin that highly surround, mainly, its oxygen atoms. The observed three regions match exactly with Connection Matrix Analysis (CMat) (Figure 3b) for O4, O5 and O6.
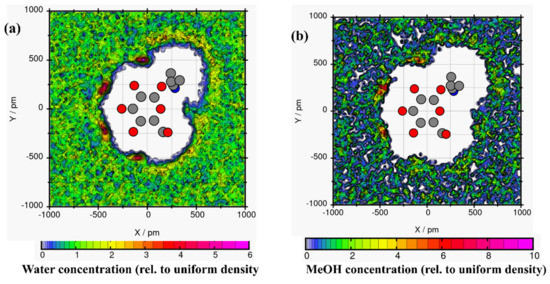
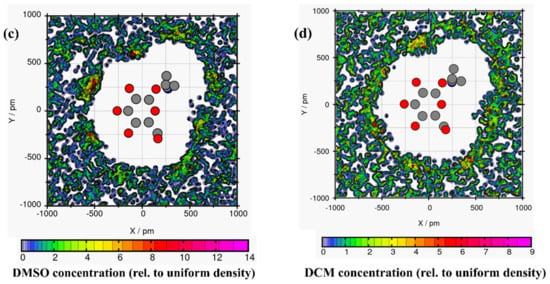
Figure 4.
The average solvent molecules around linamarin (a) water, (b) MeOH, (c) DMSO and (d) DCM atoms displayed here are heavy atoms; C (grey), N (blue) and O (red) atoms of linamarin are drawn as a reference.
The DMSO (Figure 4c) analysis had almost the same properties as observed in MeOH. DMSO surrounded three regions of linamarin but was more pronounced around two regions; these findings correlate with the findings, observable in Figure 3c, for H14 and H15, which were approached more by DMSO. Further analysis was done in DCM (see Figure 4d); we found that DCM did not have any significant interaction with the atoms of linamarin. These observations are consistent with the CMat analysis, which depicted no significant intermolecular hydrogen bond, proving that DCM did not approach the sites of linamarin. Further analysis included linamarin in water; Figure 4a shows four regions of linamarin’s atoms that were more approached by water molecules. The observation correlates with the solid intermolecular interactions of O3, O4, O5 and O6 as acceptors of hydrogens from water, supported by the evidence of interactions in Figure 3a.
3.3. Radial Distribution Function
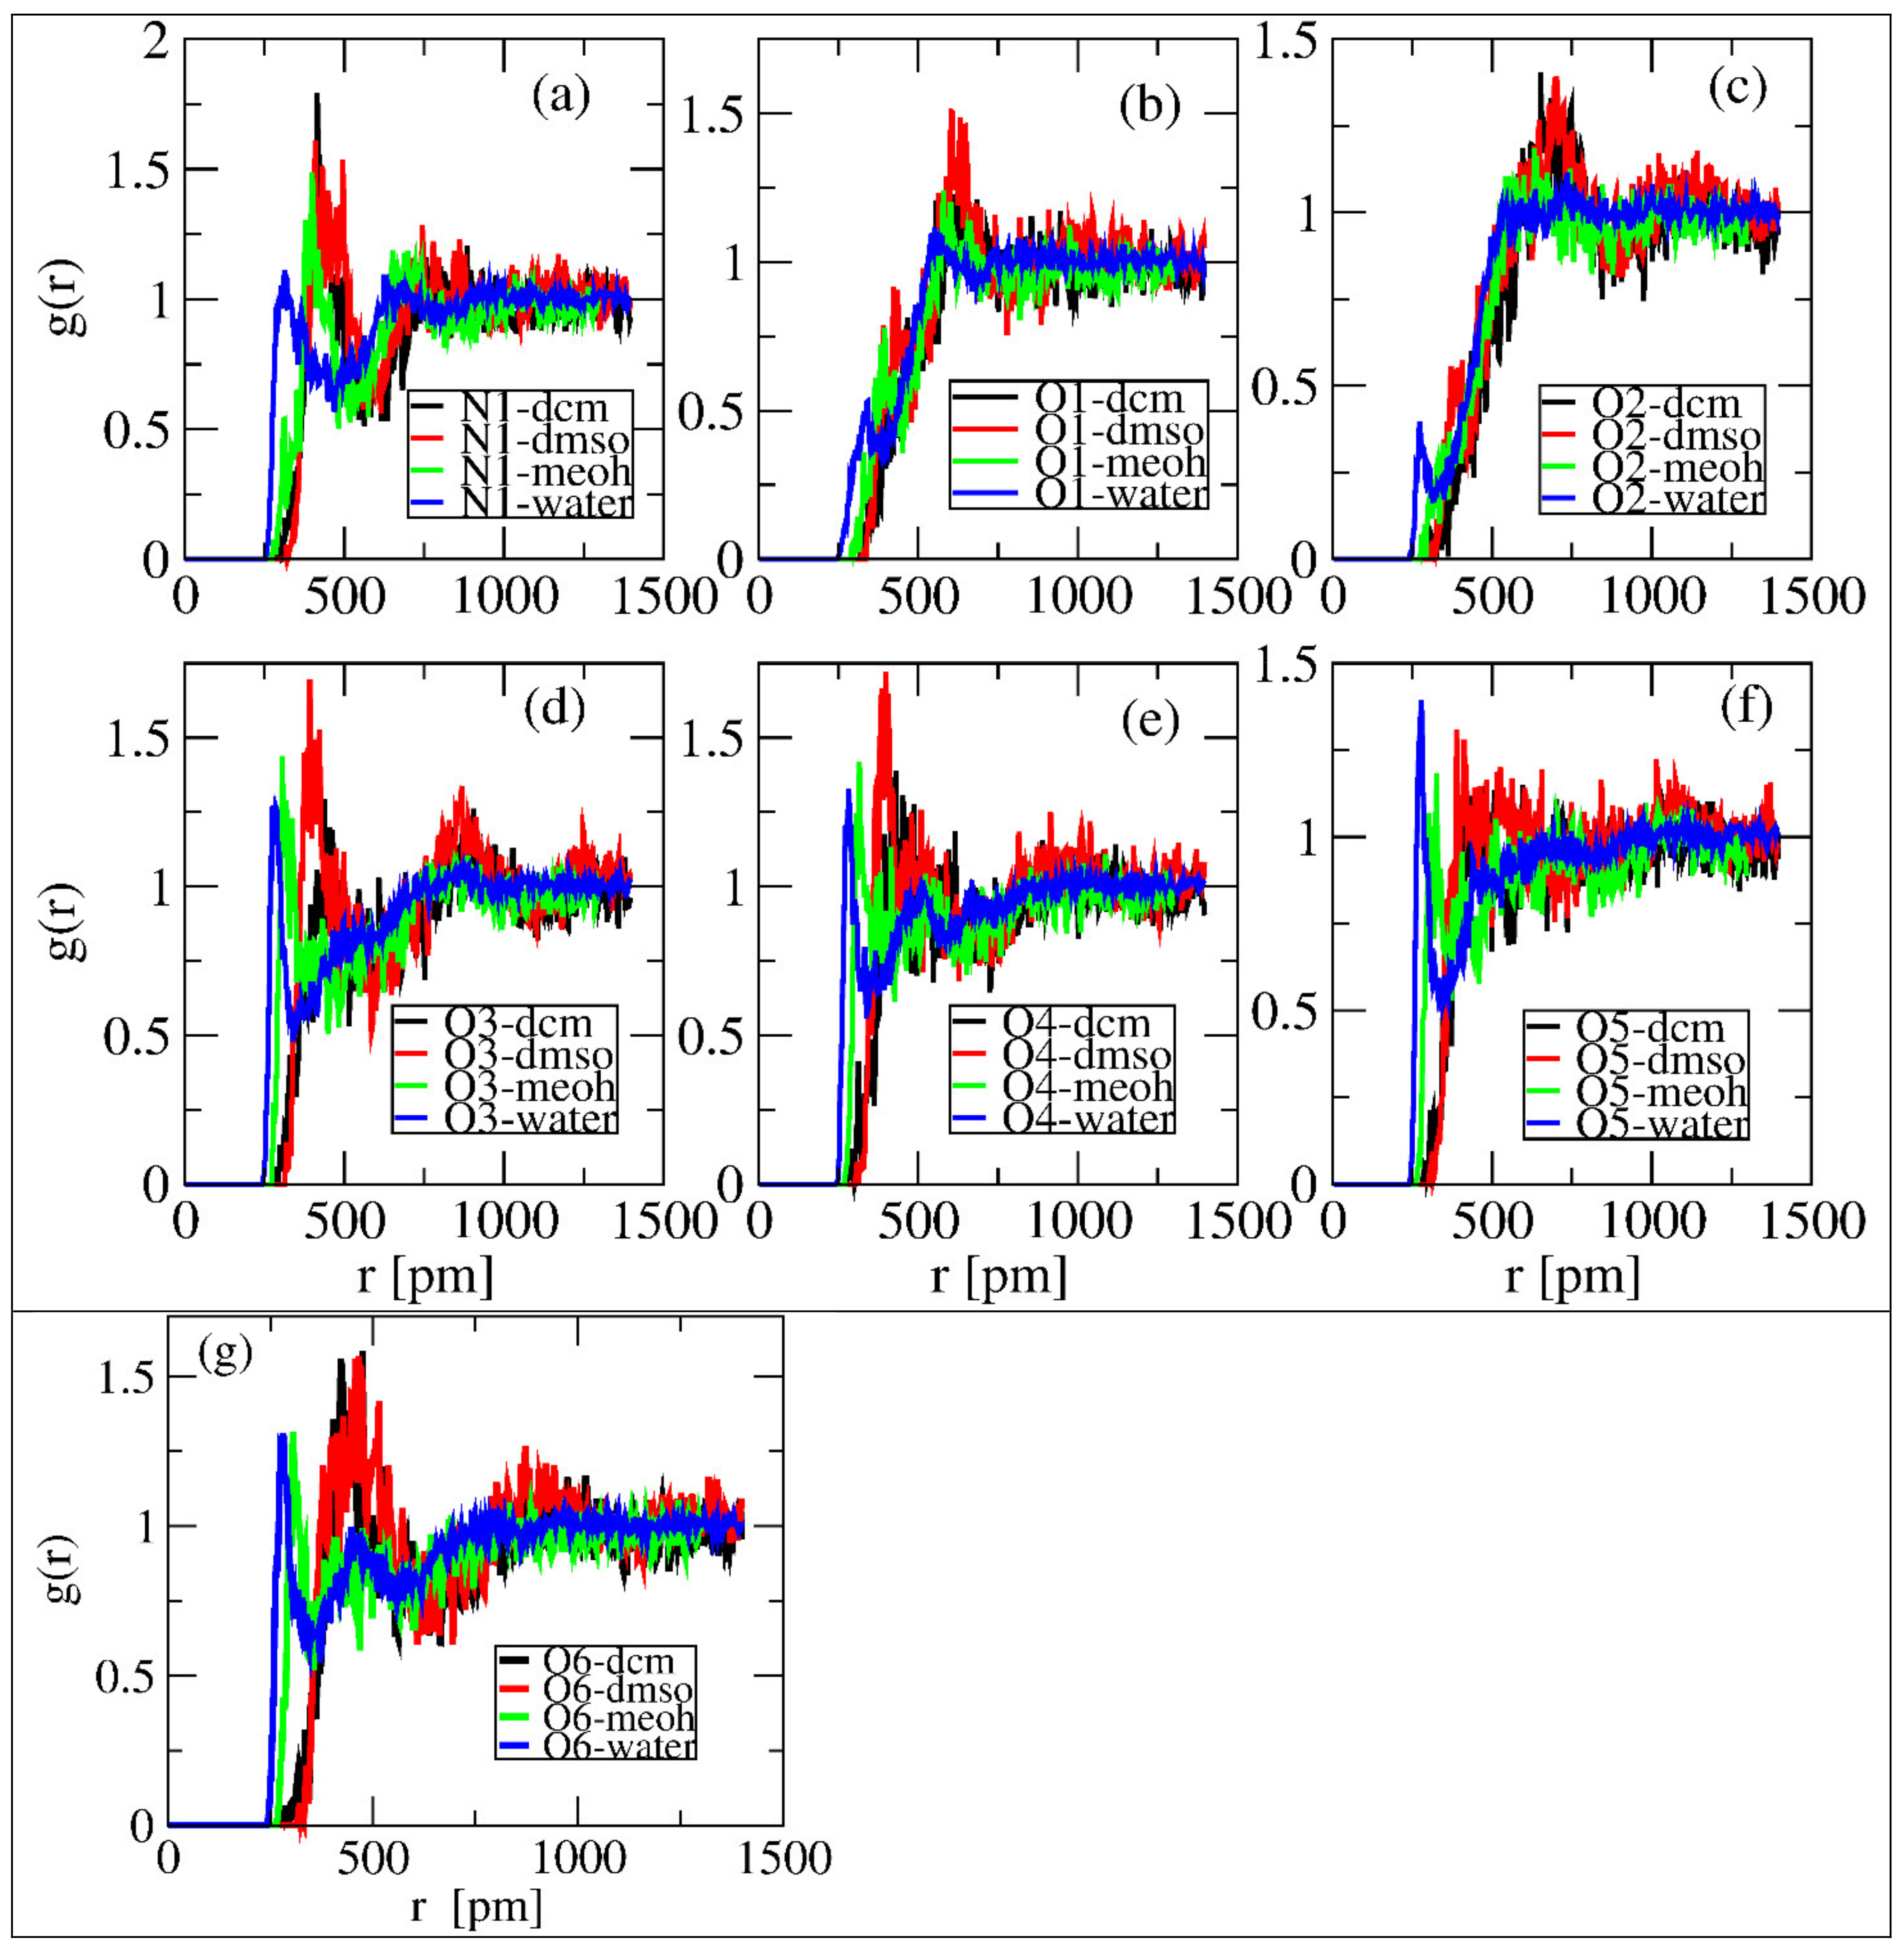
In order to characterize the properties and intermolecular interaction properties of linamarin in the four solvents, radial distribution functions (RDF) were investigated using TRAVISsoftware [33]. By definition, RDF g (r) is the local density relative to bulk; the larger the g (r) value, the higher the probability of finding an atom/molecule at a certain distance from the reference point, signifying more substantial interactions. Therefore, for this study, we computed the RDFs of specific sites of linamarin (see in Figure 2) and the centres of mass of the solvents. The analysis helped capture the information of both hydrogen accepting and donating within a single analysis, which is also useful in comparisons such as water, having two hydrogens to donate, with MeOH, having only one.
The normalized RDFs of the selected linamarin sites and the center of mass (COMs) of the solvents was computed and are depicted in Figure 5. The overall observation of the computed RDFs aligns with the observations in Section 3.1 and Section 3.2. In all selected sites except O1 and O2, water and MeOH, denoted by blue and green lines, respectively, were observed to form the first solvation shell at relatively minimal differences in intensity and distance. The formation of the first solvation shell at a shorter distance reflected the stronger intermolecular hydrogen bonding of these solvents to the mentioned sites. These observations are supported by the findings shown in Figure 3a,b for water and MeOH, respectively, indicating the presence of intermolecular hydrogen bonding. The local densities were used to quantify the number of solvent molecules within a given distance.
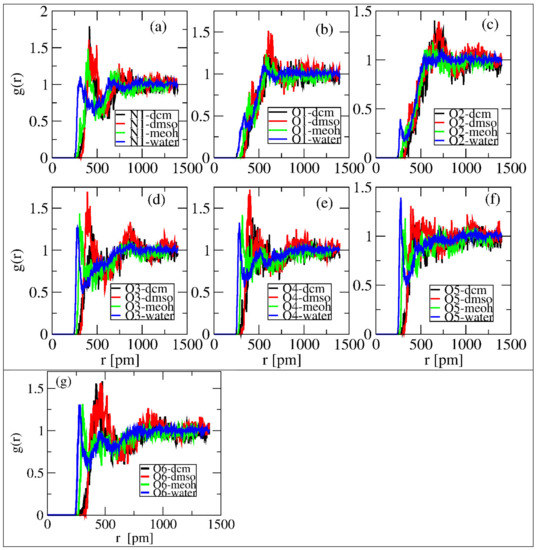
Figure 5.
RDF of polar atoms around linamarin and centres of mass of solvents correspond to (a) N1, (b) O1, (c) O2, (d) O3, (e) O4, (f) O5 and (g) O6 of linamarin, as a reference set.
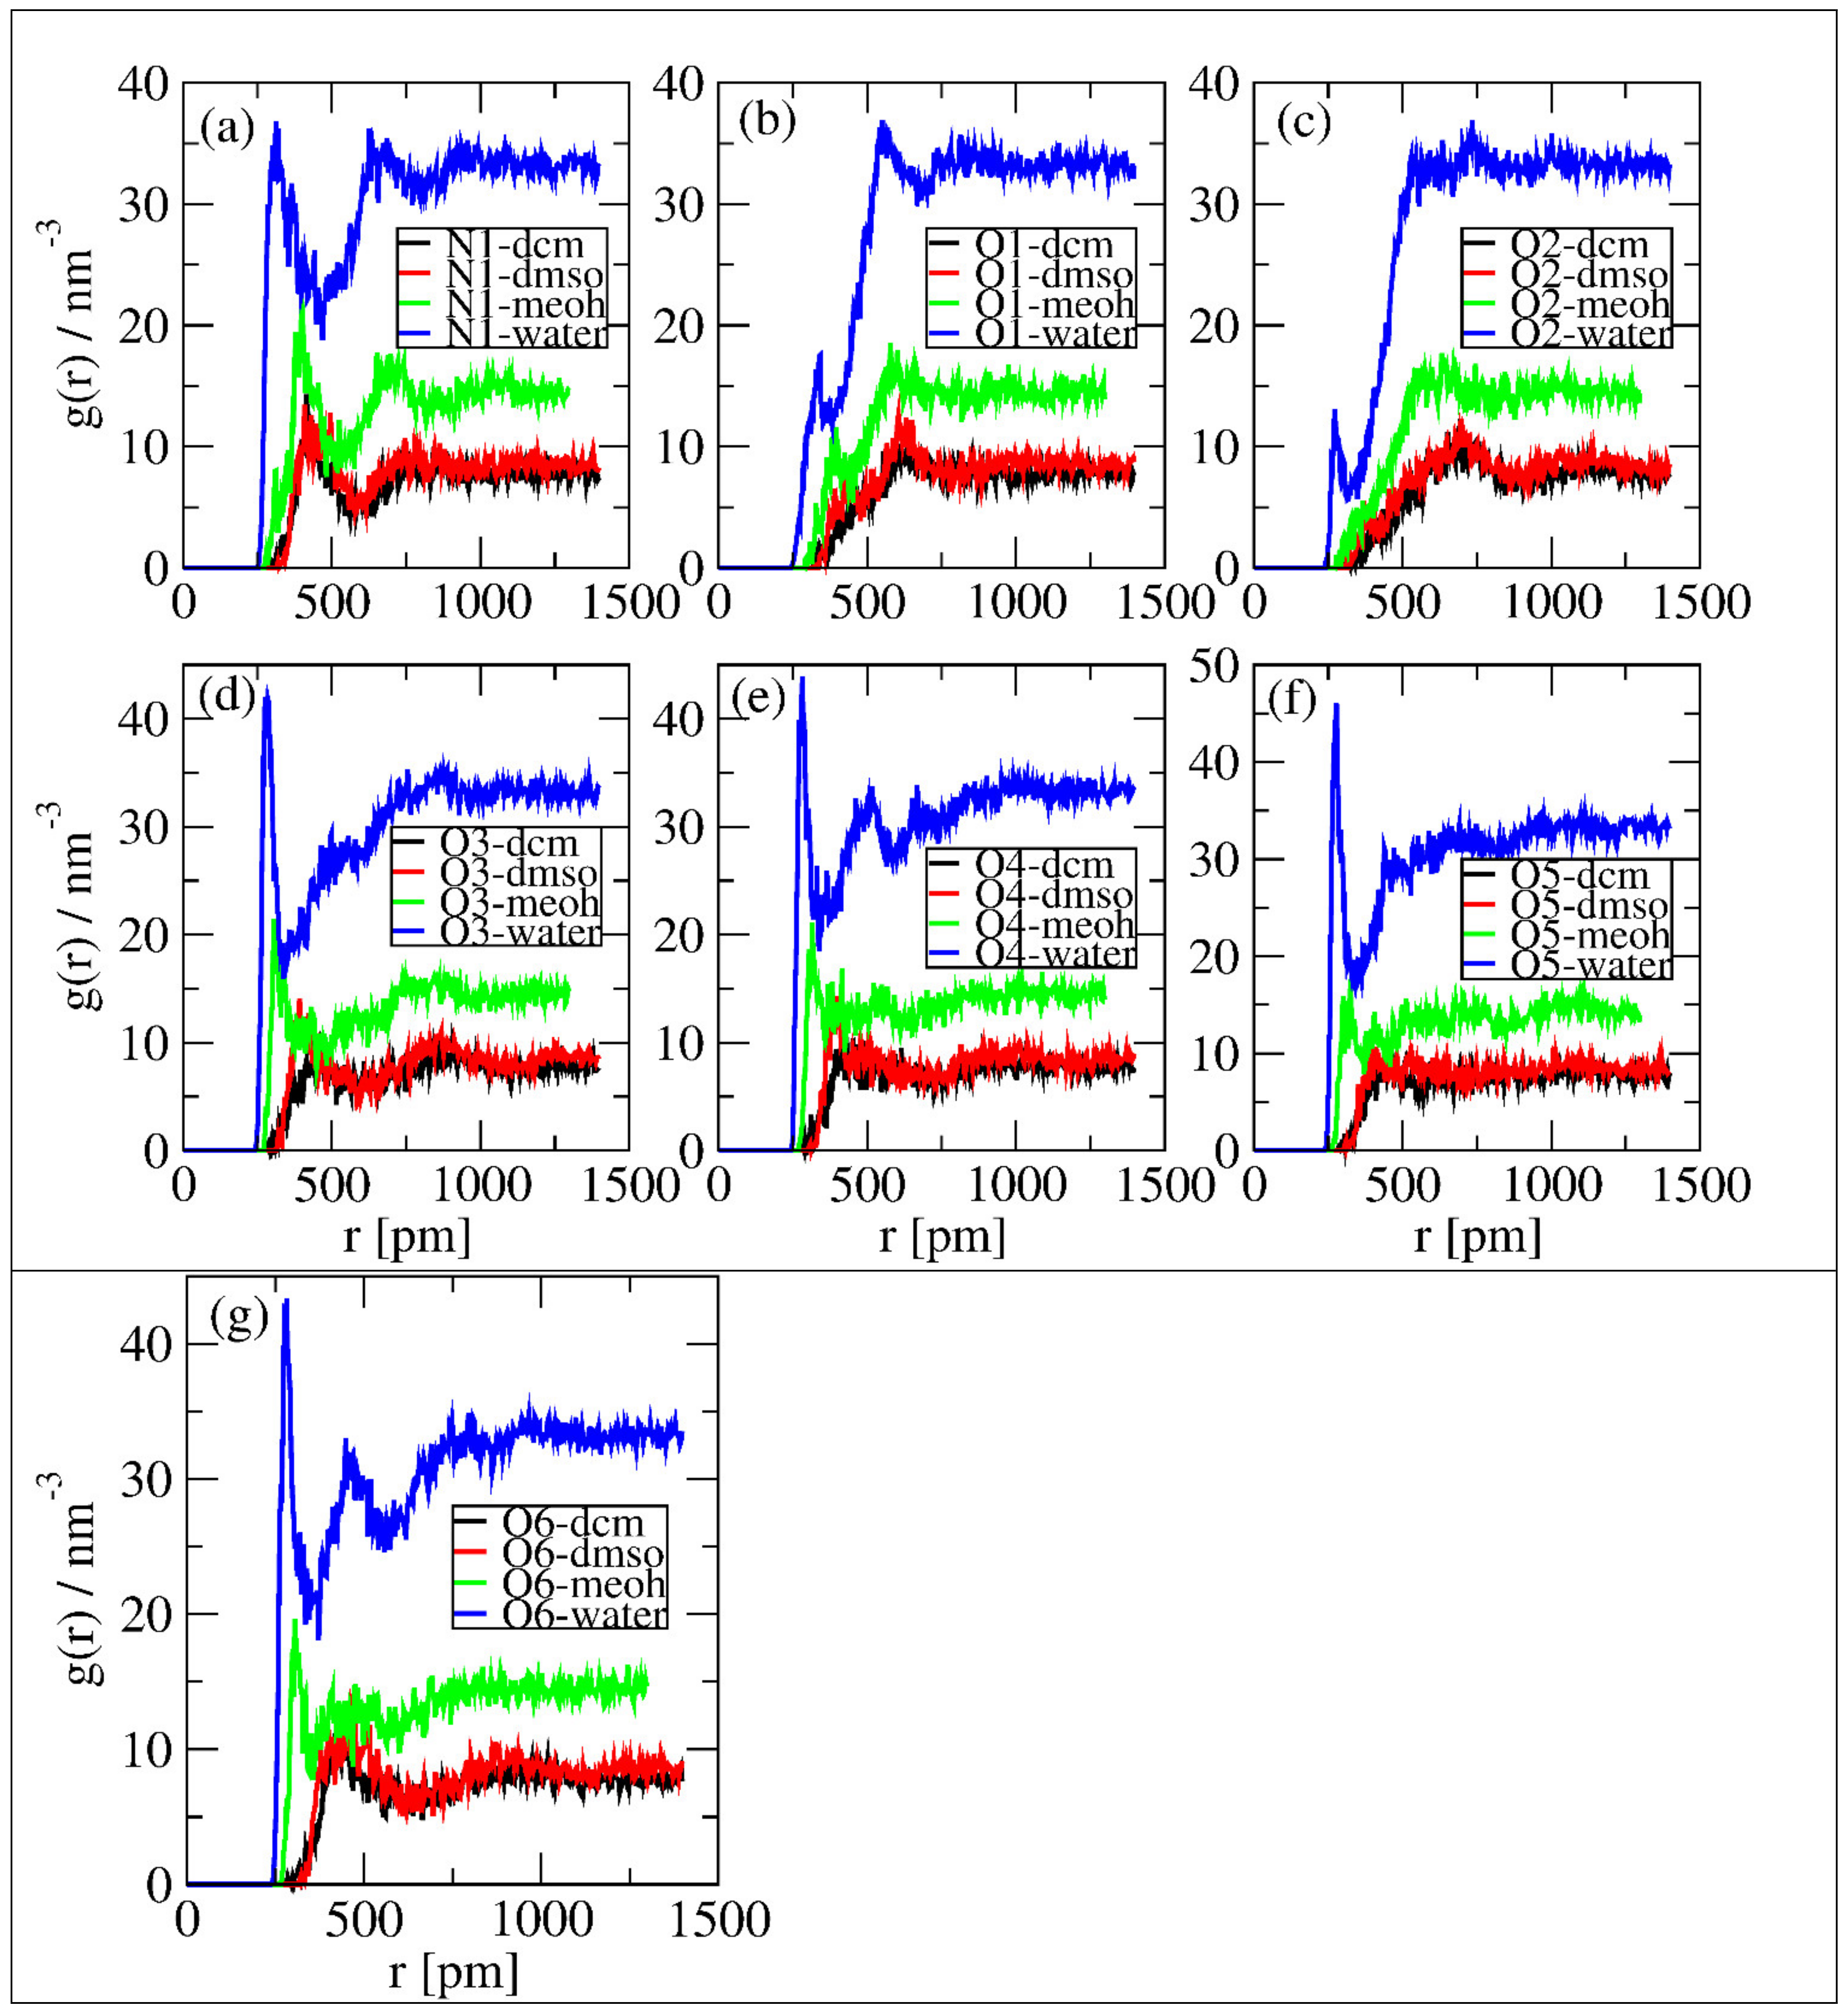
Figure 6 shows the same observations as in Figure 5, but, here, it is evident that in Figure 6a,d–g, intensive peaks formed around 250 to 350 pm. Moreover, in all figures, the intensity of solvents’ interactions with the selected sites follows water > MeOH > DMSO = DCM. This shows that water molecules are more available to interact with linamarin. The discussion in Section 3.1 and Section 3.2 supports these observations.
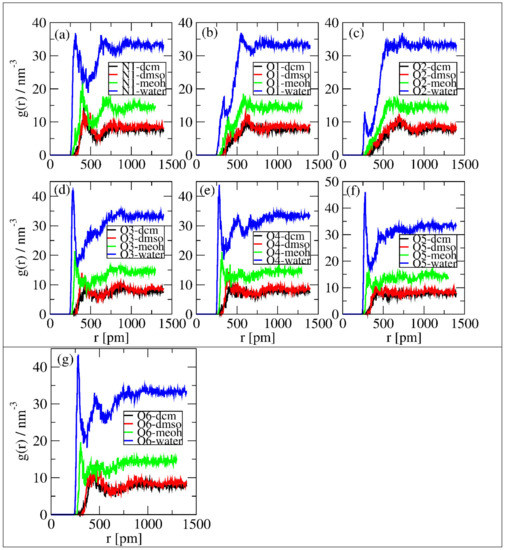
Figure 6.
Local density of polar atoms around linamarin and centres of mass of solvents correspond to (a) N1, (b) O1, (c) O2, (d) O3, (e) O4, (f) O5 and (g) O6.
The analysis of the solvents and the selected sites affected both the first peaks’ location and the minima of the peaks. The observations imply that each solvent did disturb the first coordination layer of the selected sites. Overall, water was observed to have a higher effect on the intensity of the RDF peaks than other solvents.
3.4. Number of Integral Analysis
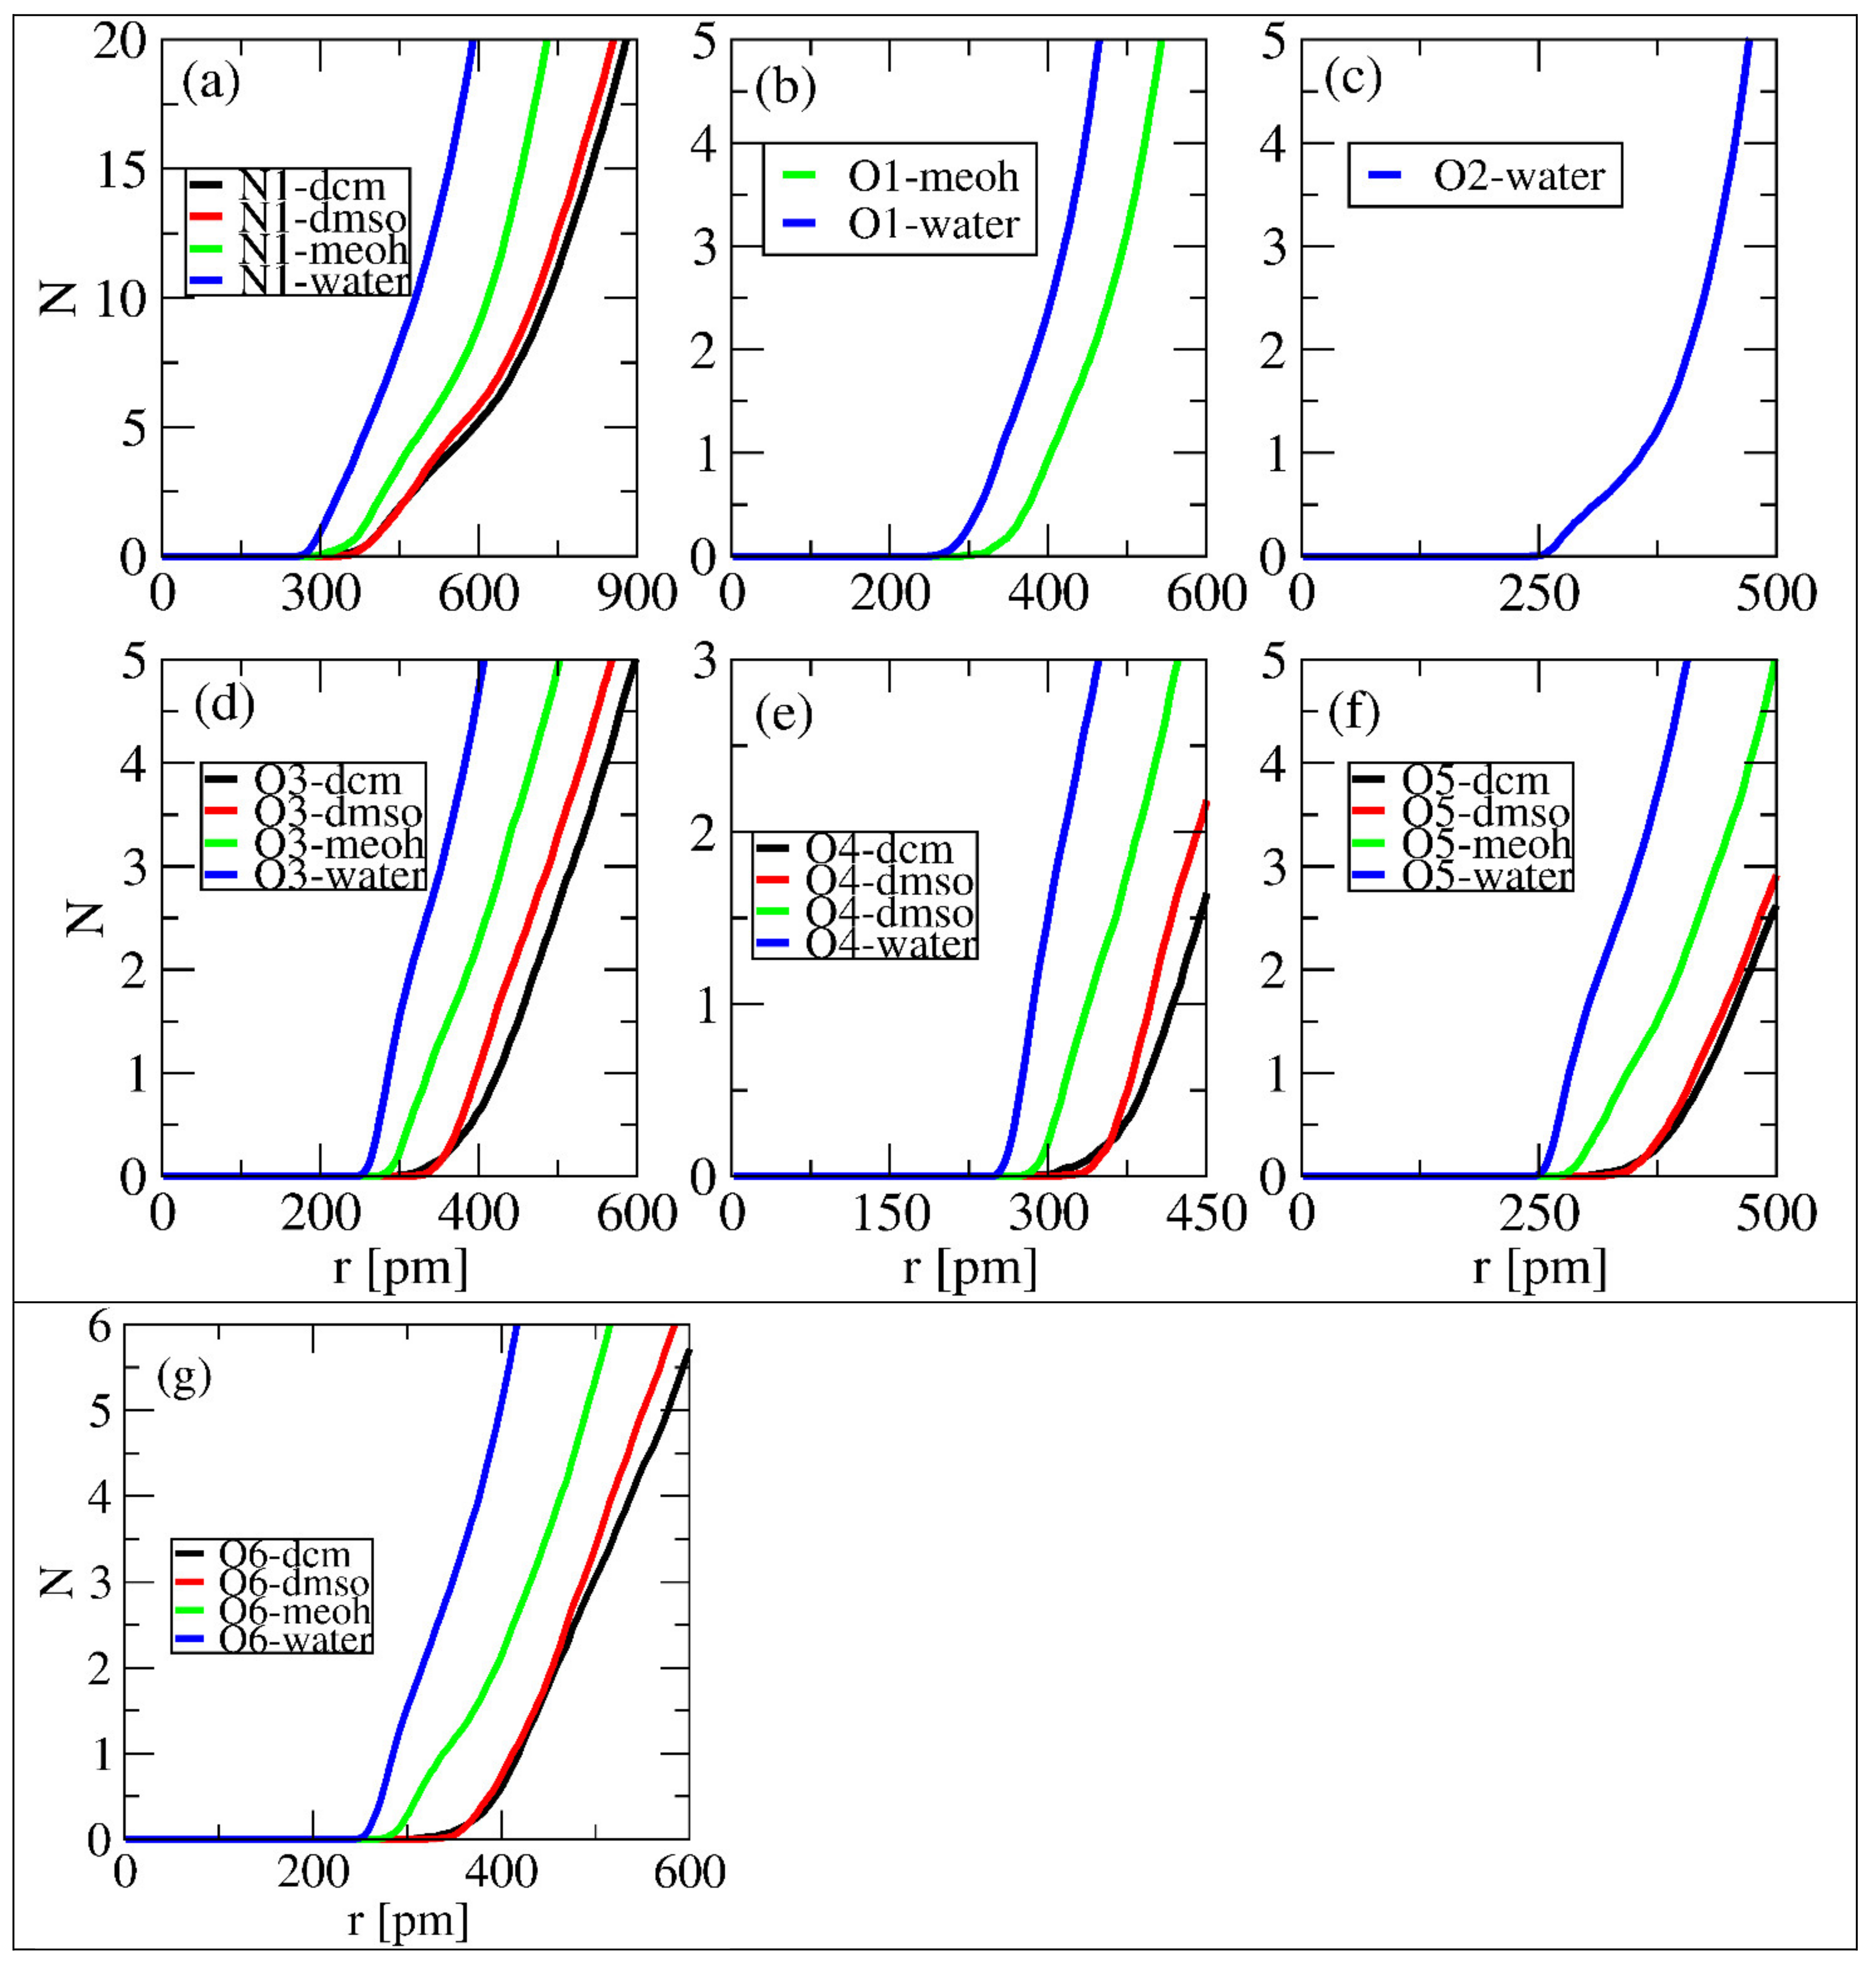
We performed a quantitative analysis to determine the number of solvent molecules in each selected site at the first minimum following the peak. The number of solvent molecules was quantified using the integral number at a certain distance. Figure 7 displays the sites that formed the first minimum and the number of molecules of each solvent at a distance. All sites in Figure 7, except (b) and (c), formed the first minimum with each solvent. Figure 7b shows the formation of the first minimum with water and MeOH, while Figure 6c shows the same with only water. Table 1 summarizes the number of molecules of each solvent and their corresponding distances. From Table 1, N1 is observed to have a greater number of solvents in the first minimum for water, which revealed a maximum number of nine. Different properties were observed, since some sites formed the first minimum at a relatively short distance while others at longer ones. Table 1 shows that the number of solvents at the first minimum followed the trend: water > DMSO > DCM > MeOH. These observations do not correlate with the observed properties in the fore sections. MeOH was reported to have a strong interaction with linamarin sites; however, this analysis ranked it as a solvent with lesser amount in the first minimum.
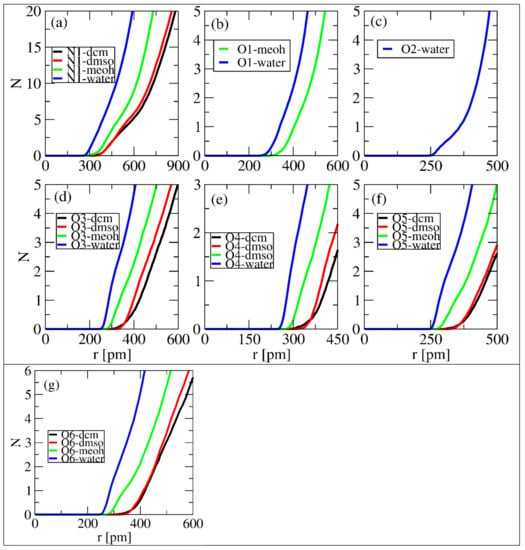
Figure 7.
Number of solvent molecules in the first solvation shell for selected sites of linamarin correspond to (a) N1, (b) O1, (c) O2, (d) O3, (e) O4, (f) O5 and (g) O6.

Table 1.
Number of solvents around the first solvation shell of the selected sites of linamarin. The data were obtained from local density (distance and integral).
3.5. Spatial Distribution Function
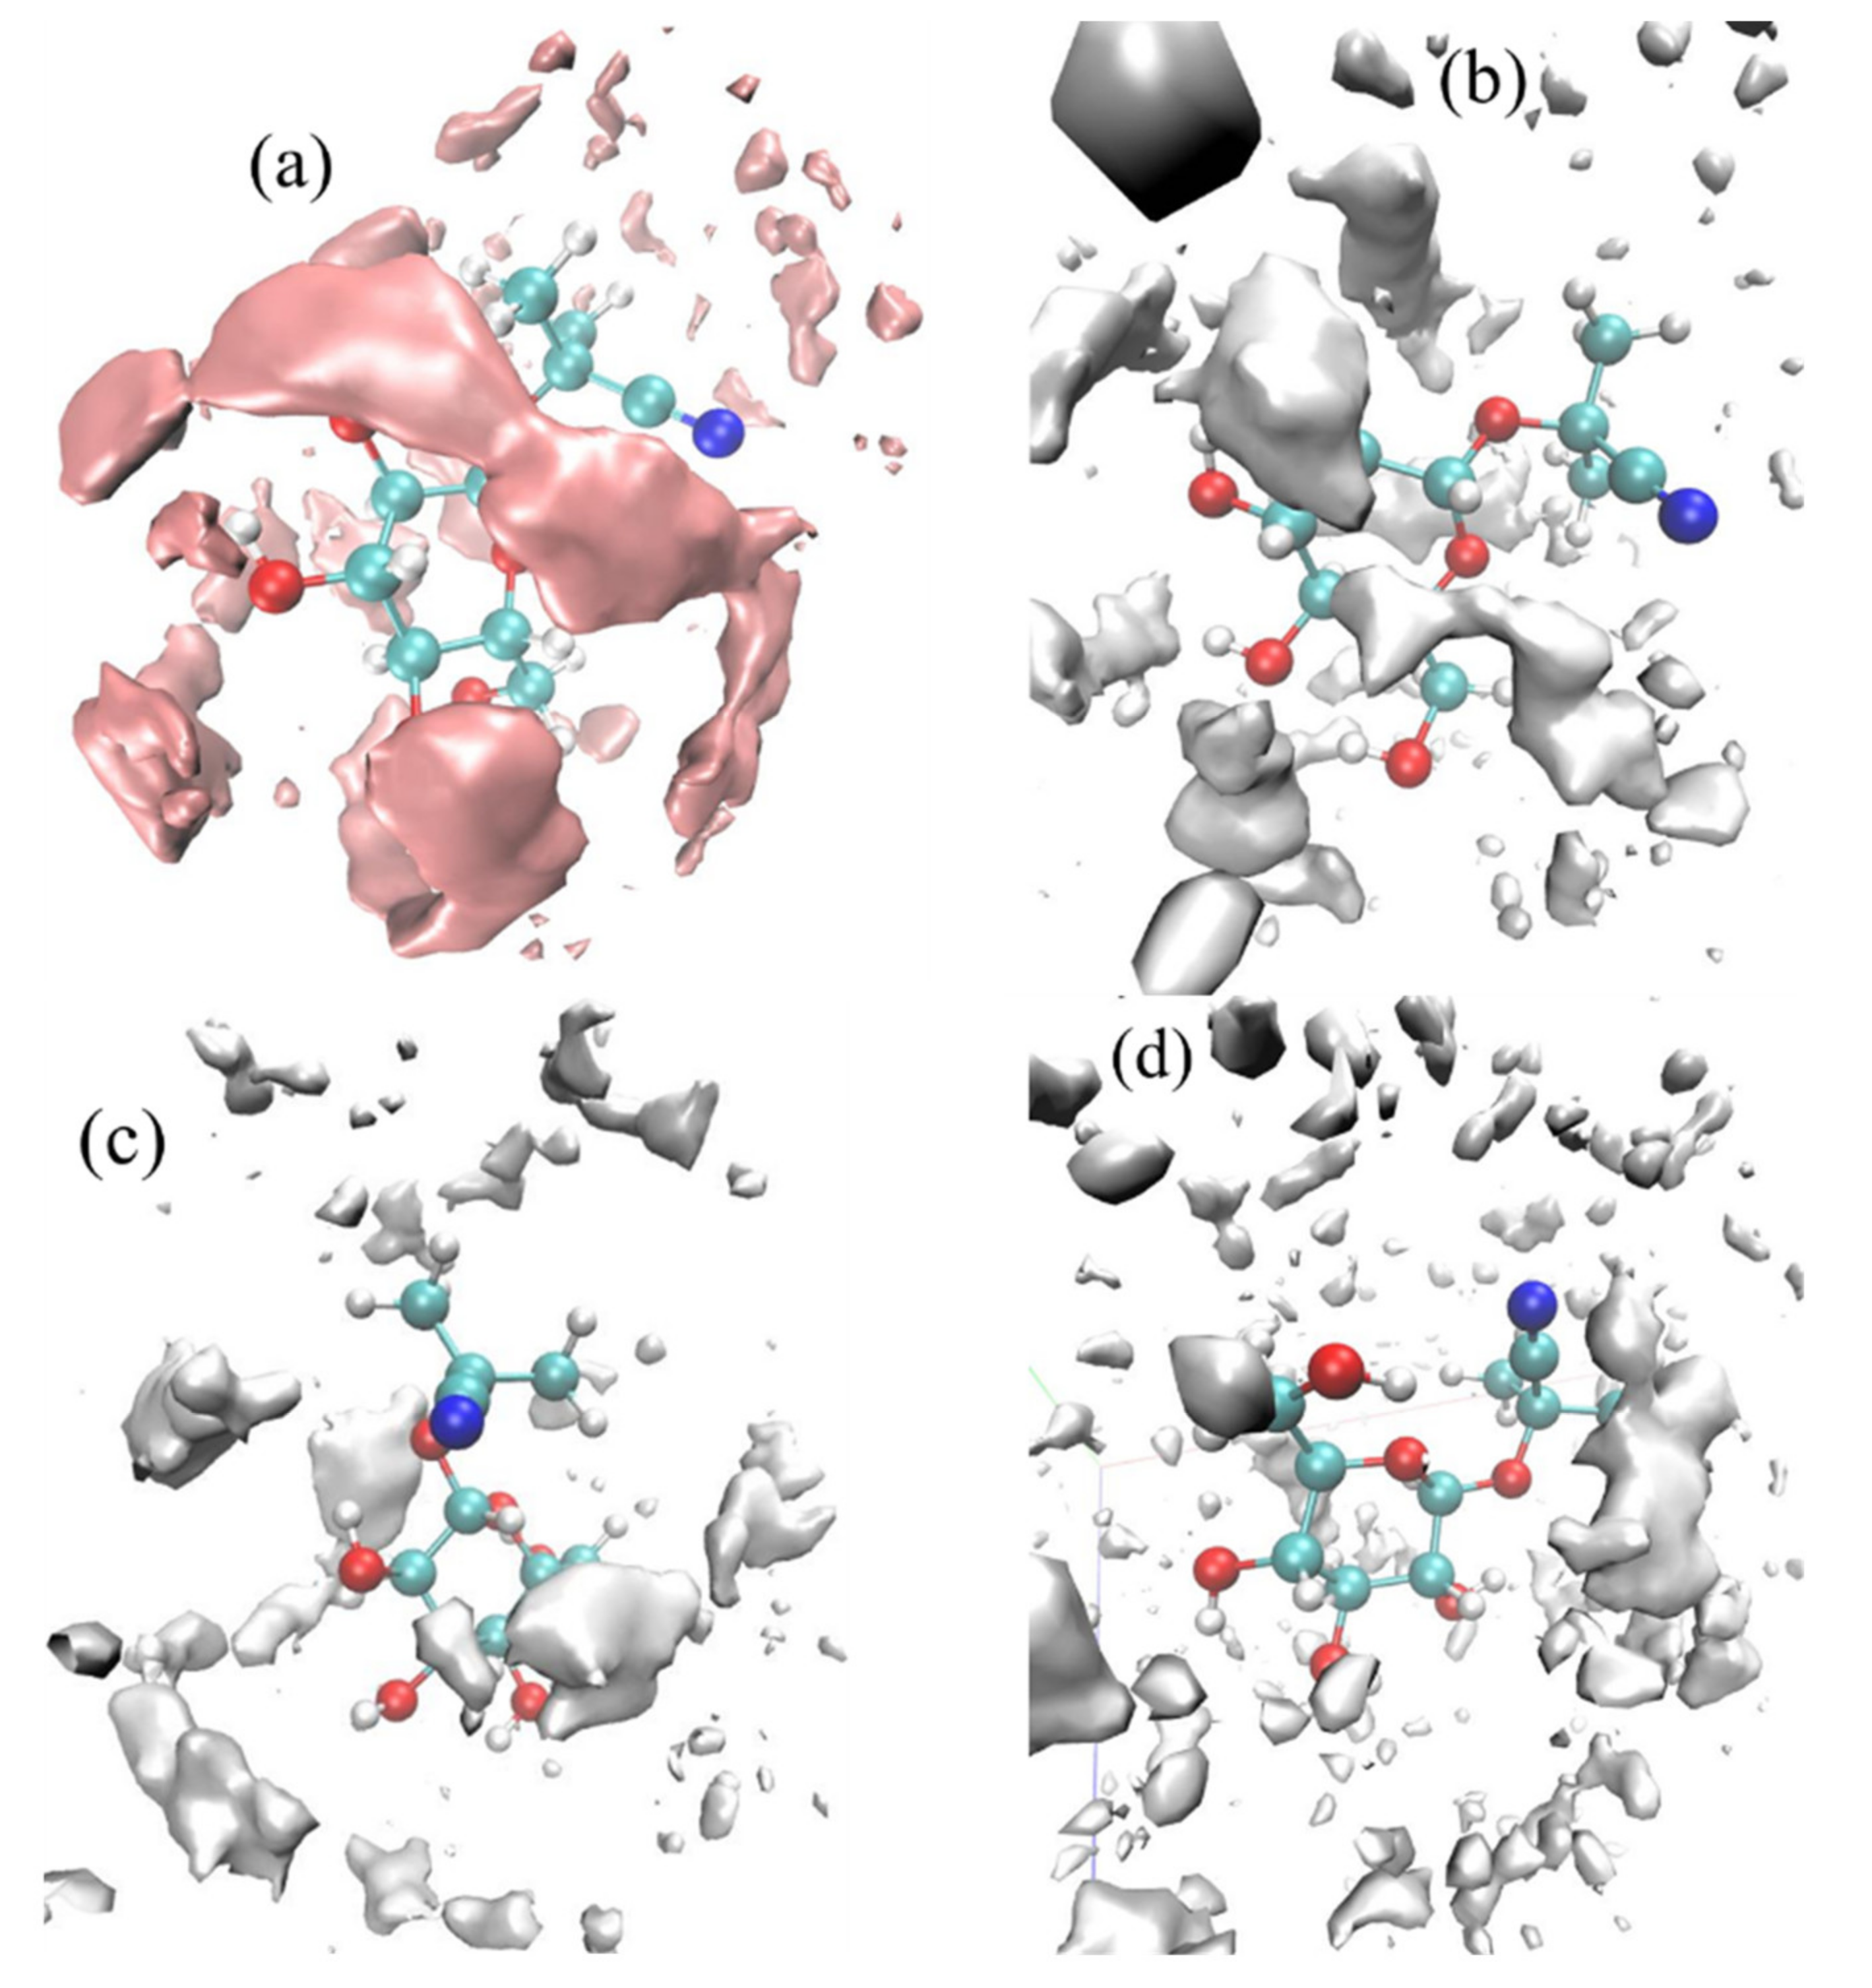
Spatial distribution functions were used to investigate the tendency of solvents to surround linamarin; the solvents’ and linamarin’s centres of mass were used as a reference. The corresponding graphs were developed using VMD [46] software with isosurface values of 63.8502, 41.9874, 33.3596 and 26.5337 for water, MeOH, DMSO and DCM, respectively. The data used for developing the three-dimensional isosurfaces (SDF) of the corresponding solvent molecules were obtained from simulation trajectories; the SDF depicts the local solvent density in 3D see Figure 8.
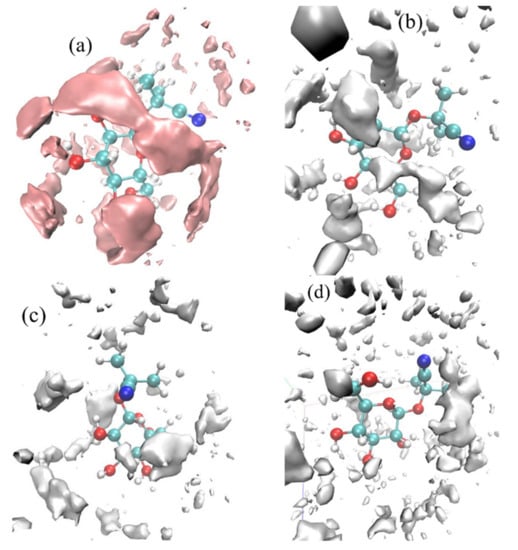
Figure 8.
Spatial distribution function of solvents around a linamarin molecule in (a) water, (b) MeOH, (c) DMSO and (d) DCM.
It is observed in all four graphs that the solvents (Figure 8) were distributed throughout linamarin molecules. Furthermore, it is observed that the polar solvents (water, MeOH, DMSO; see Figure 8a–c respectively) were grouped and formed a belt-like cluster, specifically to regions where there were polar atoms of linamarin, while, in Figure 8d, DCM molecules were populated throughout the linamarin molecule. Thus, these observations are attributed to the fact that linamarin has a large region of sugar moiety that contains many polar atoms that are likely to form hydrogen bonds with polar solvents. Following these observations, we can confirm that the polar solvents, specifically water, had strong interactions with linamarin sites, and that these interactions were mainly intermolecular.
3.6. Molecular Dynamics Free-Energy Calculations
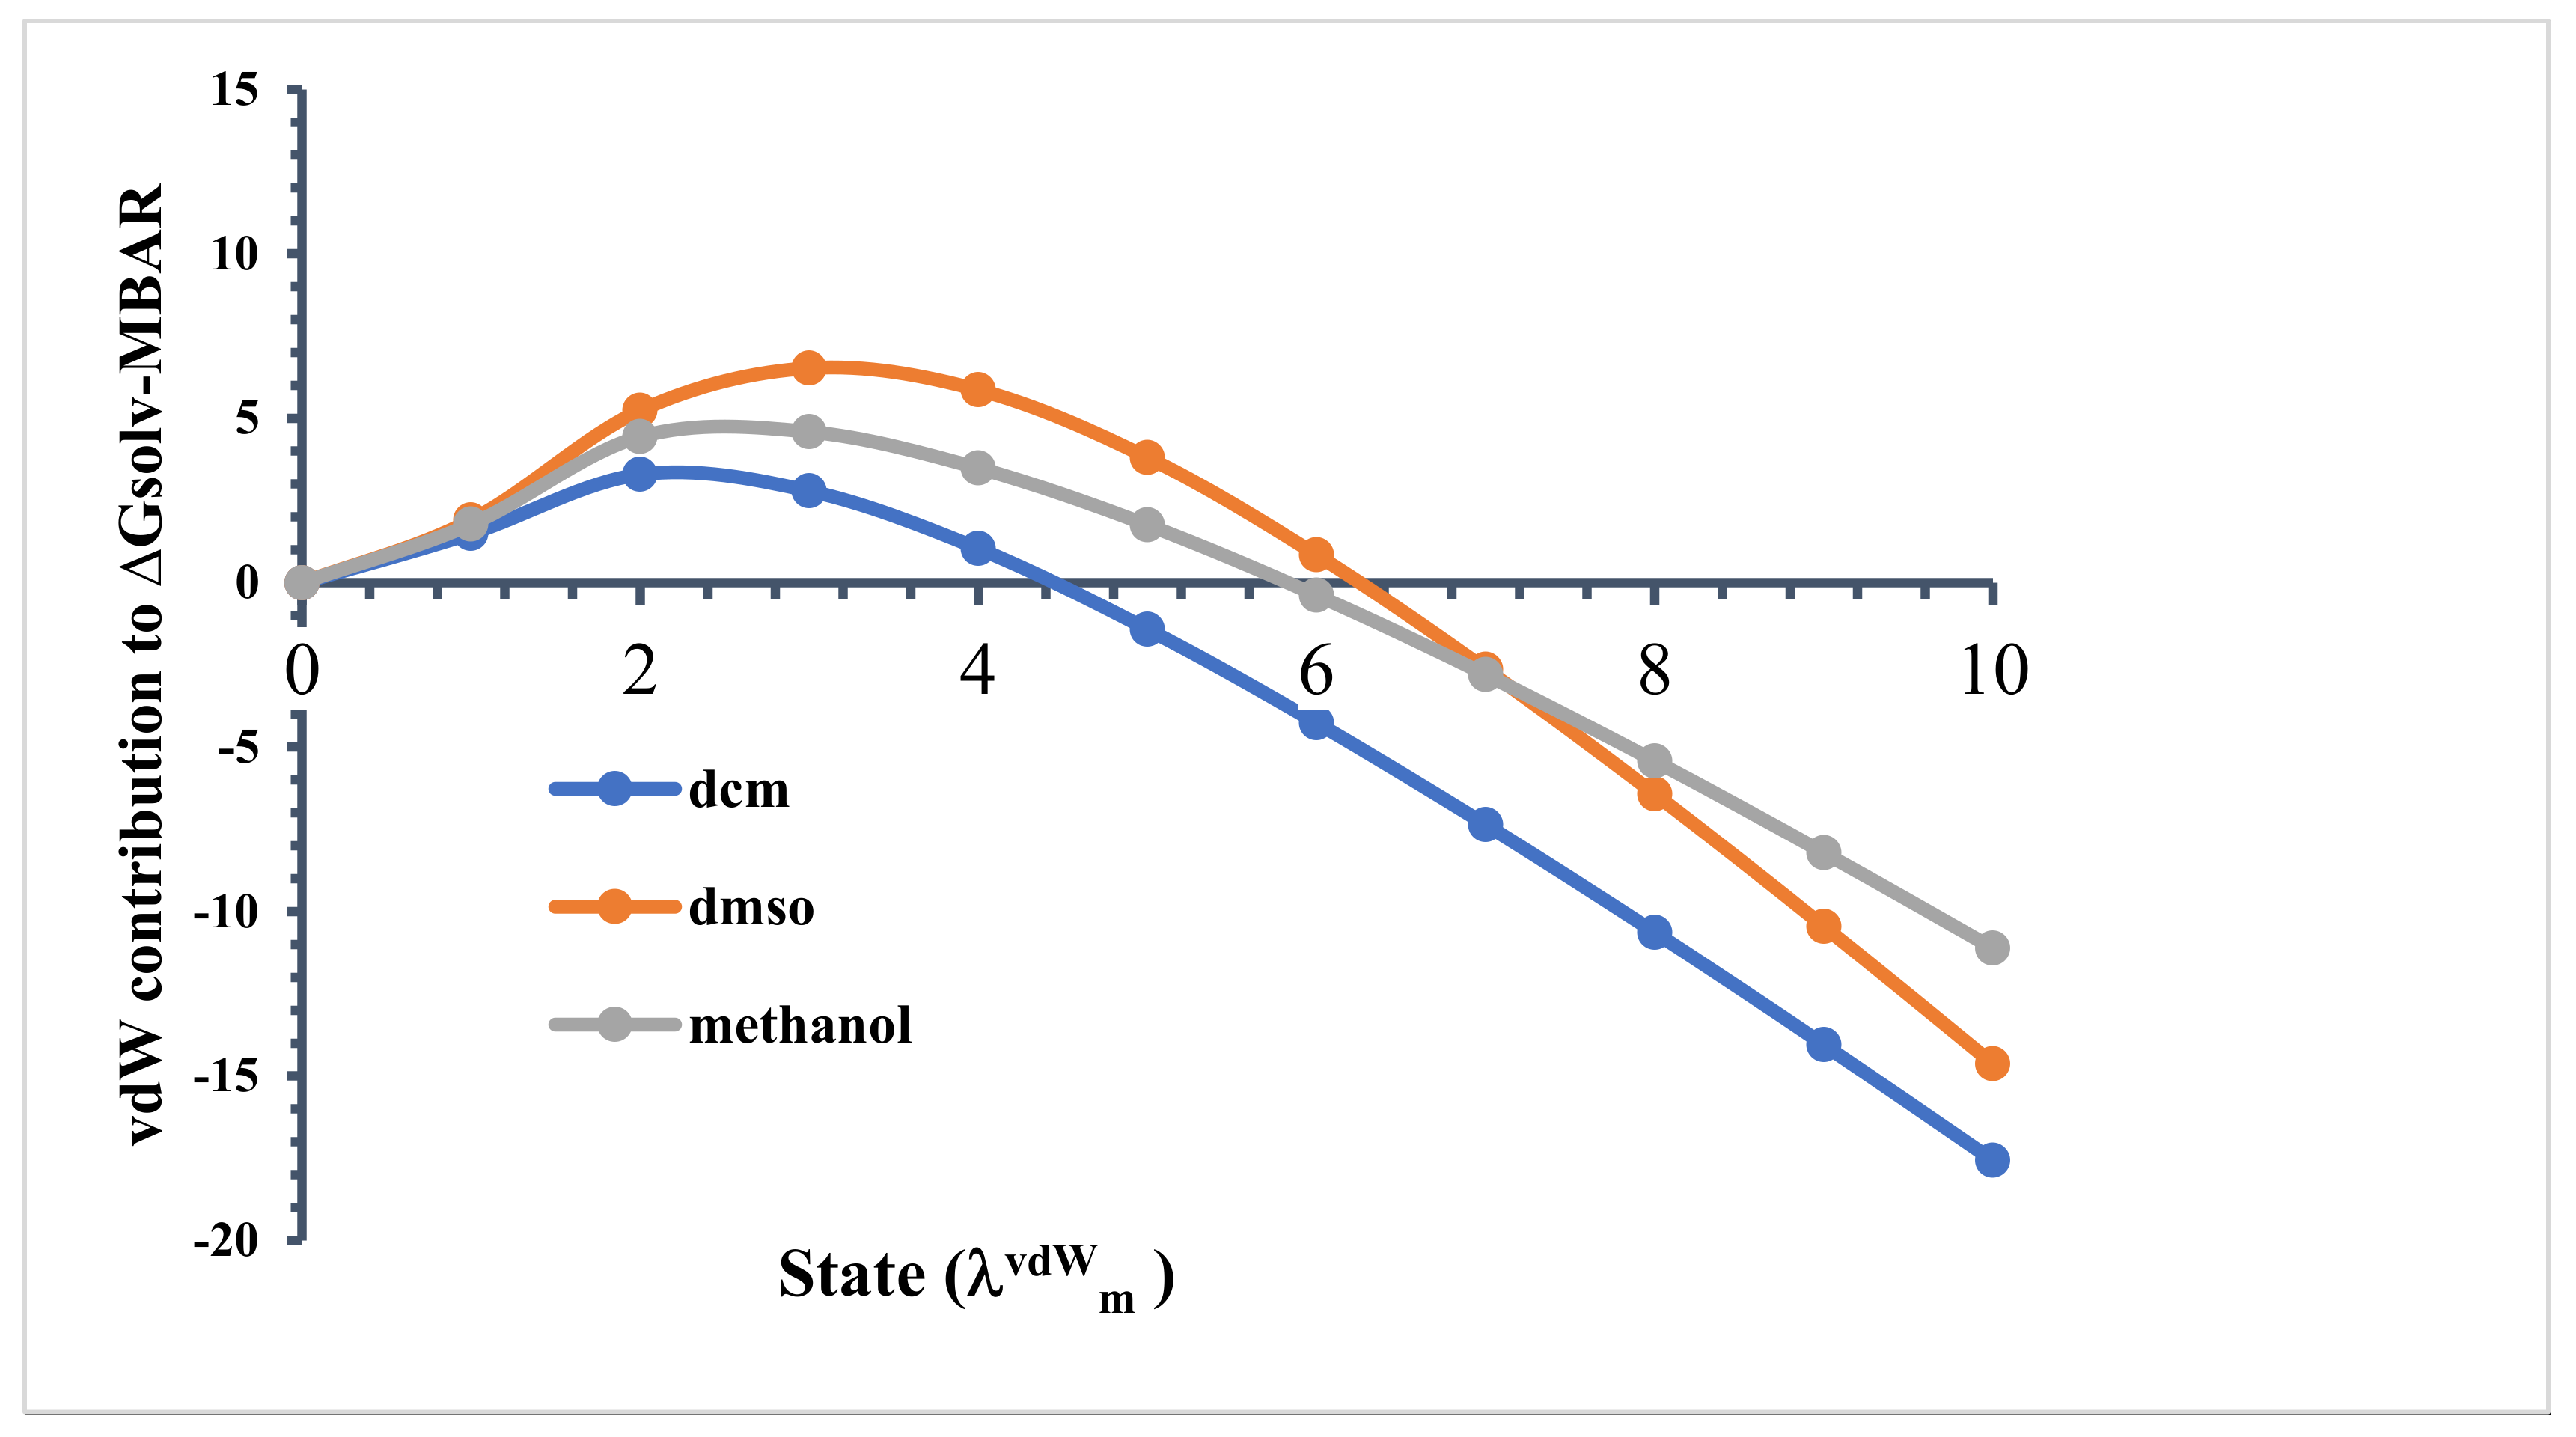
As described earlier, a total of 15 different stages were used for the free-energy calculations, where corresponded to a non-interacting (ideal gas) state, and was a fully interacting system, considering Table S2 in supporting information. When , all linamarin–solvent interactions were turned off. Then, with linamarin–solvent electrostatic interactions turned off, from to 10, the LJ interactions were increased from to 1.0 in 10 equal increments of 0.1. The free energy relative to the non-interacting state, as a stage function, is shown in Figure 9 for this process. Initially, we found that the relative solvation free energy increased for all solvents. In the non-interacting state (), linamarin may have been everywhere in the system with equal probability, which included structures overlapping with solvent molecules. As the LJ interactions were turned-on, linamarin necessarily carved out a cavity in the solution. This disrupted the neat solvent structure and required the “breaking” of solvent–solvent intermolecular interactions.
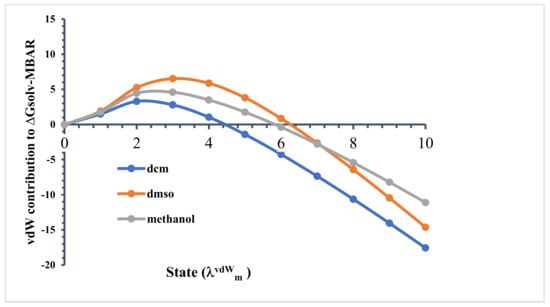
Figure 9.
Contribution of the van der Waals force at each stage of the ∆Gsolv calculation using Multistate Bennett acceptance ratio (MBAR).
Comparing the relative free energies in state , we found water > methanol > DMSO > DCM. Recall that the lower the relative free energy, the more favourable. Water and methanol are both capable of donating and accepting hydrogen bonds, and as a result, there was a greater cost to carving out a cavity in the solution. Water is known to be well structured and to form strong intermolecular hydrogen bonds with itself. This is inherent in the significantly larger relative free energy in state for water. Interestingly, for the case of water, the relative free energy was positive, indicating that the non-interacting state was preferred over state .
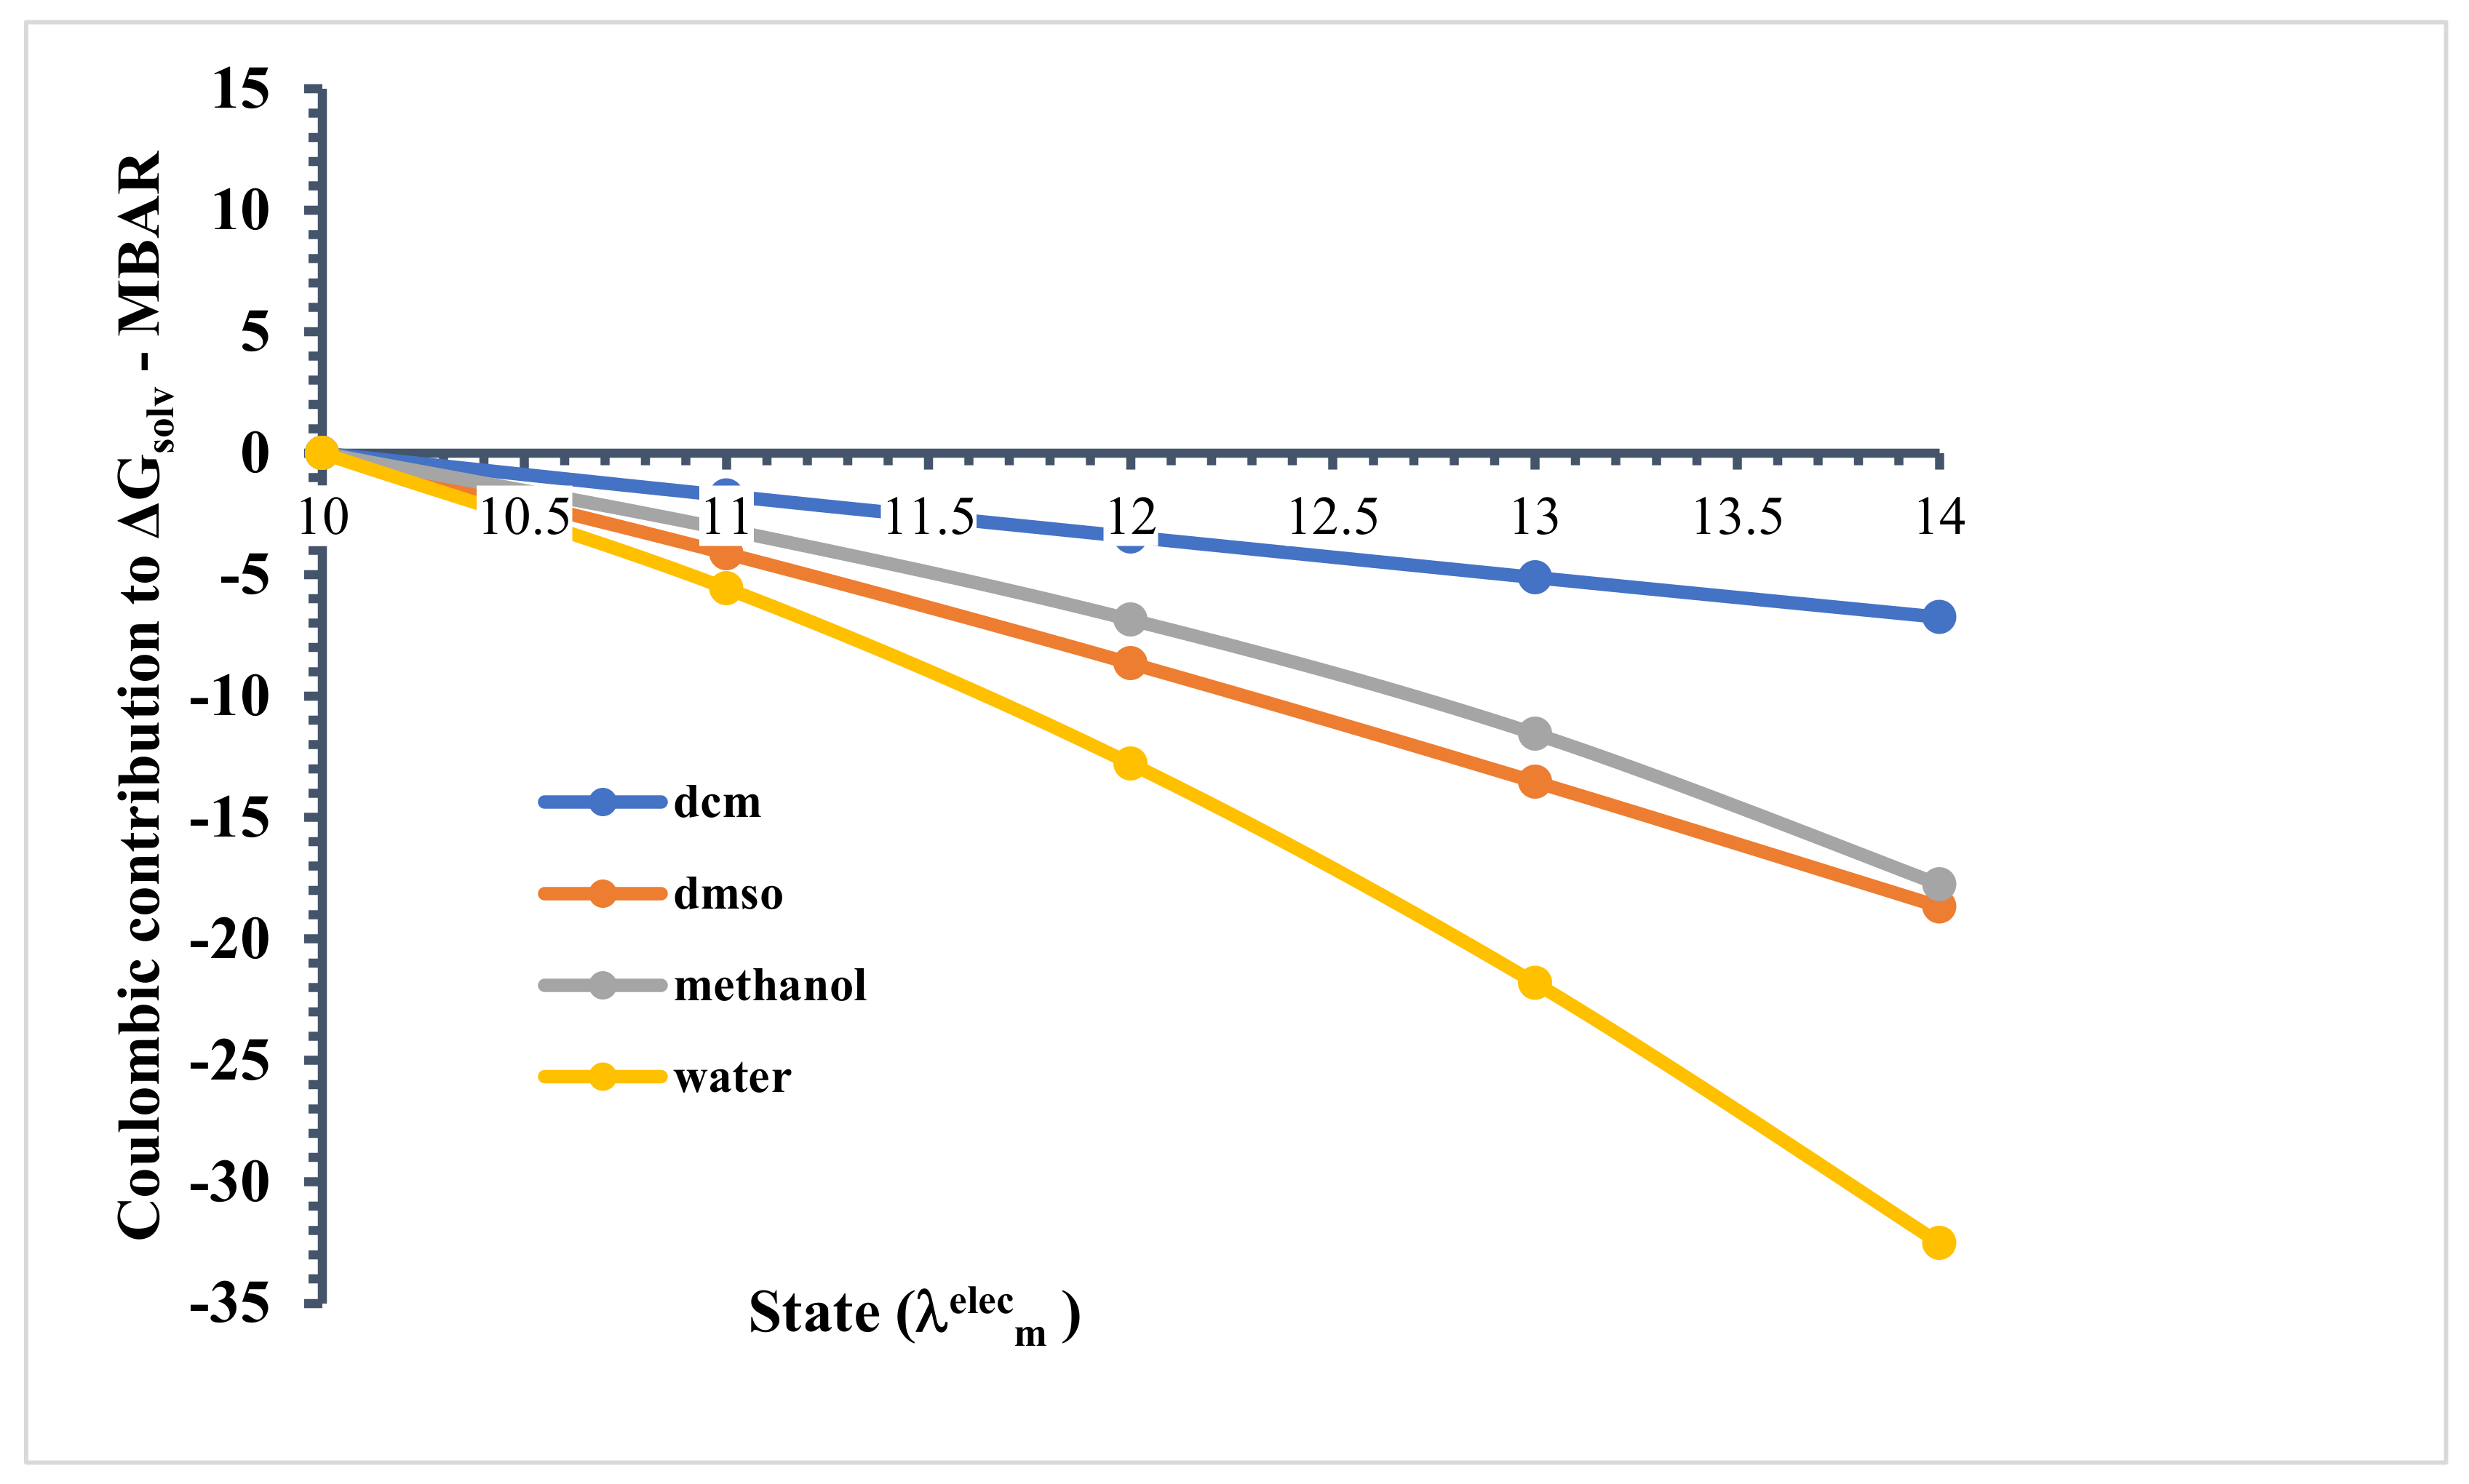
Next, electrostatic interactions were increased in a square-root fashion, following from to 14. In Figure 10, we show the free energy relative to state . In state LJ interactions were full, while electrostatic interactions were turned off.
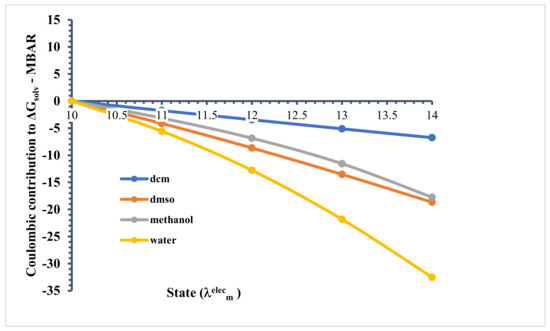
Figure 10.
Contribution of electrostatic interaction at each stage of the ∆Gsolv calculation (MBAR).
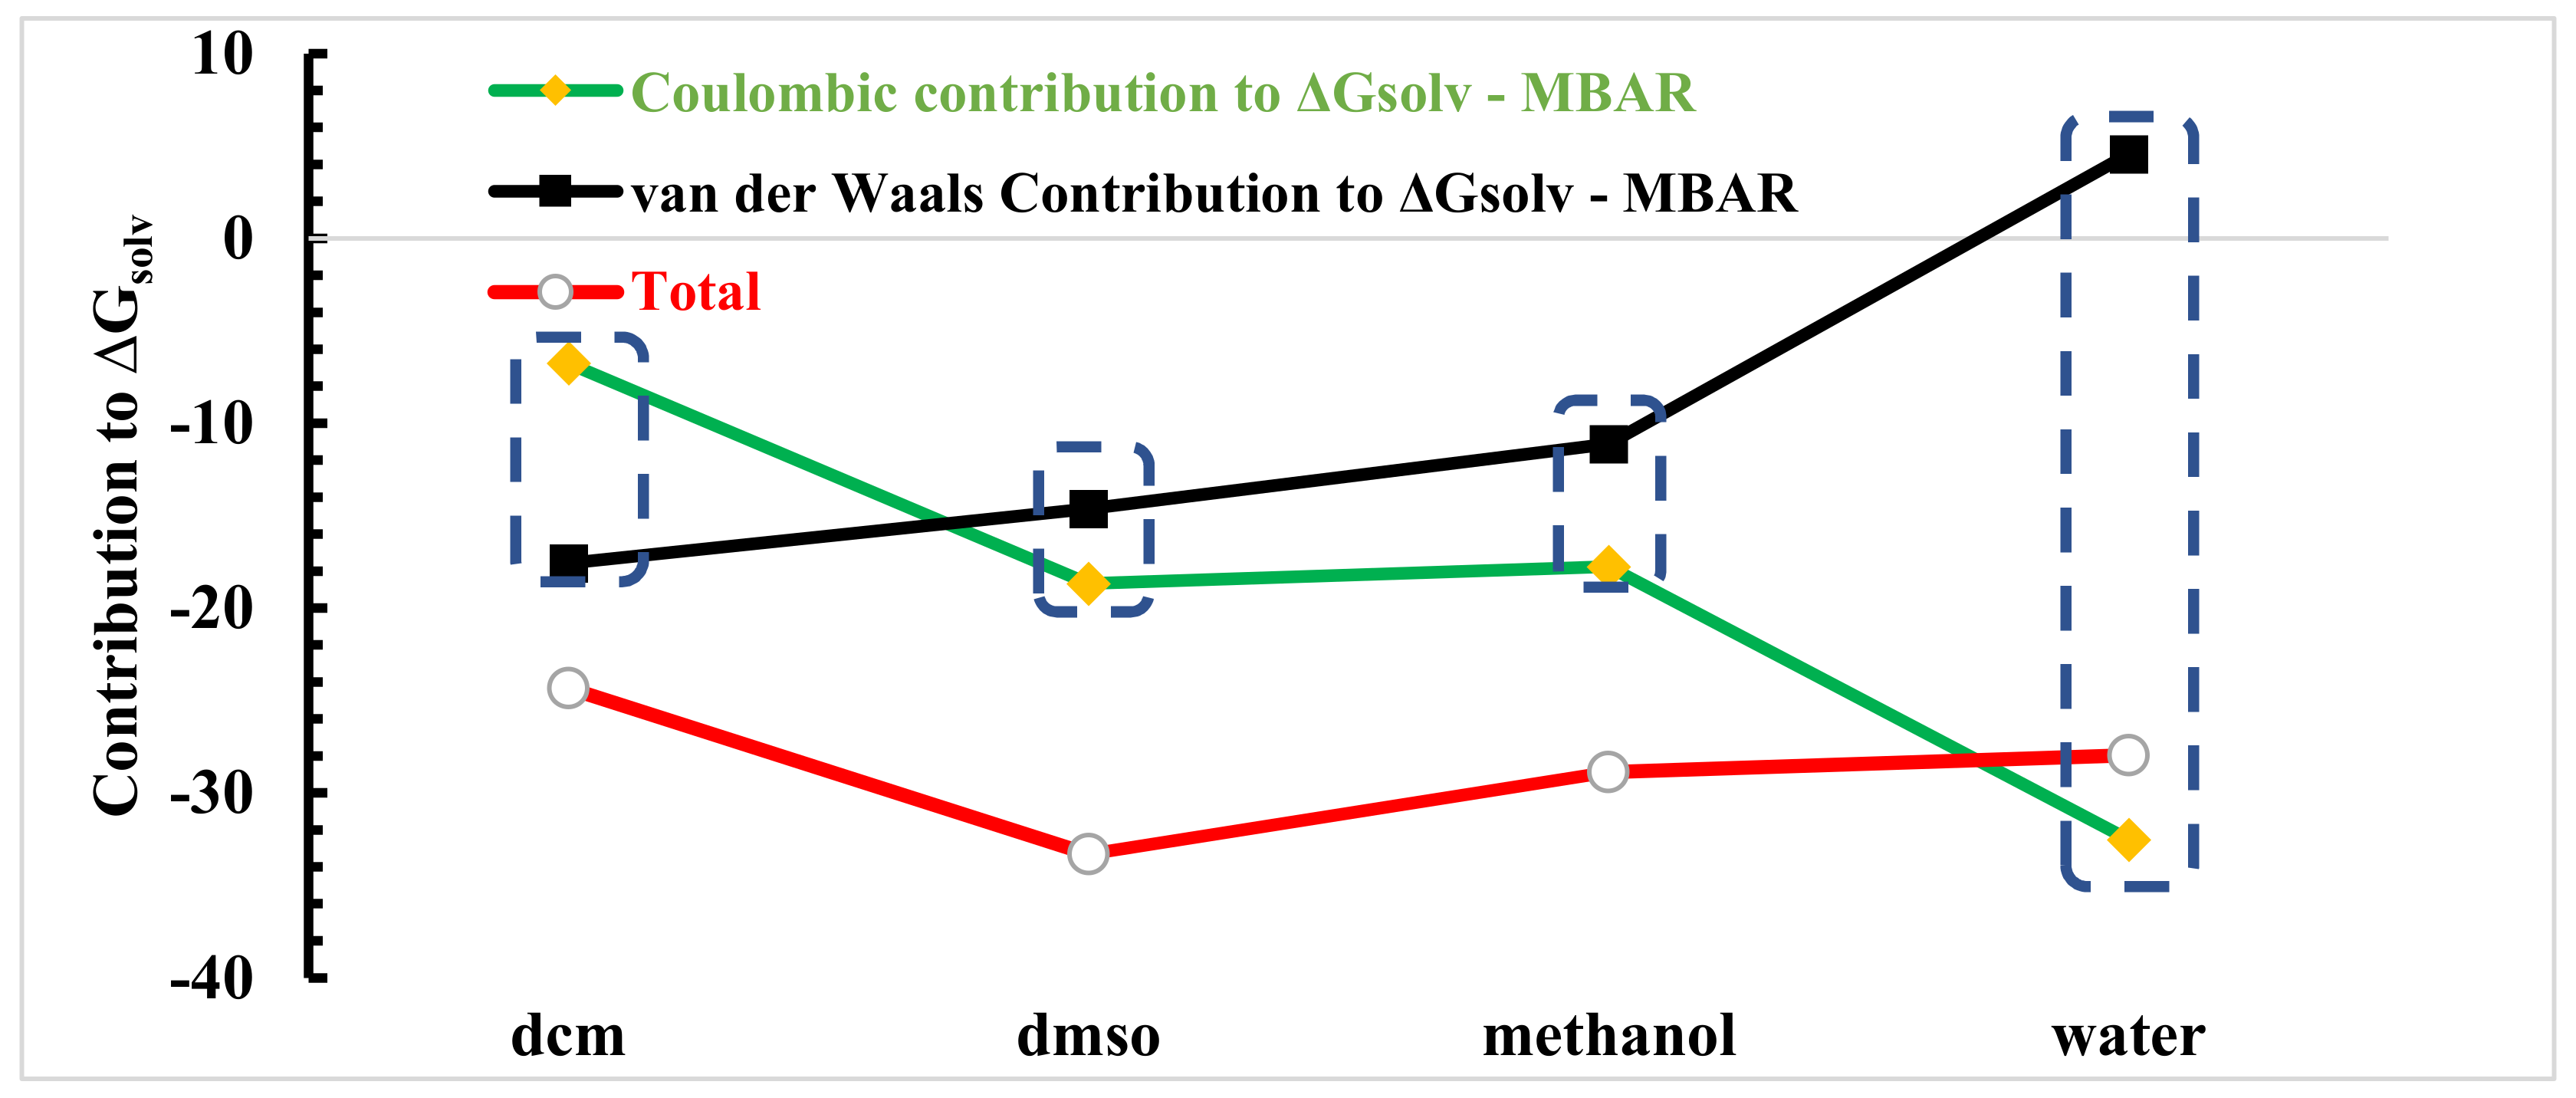
While the LJ term captures attractive dispersion and repulsion (i.e., van der Waals) interactions, the electrostatic term accounts for high-order interactions, such as hydrogen bonding. We found that as the electrostatic interactions were turned on, the relative solvation free energy decreased in all cases. Again, recall that the lower the relative free energy, the more favourable. We found that in state , and the relative free energy was obviously most negative in water. Next, the values in DMSO and methanol were similar, with DMSO being slightly more negative, and DCM was clearly the least negative. This agrees perfectly with our structural analysis, where we expected the relative free energy to be related to the strength of the intermolecular interactions between linamarin and the solvent, specifically, hydrogen bonding, here. In Figure 11, we summarize the total solvation free energy ( to 14), along with its LJ ( to 10) and electrostatic ( to 14) contributions.
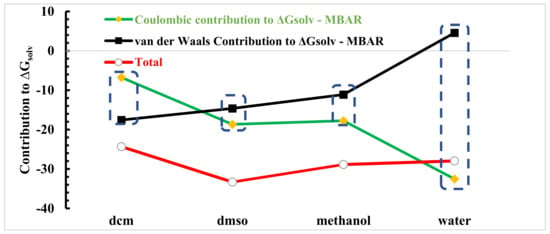
Figure 11.
Decomposition of the MBAR ∆Gsolv in van der Waals and coulombic contribution functions (in units of kT).
The figure shows that the solvation of linamarin was driven by a balance of linamarin–solvent and solvent–solvent interactions. While water strongly interacted with linamarin, it also strongly interacted with itself. This lead to a large disparity in the LJ and electrostatic contributions to the solvation free energy. On the other hand, DMSO is a strong hydrogen-bond acceptor but cannot donate hydrogen bonds. DMSO is unable to have hydrogen bond with itself. However, DMSO can hydrogen bond with linamarin. As a result, the total solvation free energy was most negative (i.e., solvation was most favourable) in DMSO. Note that, while, here, we report Gsolv, the log solubility is proportional to −Gsol.
3.7. Electronic Structure Calculations
As revealed in our structural analysis, the conformation of linamarin was sensitive to the solvent; specifically, we found competition between the intra- and inter-molecular interactions. However, very little experimental data is available for the phase equilibrium of linamarin in solution. As a result, modelling is expected to play an essential role in the early-stage design of novel separation processes. Therefore, our results suggest that it is important that methods be used that can account for the conformational changes of linamarin. Molecular simulation can sample the ensemble of conformations of linamarin in solution and vacuum, making it an excellent candidate. To demonstrate the sensitivity of the solvation free energy to structure, we next considered the use of electronic structure calculation.
Selected geometrical parameters for linamarin structure, optimized using DFT in vacuum, water, methanol and DCM, were evaluated. The oxygen–hydrogen distances for O1-H15, O2-H17, O2-H14 and O4-H16 were measured; it was observed that O–H distances increased in the order O1-H15 < O4-H16 < O2-H17 < O2-H14 both in a vacuum and in solvents see Table 2; this implies that the strength of hydrogen bonding follows the reverse order. These observations coincide with the connection matrix analysis of linamarin in solvents (Figure 3).

Table 2.
Summary of distances of the hydrogen bonding from geometric optimized structure in different solvents.
4. Conclusions
In the current work, we performed molecular dynamics simulations to understand the solvation of linamarin, covering a range of polar protic, aprotic and non-polar solvents. The study specifically focused on inter- and intra-molecular hydrogen bonding. CMat and PlProj, in combination, demonstrated the existence of both inter and intra-molecular hydrogen bonding, which behaved differently in all solvents. Radial distribution functions were used to characterize the intensities of the interactions between linamarin sites and the solvents, considering their donating and accepting capabilities. The higher radial distribution function peak at a low distance for water signified its strong interaction with linamarin.
The number of critical analyses quantitatively analysed the number of solvents observed at the first minimum following the peak. The maximum amount of nine for water, when interacting with N1, signified its strong interaction. There was variation in the trend, but the general trend followed the order: water > DMSO > DCM > MeOH. Spatial distribution function analysis confirmed the strong interaction between polar solvents and linamarin due to a belt-like cluster in water and MeOH.
These findings aligned with each other and proved the strong interaction between polar solvents and linamarin. The inter- and intra-molecular hydrogen bonding analysis proved that they were solvent-dependent and significantly contribute to linamarin’s solvation. Therefore, linamarin more strongly interacted with water than with the other discussed solvents. Whenever there was competition between inter- and intra-molecular hydrogen bonding, linamarin preferred to interact with the surrounding solvents (polar).
The solvation free energy of linamarin in these solvents provided a detailed analysis of how the dispersive and electrostatic interactions contribute to the overall preferences of a solvent to interact with a solute or another solvent molecule. The analysis indicated solvation free-energy results of coulombic contribution align with the structural analysis that water interacted strongly with linamarin. However, the total contribution to solvation free energy depicted DMSO as the best option because it can hydrogen bond with linamarin but not with itself. From these findings, we also found that linamarin’s conformation depends on solvents themselves, not just the solute-solvent interaction. Since there is no experimental solubility data, the modelling of linamarin in a range of solvents (polar to non-polar) provides an opportunity to consider even other traditional methods, including a very large range of solvents in the near future.
Supplementary Materials
The following information can be downloaded at https://www.mdpi.com/article/10.3390/pr10020352/s1, Table S1: Table summarizes the number of solvents molecules and the size of PBC box; Table S2: Summary of free energy contribution from each solvent.
Author Contributions
Writing—Original Draft, Methodology, Validation, Formal Analysis, Investigation, Visualization, L.P.; Analysis, Writing, Review and Editing G.D.; Computational Resources, Analysis, Writing, Review and Editing, D.M.S.; Writing, Review and Editing, C.N.M.; Writing, Review and Editing, K.M.M.; Writing, Review & Editing, R.L.M.; Computational Resources, Analysis, Writing, Review and Editing, A.S.P.; Writing, Review and Editing, F.N.-K. All authors have read and agreed to the published version of the manuscript.
Funding
This study was funded by African Development Bank (AfDB) with project 295 No. P-Z1-IA0-016 and grant No. 2100155032816.
Institutional Review Board Statement
Not applicable.
Informed Consent Statement
Not applicable.
Data Availability Statement
Not applicable.
Acknowledgments
The authors acknowledge The Nelson Mandela African Institution of Science and Technology (NM-AIST) through the African Development Bank (AfDB) with project 295 No. P-Z1-IA0-016 and grant No. 2100155032816 for financial support. DMS thanks the CHPC Lengau, South Africa, for the computational facility. L.P thank UDSM (DUCE) for granting study leave. LP further expresses his sincere thanks to Adam Mawenya and Joyce Martine for their dedicated assistance in computational facilities. FNK would also like to acknowledge funding from the German Academic Exchange Services (DAAD) for a guest professorship at TU Dresden. ASP is thankful for the computational resources provided by the Ohio Supercomputer Center to perform the solvation free-energy calculations.
Conflicts of Interest
The authors declare no competing interests.
References
- Jørgensen, K.; Morant, A.V.; Morant, M.; Jensen, N.B.; Olsen, C.E.; Kannangara, R.; Motawia, M.S.; Møller, B.L.; Bak, S. Biosynthesis of the cyanogenic glucosides linamarin and lotaustralin in cassava: Isolation, biochemical characterization, and expression pattern of CYP71E7, the oxime-metabolizing cytochrome P450 enzyme. Plant Physiol. 2011, 155, 282–292. [Google Scholar] [CrossRef] [PubMed]
- White, W.L.B.; Arias-Garzon, D.I.; McMahon, J.M.; Sayre, R.T. Cyanogenesis in Cassava1: The Role of Hydroxynitrile Lyase in Root Cyanide Production. Plant Physiol. 1998, 116, 1219–1225. [Google Scholar] [CrossRef]
- Paul, L.; Shadrack, D.M.; Mudogo, C.N.; Mtei, K.M.; Machunda, R.L.; Ntie-Kang, F. Structural characterization of cassava linamarase-linamarin enzyme complex: An integrated computational approach. J. Biomol. Struct. Dyn. 2021, 1–9. [Google Scholar] [CrossRef]
- Paul, L.; Mudogo, C.N.; Mtei, K.M.; Machunda, R.L.; Ntie-Kang, F. A computer-based approach for developing linamarase inhibitory agents. Phys. Sci. Rev. 2020, 5. [Google Scholar] [CrossRef]
- Mosayyebi, B.; Imani, M.; Mohammadi, L.; Akbarzadeh, A.; Zarghami, N.; Edalati, M.; Alizadeh, E.; Rahmati, M. An update on the toxicity of cyanogenic glycosides bioactive compounds: Possible clinical application in targeted cancer therapy. Mater. Chem. Phys. 2020, 246, 122841. [Google Scholar] [CrossRef]
- Samanthi, K.A.U.; Welideniya, D.T.; Acharige, A.D.; Samarakoon, S.R.; Rathnayaka, R.K.; de Silva, M.; Perera, S.S.; Pieris, C.; Wanninayake, U.K.; Jayathilaka, A.; et al. An efficient and high-yielding method for extraction and purification of linamarin from Cassava; in vitro biological evaluation. Nat. Prod. Res. 2021, 35, 4169–4172. [Google Scholar] [CrossRef]
- Idibie, C.A.; Davids, H.; Iyuke, S.E. Cytotoxicity of purified cassava linamarin to a selected cancer cell lines. Bioprocess. Biosyst. Eng. 2007, 30, 261–269. [Google Scholar] [CrossRef]
- Kuhn, B.; Mohr, P.; Stahl, M. Intramolecular Hydrogen Bonding in Medicinal Chemistry. J. Med. Chem. 2010, 53, 2601–2611. [Google Scholar] [CrossRef]
- Ashwood, V.A.; Field, M.J.; Horwell, D.C.; Julien-Larose, C.; Lewthwaite, R.A.; McCleary, S.; Pritchard, M.C.; Raphy, J.; Singh, L. Utilization of an intramolecular hydrogen bond to increase the CNS penetration of an NK(1) receptor antagonist. J. Med. Chem. 2001, 44, 2276–2285. [Google Scholar] [CrossRef]
- Rezai, T.; Bock, J.E.; Zhou, M.V.; Kalyanaraman, C.; Lokey, R.S.; Jacobson, M.P. Conformational flexibility, internal hydrogen bonding, and passive membrane permeability: Successful in silico prediction of the relative permeabilities of cyclic peptides. J. Am. Chem. Soc. 2006, 128, 14073–14080. [Google Scholar] [CrossRef]
- Seigler, D.S. Isolation and characterization of naturally occurring cyanogenic compounds. Phytochemistry 1975, 14, 9–29. [Google Scholar] [CrossRef]
- Wright, J.S. Predicting the antioxidant activity of curcumin and curcuminoids. J. Mol. Struct. Theochem. 2002, 591, 207–217. [Google Scholar] [CrossRef]
- Patsahan, T.; Ilnytskyi, J.; Pizio, O. On the properties of a single OPLS-UA model curcumin molecule in water, methanol and dimethyl sulfoxide. Molecular dynamics computer simulation results. arXiv 2017, arXiv:1706.07253. [Google Scholar] [CrossRef]
- Arrowsmith, J.E.; Campbell, S.F.; Cross, P.E.; Stubbs, J.K.; Burges, R.A.; Gardiner, D.G.; Blackburn, K.J. Long-acting dihydropyridine calcium antagonists. 1. 2-Alkoxymethyl derivatives incorporating basic substituents. J. Med. Chem. 1986, 29, 1696–1702. [Google Scholar] [CrossRef]
- Van Der Spoel, D.; Lindahl, E.; Hess, B.; Groenhof, G.; Mark, A.E.; Berendsen, H.J.C. GROMACS: Fast, flexible, and free. J. Comput. Chem. 2005, 26, 1701–1718. [Google Scholar] [CrossRef] [PubMed]
- Christen, M.; Hünenberger, P.H.; Bakowies, D.; Baron, R.; Bürgi, R.; Geerke, D.P.; Heinz, T.N.; Kastenholz, M.A.; Kräutler, V.; Oostenbrink, C.; et al. The GROMOS software for biomolecular simulation: GROMOS05. J. Comput. Chem. 2005, 26, 1719–1751. [Google Scholar] [CrossRef] [PubMed]
- Kim, S.; Chen, J.; Cheng, T.; Gindulyte, A.; He, J.; He, S.; Li, Q.; Shoemaker, B.A.; Thiessen, P.A.; Yu, B.; et al. PubChem in 2021: New data content and improved web interfaces. Nucleic. Acids. Res. 2021, 49, D1388–D1395. [Google Scholar] [CrossRef]
- Robertson, M.J.; Tirado-Rives, J.; Jorgensen, W.L. Improved Peptide and Protein Torsional Energetics with the OPLS-AA Force Field. J. Chem. Theory Comput. 2015, 11, 3499–3509. [Google Scholar] [CrossRef]
- Jorgensen, W.L.; Tirado-Rives, J. Potential energy functions for atomic-level simulations of water and organic and biomolecular systems. Proc. Natl. Acad. Sci. USA 2005, 102, 6665. [Google Scholar] [CrossRef]
- Dodda, L.S.; Vilseck, J.Z.; Tirado-Rives, J.; Jorgensen, W.L. 1.14*CM1A-LBCC: Localized Bond-Charge Corrected CM1A Charges for Condensed-Phase Simulations. J. Phys. Chem. B 2017, 121, 3864–3870. [Google Scholar] [CrossRef]
- Dodda, L.S.; Cabeza de Vaca, I.; Tirado-Rives, J.; Jorgensen, W.L. LigParGen web server: An automatic OPLS-AA parameter generator for organic ligands. Nucleic Acids. Res. 2017, 45, W331–W336. [Google Scholar] [CrossRef]
- Speedy, R.J.; Madura, J.D.; Jorgensen, W.L. Network topology in simulated water. J. Phys. Chem. 1987, 91, 909–913. [Google Scholar] [CrossRef]
- Bálint, S.; Bakó, I.; Grósz, T.; Megyes, T. Structure of liquid methylene chloride: Molecular dynamics simulation compared to diffraction experiments. J. Mol. Liq. 2007, 136, 257–266. [Google Scholar] [CrossRef]
- Rosenthal, S.J.; Jimenez, R.; Fleming, G.R.; Kumar, P.V.; Maroncelli, M. Solvation dynamics in methanol: Experimental and molecular dynamics simulation studies. J. Mol. Liq. 1994, 60, 25–56. [Google Scholar] [CrossRef]
- Liu, H.; Mueller-Plathe, F.; van Gunsteren, W.F. A Force Field for Liquid Dimethyl Sulfoxide and Physical Properties of Liquid Dimethyl Sulfoxide Calculated Using Molecular Dynamics Simulation. J. Am. Chem. Soc. 1995, 117, 4363–4366. [Google Scholar] [CrossRef]
- González, M.A.; Abascal, J.L.F. A flexible model for water based on TIP4P/2005. J. Chem. Phys. 2011, 135, 224516. [Google Scholar] [CrossRef] [PubMed]
- Bussi, G.; Donadio, D.; Parrinello, M. Canonical sampling through velocity rescaling. J. Chem. Phys. 2007, 126, 014101. [Google Scholar] [CrossRef] [PubMed]
- Parrinello, M.; Rahman, A. Polymorphic transitions in single crystals: A new molecular dynamics method. Int. J. Appl. Phys. 1981, 52, 7182–7190. [Google Scholar] [CrossRef]
- Darden, T.; York, D.; Pedersen, L. Particle mesh Ewald: An N⋅log(N) method for Ewald sums in large systems. J. Chem. Phys. 1993, 98, 10089–10092. [Google Scholar] [CrossRef]
- Cheatham, T.E., III; Miller, J.L.; Fox, T.; Darden, T.A.; Kollman, P.A. Molecular Dynamics Simulations on Solvated Biomolecular Systems: The Particle Mesh Ewald Method Leads to Stable Trajectories of DNA, RNA, and Proteins. J. Am. Chem. Soc. 1995, 117, 4193–4194. [Google Scholar] [CrossRef]
- Hess, B.; Bekker, H.; Berendsen, H.J.C.; Fraaije, J.G.E.M. LINCS: A linear constraint solver for molecular simulations. J. Comput. Chem. 1997, 18, 1463–1472. [Google Scholar] [CrossRef]
- Ryckaert, J.-P.; Ciccotti, G.; Berendsen, H.J.C. Numerical integration of the cartesian equations of motion of a system with constraints: Molecular dynamics of n-alkanes. J. Comput. Phys. 1977, 23, 327–341. [Google Scholar] [CrossRef]
- Brehm, M.; Thomas, M.; Gehrke, S.; Kirchner, B. TRAVIS—A free analyzer for trajectories from molecular simulation. J. Chem. Phys. 2020, 152, 164105. [Google Scholar] [CrossRef] [PubMed]
- Van Gunsteren, W.F.; Berendsen, H.J.C. A Leap-frog Algorithm for Stochastic Dynamics. Mol. Simul. 1988, 1, 173–185. [Google Scholar] [CrossRef]
- Sabatino, S.J.; Paluch, A. Predicting octanol/water partition coefficients using molecular simulation for the SAMPL7 challenge: Comparing the use of neat and water saturated 1-octanol. J. Comput. Aided. Mol. Des. 2021, 35, 1009–1024. [Google Scholar] [CrossRef]
- Shirts, M.R.; Chodera, J.D. Statistically optimal analysis of samples from multiple equilibrium states. J. Chem. Phys. 2008, 129, 124105. [Google Scholar] [CrossRef] [PubMed]
- Beutler, T.C.; Mark, A.E.; van Schaik, R.C.; Gerber, P.R.; van Gunsteren, W.F. Avoiding singularities and numerical instabilities in free energy calculations based on molecular simulations. Chem. Phys. Lett. 1994, 222, 529–539. [Google Scholar] [CrossRef]
- Marenich, A.V.; Cramer, C.J.; Truhlar, D.G. Universal Solvation Model Based on Solute Electron Density and on a Continuum Model of the Solvent Defined by the Bulk Dielectric Constant and Atomic Surface Tensions. J. Phys. Chem. B 2009, 113, 6378–6396. [Google Scholar] [CrossRef]
- Frisch, M.J.; Trucks, G.W.; Schlegel, H.B.; Scuseria, G.E.; Robb, M.A.; Cheeseman, J.R.; Scalmani, G.; Barone, V.; Petersson, G.A.; Nakatsuji, H.; et al. Gaussian 16, Revision C.01; Gaussian Inc.: Wallingford, CT, USA, 2019. [Google Scholar]
- Weininger, D. SMILES, a chemical language and information system. 1. Introduction to methodology and encoding rules. J. Chem. Inf. Comput. Sci. 1988, 28, 31–36. [Google Scholar] [CrossRef]
- O’Boyle, N.M.; Banck, M.; James, C.A.; Morley, C.; Vandermeersch, T.; Hutchison, G.R. Open Babel: An open chemical toolbox. J. Cheminform. 2011, 3, 33. [Google Scholar] [CrossRef]
- Wang, J.; Wolf, R.M.; Caldwell, J.W.; Kollman, P.A.; Case, D.A. Development and testing of a general amber force field. J. Comput. Chem. 2004, 25, 1157–1174. [Google Scholar] [CrossRef] [PubMed]
- Gasteiger, J.; Marsili, M. A new model for calculating atomic charges in molecules. Tetrahedron Lett. 1978, 19, 3181–3184. [Google Scholar] [CrossRef]
- Stewart, J.J.P. Optimization of parameters for semiempirical methods V: Modification of NDDO approximations and application to 70 elements. J. Mol. Model. 2007, 13, 1173–1213. [Google Scholar] [CrossRef]
- Zhao, Y.; Truhlar, D.G. The M06 suite of density functionals for main group thermochemistry, thermochemical kinetics, noncovalent interactions, excited states, and transition elements: Two new functionals and systematic testing of four M06-class functionals and 12 other functionals. Theor. Chem. Acc. 2008, 120, 215–241. [Google Scholar] [CrossRef]
- Humphrey, W.; Dalke, A.; Schulten, K. VMD: Visual molecular dynamics. J. Mol. Graph. 1996, 14, 33–38. [Google Scholar] [CrossRef]
Publisher’s Note: MDPI stays neutral with regard to jurisdictional claims in published maps and institutional affiliations. |
© 2022 by the authors. Licensee MDPI, Basel, Switzerland. This article is an open access article distributed under the terms and conditions of the Creative Commons Attribution (CC BY) license (https://creativecommons.org/licenses/by/4.0/).

