Article

Comparison of Performance and Economic Efficiency for Greenhouse Solar versus Hot Air Drying: A Case of Crispy Mango Production

by
Kanokwan Kingphadung
1,
Patsanan Kurdkaew
1,
Prasong Siriwongwilaichat
1 and
Suphaphat Kwonpongsagoon
2,3,*
1
Department of Food Technology, Faculty of Engineering and Industrial Technology, Silpakorn University, Nakhon Pathom 73000, Thailand
2
Department of Sanitary Engineering, Faculty of Public Health, Mahidol University, Bangkok 10400, Thailand
3
Center of Excellence on Environmental Health and Toxicology (EHT), Bangkok 10400, Thailand
*
Author to whom correspondence should be addressed.
Processes 2022, 10(2), 311; https://doi.org/10.3390/pr10020311
Submission received: 17 January 2022 / Revised: 1 February 2022 / Accepted: 2 February 2022 / Published: 5 February 2022

Abstract

:
This study aimed to compare the performance and economic efficiency of greenhouse solar and hot air drying. These are widely used and inexpensive techniques for preserved fruit production in Thailand. Two drying methods were used to dry mango fruit, var. Nam Dok Mai. During the process of both drying methods, the moisture content of mango slices was reduced from an average 85.6% to 12.5% wet basis. To determine the most profitable dryer system for investment, economic analyses of greenhouse solar and hot air drying, involving the main variables affecting their profitability, were investigated, including production and maintenance cost, capital costs, revenue, and drying capacities. The internal rate of return (IRR), net present value (NPV), benefit to cost ratio (BCR) and payback period (PBP) were all evaluated. The results of economic evaluation revealed that high values of IRR, NPV, and BCR, and low value of PBP made the two drying systems cost efficient. However, when the incremental rate of return (ROR) was determined, 66% incremental ROR was much greater than the minimum attractive rate of return (MARR = 4.875%). Consequently, the greenhouse solar drying method proved to be the most suitable method for small-to-medium-scale entrepreneurs to produce crispy mango.

1. Introduction

Mango is an important export fruit and grown nationwide in Thailand. Of more than 60 described mango varieties grown in Thailand, 7 are grown for export: ‘Nam Dok Mai’, ‘Khiao Sawoei’, ‘Chok Anan’, ‘Nang Klang Wan’, ‘Pim Sen Dang’, ‘Maha Chanok’ and ‘Rad’ [1]. The export volume of fresh mangoes in 2020 was 90,245 tons, which was valued at USD 79 million. Nam Dok Mai is the most popular variety for export [2]. Thailand exports mangoes mainly to Japan, Korea, Vietnam, China and Malaysia [3]. Nam Dok Mai mango is preferred in many countries due to favorable characteristics, such as attractive color, good taste and great flavor [1]. The main harvest period is limited to about three months yearly in Thailand, April to June. The lack of adequate storage leads to high postharvest losses of the perishable fruits. In addition, overproduction causes low prices and increases the demand for appropriate preservation methods of fresh mango flesh [4]. Processed mango products are fast gaining markets and commanding better prices than other processed tropical fruits. Drying is a major postharvest process of fruit product in Thailand responding to demands of dried fruits from both domestic and export markets [5].
Two drying methods, namely, greenhouse solar and hot air dryers, are commonly used to dry mangoes to obtain a product that provides a beneficial effect on human health, a high-quality product and a positive trade potential [4,5,6]. Solar and hot air drying are available to prevent the deterioration of products and to reduce the drying time [7]. The technology, particularly solar air type, can be the most profitable compared with open-air sun drying, due to better quality and quantity [8]. The greenhouse solar dryer is a system that uses solar power, a renewable source of energy, and is applied primarily by many small-to-medium-sized agricultural industries. It can reduce operational costs in terms of fuel [9]. To dry mangoes on a large or commercial scale, many enterprises use electricity-powered, hot air dryers and liquefied petroleum gas burners. It is generally claimed that hot air dryers are not economical due to their high energy cost [7].
However, greenhouse solar drying is known as a capital-intensive technology in terms of initial investment and operating costs, compared to hot air dryers. Thus, it becomes necessary that small-and-medium-sized enterprises (SMEs) using dryers are able to not only offset the higher cost of dried fruits, but also provide adequate profits. Many studies have reported the economic analysis of solar dryers used for different kinds of agricultural products, but rarely for hot air dryers. Janjai [5] showed that using a solar dryer—a parabolic roof structure covered with polycarbonate sheets on a concrete floor—offered payback periods (PBP) of about 0.65 years for drying tomatoes. Boonyasri et al. [10] reported that the PBP of a greenhouse solar dryer used for drying pork was 1.15 years. In India, a hybrid solar–electrical dryer used to dry ginger was reported to gain PBP of 0.5 years with an initial investment of INR 9000 [7]. The net present value (NPV) of such a hybrid solar dryer is INR 20,700, and the benefit-to-cost ratio of a hybrid solar dryer is 2.3. Kondareddy et al. [11] analyzed that the PBP and benefit-to-cost ratio of a modified solar dryer (MSD) with thermal energy storage for drying blood fruit in India were 2.16 years and 2.07, respectively. Another related study carried out an economic evaluation of the solar dryer for drying fruit and vegetables, revealing high values of an internal rate of return (IRR) at 84.4%, and low value of PBP at 1.42 years [8]. ELkhadraoui et al. [12] analyzed the economics of solar drying systems for red pepper, indicating that solar dryers took 17 h to reduce the initial moisture content from 12.15 to 0.17 g water/g dry matter, with 1.77 years of PBP.
This study aimed (a) to investigate the effect of temperature and velocity of air drying on dried mangoes quality; (b) to compare performance and economic efficiency of greenhouse solar and hot air drying; and (c) to determine the most suitable method for drying crispy mangoes in SMEs.

2. Materials and Methods

2.1. Material and Sample Preparation

Thai mango cultivar, ‘Nam Dok Mai’, samples were purchased during the 2021 harvest season from a local market in Nakhon Pathom, Thailand. Then, they were cleaned and washed. Green mature fruits were allowed to reach a degree of approximately 75% to 80% full ripeness [4]. The moisture contents of the fresh mangoes were 85% wet basis (wb), and the mangoes were left for ripening at room temperature. The mangoes were hand-peeled and cut into slabs of 30 × 70 mm and 2 mm thick, using a specially designed stainless-steel cutter. Slices of approximately 3 g were placed on trays as a single layer for all drying experiments.

2.2. Experimental Study

To compare the two drying methods in the first experiment, mango slices were dried using a hot air electric dryer separate from the greenhouse type solar dryer. A hot air electric dryer contains 24 trays, produced by Kluay Namthai Trading Groups, Bangkok, Thailand. The greenhouse solar dryer consisted of a parabolic roof structure made from polycarbonate sheets on a concrete floor. The small-scale solar system used in this study had a width of 6.0 m, length of 8.2 m, and height of 3.25 m. For hot air drying, three drying temperatures were conducted at 70, 80, and 90 °C, and the air velocity was fixed at 1 m/s. Samples were dried to a constant weight with a final moisture content of 12.5% wb to study the drying kinetics. The same procedures were applied for greenhouse solar drying, in which each experiment was conducted from 9:00 a.m. to 4:00 p.m. on each day until the desirable product moisture content of 12.4% wb was obtained.
In the second experiment, a combination of the same types of greenhouse solar and hot air dryers was used to improve the quality and profitability of production. The mango slices were firstly dried in the greenhouse solar dryer for 3 h at 60 °C, followed by the hot air dryer at 90 °C for 30 min with a fixed air velocity at 1 m/s.

2.3. Drying Rate of Mango Slices

The initial moisture content of mangoes on wb was calculated using the equation below.
M i = w i w f w i
where Mi is the initial moisture content of mango slices on wb expressed in %, wi is the initial weight of mango slices in g, and wf is the final weight of mango slices in g [8].
The samples were weighed every 10 min in the first hour of drying until the weight of the samples was constant, and the initial and final moisture contents of the samples were determined. The recorded moisture contents for each sample were then used to plot the drying curves. The drying rate is expressed as the amount of evaporated moisture over time. The drying rate of mango slices was calculated using the following equation.
DR = MC 1 MC 2 t 1 t 2  
where MC1 and MC2 are the moisture content of samples (kg water/kg dry matter) at time t1 and t2 (m), respectively [13].
The water activity (aw) of the samples was determined using a water activity meter (AQUALAB 4TE, METER Group, Pullman, WA, USA), measured at 25 °C. All measurements were carried out in triplicate.

2.4. Color Measurement of Mango Slices

Three slices of fresh and dried samples were individually taken for a color measurement in the CIE color coordinates (L*, a*, b*), using a colorimeter (Colorflex E spectrophotometer, Hunter Lab, Reston, VA, USA). L*, a*, and b* values represent black to white (0–100), green to red (−60 to +60) and blue to yellow (−60 to +60), respectively. The total difference of the color parameters was calculated using the following equation [5,13].
Δ E = ( L 0 * L t * ) 2 + ( a 0 * a t * ) 2 + ( b 0 * b t * ) 2
where Lo*, ao*, and bo* are the initial values of color parameters at the initial time, zero and Lt*, at*, and bt* are the value at drying time, t.

2.5. Total Phenolics and Antioxidant Analysis

2.5.1. Sample Extraction

Sample extraction was modified following Singleton and Rossi [14]. Fresh and dried slices mango samples were finely chopped. Then 5 g of fresh sliced mango samples and 1 g of dry sliced mango samples were placed in a 50 mL centrifuge tube, followed by adding 20 mL of 100% methanol. Then samples were homogenized for 15 s and extracted by an ultrasonic machine for 30 min at control temperature around 38 to 40 °C. After that, the samples were filtered with Whatman no. 4 filter paper, facilitated using a vacuum pump. Then, 50 mL of the extracted sample was used to analyze total phenolic content and antioxidant capacity by both the DPPH and FRAP methods. All analyses were triplicated.

2.5.2. Total Phenolic Content

A slight modification of the Folin–Ciocalteau assay stated by Hossain et al. [15] was adopted to analyze the total phenolic content of the extracted samples. A 0.2 mL sample was placed in an amber flask, followed by adding 1 mL of 10% Folin–Ciocalteu’s phenol reagent (vol/vol). Then, samples were mixed using a shaker for 5 min, and 1.6 mL of 7.5% sodium carbonate solution (weight/volume) was added. Shaking and storing in the dark for 120 min before absorbance was measured at a wavelength of 765 nm. Values were reported in milligram equivalent gallic acid (GAE)/100 g dry weight. The standard equation obtained for total phenolic content is y = 0.062x + 0.0239, where y represents absorbance values at a wavelength of 765 nm and x is the concentration of standard solutions of gallic acid.

2.5.3. DPPH and DPPH Radical Scavenging Activity

The DPPH antioxidant analysis was slightly modified from the method of Siddiq et al. [16]. A 0.1 mL sample was placed in a 20 mL centrifuge tube, then 3.9 mL of DPPH solution was added. The mixture was mixed using a vortex mixer and stored in the dark for 120 min before being measured for absorbance at a wavelength of 517 nm using methanol as a blank. Values were reported in milligrams of Trolox/100 g dry weight. The standard equation obtained for DPPH is y = −0.02x + 0.6265, where y represents absorbance values at a wavelength of 517 nm and x is the concentration of standard solutions of Trolox. The findings are presented as percentage of radical scavenging activity using the following equation.
DPPH   radical   scavenging   activity   ( % ) = A O A S A O × 100
where Ao is absorbance of control solution and As is absorbance of the DPPH solution with sample extracts.

2.5.4. Ferric Reducing Antioxidant Power (FRAP) Assay

The FRAP antioxidant capacity analysis was slightly modified from the method of Vongsak et al. [17]. A 950 µL FRAP solution was transferred to a microcentrifuge tube, followed by 50 µL of sample then mixed well before keeping in the dark for 10 min. Absorbance was measured at a wavelength of 595 nm using methanol as a blank. Values were reported in mg of ferrous sulfate per 100 g of sample. The standard equation obtained for the FRAP antioxidant capacity is y = 0078x + 0.0399, where y represents absorbance values at a wavelength of 595 nm and x is the concentration of standard solutions of ferrous sulfate.

2.6. Sensory Evaluation of Mango Slices

Sensory evaluation of dried mango slices for texture appearance was performed using 100 participants between 20 and 25 years of age (mean = 23 years old) recruited in Silpakorn University on Nakhon Pathom Campus. A 9-point hedonic score was used to evaluate the difference between samples. The score for texture appearance, taste, and overall acceptability was individually assessed: 1 to 4 for strongly disliked to slightly disliked, 5 for indifference, and 6 to 9 for slightly liked to strongly liked.

2.7. Economic Analysis of the Dryer

For the success and commercialization of dryer technology, establishing the economic viability of the product is important. The economics of greenhouse solar and hot air dryers was analyzed. The total capital cost (Cc), annualized capital cost (Cac), annualized salvage value (Sa), annualized cost (Ca), and annualized electricity cost of fans (Cae), all expressed in monetary terms, were computed using Equations (5)–(9), respectively [10,18]. In the equations, Cmf is the cost of fresh material used, Cl is the labor cost of drying operation, i is the interest rate, n is the dryer life span (yr), S is salvage, Cm is annualized maintenance cost, Cp is the cost of packaging yearly, R is the number of hours the fans operated yearly, W is the rated power consumption of fans, and Ce is the unit charge for electricity.
C c = C mf + C l
C ac = C c   × i ( 1 + i ) n ( 1 + i ) n 1
S a   = S × i ( 1 + i ) n 1
C a   = C ac + C m + C p + C ae S a
C ae = R × W × C e
In addition, the most commonly used economic viability, namely, NPV, IRR, PBP, and BCR, were all investigated in this study.
NPV is the difference between the present value of cash inflows and the present value of cash outflows over a specific period of time and is used to quantify the expected profitability of an investment. It has to be >0 to be profitable and is calculated using the following formula [8,9].
NPV = n = 0 N R n C n ( 1 + i ) n
where Cn denotes operating cost of dryers; Rn denotes the benefit received or revenue of dryers; i denotes the interest rate; n denotes the specific year of investing and N is the total number of years of investing which was 15 years in this study according to the lifespan of the solar dryer [5].
The IRR is the discount rate making the NPV of all cash flows equal to zero. IRR calculations rely on the same formula as NPV. IRR is used to estimate the profitability of potential investment and is calculated using the formula below [8,9].
IRR = i : n = 0 N R n ( 1 + i ) n = n = 0 N C n ( 1 + i ) n
PBP refers to the amount of time recover the cost of an investment, and the shortest PBP is an investment before the cost of investment can be recovered. PBP is calculated using the formula below [8,9,18].
PBP =   investment   cos ts   annual   benefit annual   cos ts
The BCR is a ratio used to summarize the overall relationship between the relative costs and benefits and can be expressed in monetary terms. A BCR greater than 1.0 is expected to deliver a positive NPV to investors. BCR was calculated using the formula below [8,18].
BCR =   benefits   received   per   year total   capital   cos t   of   the   dryer

2.8. Statistical Analysis

Statistical analyses were performed using SPSS (Version 18, SPSS Inc., Chicago, IL, USA). Significant differences among the means for each treatment at 5% of the probability level were evaluated using one-way ANOVA and Tukey–Kramer’s multiple comparison test.

3. Results and Discussion

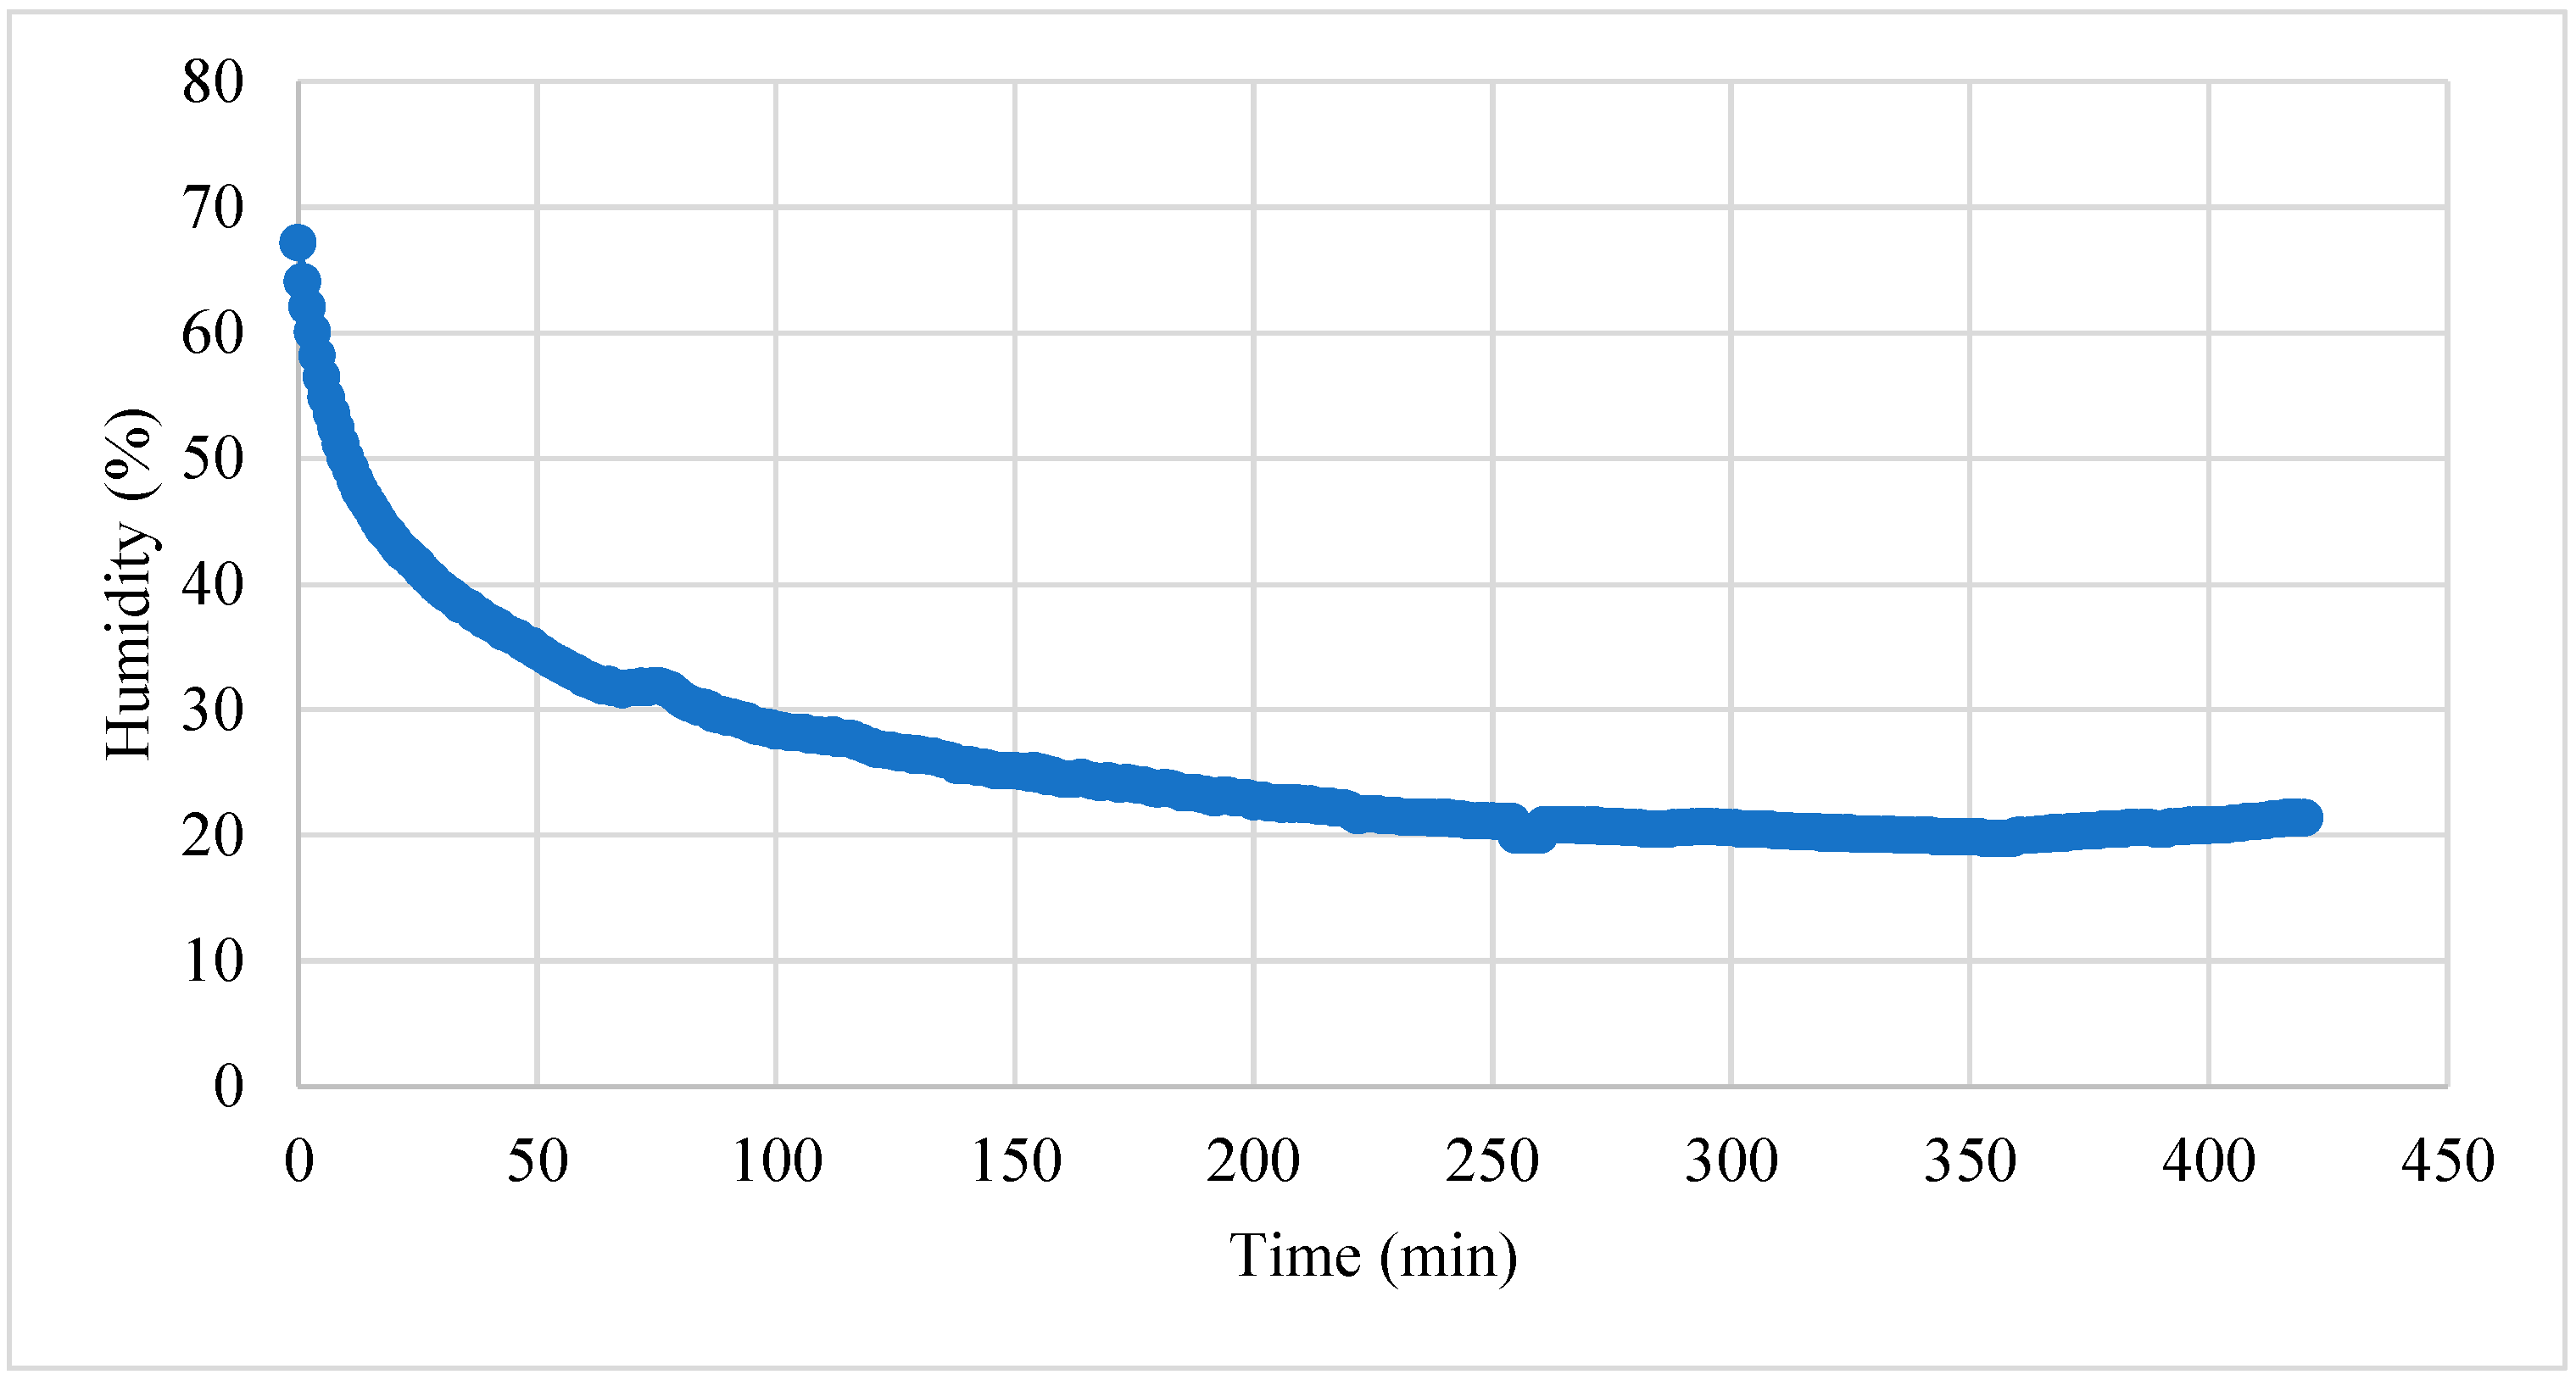
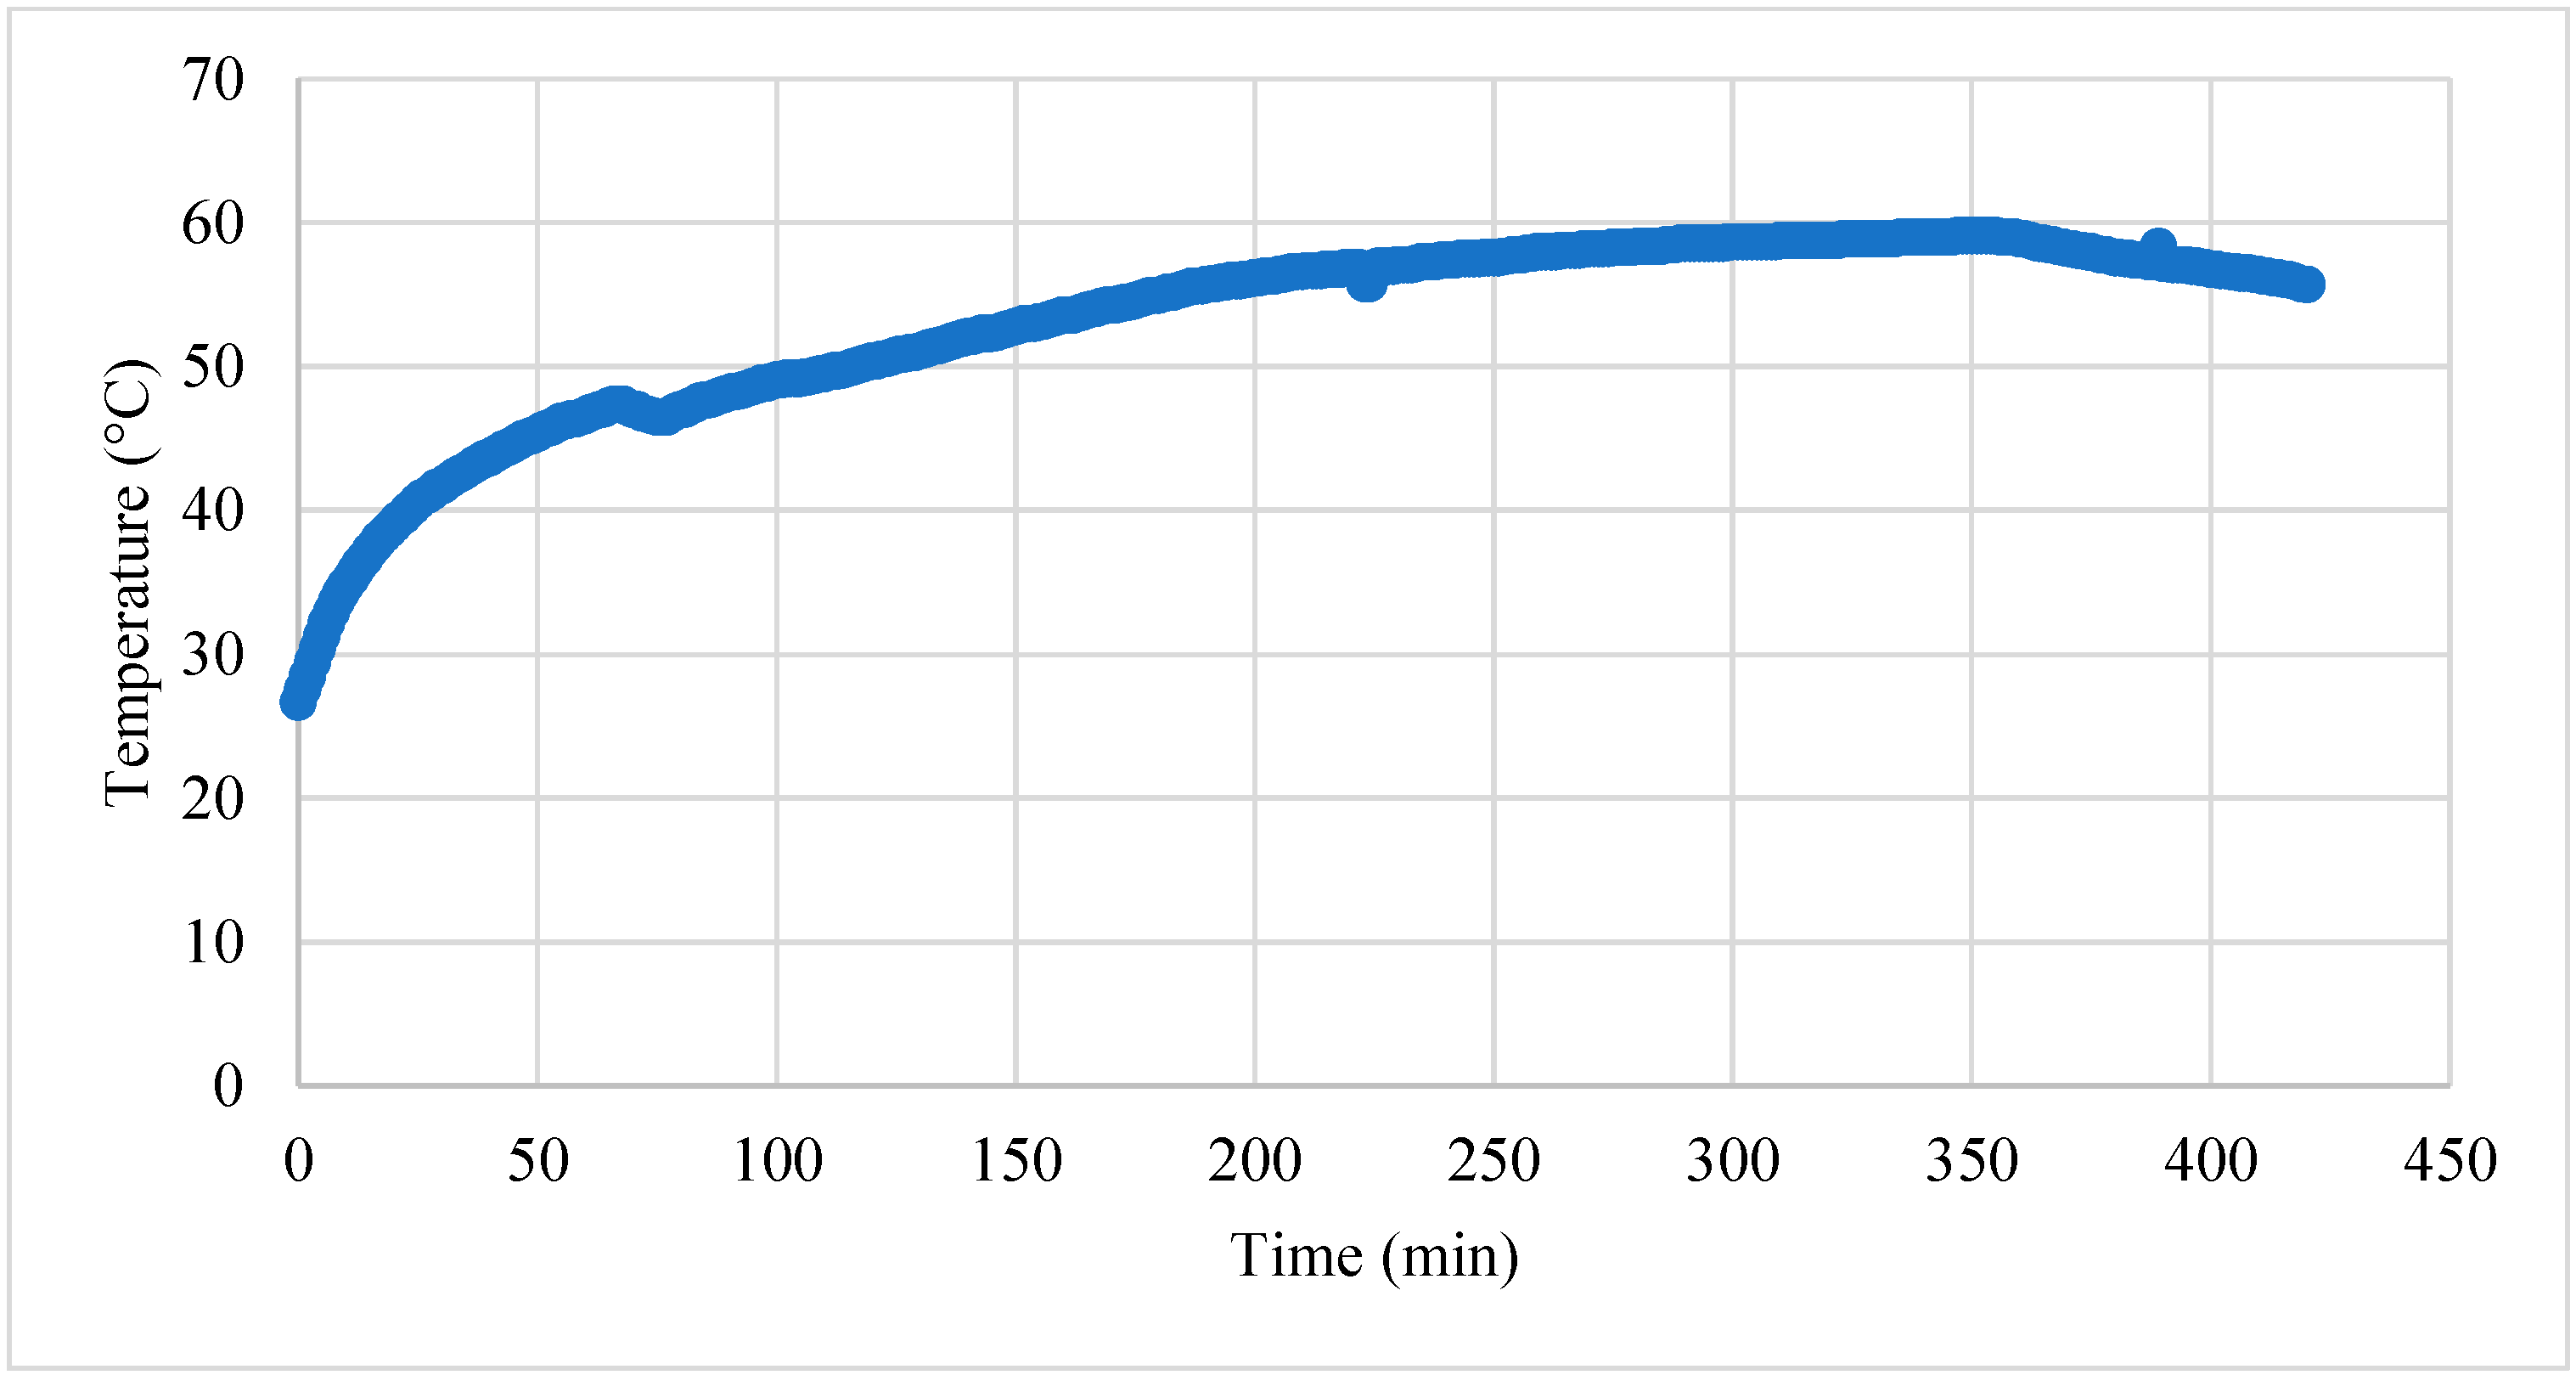
3.1. Drying Curves and Drying Rate

Drying curves of mango slices at different temperatures using hot air dryers are presented in Figure 1. Typical drying characteristics were observed, i.e., drying rates as indicated by moisture reduction over time. Drying rates at 80 and 90 °C were higher than that at 70 °C, especially during the first 20 min. The initial moisture content of the mango slices ranged from 85.5 to 85.7% wb, while the final moisture of the dried product ranged from 12.4% to 12.6% wb. The water activity of the final product ranged from 0.2 to 0.3.
Drying experiments of mango slices in greenhouse dryers were carried out on 26 June 2021. Drying curves and drying rates of mango slices using greenhouse solar dryers are shown in Figure 2 and Figure 3. Regarding the variation of measured moisture content (dry basis) of mango slices each time of drying, it could be observed that the moisture content reduced from 8.68% to 0.14% within 1 day when using greenhouse solar dryers. The drying rate in greenhouse solar dryers increased sharply when the moisture fell below 6.95%. The shape of the drying curve indicates a rapid moisture content removal from the product at the initial stage, which later decreased with the increase in drying time. Thus, the moisture ratio decreased continually with the drying time [7,8].
Figure 4 shows the hourly variation of solar radiation during the typical experiment runs of solar drying in the solar greenhouse dryers. When drying mango slices, solar radiation increased sharply from 9:00 a.m. to noon but considerably decreased in the afternoon. The solar radiation on the horizontal surface outside the greenhouse solar dryers reached the highest point at 955 W/m2.
Relative air humidity under the greenhouse and drying air temperatures inside greenhouse dryers are shown in Figure 5 and Figure 6. The relative humidity of the air under the greenhouse ranged from 19.8% to 67.2%. The drying air temperature recorded inside the greenhouse ranged from 26.7 to 59.1 °C. During the drying process, the moisture content of the mango slices was reduced from 85.5% wb to 12.4% wb within 1 day (7 h) of exposure in greenhouse solar dryers. The hot air dryer showed a higher drying temperature than that of greenhouse solar dryers. The total time of drying using hot air dryers was lower at 1.5 h (at 70 °C for 1 h, followed by 90 °C for 30 min). In the greenhouse solar drying system, solar radiation was transmitted and absorbed by air and the concrete floor, and then collected in the system rather than reflected to the environment due to the parabolic shape and double layer of the polycarbonate sheet [13]. The temperature in this dryer is directly related to the solar radiation. Thus, increased solar radiation increases air temperature. The relative humidity (%) of the air inside greenhouse solar dryers decreased when the temperature increased. When considering mango slices of this study, one sunny day was reasonably sufficient to finish the drying process using greenhouse solar dryers, similar to the study of Pott et al. [4].

3.2. Color Parameters

The appearance of fresh and dried mango slices from different drying conditions are illustrated in Figure 7. The color characteristics of fresh and dried mango slices from different drying conditions are shown in Table 1. The color of fresh mango slices was 63.81 for L*, 1.14 for a*, and 27.65 for b*. After drying mango slices using hot air and solar dryers, their L* and b* values tended to be lower than that of fresh mango slices, whereas a* values slightly increased. Notably, the drying systems significantly affected the color parameters. The solar greenhouse dryer gave a significantly higher total color change of dried mango slices compared to that of fresh samples (p ≤ 0.05).

3.3. Sensory Evaluation

After the initial comparison of two separate drying systems, only dried mango slices from hot air drying were suitable for sensory evaluation, while those from greenhouse solar drying were not only non-crispy, but also turned into rubberlike pieces. Therefore, the sensory evaluation of mango slices from hot air drying is shown only in Table 2. The 100 participating panelists for dried mango slices tasting included females (70%) and males (30%). The majority of participants fell within the ages ranging from 20 to 25 years old, with only 5% of participants being aged 25 years and above. The mean liking scores for all quality attributes were between 7.0 and 8.0, denoting that the sample was satisfactory at moderately like.

3.4. Economic Analysis of the Dryers

Economic analysis of the hot air and greenhouse solar dryers was based on actual cost incurred, and other necessary parameters were taken based on the present economic situation in Thailand as shown in Table 3. The values of the four economic attributes, namely, BCR, NPV, and IRR and PBP, are compared in Table 4.
According to details in Table 3, if crispy mango production was conducted year-round, assuming working 5 days a week, each technology would result in the production of 240 batches annually. Based on the difference in drying capacity for each drying system, solar dryers could perform at 96 kg per batch, while hot air dryers were used twice to obtain the same capacity of solar dryers. The ratio of fresh mangoes to dried mango (final product) weight was 3 to 1, so approximately 7680 kg of final dried mango slices were produced annually.
The BCR for hot air and greenhouse solar dryers were found to be 24.47 and 15.73, respectively indicating a high positive NPV to an investor. The calculated PBPs for hot air and greenhouse solar dryers were 0.43 and 0.67 years, respectively. The PBPs are apparently short, considering the life span of the dryers to be 15 years, suggesting both dryers to be cost effective. Compared with other research, evidently, the PBP of solar dryer in this study was less than one year, similar to the studies of Janjai [5] and Chaudhari et al. [7] but is considered to be better than other related studies, such as Poonia et al. [8], Kondareddy et al. [11], and ELkhadraoui et al. [12] as detailed in the Introduction. The IRRs of hot air and greenhouse solar dryers were about 233% and 150%, respectively, while the NPVs of hot air and greenhouse solar dryers were USD 151,417 and USD 190,050, respectively. In this case, the IRR of a solar dryer was much higher than the minimum attractive rate of return (MARR) (4.875%) (see Table 3), similar to the study by Poonia et al. [8] revealing the high IRR of a solar dryer for drying fruit and vegetables, making the project economically feasible. Initially, hot air drying offered a better return on investment than greenhouse solar drying, according to its higher IRR and BCR values with lower PBP value. However, when considering only NPV, greenhouse solar dryers appeared to be the better choice.
With the choice controversy arising from evaluating economic viability mentioned above, it became necessary to undertake an incremental cash flow between hot air and greenhouse solar dryers. According to Blank and Tarquin [19], when two mutually exclusive alternatives are evaluated, using an incremental rate of return (ROR) can identify the one alternative that is the best economically. Table 5 summarizes the analysis of an incremental ROR of the two technologies. Because the ROR of 66% on the extra investment is more than 4.875% minimum attractive rate of return (MARR) (see also Table 3), the higher cost of the greenhouse solar dryer was selected. The extra investment of USD 6,451 was economically justified by the higher annual revenue and salvage estimates at the end of year 15.
In addition, using greenhouse solar dryers can help saving electricity costs up to USD 1766 annually. This agreed with other studies reporting that the use of greenhouse solar dryers considerably reduced postharvest losses in terms of energy consumption and carbon emissions released [5,8,9,12].

3.5. Improving the Quality and Profitability of Crispy Mango Production for a Small-Scale Entrepreneur Using a Combination Hot Air and Greenhouse Solar Dryers

Regarding the first phase results described previously, it remained clear that the disadvantage of producing crispy mango using greenhouse solar dryers was the poor product quality. The advantage, however, was higher production volumes and profits. When using hot air dryers, the disadvantage was high energy consumption with high cost, while the advantage was that the product quality was more satisfactory. After discussing with the manager of one of the small community enterprises for processing fruit and agricultural products, located in Sam Phran District, Nakhon Pathom Province, the critical success factors of such a small-scale entrepreneur are customer satisfaction and entrepreneur profitability. It was suggested to combine the two drying methods of greenhouse solar and hot air dryers to improve product quality, increase production capability and cost saving.
Based on the later request of the main target customers, one of the main quality criteria of crispy mangos was their functional properties in terms of total phenolic content and antioxidant capacity properties. Therefore, profitability, sensory evaluation, total phenolics, and antioxidant capacity properties were subsequently assessed to choose the most suitable method for drying crispy mango production in SMEs.
The total time of crispy mango slices using a combination of greenhouse solar and hot air dryer (GH+HA) was 3.5 h at 60 °C for 3 h in greenhouse solar dryers, followed by 90 °C for 30 min in hot air dryers. With this combination process, the entrepreneur can increase the production capability of two batches daily (from 96 to 192 kg/day) when using greenhouse solar dryers. Hot air dryers reduced drying time from 1.5 to 0.5 h for fresh sliced mango (48 kg/batch) saving electricity cost around 67% (from USD 3.38/batch to USD 1.22/batch). Thus, further economic analysis was carried out.
The NPV is a method to analyze the profitability of a project investment. Therefore, NPV was undertaken for the combined greenhouse and hot air drying as shown in Table 6. The cash inflow of USD 34,204 at the end of the first year to the fifteenth year was discounted at the rate of 4.875%, and the present value was calculated as USD 358,044. The initial investment was USD 19,355. Hence, the NPV was USD 338,689. Such cash flow points out the advantage of a combined drying method over a single method, either hot air or greenhouse drying (see also Table 4).
Table 7 presents the results of sensory evaluation of mango pieces obtained by using greenhouse solar combined with hot air dryers. The 100 participating panelists for dried mango slices tasting included females (80%) and males (20%). The majority of participants fell within the ages ranging from 20 to 25 years old, with only 10% of participants being aged 25 years and above. The mean preference scores for all quality attributes were slightly higher than the previous result presented in Table 2. However, the result was found to be very satisfactory based on the 9-point hedonic scale.
As mentioned above, as per customer request, the impact of different drying processes on antioxidant activity was an additional objective in this study phase. DPPH, percentage of radical scavenging and FRAP were the parameters to evaluate the properties using Trolox as a standard. The antioxidant capacity of the mango studied (value of DPPH and FRAP) related to free radical scavenging in the samples. The value of DPPH and percentage of free radical scavenging are summarized in Table 8. The highest free radical scavenging was found in fresh samples, which was 72.28 ± 2.64 mgTrolox/100 g db, while dried mango slices (crispy mango) had significantly lower contents of 62.98 ± 1.09 and 64.65 ± 0.71 mgTrolox/100 g db in HA, and GH+HA, respectively. The percentages of radical scavenging also showed a similar trend as the DPPH value of fresh and dried mango slices. Nevertheless, a significant difference was found in percentage of radical scavenging between the HA and GH+HA samples, which were 34.19 ± 0.61 and 37.64 ± 0.43, respectively. Based on FRAP in Table 8, fresh mango showed the highest values, while the results of HA and GH+HA did not significantly differ.
The total phenolic content of the mango products was reduced after drying as shown in Table 8, which was associated with reduced DPPH and FRAP. The results were similar to those of the studies of Fratianni et al. [20] and Rumanum et al. [21]. The results indicated an impact of the drying treatment on antioxidant activity. In the drying process, temperature of food increases, causing plant damage and decreased phenolic contents. Nevertheless, new antioxidant compounds are formed due to the Maillard reaction. Hence, the antioxidant potential is raised after drying [15]. Önal et al. [22] also pointed out that evaporation can decrease phenolic compounds due to high temperature [23]. Nonetheless, the products decompose rapidly under high temperature. The antioxidant activity of dried sample did not significantly differ from other studies. The antioxidant capacity (DPPH and FRAP) of crispy mango using combined greenhouse solar and hot air drying did not significantly differ (p ≤ 0.05). However, the GH and HA combination provided dried mango slices of %radical scavenging and total phenolic not significantly different from those of fresh mango (p ≤ 0.05), but significantly higher than those of HA.

4. Conclusions

The drying process of mango slices using hot air dryers was better than that of greenhouse solar dryers in terms of product quality and drying time. The use of hot air dryers considerably reduced the drying time and improved the dried product quality. The drying time to achieve a moisture content of 12.4% wb for the dried product using the hot air dryers was reduced to 1.5 h compared with 7 h when using greenhouse solar dryers. Nevertheless, the economic evaluation of the greenhouse solar and hot air dryers indicated high IRR values (150%, 233%) and low PBP values (0.67 years, 0.43 years), making these two separate drying systems very cost efficient. The BCR of both drying systems was high (>1), indicating high positive NPV to an investor.
Comparing both technologies, the incremental ROR evaluation of greenhouse solar and hot air dryers equaling 66% was greater than MARR, so the incremental investment in greenhouse solar over hot air dryers was desirable, thus making greenhouse solar dryers cost effective, economically viable and environmentally sustainable. However, more studies to improve drying processes and methods when using only the greenhouse solar drying system are still needed to maintain a satisfactory quality of dried mangoes. Nonetheless, after the experiment of using a greenhouse solar dryer together with a hot air dryer improved the quality of the crispy mango product for a small-scale entrepreneur, crispy mango ultimately provided higher customer satisfaction, profitability, total phenolic content and antioxidant capacity.

Author Contributions

Conceptualization, creation, investigation, data analysis, writing—original draft and preparation, K.K.; data collection and experiment, P.K.; validation, writing—review and editing, P.S. and S.K.; supervision, S.K. All authors have read and agreed to the published version of the manuscript.

Funding

This research received no external funding.

Institutional Review Board Statement

Ethic review and approval were waived for this study, as it did not involve personally identifiable or sensitive data.

Informed Consent Statement

The study did not involve human or sensitive data.

Acknowledgments

The authors would like to thank the Department of Physics, Faculty of Science, Silpakorn University for giving us permission to use the greenhouse solar dryer throughout this study.

Conflicts of Interest

The authors declare no conflict of interest.

References

  1. Yasunaga, E.; Fukuda, S.; Takata, D.; Spreer, W.; Sardsud, V.; Nakano, K. Quality changes in fresh mango fruits (Mangifera indica L. ’Nam Dok Mai’) under actual distribution temperature profile from Thailand to Japan. Environ. Control Biol. 2018, 56, 45–49. [Google Scholar] [CrossRef] [Green Version]
  2. Office of Agriculture Economics (OAE). Foreign Agricultural Trade Statistics of Thailand in 2020. Available online: http://impexp.oae.go.th/service/export.php (accessed on 11 June 2021).
  3. Matulaprungsan, B.; Wongs-Aree, C.; Penchaiya, P.; Boonyaritthongchai, P.; Srisurapanon, V.; Kanlayanarat, S. Analysis of critical control points of post-harvest diseases in the material flow of Nam Dok Mai mango exported to Japan. Agriculture 2019, 9, 200. [Google Scholar] [CrossRef] [Green Version]
  4. Pott, I.; Konard, S.; Scherer, R.; Wiriyacharee, P.; Mühlbauer, W. Quality of five Thai mango cultivars (Mangifera indica L.) using a solar drying system. CMU J. 2004, 3, 189–198. [Google Scholar]
  5. Janjai, S. A greenhouse type solar dryer for small-scale dried food industries: Development and dissemination. Int. J. Energy Environ. Eng. 2012, 3, 383–398. [Google Scholar]
  6. Guarte, R.C.; Pott, I.; Mühlbauer, W. Influence of drying parameters on β-carotene retention on mango leather. Fruits 2005, 60, 255–265. [Google Scholar] [CrossRef]
  7. Chaudhari, R.H.; Gora, A.; Modi, V.M.; Chaudhari, H. Economic analysis of hybrid solar dryer for ginger drying. Int. J. Curr. Microbiol. App. Sci. 2018, 7, 2725–2731. [Google Scholar] [CrossRef]
  8. Poonia, S.; Singh, A.K.; Santra, P.; Jain, D. Economic analysis of inclined solar dryer for drying of fruit and vegetables. Int. J. Agric. Sci. 2019, 11, 9154–9159. [Google Scholar]
  9. Krungkaew, S.; Kingphadung, K.; Kwonpongsagoon, S.; Mahayothee, B. Costs and benefits of using parabolic greenhouse solar dryers for dried herb products in Thailand. Int. J. GEOMATE 2020, 18, 96–101. [Google Scholar] [CrossRef]
  10. Boonyasri, M.; Lertsatitthanakorn, C.; Wiset, L.; Poomsa-ad, N. Performance analysis and economic evaluation of a greenhouse dryer for pork drying. KKU Eng. J. 2011, 38, 433–442. [Google Scholar]
  11. Kondareddy, R.; Sivakumaran, N.; Radha Krishnan, K.; Nayak, P.K.; Sahu, F.M.; Singha, S. Performance evaluation and economic analysis of modified solar dryer with thermal energy storage for drying of blood fruit (Haematocarpus validus). J. Food Process. Preserv. 2021, 45, e15653. [Google Scholar] [CrossRef]
  12. ELkhadraoui, A.; Kooli, S.; Farhat, A. Study on effective of mixed mode solar greenhouse dryer for drying of red pepper. Int. J. Sci. Res. Eng. Technol. 2015, 3, 143–146. [Google Scholar]
  13. Mahayothee, B.; Thamsala, T.; Khuwijitjaru, P.; Janjai, S. Effect of drying temperature and drying method on drying rate and bioactive compounds in cassumunar ginger (Zingiber montanum). J. Appl. Res. Med. Aromat. Plants 2020, 18, 100262. [Google Scholar] [CrossRef]
  14. Singleton, V.L.; Rossi, J.A. Colorimetry of total phenolics with phosphomolybdic phosphotungstic acid reagents. Am. J. Enol. Vitic. 1965, 16, 144–158. [Google Scholar]
  15. Hossain, M.A.; Dey, P.; Joy, R.I. Effect of osmotic pretreatment and drying temperature on drying kinetics, antioxidant activity, and overall quality of taikor (Garcinia pedunculata Roxb.) slices. Saudi J. Biol. Sci. 2021, 28, 7269–7280. [Google Scholar] [CrossRef]
  16. Siddiq, M.; Sogi, D.S.; Dolan, K.D. Antioxidant properties, total phenolics, and quality of fresh-cut ’Tommy Atkins’ mangoes as affected by different pre-treatments. LWT-Food Sci. Technol. 2013, 53, 156–162. [Google Scholar] [CrossRef]
  17. Vongsak, B.; Kongkiatpaiboon, S.; Jaisamut, S.; Konsap, K. Comparison of active constituents, antioxidant capacity, and α-glucosidase inhibition in Pluchea indica leaf extracts at different maturity stages. Food Biosci. 2018, 25, 68–73. [Google Scholar] [CrossRef]
  18. Kiburi, F.G.; Kanali, C.L.; Kituu, G.M.; Ajwang, P.O.; Ronoh, E.K. Performance evaluation and economic feasibility of a solar-biomass hybrid greenhouse dryer for drying banana slices. Renew. Energy Focus 2020, 34, 60–68. [Google Scholar] [CrossRef]
  19. Blank, L.; Tarquin, A. Engineering Economy, 7th ed.; McGraw-Hill: New York, NY, USA, 2012; pp. 278–300. [Google Scholar]
  20. Fratianni, A.; Adiletta, G.; Di Matteo, M.; Panfili, G.; Niro, S.; Gentile, C.; Farina, V.; Cinquanta, L.; Corona, O. Evolution of carotenoid content, antioxidant activity and volatiles compounds in dried mango fruits (Mangifera indica L.). Foods 2020, 9, 1424. [Google Scholar] [CrossRef] [PubMed]
  21. Rumainum, I.M.; Worarad, K.; Srilaong, V.; Yamane, K. Fruit quality and antioxidant capacity of six Thai mango cultivars. Agric. Nat. Resour. 2018, 52, 208–214. [Google Scholar] [CrossRef]
  22. Önal, B.; Adiletta, G.; Crescitelli, A.; Di Matteo, M.; Russo, P. Optimization of hot air drying temperature combined with pre-treatment to improve physico-chemical and nutritional quality of ’Annurca’ apple. Food Bioprod. Process. 2019, 115, 87–99. [Google Scholar] [CrossRef]
  23. AlFarsi, M.; Alasalvar, C.; Morris, A.; Baron, M.; Shahidi, F. Compositional and sensory characteristics of three native sun-dried date (Phoenix Dactylifera L.) varieties grown in Oman. Agric. Food Chem. 2005, 53, 7586–7591. [Google Scholar] [CrossRef] [PubMed]
Figure 1. Drying curves of hot air dryers at 70, 80 and 90 °C.
Processes 10 00311 g001
Figure 2. Drying curve of greenhouse solar dryers.
Processes 10 00311 g002
Figure 3. Drying rate of greenhouse solar dryers.
Processes 10 00311 g003
Figure 4. Variation of solar radiation with the time of day when drying mango slices.
Processes 10 00311 g004
Figure 5. Relative humidity inside greenhouse solar dryers while drying mango slices.
Processes 10 00311 g005
Figure 6. Temperature inside greenhouse solar dryers while drying mango slices.
Processes 10 00311 g006
Figure 7. Appearance of fresh and dried mango slices from different drying systems.
Processes 10 00311 g007
Table 1. Color characteristics of fresh and dried mango slices from different drying conditions.
Drying MethodsL*a*b*ΔE
Fresh63.81 ± 0.85 c1.14 ± 0.27 a27.65 ± 0.56 c0.00 a
Hot air dryer37.94 ± 0.27 b3.01 ± 0.29 c25.86 ± 0.55 b26.00 ± 0.23 b
Solar greenhouse dryer34.50 ± 0.21 a2.56 ± 0.32 b18.88 ± 0.52 a30.63 ± 0.74 c
Note: Values followed by different letters in the same column indicate significant differences (p ≤ 0.05).
Table 2. Sensory evaluation of mango slices using hot air drying.
ColorSweetnessSournessCrispnessOverall Quality
7.72 ± 1.047.55 ± 1.137.37 ± 1.197.89 ± 0.837.89 ± 0.83
Table 3. Details for computation of economic analysis.
No.ItemValueUnits
Hot Air DryerGreenhouse Solar Dryer
1Capital cost of dryer645212,903USD
2Life span of dryer1515Years
3Capacity of dryer4896Kg/batch
4Price of fresh mango1.611.61USD/kg
5Price of dried mango7.747.74USD/kg
6Salvage value10% of capital cost10% of capital costUSD
7Maintenance cost10% of capital cost1% of capital costUSD
8Operational labor cost12.906.45USD/batch
9Electricity cost3.68-USD/batch
10Packaging cost0.060.06USD/kg
11Interest rate4.8754.875%/year
Note: (1 USD = 31 Baht).
Table 4. Economic analysis of mango slices using hot air and greenhouse solar dryers.
ItemsHot Air DryerGreenhouse Solar DryerUnit
NPV151,417190,050USD
IRR233150%
PBP
BCR
0.43
24.47
0.67
15.73
Years
-
Table 5. Incremental ROR analysis of mango slices using hot air and greenhouse solar dryers.
YearCash Flow in USDIncremental Cash Flow
(GH-HA)
Hot Air Dryer *Greenhouse Solar Dryer **
0−6452−12,903−6451
1–1515,05119,3284277
156451290645
Incremental i * (ROR)66%
Note: * Hot air dryer = HA; ** Greenhouse solar dryer = GH.
Table 6. Net present value analysis of dried mango slices using a combination of greenhouse solar and hot air dryers.
YearCash Flow in USDCompound Interest FactorPresent Value
(PV, USD)
HAGHGH+HA(P/A, 4.875%, 15)
0−6452−12,903−19,355-−19,355
1–1511,20522,99934,20410.4679358,044
NPV338,689
Table 7. Sensory evaluation of mango slices using a combination of greenhouse solar and hot air drying.
ColorSweetnessSournessCrispnessOverall Quality
8.28 ± 0.978.05 ± 1.388.00 ± 1.218.04 ± 1.038.02 ± 0.89
Table 8. Total phenolic and antioxidant activity of fresh and dried mango slices from different drying methods.
Drying MethodDPPH
(mgTrolox/100 g db)
%Radical ScavengingFRAP Value
(μmoL/100 g db)
Total Phenolic
(mg GAE/100 g db)
Fresh72.28 ± 2.64 b39.26 ± 1.48 b40.62 ± 0.11 b34.41 ± 4.91 b
HA62.98 ± 1.09 a34.19 ± 0.61 a29.07 ± 2.32 a20.85 ± 3.18 a
GH+HA64.65 ± 0.71 a37.64 ± 0.43 b30.23 ± 2.31 a29.55 ± 4.59 b
Note: All the values in the table are shown as mean ± SD (n = 3). Different letters for the same measurement from the same location (leaf shoots and mature leaves) and standard compounds indicate p ≤ 0.05 using one-way ANOVA.
Publisher’s Note: MDPI stays neutral with regard to jurisdictional claims in published maps and institutional affiliations.

