Article

Simultaneous Optimization of Extraction Yield, Phenolic Compounds and Antioxidant Activity of Moroccan Propolis Extracts: Improvement of Ultrasound-Assisted Technique Using Response Surface Methodology

1
Laboratory of Natural Substances, Pharmacology, Environment, Modeling, Health, and Life Quality, Department of Biology, Faculty of Sciences Dhar El Mehraz, University Sidi Mohamed Ben Abdellah, Fez 30000, Morocco
2
Physico-Chemical Laboratory of Inorganic and Organic Materials, Materials Science Center, Ecole Normale Superieure, Mohammed V University, Rabat 10210, Morocco
*
Author to whom correspondence should be addressed.
Processes 2022, 10(2), 297; https://doi.org/10.3390/pr10020297
Submission received: 4 January 2022 / Revised: 23 January 2022 / Accepted: 24 January 2022 / Published: 2 February 2022

Abstract

:
Propolis has given rise to refreshing interest in recent years in the field of conventional medicine. Its extraction represents an important process that requires optimal conditions, which strongly affect the yield of extraction, total polyphenols, flavonoid content, and radical scavenging capacity markers. The objective of the present study was to optimize the ultrasound-assisted extraction conditions of Moroccan propolis. The studied responses were the extraction yield, total polyphenols, flavonoid contents (TPC, TFC), and antioxidant activity of the extract evaluated by DPPH-IC50 and FRAP-EC50 assays. The response surface methodology (RSM) and specifically the Box–Behnken design (BBD) were used, taking into account three variables: sonication time (min), solvent/propolis ratio (mL/g), and ethanol concentration (%). After the realization of experiments and data analysis, optimal response values were 15.39%, 192 mg GAE/g of propolis,45.15 mg QEq/g, 29.8 µg/mL, and 128.3 µmol Fe2+/g for extraction yield, TPC, TFC, DPPH-IC50, and FRAP-EC50, respectively. Besides, optimal ultrasound extraction conditions were 15 min for sonication time, 30 mL/g for solvent/propolis ratio, and 40% for ethanol concentration. All obtained experimental values were in good agreement with the predicted values, suggesting that using an experimental design in the ultrasound-assisted extraction process and optimization was prudently chosen.

1. Introduction

Propolis is collected by bees on the buds and bark of certain trees, creating specific modifications in the hive bymixing their salivary secretions with wax, pollen, and collected natural resins [1]. Moreover, bees use propolis to maintain their hives by sealing holes in their honeycombs, by smoothing out the internal walls, and by sheltering the entrance of the hive from intruders [2].
Investigational studies have shown that propolis composition varies according to geographic location, botanic origin, and bee species [3,4]. Over 300 chemical components were identified in propolis, such as phenolic acids, flavonoids, and terpenes; these compounds are the most important contributors to the biological activity of propolis [5], including analgesic and anti-inflammatory effects [6,7] and antimicrobial, antioxidative, immunomodulatory, anti-diabetic and anti-tumor activities [8,9,10,11].
The choice of the extraction solvent type, solvent ratio, and extraction proceduresare key steps in obtaining high-quality propolis with good pharmacological values [12]. Thereby, many traditional and modern methods of extraction of propolis are used, such as maceration, soxhlet extraction, microwave-assisted extraction, supercritical CO2 extraction, ultrasound-assisted extraction, high-pressure extraction methods, natural deep eutectic solvents for propolis extraction, and solid-phase extraction [13].
Traditional extraction methods can present more disadvantages, such as loss of chemical compounds due to oxidation, hydrolysis, and ionization during extraction, as well as long extraction times [14]. Pellati et al.revealed that using a modern method to extract propolis (microwave-assisted extraction) allowed for a reduction of extraction time and solvent use [15], while Bankova et al. suggested that, among all methods used, ultrasound-assisted extraction (UAE) remains as a simple and efficient extraction method, and it seems to be the optimal method for the extraction of propolis, considering extraction time, extraction yield, and cost effectiveness [13].
The use of experimental design and, more specifically, response surface methodology is becoming increasingly common in the optimization of polyphenol extraction from natural products, and propolis is one of them [16,17,18].These chemometric tools are used by establishing a mathematical model that evaluates multiple parameters and their interactions using quantitative data, effectively optimizing complex extraction procedures, and thus reducing the number of experimental trials required [18,19].In this same approach, a Box–Behnken design (BBD)was applied to optimize extraction yield, total polyphenols and flavonoids, and antioxidant activity by using DPPH-IC50 and FRAP-EC50 tests from Moroccan propolis.

2. Materials and Methods

2.1. Chemicals and Reagents

All chemicals and reagents used in this study were of analytical grade. The optical density was measured on a spectrophotometer (Spectrophotometer 2005 UV–Vis, Selecta, Barcelona, Spain).

2.2. Propolis Preparation

Moroccan propolis samples were directly collected by beekeepers from Apis mellifera hives from the Fez-Meknes region located in the Sidi Hrazem area (33°57′49.134″ N; 4°47′29.758″ W), after honey extraction. The collection of propolis was started by scratching hive walls and frames, followed by the removal of debris of wood and bees. The obtained propolis was protected from light and immediately transferred to the laboratory where it was stored at −20 °C for 10 days before being comminuted. Wax was removed by successive multiple extractions with cyclohexane and dichloromethane according to Boissard et al. [20].

2.3. Ultrasound-Assisted Extraction (UAE) Conditions and Yield of Extraction

The extractions were carried out in a ultrasonic water bath using a direct sonication method with some modifications [21].The frequency of sonication was 50 kHz, the power was 120 W and the temperature was fixed at 35 °C. Five grams of Moroccan propolis were treated according to the conditions proposed by each experiment of BBD. Then, each mixture was filtered through Whatman paper and dried in a rotavapor at 40 °C to remove the solvent. Finally, the extracts were kept in dark tubes and stored at −20 °C for later use.
The yield (%) of the extraction was evaluated by comparing the dry weight of the extract with the initial weight of propolis using the formula described by Oroian and al [22]:
Yield = ( Wpe | Wpm ) × 100
where Wpe is the weight of propolis extract (g) and Wpm is the weight of the initial dried sample.

2.4. Total Phenolic Content Determination

Total phenolic concentration in the studied propolis sample was determined spectrophotometrically according to the Folin–Ciocalteu colorimetric method. Then, 50 μL of each extract solution was mixed with 0.2 mL of the Folin–Ciocalteu reagent and 0.8 mL of 15.9% sodium carbonate. The final volume was made to reach 3 mL with distilled water. The sample was left for 20 min at room temperature, and the absorbance was measured at 760 nm [23]. Calibration was performed using gallic acid as a reference compound.
The results were expressed as mg of gallic acid equivalent per g of crude propolis (mg GAE/g). Triplicate measurements were performed for each extract.

2.5. Total Flavonoids Content Determination

The total flavonoid content (TFC) of the propolis sample was determined using aluminum chloride, and the results were expressed as mg quercetin equivalent per g of crude propolis (mg QE/g). Two milliliters (2 mL) of the stock solution were mixed with 3 mL of a 5% aluminum chloride solution. After 30 min of incubation, the absorbance of the reaction mixture was measured at 437 nm against a methanol blank [24]. TFC determination was carried out in triplicate, and a standard curve of quercetin was established.

2.6. Diphenyl-1-Picrylhydrazyl (DPPH) Assay

The radical-scavenging activity of selected propolis was determined spectrophotometrically with minor modifications. Crude Moroccan propolis extract was prepared as 1 mg/mL in methanol. Fifty microliters of different concentration samples were added to 5 mL of 0.004% methanol solution of DPPH reagent. After 30 min of incubation in the dark at room temperature, the change in absorbance was measured at 517 nm [25].
The assay was carried out in triplicate, and the percentage of inhibition was calculated using the following formula:
%   Inhibition = { ( A 0 A 1 ) | A 0 } × 100
where A0 and A1 are the absorbances at 30 min of the control and the sample, respectively.

2.7. Ferric-Reducing Antioxidant Power Assay

FRAP working solution was prepared freshly each time: 0.3 M acetate buffer (pH = 3.6), 0.01 M TPTZ (2,4,6-tripyridyl-s-triazine) in 0.04 M of HCl and 0.02 M of FeCl3 6H2O was mixed in 10:1:1 (v/v/v) and kept away from light, and then 0.075 mL of EEP was added to 2.25 mL of FRAP working solution and 0.225 mL of deionized water; the mixture was vortexed and incubated at 37 °C for 30 min. A calibration curve should be prepared with ferrous sulfate (200, 400, 600, 800, and 1000 µM).
The absorbance was measured at 593 nm. FRAP working solution with deionized water instead of a sample was used as a blank. Results were carried out in triplicate and expressed as µmol Fe2+/g [26].

2.8. HPLC-DAD Analysis

Individual phenolic separation and detection were analyzed using PROMINENCE HPLC: High-Performance Liquid Chromatography system (Shimadzu, Kyoto, Japan) equipped with a DAD detector, a Rheodyne™ Sampler with a loop of 20 µL, a degasser and a quaternary pump. The separation of the polyphenols was carried out on an Agilent Zorbax C18 column with dimension 4.6 mm × 250 mm × 5 um 100 Å, with a flow rate of 1 mL/min of a mobile phase at a ternary gradient of acetonitrile methanol and acidify water. The column temperature was 30 °C, and the sample injection volume was 20 µL. Under the same conditions, syringic acid and tyrosol standards were injected to determine the response factor. A solvent system consisting of 0.2% orthophosphoric acid in water (solvent A) and methanol (solvent B) and acetonitrile (solvent C) was used with the following gradient The gradient was as follows: 0 min—96% A/2% B/2% C; 40 min—50% A/25%B/25% C; 45 min—40% A/30% B/30% C; 60 min—50% B/50% C; 72 min—96% A/2% B/2%. Phenolic compounds were identified based on the retention times of standard materials, and quantification was achieved by the absorbance recorded in the chromatograms relative to external standards, at 280 nm catechin, epicatechin, p-coumaric acid, caffeic acid, pinoresinol, cinnamic acid, apigenin, ferulic acid, and kaempferol. All standards calibration curves showed high degrees of linearity (R2 > 0.99) [27].

2.9. Experimental Design for Optimization

Response surface methodology (RSM) is a multivariate statistical technique that involves complex calculations for the optimization process [28,29]. This approach develops a suitable experimental design that combines all of the independent variables and uses the data input from the experiment to finally produce a set of equations that can give a theoretical value of an output. The outputs are obtained from a well-designed regression analysis that is based on the controlled values of independent variables [30].
In the current study, a three-factors, three-level Box–Behnken design (BBD) was employed with a total of 15 experiments to evaluate the effect of the independent variables, including sonication time(min)/X1, solvent/material ratio (mL/g)/X2, and ethanol concentration (% v/v)/X3 on yield of extraction, TPC, TFC and free radical scavenging using DPPH-IC50 and FRAP-EC50 tests. The ultrasound-assisted extractions were conducted under experimental conditions, as represented in Table 1.

2.10. Mathematical Model

To predict the optimum ultrasound-assisted extraction conditions for studied responses from Moroccan propolis and to express the interaction between dependent and independent factors, the BBD design assumed that interactions with each other are measured using a second-order polynomial model as below [31].
Y = b0 + b1 X1 + b2 X2 + b3 X3 + b12 X1X2 + b13 X1X3 + b23 X2X3 + b11 X12 + b22 X22 + b33 X32 + ε
where Y represents the predicted response value; X1, X2, X3 are the independent variables; b0 represents the theoretical mean value of the response when all factors are in the level 0; b1, b2, b3 are linear regression coefficients; b11, b22, b33 are quadratic regression coefficients; b12, b13, b23 are interaction regression coefficients; and ε: is the regression error term.

2.11. Statistical Analysis

JMP software V14 and Design EXPERT V.12 were used to analyze the experimental data through the investigation of the influence of the independent variables on the response factors [32]. The software was used to generate response surfaces and contour plots according to the Box–Behnken design, while holding a variable constant in the quadratic polynomial second-order model. The results were expressed as the mean ± standard deviation (SD). The comparison of means was performed by ANOVA and Tuckey’s multiple comparison test. The main effect of regression was considered to be statistically significant for p values less than 0.05. In this way, the ratio between the mean square regression (MSR) and the mean square residual (MSr) and F-ratio R/r was used to establish if the model was statistically significant. In addition, the ratio between the mean square lack of fit (MSLOF) and the mean square pure error (MSPE) and F-ratio LOF/PE was used to evaluate if the model was well adjusted to the observations. High values of F ratio LOF/PE evidenced a lack of fit for the model. The coefficient of determination R2 was used to judge the adequacy of the postulated model. Finally, the significance of coefficients was analyzed based on their p value using the t test. The coefficient is considered statistically significant if the p value is less than 0.05.

2.12. Optimization Tools

Contours plots were used to depict the effects of the three factors on the dependent variables. The red color on the contour plot indicates that the response is increasing, and blue one indicates that it is decreasing; an elliptical contour plot indicates that the interaction between the variables is significant [33]. Next, the simultaneous optimization of the five responses considered in our study was realized by Derringer’s desirability function; this approach determines the most desirable response values by setting the optimum conditions [34]. This tool allows us to give the exact optimal adjustment with a percentage between0 and 1. The value 0 is assigned when the factors lead to an unacceptable response, and a value of 1 represents the maximum desired response [35].

3. Results and Discussion

3.1. Box–Behnken Design Results

To identify the effects of process variables on the ultrasound-assisted extraction (UAE) of total polyphenol and flavonoid content and DPPH-IC50 and FRAP-EC50 from Moroccan propolis, the three-level Box–Behnken design was conducted using three variables (sonication time, solvent-to-material ratio, and concentration ratio). The various combinations of coded experimental conditions with their respective experimental observed data (mean from triplicates) are represented in Table 2. The experiments were carried out after randomization, and every response was the average of three replicates. Before proceeding with the design analysis, the recorded means for the experiments of each of the five responses show a statistically significant difference (p value < 0.05). Furthermore, Tuckey’s test shows the means, which can be considered statistically identical.
The results of the present study indicate that extraction yield, total polyphenol, and flavonoid content range from 6% to 13.1%, from 86.98 to 187.21 mg GAEq/g, and from 9.7 to 38.8 mg QEq/g of crude propolis, respectively, and antioxidant activity tests DPPH-IC50 and FRAP-EC50 range respectively from 21 to 39.15 µg/mL and form 100 to 130.21 µmol Fe2+/g. This result confirms the influence of the chosen parameters on all studied responses.

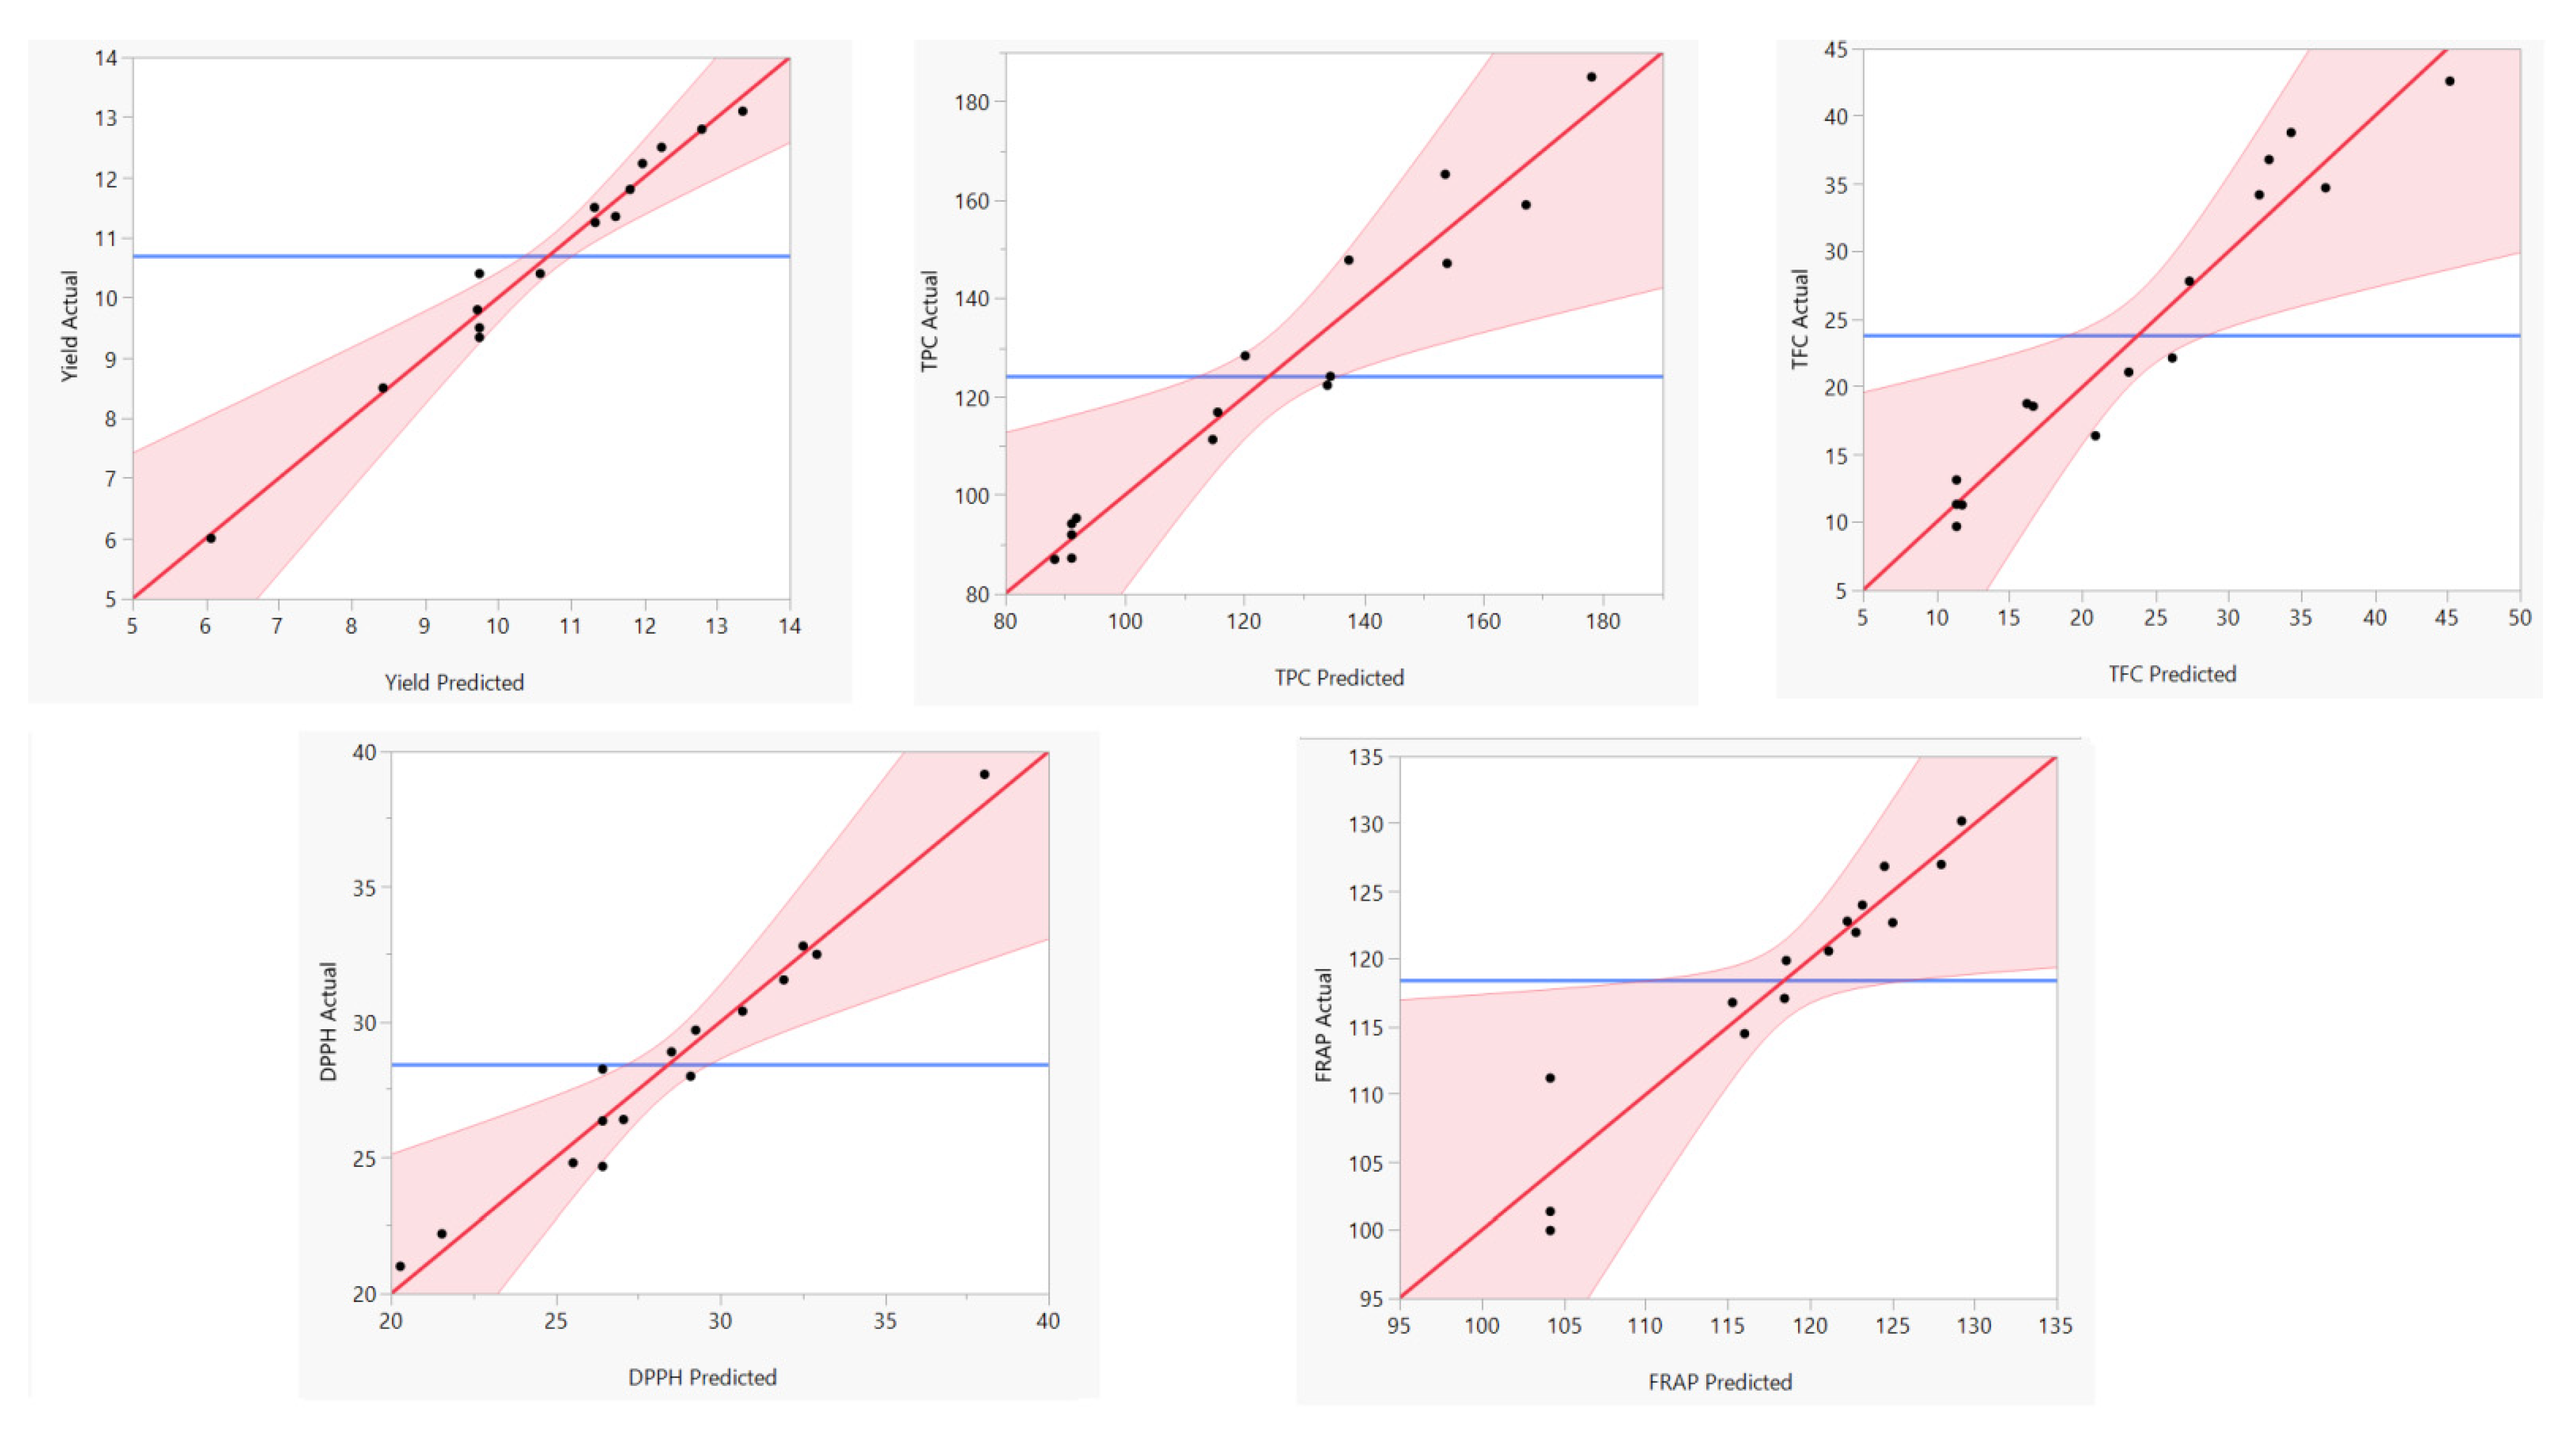
3.2. Statistical Validation of the Postulated Model

The obtained experimental data were statistically analyzed by analysis of variance (ANOVA), and the significance of the regression coefficients was evaluated by their corresponding p values. The results in Table 3 indicatethat the models were significantly established due to the extremely low probability value (p < 0.05) for all studied responses where p values were 0.001, 0.04, 0.0156, 0.0052, and 0.0370 for extraction yield, TPC, TFC, DPPH-IC50, and FRAP-EC50, respectively.
The calculated F-Ratio(R/r) for every response was higher than the value of F-ratio (0.05; 9.5) at 95%of confidence level, which is equal to 4.77. In addition, all responses show a lack of fit due to their p values, which were more than 0.05, and all their calculated F-ratios (LOF/PE) were lower than the theoretical F value (0.05; 3.2) at 95%of confidence, which was equal to 19.15. The coefficients of determination R2 were equal to 98%, 94.3%, 93.7%, and 96% for extraction yield TPC, TFC, DPPH-IC50, and FRAP-EC50, respectively.
These values reflect a good relationship between the experimental and predicted values. These results are confirmed by the graphs in Figure 1, demonstrating a linear curve for the actual values in terms of the predicted ones.

3.3. Model Parameter Estimation and Fitted Models

Table 4 gives the linear effects of all studied factors, their quadratic and interaction terms, their Student’s t statistical values, and the observed probability (p value) of each of them. The relationships between the tested parameters and the responses were explained by the following regression equations (2, 3, 4, 5, and 6 for yield of extraction, TPC, TFC, DPPH-IC50, and FRAP-EC50, respectively).
For the response yield of extraction, the constants b0, the linear terms b2 and b3; the binary interaction terms b12, b13, b23; and the quadratic interaction b11 were statistically significant coefficients. As a result, the mathematical model is represented by the following equation:
Yyield = 9.75 − 0.75 X2 − 0.43 X3 − 1.07 X1X2+ 0.68 X1X3 − 2.34 X2X3 + 1.94 X211 + ε
Concerning the TPC response, statistically significant coefficients were the constant b0; the linear terms b1, b3; and the quadratic interaction term b11. Its mathematical model is described by the equation:
YTPC = 91.14 − 12.52 X3 + 50.48 X211 + ε
As for the TFC response, the significant coefficients were the constant b0; the linear terms b1 and b3; and the quadratic interaction terms b11 and b33. The following equation represents the model linking TFC to the parameters:
YTFC = 11.39 − 5.58 X1 − 8.89 X3 + 11.61 X11 + 7.08 X33 + ε
Regarding the DPPH-IC50 response, the constants b0; the linear terms b2, b3; and the quadratic terms b11 and b33 were the statistically significant coefficients. Therefore, the fitted model is represented by the following equation:
YDPPH-IC50 = 26.43 + 2.70 X2 + 1.78 X3 − 2.38 X11 + 6.61 X33 + ε
Finally, only the constant b0 and quadratic interaction terms b11 and b22 were the statistically significant coefficients for the FRAP-EC50 response. The following equation represents its mathematical model:
YFRAP-EC50 = 104.20 + 13.88 X211 + 7.72 X222 + ε
The effects of the studied parameters, their estimated values, and their observed p values are significantly influenced by the sonication time (X1), the ratio (X2), and the concentration of solvent (X3), which were compatible with the results found in other studies [21,36].
The ethanol-distilled water mixtures give better extraction efficiency of phenolic compounds compared to single-solvent systems [37]. By increasing the proportion of distilled water to ethanol, the polarity of the solvent increases; thus, the solvent system will be able to extract polyphenols with high polarity, those with low polarity, and those with medium polarity [38]. Several studies have shown the importance of the concentration of the solvent compared to other factors [39,40,41]. Moreover, the extraction time, if combined with the right type of solvent, influences extraction yield, TPC, TFC, and antioxidant activity [42].

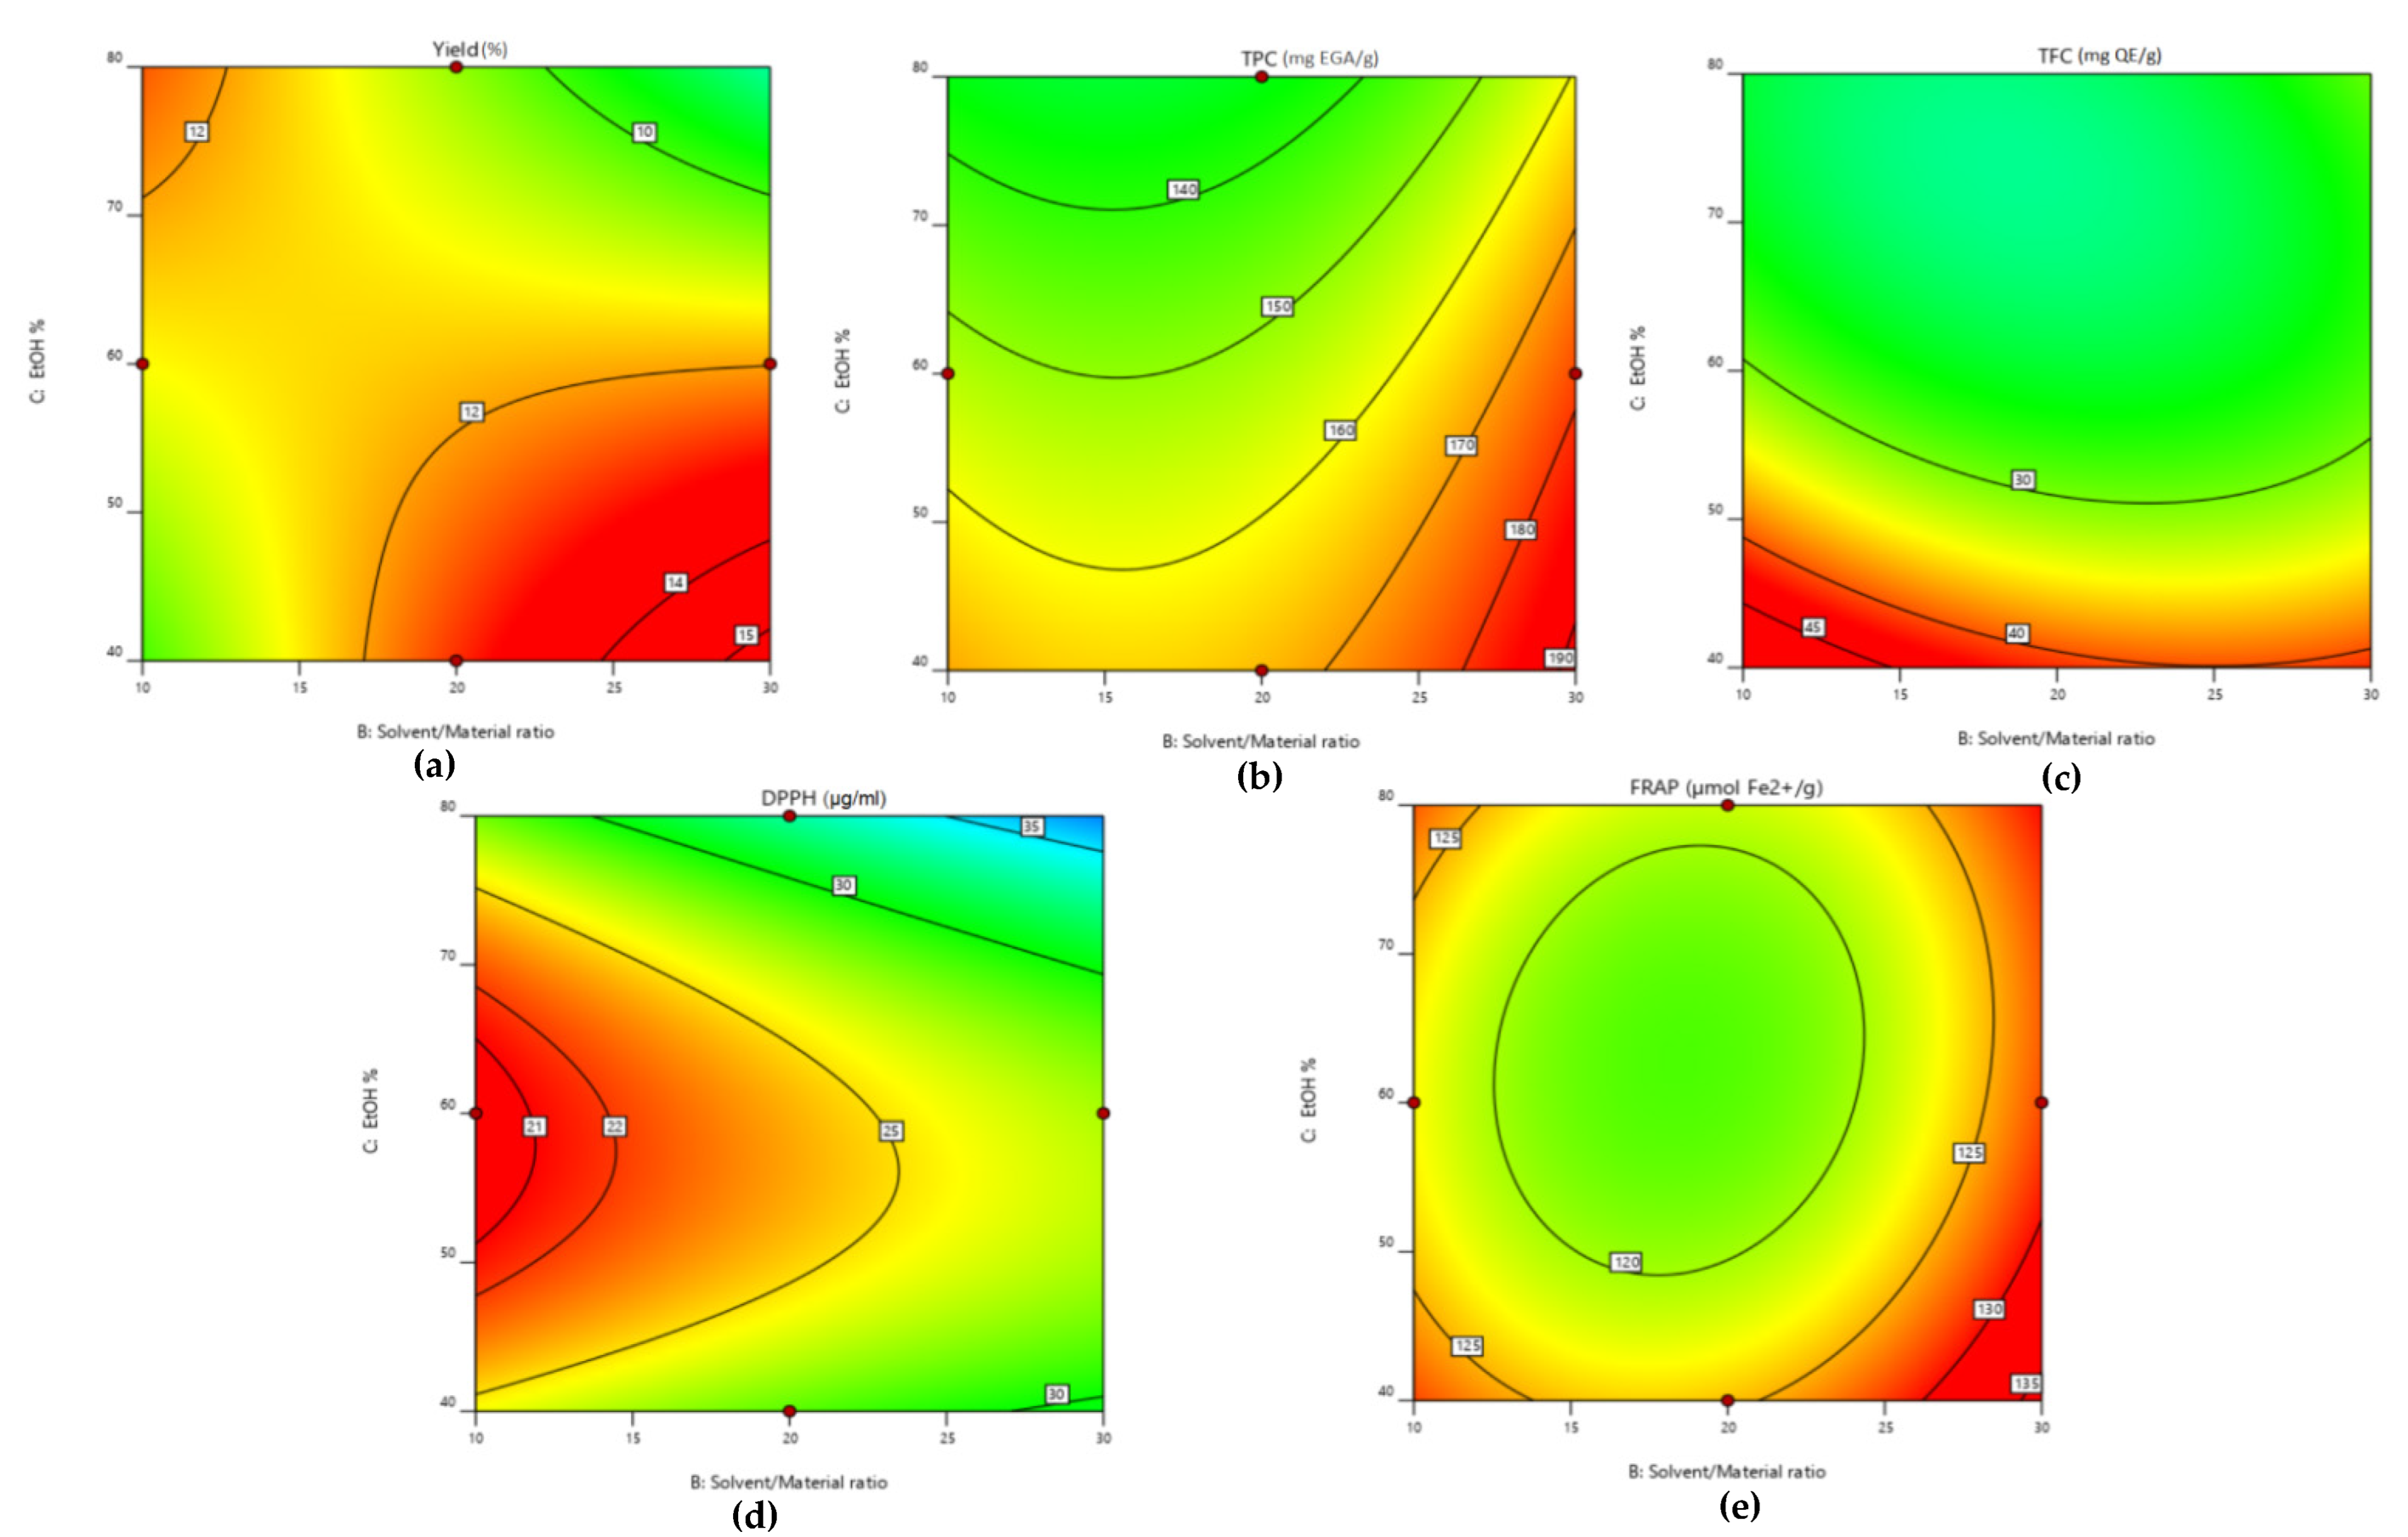
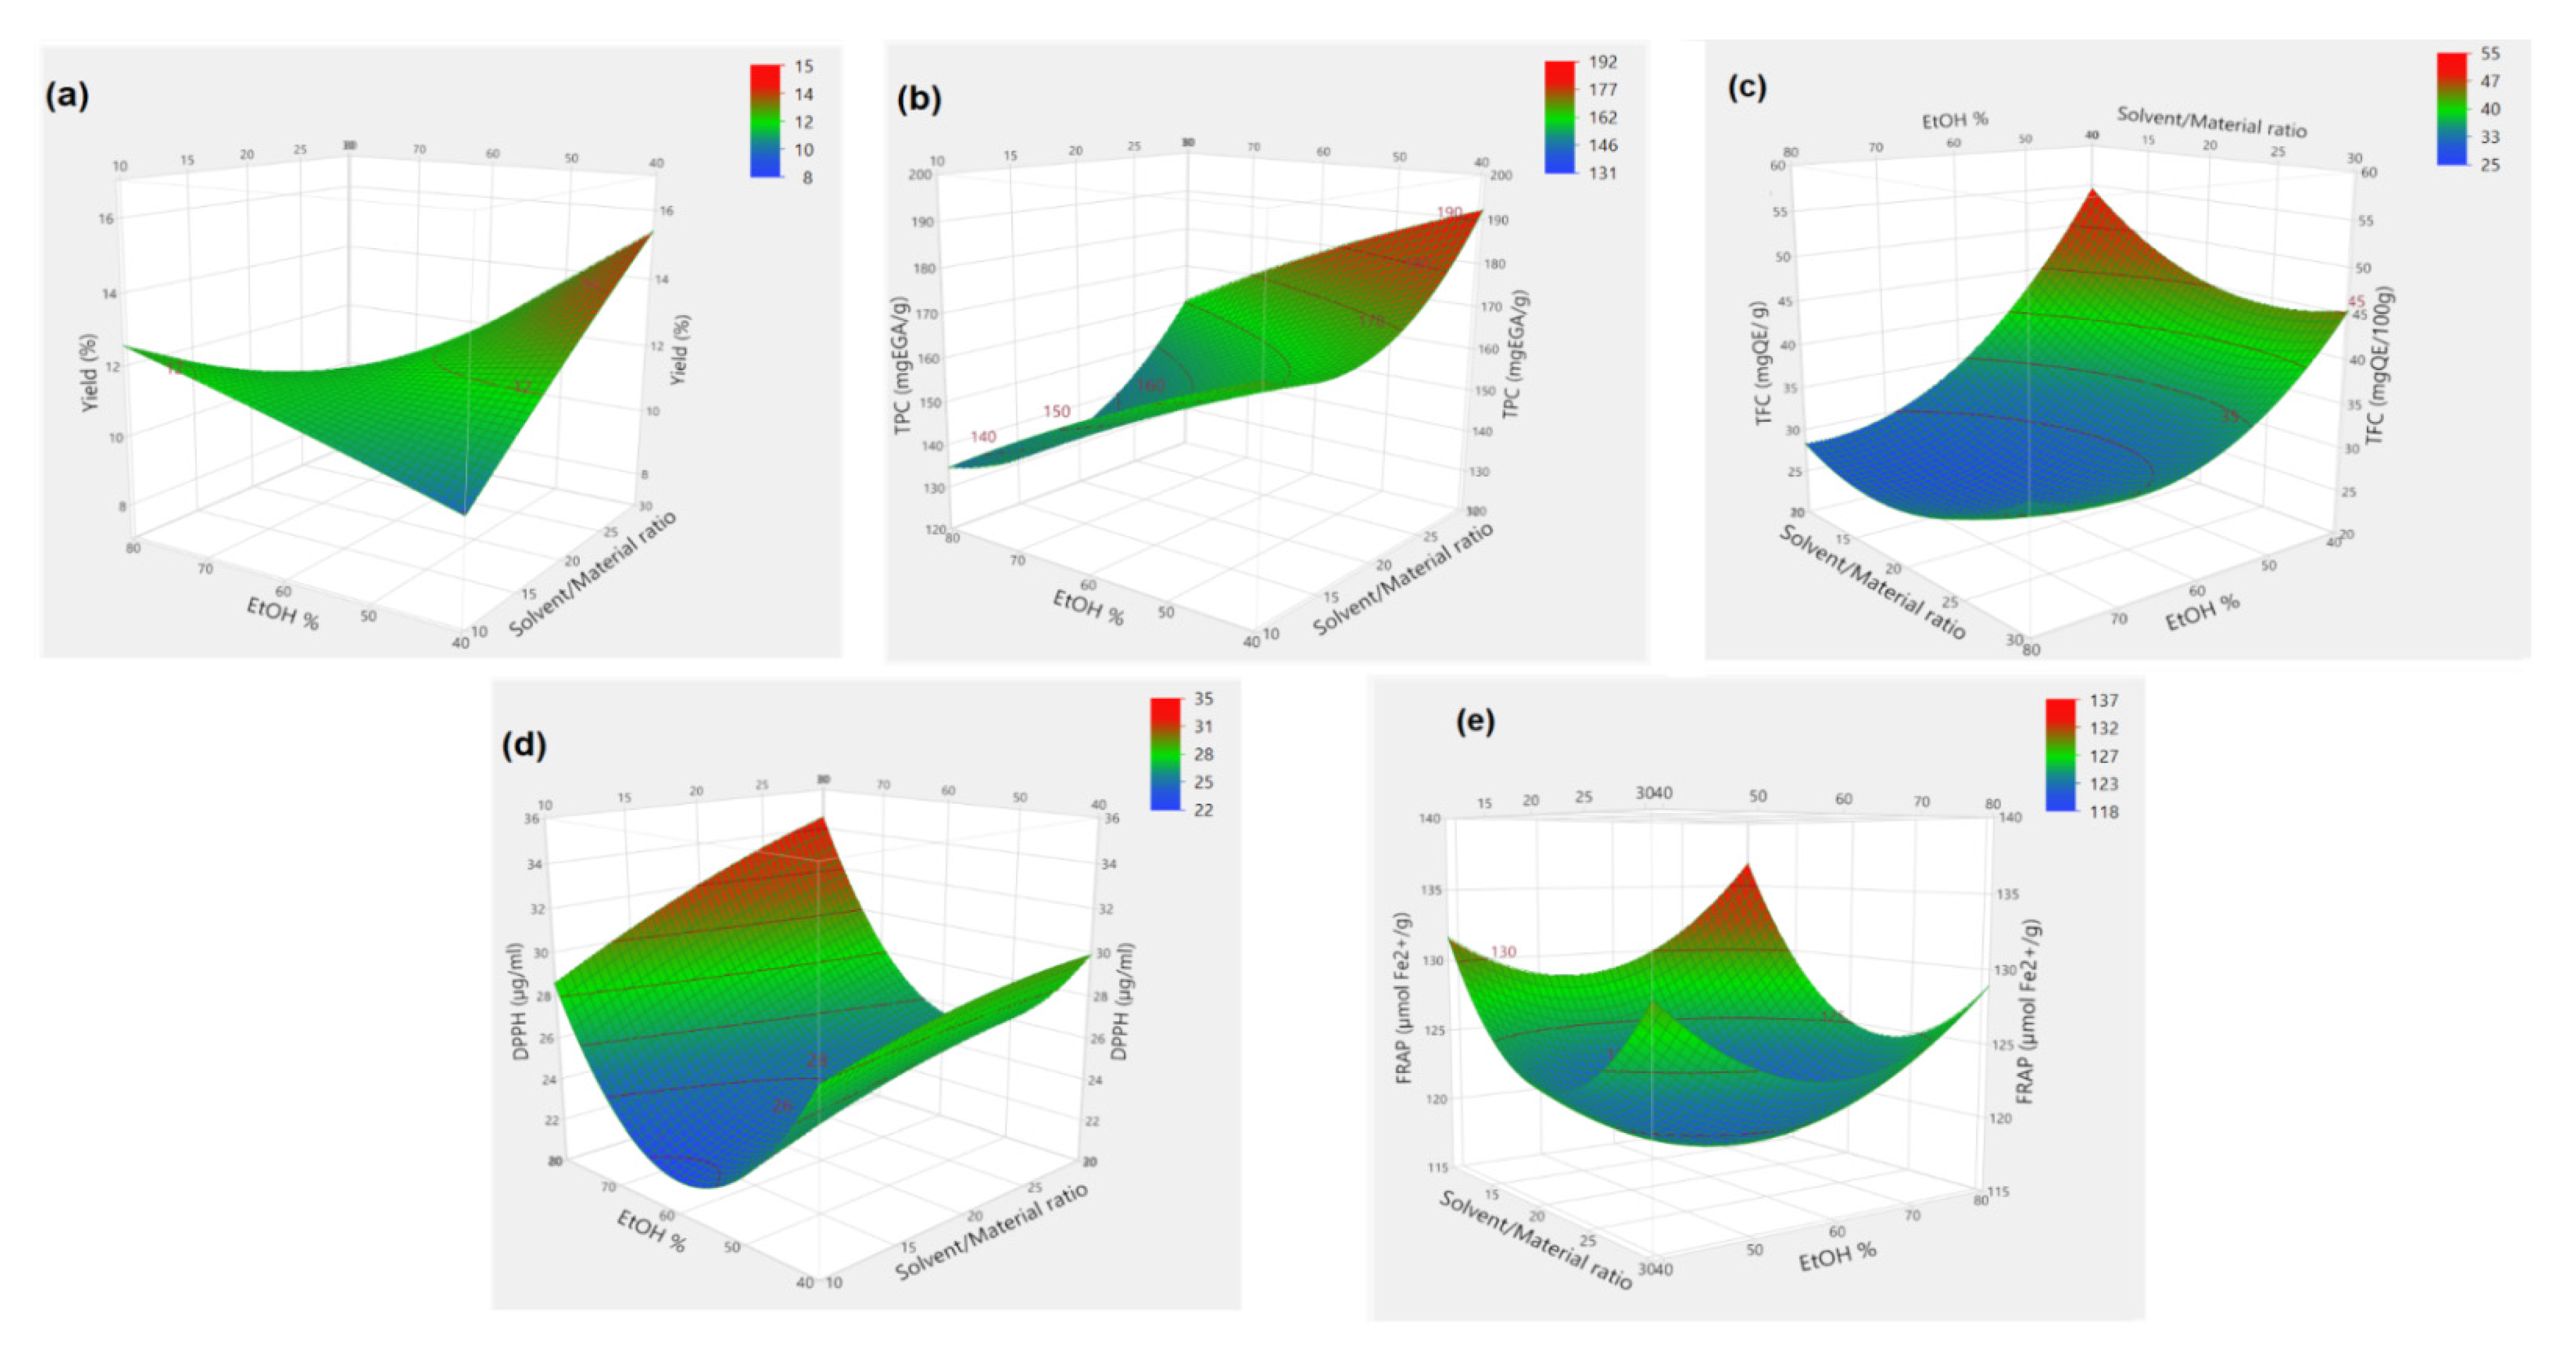
3.4. Optimization of Ultrasound-Assisted Extraction Parameters

To understand the best value that we can obtain, we began with the best value when performing the experiments. Thus, the best recorded values were 13.1%, 187.21 mg GAEq/g, 42.6 mg QEq/g, 21 µg/mL and 130.21 µmol Fe2+/g for extraction yield, TPC, TFC, DPPH-IC50 and FRAP-EC50, respectively. Consequently, a setting of the parameters allowing for the obtainment of responses better than or equal to these values were accepted.
For optimizing studied responses, the temperature used during our experiments was fixed at 35 °C and was suitable for extraction, avoiding the loss or degradation of active compounds [43]. After a first analysis of the five-response optimization, a fixation of the extraction time in its lower level (15 min) is strongly recommended for the three first responses (extraction yield, TPC, and TFC). Therefore, this factor will be fixed in its value of 15 min for these responses. However, maximization of time processing is suggested for DPPH-IC50 and FRAP-EC50.

3.4.1. Effect of Operating Conditions on the Propolis Extraction Yield Response

Based on the contours shown in Figure 2a, the highest value of extraction yield observed can reach 15% by minimizing the processing time and solvent concentration and by maximizing the solvent/material ratio. The desirability plot in Figure 3a confirms this finding by showing that it is possible to obtain an extraction yield of 15.35% with desirability of 99.9% by setting the sonication time at 15 min, propolis–ethanol ratio at 30:1 mg/L, and ethanol concentration at a low level of 40%. The increase in extraction yield can be explained by the cavitation effect caused by ultrasonically disrupting the material and allowing the formation of a porous structure [44]. Our optimized propolis extraction yield value (15.35%) was more important than that obtained by shacking the ethanolic extraction [44], and it was similar for polish propolis ultrasound-assisted extracts, which presented an extraction yield ranging between 10.04% and 15.92% [45].

3.4.2. Effect of Operating Conditions on the TPC Response

As shown in the contour plot (Figure 2b), obtaining a TPC that exceeds 190 mgQAEq/g is possible by the same operating conditions described for the extraction yield, namely, a sonication time of 15 min, a solvent/material ratio of 30:1, and an ethanol concentration of 40%. Furthermore, the desirability function (Figure 3b) indicates that a value of 192 mg GAEq/g of TPC was the highest possible value, with 99.7% as a degree of compromise. This high concentration of phenolic compounds due to cavitation, which is easily released from the propolis matrix [46], and the presence of water in the 40% w/w ethanol increased ethanol polarity, which accelerated solvation of the phenolic compounds. In addition, water also caused swelling in the propolis matrix, which allows ethanol to penetrate the cell structure of solid particles more easily [47]. The result of the optimized value of TPC (192 mg GAE/g) was important in comparison with that obtained by ultrasound-assisted extraction from Malaysian propolis, which the predicted value of 162.46 mg GAEq/g [48], which was more important than Lithuanian propolis extract obtained by traditional extraction methods [49]. Besides, it was similar to those obtained by the same extraction method for Chinese propolis, where the TPC range was from 166 to 201.07 mgQEq/g [50].

3.4.3. Effect of Operating Conditions on TFC Response

The maximum level of total flavonoid content that we could obtain exceeded 45 mg QEq/g (Figure 2c). The desirability plot (Figure 3c) confirms this finding by showing that a setting of 15 min, 30 mL/g, and 40% for sonication time, solvent/propolis ratio, and ethanol concentration, respectively, leads to the best value of TFC (45.15 mg QEq, with 99.3% as the degree of compromise). This value was interesting compared to that obtained by maceration from Malaysian propolis, which reported TFC values in the range from 7.68 to 17.23 mgQE/g [51].

3.4.4. Effect of Operating Conditions on DPPH-IC50Response

As illustrated in the contour plot (Figure 2d), the optimized DPPH-IC50 value can reach around 21 μg/mL; this value can be obtained by the following setting: 45 min, 10 mg/L, and 60% for sonication time, solvent/material ratio, and ethanol concentration, respectively. The desirability plot (Figure 3d) shows that we have a 99.7% of chance to reach the DPPH-IC50 value of 20.27 μg/mL by ensuring the aforementioned operating conditions. This value was more important in comparison with that obtained by conventional extraction from Brazilian propolis, in which DPPH-IC50values ranged between 31 and 183 μg/mL [52].On the contrary, it was shown by Yeo et al. that the optimum propolis extract found by ultrasound-assisted extraction exhibited low antioxidant properties (DPPH-IC50 = 27.89 ± 1.27) in comparison with the propolis extracted by maceration (DPPH-IC50 = 8.91 ± 0.48) [53].

3.4.5. Effect of Operating Conditions on FRAP-EC50 Response

As represented in the contour plot (Figure 2e), the optimized FRAP-EC50 value was around 135 µmol Fe2+/g, obtained under the following sitting: 15 min, 30 mL/g, and 40% for sonication time, solvent/material ratio, and ethanol concentration, respectively. Furthermore, 136.26 µmol Fe2+/g was the highest value of FRAP-EC50, indicated by the desirability function (Figure 3e) with 99.1% as the degree of compromise. This value was similar to that obtained by ultrasound-assisted extraction from Chinese propolis, in which the values ranged from 126 ± 10.60 to 290.34 ± 10.80 µmol Fe2+/g of extract. The previously reported FRAP activity from Croatian propolis ranged between 40 and 1337.22 µmol Fe2+/g [54].

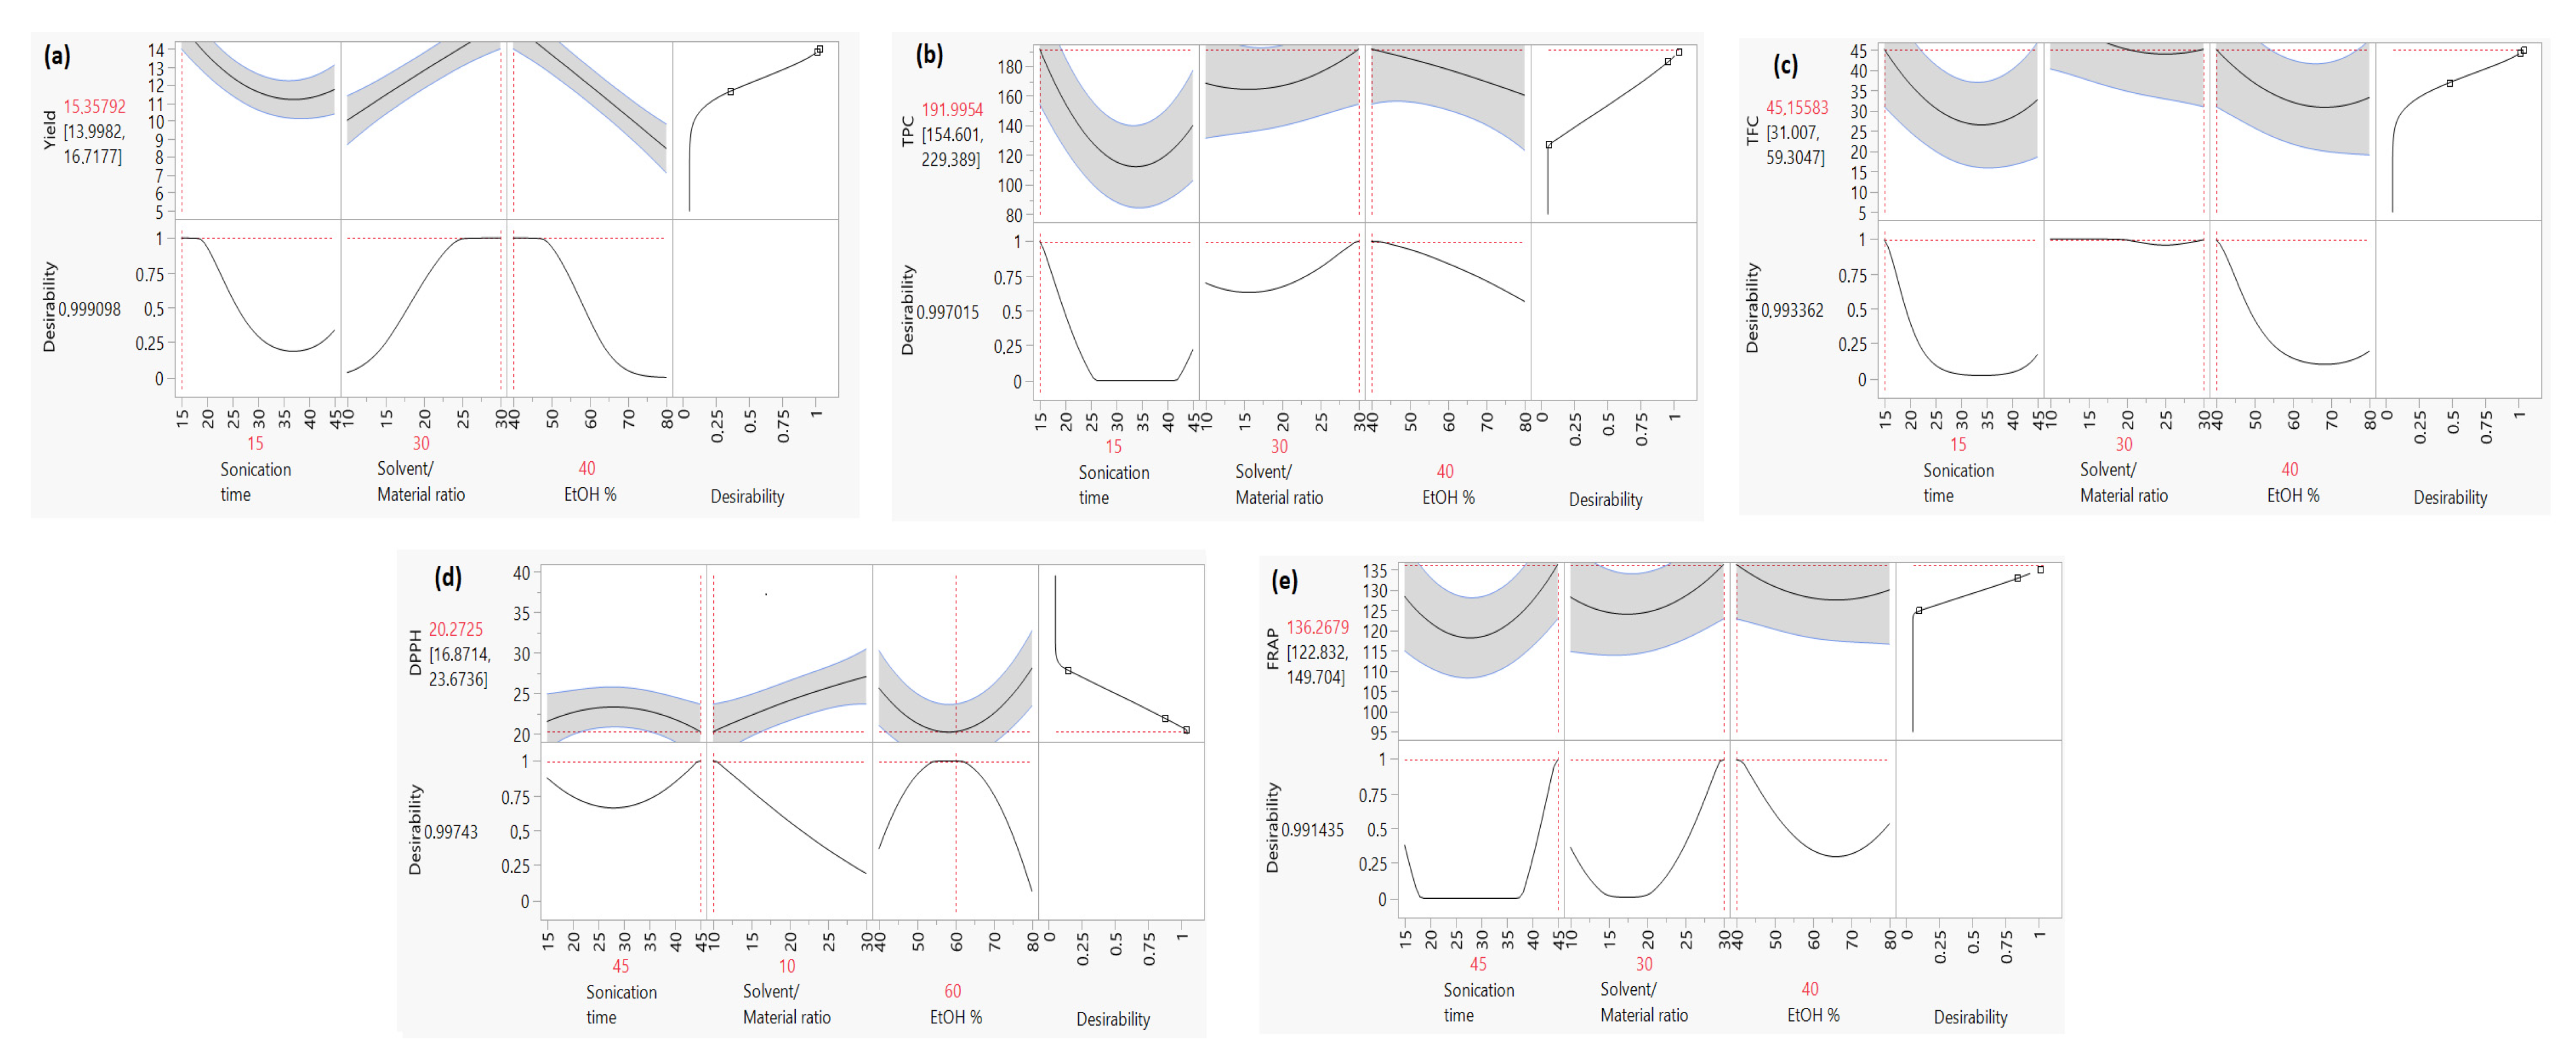
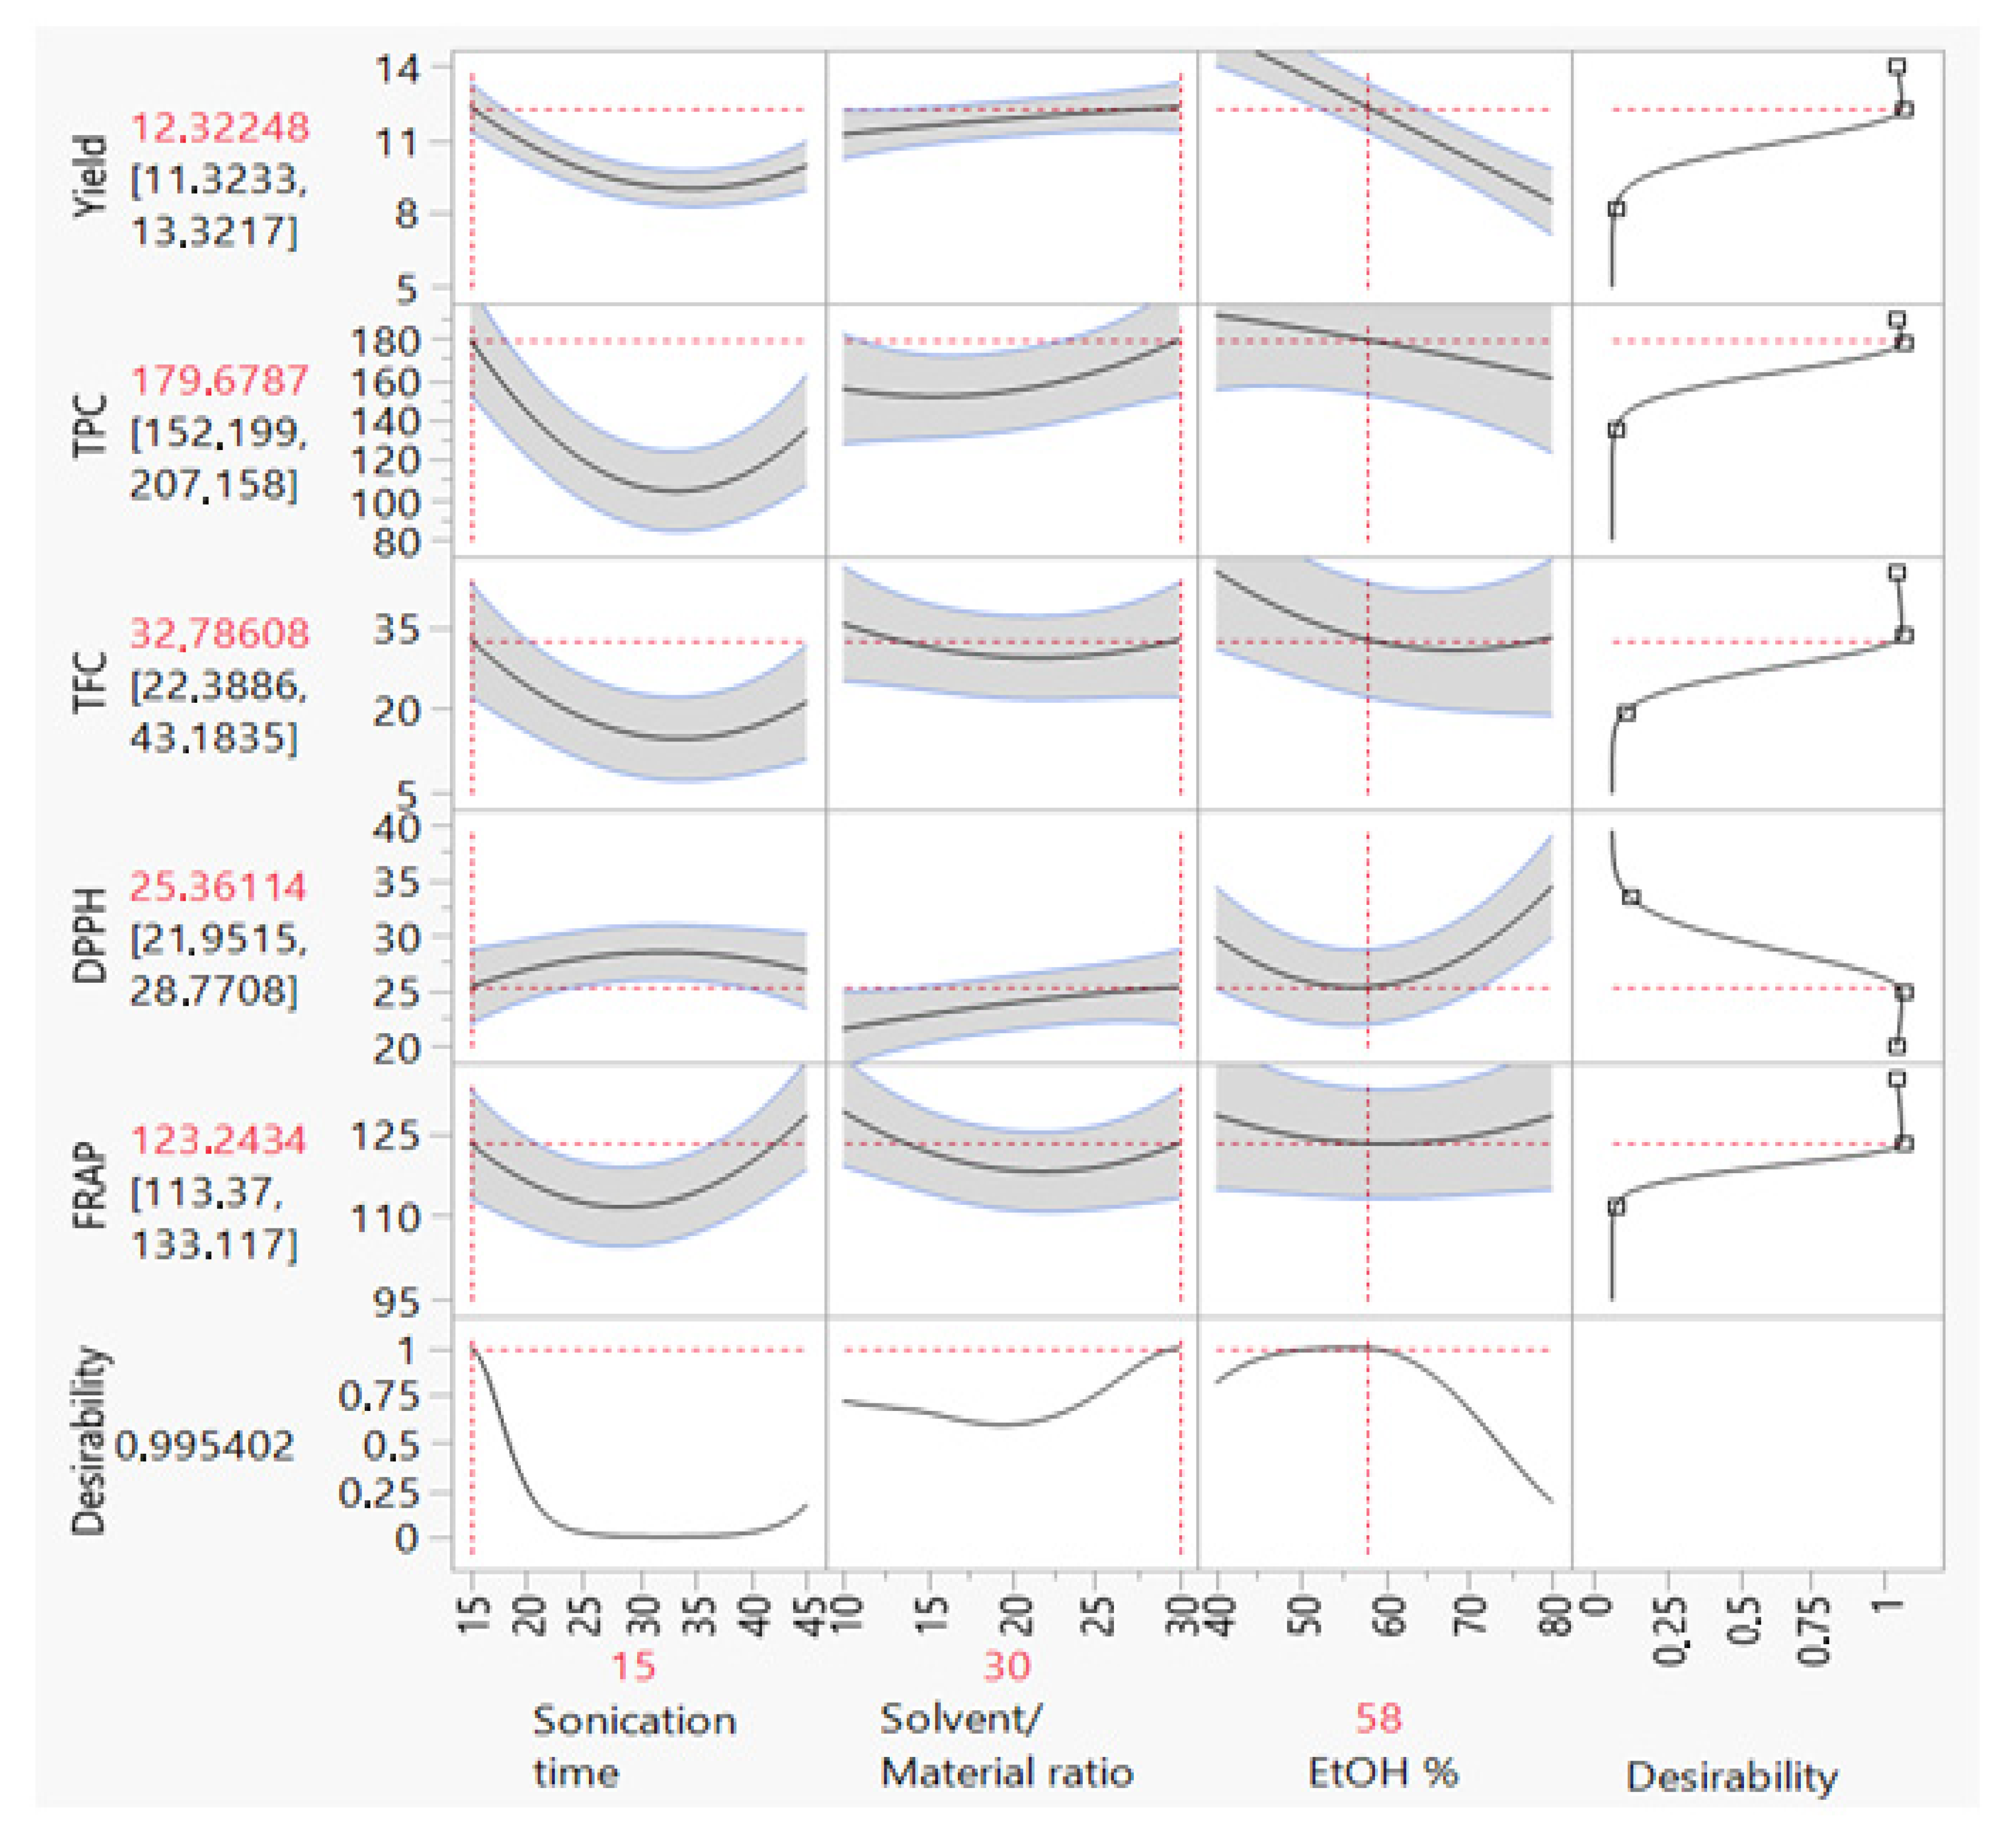
3.4.6. Simultaneous Multi-Response Optimization

In addition to its ability to give optimal solutions for each of the responses separately, the desirability function also allows for the determination of optimal conditions for all the studied responses simultaneously [54]. Thus, several solutions can be proposed by this function, implying the determination of the priority given to each response in advance. In our case, the optimization of the first three responses yields, TPC, and TFC require the same setting, but the two responses, DPPH-IC50 and FRAP-EC50, require a different one. Among the proposed solutions of simultaneous settings, we have chosen the conditions illustrated in Figure 4. Hence, a sonication time processing of 15 min, a solvent/material ratio of 30:1 mL/g, and a solvent concentration of 58% were chosen as optimal conditions for simultaneous optimization. This setting allows us to obtain 12.32%, 179.6 mg GAEq/g, 32.78 mgQEq/g, 25.36 µg/mL and 123.24 µmol Fe2+/g for the extraction yield, TPC, TFC, DPPH-IC50, and FRAP-EC50, respectively (Figure 5). Our results confirm that solvent concentration, sonication time, and solvent ratio affect all studied responses as obtained in other studies for the Malaysian propolis [55], Polish propolis [56], and Romanian propolis [57].

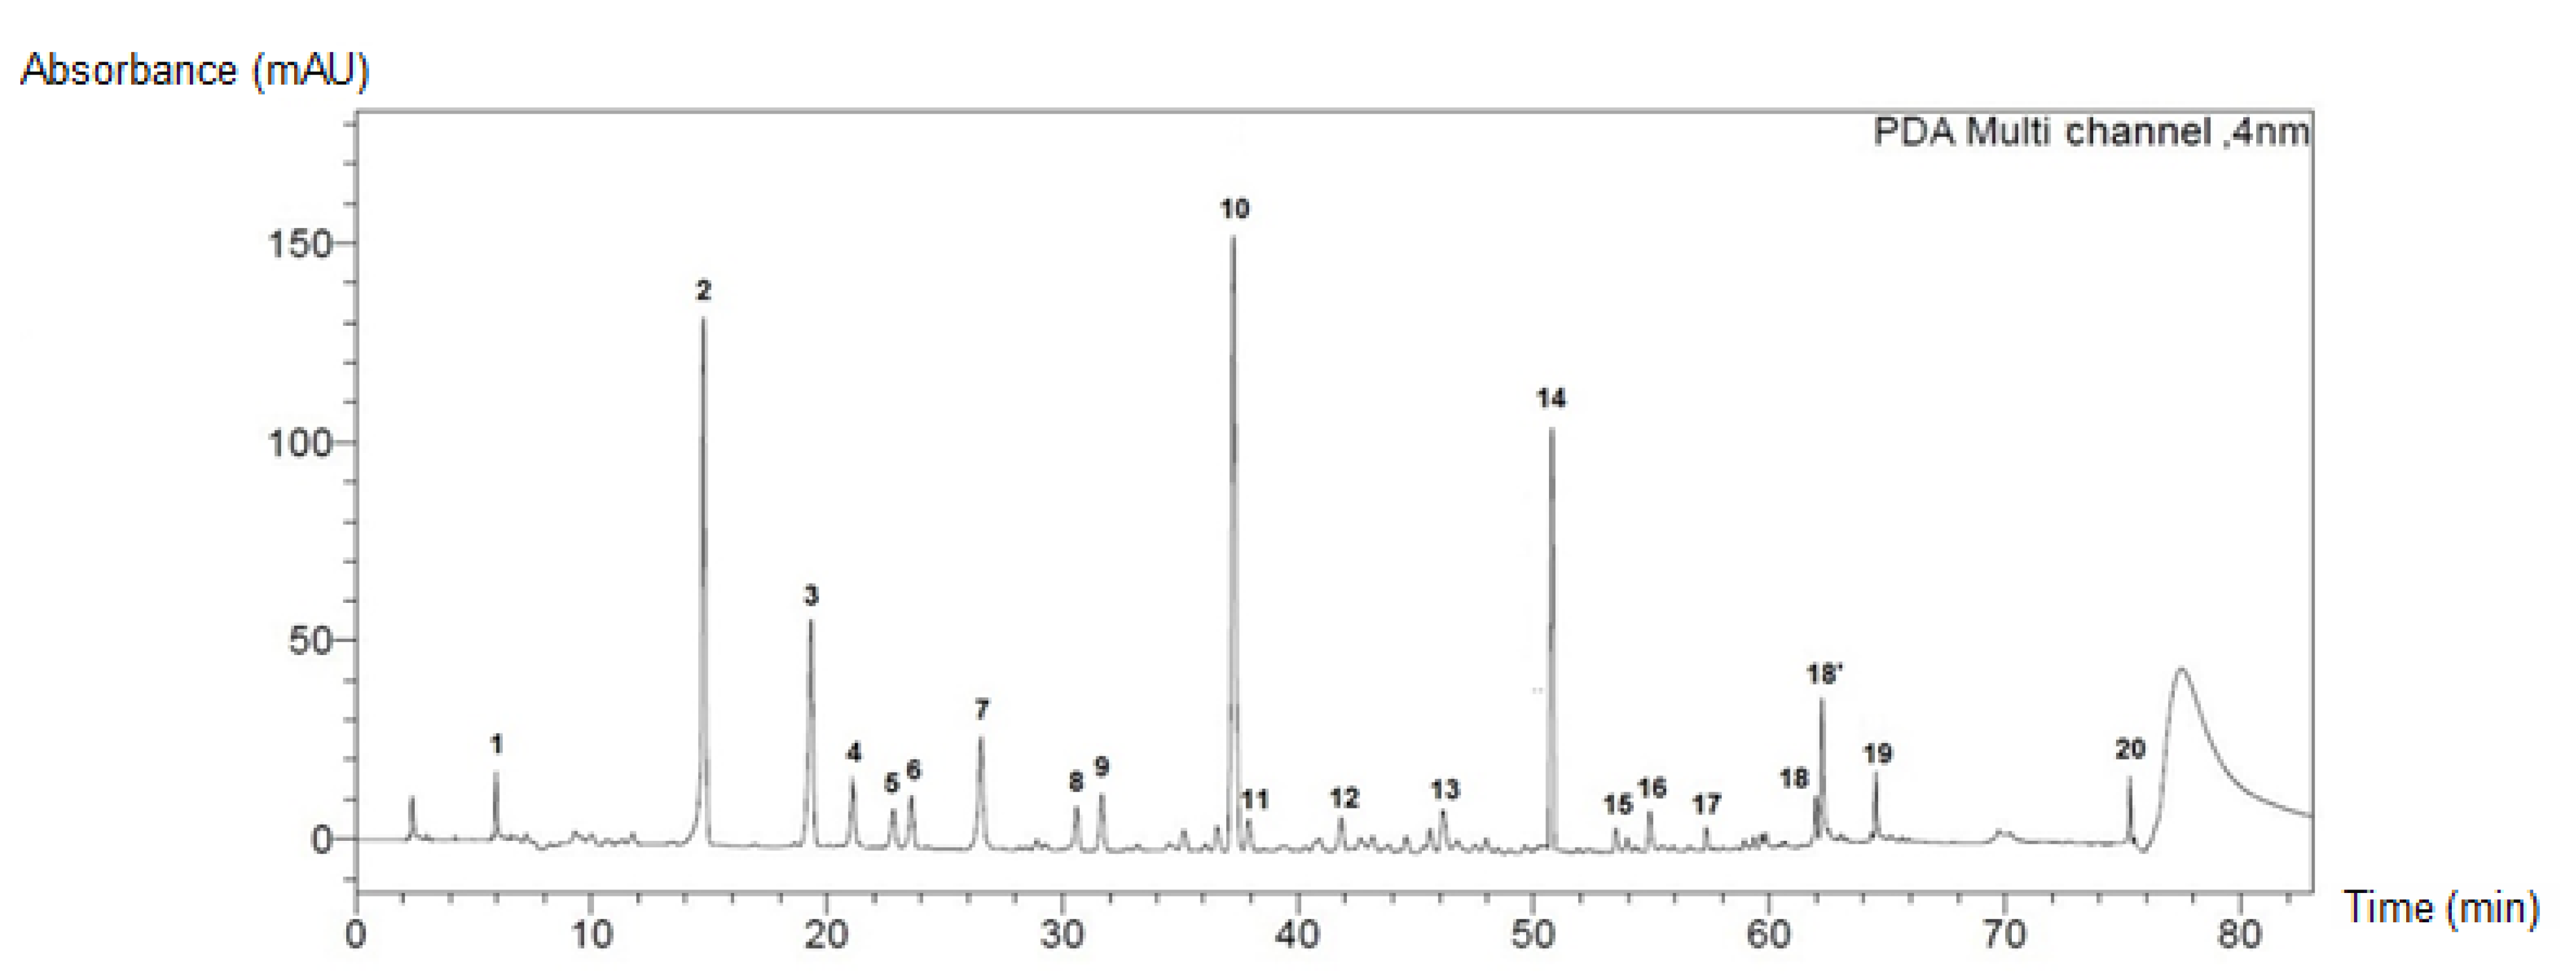
3.5. Phenolic Screening of Optimized Extraction of Moroccan Propolis

To identify and quantify the individual phenolic compounds from Moroccan propolis obtained under optimal BBD conditions, the optimized ultrasound-assisted extract was submitted for HPLC-DAD analysis. As shown in Figure 6 and Table 5, twenty phenolic compounds were identified and quantified; the most abundant phenolic acid was epicatechin (0.1927 ± 0.0037 mg/g) followed by coumaric acid (0.0530 ± 0.0007 mg/g) and rosmarinic acid (0.0429 ± 0.0013 mg/g), and the lowest concentration of phenolics was obtained for vanillin (0.0021 ± 0.0014 mg/g). In a study conducted by Laaroussi and colleagues, the results of the phenolic compounds analysis in seven propolis samples collected from different areas of Morocco revealed the presence of sixteen compounds, including ellagic acid, apigenin, o-coumaric acid, kaempferol, and rosmarinic acid [11]. These results show the special characteristics for Moroccan propolis extract in comparison with those reported for Spanish propolis, which showed a high concentration of pinocembrin (482 mg/g), caffeic acid phenylethyl ester (594 mg/g), and kaempferol (189 mg/g), and Bulgarian propolis contains pinobanksin (0.0147 mg/g) of ethanolic extract and chrysin (0.1204 mg/g) of ethanolic extract [57]. In addition to the extraction operating conditions, this phenolic screening variation can be explained by the diverse flora foraged by the bees [58]. In turn, this variation in the composition of propolis may ultimately affect its biological and pharmacological activities [59,60].

4. Conclusions

In this study, the optimization of ultrasound-assisted extraction using response surface methodology was performed for the first time on Moroccan propolis. The optimization process has increased the recovery of extracts with high levels of polyphenols and flavonoids and with important antioxidant activity. In addition, using the Box–Behnken design showed clear relationships between all responses and interactions between the independent variables. The results obtained indicate that the sonication time, ethanol concentration, and solvent/material ratio were considered statistically significant and that they can influence the chemical and biological activities of propolis. Therefore, it was important to use an experimental design that increases the process efficiency and reduces costs and the number of experiments. Otherwise, our results can represent the main step in the control of phenolic compounds, such as an alternative to chemical antioxidants mostly used in the food industry and known for their toxicity.

Author Contributions

Conceptualization, A.A. and B.L.; methodology, A.A. and B.L.; data curation, M.F.; writing—original draft preparation, A.A.; writing—review and editing, M.B.; supervision, B.L. All authors have read and agreed to the published version of the manuscript.

Funding

This research received no external funding.

Institutional Review Board Statement

Not applicable.

Informed Consent Statement

Not applicable.

Data Availability Statement

Not applicable.

Conflicts of Interest

The authors declare no conflict of interest.

References

  1. Alday, E.; Navarro-Navarro, M.; Garibay-Escobar, A.; Robles-Zepeda, R.; Hernandez, J.; Velazquez, C. Advances in Pharmacological Activities and Chemical Composition of Propolis Produced in Americas; IntechOpen: London, UK, 2016. [Google Scholar]
  2. Widjajanto, E. Identification and Quantification of Propolis’s Active Compound in Various Solvents. J Appl. Environ. Biol. Sci. 2016, 6, 94–99. [Google Scholar]
  3. Ahangari, Z.; Naseri, M.; Vatandoost, F. Propolis: Chemical composition and its applications in endodontics. Iran. Endod. J. 2018, 13, 285. [Google Scholar] [PubMed]
  4. Huang, S.; Zhang, C.-P.; Wang, K.; Li, G.Q.; Hu, F.-L. Recent advances in the chemical composition of propolis. Molecules 2014, 19, 19610–19632. [Google Scholar] [CrossRef] [PubMed] [Green Version]
  5. Anjum, S.I.; Ullah, A.; Khan, K.A.; Attaullah, M.; Khan, H.; Ali, H.; Bashir, M.A.; Tahir, M.; Ansari, M.J.; Ghramh, H.A. Composition and functional properties of propolis (bee glue): A review. Saudi J. Biol. Sci. 2019, 26, 1695–1703. [Google Scholar] [CrossRef]
  6. Sokeng, S.D.; Talla, E.; Sakava, P.; Fokam Tagne, M.A.; Henoumont, C.; Sophie, L.; Mbafor, J.T.; Tchuenguem Fohouo, F.-N. Anti-inflammatory and analgesic effect of arachic acid ethyl ester isolated from propolis. BioMed Res. Int. 2020, 2020, 8797284. [Google Scholar] [CrossRef] [PubMed]
  7. Touzani, S.; Embaslat, W.; Imtara, H.; Kmail, A.; Kadan, S.; Zaid, H.; ElArabi, I.; Badiaa, L.; Saad, B. In vitro evaluation of the potential use of propolis as a multitarget therapeutic product: Physicochemical properties, chemical composition, and immunomodulatory, antibacterial, and anticancer properties. BioMed Res. Int. 2019, 2019, 4836378. [Google Scholar] [CrossRef] [PubMed] [Green Version]
  8. Sepúlveda, C.; Núñez, O.; Torres, A.; Guzmán, L.; Wehinger, S. Antitumor activity of propolis: Recent advances in cellular perspectives, animal models and possible applications. Food Rev. Int. 2020, 36, 429–455. [Google Scholar] [CrossRef]
  9. Campos, J.F.; dos Santos, U.P.; Macorini, L.F.B.; de Melo, A.M.M.F.; Balestieri, J.B.P.; Paredes-Gamero, E.J.; Cardoso, C.A.L.; de Picoli Souza, K.; dos Santos, E.L. Antimicrobial, antioxidant and cytotoxic activities of propolis from Melipona orbignyi (Hymenoptera, Apidae). Food Chem. Toxicol. 2014, 65, 374–380. [Google Scholar] [CrossRef]
  10. Laaroussi, H.; Bakour, M.; Ousaaid, D.; Aboulghazi, A.; Ferreira-Santos, P.; Genisheva, Z.; Teixeira, J.A.; Lyoussi, B. Effect of antioxidant-rich propolis and bee pollen extracts against D-glucose induced type 2 diabetes in rats. Food Res. Int. 2020, 138, 109802. [Google Scholar] [CrossRef]
  11. Laaroussi, H.; Ferreira-Santos, P.; Genisheva, Z.; Bakour, M.; Ousaaid, D.; Teixeira, J.A.; Lyoussi, B. Unraveling the chemical composition, antioxidant, α-amylase and α-glucosidase inhibition of Moroccan propolis. Food Biosci. 2021, 42, 101160. [Google Scholar] [CrossRef]
  12. Šuran, J.; Cepanec, I.; Mašek, T.; Radić, B.; Radić, S.; Tlak Gajger, I.; Vlainić, J. Propolis extract and its bioactive compounds—From traditional to modern extraction technologies. Molecules 2021, 26, 2930. [Google Scholar] [CrossRef] [PubMed]
  13. Bankova, V.; Trusheva, B.; Popova, M. Propolis extraction methods: A review. J. Apic. Res. 2021, 60, 734–743. [Google Scholar] [CrossRef]
  14. Li, X.; Zhu, F.; Zeng, Z. Effects of different extraction methods on antioxidant properties of blueberry anthocyanins. Open Chem. 2021, 19, 138–148. [Google Scholar] [CrossRef]
  15. Pellati, F.; Prencipe, F.P.; Bertelli, D.; Benvenuti, S. An efficient chemical analysis of phenolic acids and flavonoids in raw propolis by microwave-assisted extraction combined with high-performance liquid chromatography using the fused-core technology. J. Pharm. Biomed. Anal. 2013, 81, 126–132. [Google Scholar] [CrossRef] [PubMed]
  16. Kim, S.-H.; Kim, I.-H.; Kang, B.-H.; Lee, K.-H.; Lee, S.-H.; Lee, D.-S.; Cho, S.-M.K.; Hur, S.-S.; Kwon, T.-K.; Lee, J.-M. Optimization of ethanol extraction conditions from propolis (a bee product) using response surface methodology. Korean J. Food Preserv. 2009, 16, 908–914. [Google Scholar]
  17. Bakkaloglu, Z.; Arici, M.; Karasu, S. Optimization of ultrasound-assisted extraction of turkish propolis and characterization of phenolic profile, antioxidant and antimicrobial activity. Food Sci. Technol. 2021, 41, 687–695. [Google Scholar] [CrossRef]
  18. Pan, G.; Yu, G.; Zhu, C.; Qiao, J. Optimization of ultrasound-assisted extraction (UAE) of flavonoids compounds (FC) from hawthorn seed (HS). Ultrason. Sonochem. 2012, 19, 486–490. [Google Scholar] [CrossRef]
  19. Mirhosseini, H.; Tan, C.P.; Hamid, N.S.A.; Yusof, S. Modeling the relationship between the main emulsion components and stability, viscosity, fluid behavior, ζ-potential, and electrophoretic mobility of orange beverage emulsion using response surface methodology. J Agric. Food Chem. 2007, 55, 7659–7666. [Google Scholar] [CrossRef] [PubMed]
  20. Boisard, S.; Le Ray, A.-M.; Gatto, J.; Aumond, M.-C.; Blanchard, P.; Derbré, S.; Flurin, C.; Richomme, P. Chemical composition, antioxidant and anti-AGEs activities of a French poplar type propolis. J. Agric. Food Chem. 2014, 62, 1344–1351. [Google Scholar] [CrossRef] [Green Version]
  21. Yusof, N.; Munaim, M.S.A.; Veloo Kutty, R. Optimization of total phenolic compounds extracted from propolis by ultrasound-assisted extraction. Chem. Eng. Commun. 2021, 208, 564–572. [Google Scholar] [CrossRef]
  22. Oroian, M.; Dranca, F.; Ursachi, F. Comparative evaluation of maceration, microwave and ultrasonic-assisted extraction of phenolic compounds from propolis. J. Food Sci. Technol. 2020, 57, 70–78. [Google Scholar] [CrossRef] [PubMed]
  23. Isla, M.I.; Salas, A.; Danert, F.C.; Zampini, I.C.; Ordonez, R.M. Analytical methodology optimization to estimate the content of non-flavonoid phenolic compounds in Argentine propolis extracts. Pharm. Biol. 2014, 52, 835–840. [Google Scholar] [CrossRef] [PubMed] [Green Version]
  24. Pontis, J.A.; Costa, L.A.M.A.D.; Silva, S.J.R.D.; Flach, A. Color, phenolic and flavonoid content, and antioxidant activity of honey from Roraima, Brazil. Food Sci. Technol. 2014, 34, 69–73. [Google Scholar] [CrossRef] [Green Version]
  25. Cottica, S.M.; Sawaya, A.C.; Eberlin, M.N.; Franco, S.L.; Zeoula, L.M.; Visentainer, J.V. Antioxidant activity and composition of propolis obtained by different methods of extraction. J. Braz. Chem. Soc. 2011, 22, 929–935. [Google Scholar] [CrossRef]
  26. Svečnjak, L.; Marijanović, Z.; Okińczyc, P.; Marek Kuś, P.; Jerković, I. Mediterranean Propolis from the Adriatic Sea Islands as a Source of Natural Antioxidants: Comprehensive Chemical Biodiversity Determined by GC-MS, FTIR-ATR, UHPLC-DAD-QqTOF-MS, DPPH and FRAP Assay. Antioxidants 2020, 9, 337. [Google Scholar] [CrossRef] [Green Version]
  27. Vivar-Quintana, A.M.; González-Martín, M.I.; Revilla, I.; Betances-Salcedo, E.V. Determination and quantification of phenolic acids in raw propolis by reversed phase high performance liquid chromatography. Feasibility study for the use of near infrared spectroscopy. J. Apic. Res. 2018, 57, 648–656. [Google Scholar] [CrossRef]
  28. Keshtkar, A.R.; Moosavian, M.A.; Sohbatzadeh, H.; Mofras, M. La (III) and Ce (III) biosorption on sulfur functionalized marine brown algae Cystoseira indica by xanthation method: Response surface methodology, isotherm and kinetic study. Groundw. Sustain. Dev. 2019, 8, 144–155. [Google Scholar] [CrossRef]
  29. Hesas, R.H.; Arami-Niya, A.; Daud, W.M.A.W.; Sahu, J. Preparation of granular activated carbon from oil palm shell by microwave-induced chemical activation: Optimisation using surface response methodology. Chem. Eng. Res. Des. 2013, 91, 2447–2456. [Google Scholar] [CrossRef]
  30. Said, K.A.M.; Amin, M.A.M. Overview on the response surface methodology (RSM) in extraction processes. J. Appl. Sci. Process Eng. 2015, 2, 8–17. [Google Scholar]
  31. Jensen, W.A. Response surface methodology: Process and product optimization using designed experiments. J. Qual. Technol. 2017, 49, 186. [Google Scholar] [CrossRef]
  32. Motri, S.; Touil, A.; Benselma, Z.; Hassini, L.; Bettaieb, E.; Zagrouba, F. Application of factorial design to the study of the effect of drying conditions on α-tocopherol content in prickly pear seed oil. J. New Sci. Agric. Biotechnol. 2015, 19, 759–765. [Google Scholar]
  33. Izadiyan, P.; Hemmateenejad, B. Multi-response optimization of factors affecting ultrasonic assisted extraction from Iranian basil using central composite design. Food Chem. 2016, 190, 864–870. [Google Scholar] [CrossRef] [PubMed]
  34. Xie, G.; Li, R.; Han, Y.; Zhu, Y.; Wu, G.; Qin, M. Optimization of the extraction conditions for buddleja officinalis maxim. using response surface methodology and exploration of the optimum harvest time. Molecules 2017, 22, 1877. [Google Scholar] [CrossRef] [PubMed] [Green Version]
  35. Fadil, M.; Fikri-Benbrahim, K.; Rachiq, S.; Ihssane, B.; Lebrazi, S.; Chraibi, M.; Haloui, T.; Farah, A. Combined treatment of Thymus vulgaris L.; Rosmarinus officinalis L. and Myrtus communis L. essential oils against Salmonella typhimurium: Optimization of antibacterial activity by mixture design methodology. Eur. J. Pharm. Biopharm. 2018, 126, 211–220. [Google Scholar] [CrossRef] [PubMed]
  36. Cavalaro, R.I.; da Cruz, R.G.; Dupont, S.; de Moura, J.M.L.N.; de Souza Vieira, T.M.F. In vitro and in vivo antioxidant properties of bioactive compounds from green propolis obtained by ultrasound-assisted extraction. Food Chem. X 2019, 4, 100054. [Google Scholar] [CrossRef] [PubMed]
  37. Do, Q.D.; Angkawijaya, A.E.; Tran-Nguyen, P.L.; Huynh, L.H.; Soetaredjo, F.E.; Ismadji, S.; Ju, Y.-H. Effect of extraction solvent on total phenol content, total flavonoid content, and antioxidant activity of Limnophila aromatica. J. Food Drug Anal. 2014, 22, 296–302. [Google Scholar] [CrossRef] [Green Version]
  38. Zhang, Q.-W.; Lin, L.-G.; Ye, W.-C. Techniques for extraction and isolation of natural products: A comprehensive review. Chin. Med. 2018, 13, 1–26. [Google Scholar] [CrossRef] [Green Version]
  39. Dhanani, T.; Shah, S.; Gajbhiye, N.; Kumar, S. Effect of extraction methods on yield, phytochemical constituents and antioxidant activity of Withania somnifera. Arab. J. Chem. 2017, 10, S1193–S1199. [Google Scholar] [CrossRef] [Green Version]
  40. Mokrani, A.; Madani, K. Effect of solvent, time and temperature on the extraction of phenolic compounds and antioxidant capacity of peach (Prunus persica L.) fruit. Sep. Purif. Technol. 2016, 162, 68–76. [Google Scholar] [CrossRef]
  41. Maisuthisakul, P. Effect of solvent extraction on total phenolic content of five strains from Thai rice grains. Warasan Witthayasat Kaset 2011, 2016, 341–344. [Google Scholar]
  42. Sun, C.; Wu, Z.; Wang, Z.; Zhang, H. Effect of ethanol/water solvents on phenolic profiles and antioxidant properties of Beijing propolis extracts. Evid. Based Complement. Altern. Med. 2015, 2015, 595393. [Google Scholar] [CrossRef] [PubMed] [Green Version]
  43. Cavalaro, R.I.; Fabricio, L.F.D.F.; Vieira, T.M.F.D.S. Ultrasound-Assisted Extraction of Antioxidants from Baccharis dracunculifolia and Green Propolis. Processes 2020, 8, 1530. [Google Scholar] [CrossRef]
  44. Gallo, M.; Ferrara, L.; Naviglio, D. Application of ultrasound in food science and technology: A perspective. Foods 2018, 7, 164. [Google Scholar] [CrossRef] [PubMed] [Green Version]
  45. Pobiega, K.; Kraśniewska, K.; Derewiaka, D.; Gniewosz, M. Comparison of the antimicrobial activity of propolis extracts obtained by means of various extraction methods. J. Food Sci. Technol. 2019, 56, 5386–5395. [Google Scholar] [CrossRef] [Green Version]
  46. Esmaeilzadeh Kenari, R.; Mohsenzadeh, F.; Amiri, Z.R. Antioxidant activity and total phenolic compounds of Dezful sesame cake extracts obtained by classical and ultrasound-assisted extraction methods. Food Sci. Nutr. 2014, 2, 426–435. [Google Scholar] [CrossRef]
  47. Dranca, F.; Oroian, M. Optimization of ultrasound-assisted extraction of total monomeric anthocyanin (TMA) and total phenolic content (TPC) from eggplant (Solanum melongena L.) peel. Ultrason. Sonochem. 2016, 31, 637–646. [Google Scholar] [CrossRef]
  48. Hagar, A.; Ibrahim, M.; Abd Rani, N.F. Phenolic compounds and antioxidant activity optimization of trigona honey and propolis using re-sponse surface methodology. Int. J. Allied Health Sci. 2021, 5, 2142. [Google Scholar]
  49. Ramanauskienė, K.; Inkėnienė, A.M.; Petrikaitė, V.; Briedis, V. Total phenolic content and antimicrobial activity of different lithuanian propolis solutions. Evid. Based Complement. Altern. Med. 2013, 2013, 842985. [Google Scholar] [CrossRef] [Green Version]
  50. Ding, Q.; Sheikh, A.R.; Gu, X.; Li, J.; Xia, K.; Sun, N.; Wu, R.A.; Luo, L.; Zhang, Y.; Ma, H. Chinese Propolis: Ultrasound-assisted enhanced ethanolic extraction, volatile components analysis, antioxidant and antibacterial activity comparison. Food Sci. Nutr. 2021, 9, 313–330. [Google Scholar] [CrossRef]
  51. Syed Salleh, S.N.A.; Mohd Hanapiah, N.A.; Ahmad, H.; Wan Johari, W.L.; Osman, N.H.; Mamat, M.R. Determination of Total Phenolics, Flavonoids, and Antioxidant Activity and GC-MS Analysis of Malaysian Stingless Bee Propolis Water Extracts. Scientifica 2021, 2021, 3789351. [Google Scholar] [CrossRef]
  52. Machado, B.A.S.; Silva, R.P.D.; Barreto, G.D.A.; Costa, S.S.; Silva, D.F.D.; Brandao, H.N.; Rocha, J.L.C.D.; Dellagostin, O.A.; Henriques, J.A.P.; Umsza-Guez, M.A. Chemical composition and biological activity of extracts obtained by supercritical extraction and ethanolic extraction of brown, green and red propolis derived from different geographic regions in Brazil. PLoS ONE 2016, 11, e0145954. [Google Scholar] [CrossRef] [PubMed]
  53. Yeo, K.L.; Leo, C.P.; Chan, D.J.C. Ultrasonic enhancement on propolis extraction at varied pH and alcohol content. J. Food Process Eng. 2015, 38, 562–570. [Google Scholar] [CrossRef]
  54. Marinković, V. A novel desirability function for multi-response optimization and its application in chemical engineering. Chem. Ind. Chem. Eng. Q. 2020, 26, 309–319. [Google Scholar] [CrossRef]
  55. Zainal, W.N.H.W.; Azian, N.A.A.M.; Albar, S.S.; Rusli, A.S. Effects of extraction method, solvent and time on the bioactive compounds and antioxidant activity of Tetrigona apicalis Malaysian propolis. J. Apic. Res. 2021, 1–7. [Google Scholar] [CrossRef]
  56. Woźniak, M.; Mrówczyńska, L.; Waśkiewicz, A.; Rogoziński, T.; Ratajczak, I. Phenolic profile and antioxidant activity of propolis extracts from Poland. Nat. Prod. Commun. 2019, 14, 1934578X19849777. [Google Scholar] [CrossRef]
  57. Oroian, M.; Ursachi, F.; Dranca, F. Influence of ultrasonic amplitude, temperature, time and solvent concentration on bioactive compounds extraction from propolis. Ultrason. Sonochem. 2020, 64, 105021. [Google Scholar] [CrossRef]
  58. Shehata, M.G.; Ahmad, F.T.; Badr, A.N.; Masry, S.H.; El-Sohaimy, S.A. Chemical analysis, antioxidant, cytotoxic and antimicrobial properties of propolis from different geographic regions. Ann. Agric. Sci. 2020, 65, 209–217. [Google Scholar] [CrossRef]
  59. Bhuyan, D.J.; Alsherbiny, M.A.; Low, M.N.; Zhou, X.; Kaur, K.; Li, G.; Li, C.G. Broad-spectrum pharmacological activity of Australian propolis and metabolomic-driven identification of marker metabolites of propolis samples from three continents. Food Funct. 2021, 12, 2498–2519. [Google Scholar] [CrossRef] [PubMed]
  60. Laaroussi, H.; Bakour, M.; Ousaaid, D.; Ferreira-Santos, P.; Genisheva, Z.; El Ghouizi, A.; Aboulghazi, A.; Teixeira, J.A.; Lyoussi, B. Protective effect of honey and propolis against gentamicin-induced oxidative stress and hepatorenal damages. Oxid. Med. Cell. Longev. 2021, 2021, 9719906. [Google Scholar] [CrossRef]
Figure 1. The curve of the actual values in terms of the predicted values.
Processes 10 00297 g001
Figure 2. Contour plots for ultrasound-assisted extraction of Moroccan propolis, showing optimal compromise zone leading to the best value of (a) yield of extraction, (b) total polyphenol content, (c) total flavonoid content, (d) DPPH-IC50, and (e) FRAP-EC50 as a function of solvent/propolis ratio and ethanol concentration and by fixing the sonication time in its optimal value.
Processes 10 00297 g002
Figure 3. Three-dimensional plots for ultrasound-assisted extraction of Moroccan propolis, showing optimal compromise zone leading to the best value of (a) yield of extraction, (b) total polyphenol content, (c) total flavonoid content, (d) DPPH-IC50, and (e) FRAP-EC50 as a function of solvent/propolis ratio and ethanol concentration and by fixing the sonication time in its optimal value.
Processes 10 00297 g003
Figure 4. Desirability plots showing the precise parameters setting leading to the optimal value for (a) yield, (b) TPC, (c) TFC, (d) DPPH-IC50, and (e) FRAP-EC50, separately.
Processes 10 00297 g004
Figure 5. Desirability plots of simultaneous optimization showing the precise parameters setting leading to the optimal value for yield, TPC, TFC, DPPH-IC50, and FRAP-EC50.
Processes 10 00297 g005
Figure 6. HPLC-DAD chromatograms of phenolic compounds extracted under optimal operating parameters. Peak numbers: 1. vanillin, 2. coumaric acid, 3. tyrosol, 4. ferulic acid, 5. hydroxytyrosol, 6. syringic acid, 7. caffeic acid, 8. ellagic acid, 9. hesperidin, 10. epicatechin, 11. catechin, 12. apigenin, 13. cinnamic acid, 14. rosmarinic acid, 15. rutin, 16. naringin, 17. quercetin, 18. pinoresinol, 18′. pinoresinol acetone, 19. kaempferol, 20. luteolin, mAU (milli-absorbance unit).
Processes 10 00297 g006
Table 1. Actual and coded levels of the independent variables used for the BBD.
Independent
Variables
Code UnitsVariables LevelsUnit
−101
Extraction timeX1153045min
Solvent/material ratioX2102030mL/g
Solvent concentrationX3406080% v/v
Table 2. Matrix of BBD and results for yield, total phenol content (TPC), total flavonoid content (TFC), DPPH-IC50, and FRAP-EC50.
Exp N°Time
(min)
Solvent/Material Ratio (mL/g)EtOH
(%)
Yield
(%)
TPC
(mgGAEq/g)
TFC
(mgQEq/g)
DPPH-IC50
(µg/mL)
FRAP-EC50
(µmol Fe2+/g)
115106011.25 ± 0.56 a187.21 ± 13.99 a38.80 ± 1.27 a23.70 ± 0.58 e130.21 ± 1.23 abc
245106013.1 ± 0.17 a147.10 ± 14.03 abc21.10 ± 1.27 cde21.00 ± 0.46 e126.98 ± 2.26 abc
315306012.23 ± 0.32 ab184.98 ± 8.20 a34.20 ± 4.20 ab29.80 ± 0.28 cd134.00 ± 1.27 ab
44530609.80 ± 1.41 a122.34 ± 5.52 bcd16.40 ± 1.13 def27.40 ± 0.70 d129.00 ± 1.70 abc
5152040128.0 ± 1.41 a164.00 ± 7.07 ab42.60 ± 3.35 a29.70 ± 0.46 cd122.80 ± 3.25 abc
645204011.50 ± 1.41 ab154.4 ± 20.6 abc36.80 ± 2.69 a33.90 ± 1.40 cd113.35 ± 4.60 cde
715208010.4 ± 1.41 a124.1 ± 14.90 bcd22.15 ± 2.33 cd30.06 ± 0.76 ab132.70 ± 0.39 ab
845208011.8 ± 1.41 a128.3 ± 12.7 bcd18.78 ± 1.32 cdef30.50 ± 1.56 cd122.60 ± 4.53 abc
93010408.50 ± 1.41 ab111.32 ± 11.14 cd34.72 ± 3.42 ab33.00 ± 0.77 abc128.01 ± 12.8 abc
1030304011.35 ± 1.41 a116.87 ± 9.66 bcd27.82 ± 6.53 bc34.80 ± 1.50 a122.10 ± 3.25 abc
1130108012.50 ± 1.41 a86.98 ± 9.89 d11.29 ± 0.99 ef33.90 ± 0.59 ab138.90 ± 0.70 a
123030806.00 ± 1.41 b95.34 ± 14.2 d18.58 ± 1.50 cdef34.15 ± 0.07 a121.22 ± 1.56 bc
133020609.34 ± 1.41 ab87.22 ± 15.4 d13.14 ± 0.28 def29.17 ± 0.46 d120.22 ± 1.38 bcd
143020609.5 ± 1.41 ab93.00 ± 14.3 d11.34 ± 1.32 def33.26 ± 1.47 abc101.30 ± 0.84 e
1530206010.4 ± 1.41 ab94.21 ± 5.5 d9.70 ± 1.61 f29.85 ± 0.49 cd103.75 ± 5.30 de
Each response is the average of triplicate with standard error. Values in the same column followed by different letters are significantly different according to Tukey’s multiple range test (p < 0.05).
Table 3. Analysis of variance for the three fitted models.
Yield of ExtractionTPCTFC
ModelDFSSMSFp-ValueSSMSFp-ValueSSMSFp-Value
R948.535.3926.900.0010 *12,672.821408.099.290.04 *1623.89180.438.310.0156 *
r51.000.20 758.01151.60 108.5221.70
Lof30.340.110.360.79732.52244.1719.150.06102.6034.2011.550.08
Pe20.650.32 25.5012.75 5.922.96
Total1449.53 13,430.82 1732.41
R298%94.3%93.7%
DPPH-IC50FRAP-EC50
ModelSSMSFp-ValueSSMSFp-Value
R284.5031.6113.540.0052 *975.78108.425.540.0370 *
r11.672.33 97.8719.57
Lof5.221.740.540.7022.947.650.200.89
Pe6.453.23 74.9337.46
Total296.17 1073.65
R296%98.3%
DF: degrees of freedom; SS: sum of squares; MS: mean square; R: regression; r: residual; Lof: lack of fit; Pe: pure error; *: statistically significant.
Table 4. Estimated regression coefficients of the special cubic model.
TermCoefficientYieldTPCTFCDPPH-IC50FRAP-EC50
Estimatep ValueEstimatep ValueEstimatep ValueEstimatep ValueEstimatep Value
Constantb09.75<0.0001 *91.14<0.0001 *11.390.0082 *26.43<0.0001 *104.20<0.0001 *
Sonication timeb1−0.060.7202−10.980.0531−5.580.0195 *0.070.9054−0.410.804
Solvent/Material ratiob2−0.750.0053 *1.120.8081−1.110.52892.700.0041 *−0.210.898
EtOH %b3−0.430.0416 *−12.520.0347 *−8.890.0029 *1.780.0218 *−0.160.924
Sonication time × Solvent/Material ratiob12−1.070.005 *−11.130.1304−0.030.99190.700.40152.810.260
Sonication time × EtOH %b130.680.0296 *3.850.55940.610.80460.440.5937−1.540.517
Solvent/Material ratio × EtOH%b23−2.340.0001 *0.700.91363.550.18830.990.2537−1.430.548
Sonication time × Sonication timeb111.940.0004 *50.480.0005 *11.610.0049 *−2.380.0305 *13.880.0018 *
Solvent/Material ratio × Solvent/Material ratiob21−0.090.701613.290.09274.630.1147−0.450.59527.720.0203 *
EtOH % × EtOH %b33−0.060.7927−1.800.78987.080.033 *6.610.0004 *5.160.075
* Statistically significant at p < 0.05.
Table 5. Quantification of phenolic compounds obtained under optimal BBD conditions.
Phenolic CompoundsConcentration (mg/g)
1. Vanillin0.0021 ± 0.0014
2. Coumaric acid0.0530 ± 0.0007
3.Tyrosol0.0099 ± 0.0013
4. Ferulic acid0.0087 ± 0.0005
5. Hydroxytyrosol0.0054 ± 0.0005
6. Syringic acid0.0060 ± 0.0014
7. Caffeic acid0.0100 ± 0.0001
8. Ellagic acid0.0180 ± 0.0005
9. Hesperidin0.0053 ± 0.0004
10. Epicatechin0.1927 ± 0.0037
11. Catechin0.0021 ± 0.0001
12. Apigenin0.0030 ± 0.0001
13. Cinnamic acid0.0032 ± 0.0003
14. Rosmarinic acid0.0429 ± 0.0013
15. Rutin0.0173 ± 0.0004
16. Naringin0.0027 ± 0.0009
17. Quercetin0.0026 ± 0.0002
18. Pinoresinol0.0061 ± 0.0001
18′. Pinoresinol acetone0.0171 ± 0.0001
19. Kaempferol0.0117 ± 0.0010
20. Luteolin0.0130 ± 0.0002
Publisher’s Note: MDPI stays neutral with regard to jurisdictional claims in published maps and institutional affiliations.

