Abstract
Co-gasification of coal and biomass is an important way to reduce the consumption of fossil fuels and achieve the efficient utilization of biomass resources. Two kinds of biomass containing corn straw (CS) and poplar sawdust (PS) were blended with different coal. Then, the coal char was separated from the blended char after co-pyrolysis based on the difference in particle size. The structural properties, including alkali and alkaline earth metals (AAEMs), microcrystalline structures, and molecular structures of the char samples were analyzed. Gasification reactivity of the char was determined by thermogravimetric analyzer (TGA). Results indicated that K and Mg contents in biomass evaporated easily and deposited on coal char, resulting in the increase in those in coal char during co-pyrolysis, and then the AAEMs contents in coal char were determined by the AAEM species and contents in biomass. Meanwhile, the inhibition effect on the graphitization degree of coal char increased with increasing blend ratio. Likewise, the inhibition effect of CS was higher than that of PS at the same blend ratio. The catalytic activity of inorganic mineral played a much more important role in predicting gasification reactivity than graphitization degree, and then the combination of alkali index and stacking layer number was proposed to better predict the reactivity of coal char.
1. Introduction
With the development of economy, consumption of fossil fuels gradually increases. Climate warming caused by greenhouse gas emissions has seriously damaged the human living environment [1]. The characteristics of resource endowment determine that coal is the main source of fossil fuels in China, and thus two targets, “peak carbon dioxide emissions” and “carbon neutrality”, have been proposed to control the greenhouse gas emissions. Co-gasification of coal and biomass is a promising clean high-efficiency energy technology, which can reduce coal consumption [2]. Meanwhile, considerable reduction in CO2 emission can be expected as a result of the advantage that biomass is a carbon-neutral energy source.
Co-gasification process can be divided into two main stages including initial co-pyrolysis process and co-gasification reaction of blended char [3]. As the basic step in thermochemical conversions, the co-pyrolysis process has attracted widespread attention from scholars [4,5]. The knowledge of synergetic effect has been proposed to elucidate the results of co-utilization for coal and biomass [6,7]. Some scholars pointed out that there was a signification synergy between coal and biomass during co-pyrolysis or co-gasification, resulting in excess gas volume and reduced tar products [8,9]. Then, the migration of alkali and alkaline earth metals (AAEMs) in feedstock or the interaction between volatile and char could be responsible for the phenomenon [7,8,10]. However, other studies could not find the synergetic effect, indicating that the product distributions did not follow any nonlinear relationships [11,12]. Generally, the perspectives were based on the fact that much effort was devoted to the investigation of the relationship between blended char and individual char samples. When multiple factors determine the synergy, we can only obtain the coupling results. Then, the contradictive results might be associated with blending ratio, blending method, and various contents of AAEMs and organic matter in coal and biomass [13,14]. However, less attention has been paid to the influence of biomass addition on the structural properties of coal char which could provide direct evidence for the interaction between volatiles and char as well as the role of AAEMs in the co-pyrolysis process of coal and biomass. In addition, the understanding of the char properties not only provides in-depth insights into the co-pyrolysis process but also provides a basis for the subsequent analysis of co-gasification characteristics. Therefore, the study on the influence of biomass on the coal char properties is vital for further understanding of the co-gasification process.
Compared with co-pyrolysis, co-gasification of blend char is the rate-controlling step due to its slower reaction rate. Then, co-gasification reactivity is a vital parameter for the applicability evaluation of industrial feedstock and provides the reference for the design and optimization of a gasifier. Generally, co-gasification reactivity is closely related to the structural properties of the char sample. Several studies have shown that AAEMs played a significant role in determining the gasification reactivity of blended char. Li et al. [15] pointed out that the presence of AAEMs could be responsible for the result that gasification reactivity of blended char from sawdust and bituminous coal blends increased with the biomass ratio. In contrast, Ellis et al. [16] reported that the gehlenite crystals were formed by the chemical reaction between AAEMs and aluminosilicate species in coal, resulting in a decrease in gasification reactivity. Notably, the physicochemical structure of blended char is related to the interaction between volatiles and char [17], and then it has significant effect on the co-gasification reactivity. The reactivity of blended char from wheat straw and coal was higher than individual coal char as a result of more disordered structure in blended char [18]. Moreover, Wu et al. [19] found that the reactivity of blended char decreased with the addition of cellulose, which could be attributed to the fact that the ordering of both anthracite and bituminous char was promoted by the cellulose. Interestingly, Krerkkaiwan et al. [6] revealed that the higher specific surface area was beneficial for promoting the co-gasification reactivity of blended char from sub-bituminous coal and rice straw. Consequently, the effect of structural properties on the gasification reactivity of a char sample is still not clear. Meanwhile, the research on the co-gasification reactivity was limited to blended char, which might lead to a lack of understanding of the reaction mechanism. More efforts were needed to explore the relationship between structural properties and gasification reactivity of separated coal char to better understand the co-pyrolysis and co-gasification processes.
This work was devoted to exploring the influence mechanism of co-gasification of coal and biomass by the method of separating blended char and providing a basis for the development of co-gasification technology. Coal char and biomass char were separated from the blended char based on the difference in particle size. Subsequently, the inorganic mineral contents of samples were detected by using inductively coupled plasma–optical emission spectrometry (ICP-OES), while the microcrystalline structures were analyzed by the X-ray diffraction (XRD). Meanwhile, the Fourier transform infrared spectroscopy (FTIR) was employed to determine the molecular structures. In addition, the gasification characteristics of coal char and raw biomass char samples were obtained by a thermogravimetric analyzer (TGA) under isothermal conditions. Then, the influence of char properties on the gasification characteristics was explored. Finally, the relationship between structural properties and reactivity index of the coal char samples was established.
2. Materials and Methods
2.1. Preparation of Feedstock
Two kinds of coal (Shanxi anthracite and Hami lignite) and two kinds of biomass (corn straw and poplar sawdust) were selected as raw materials in this study. Shanxi anthracite is abbreviated as SA, while Hami lignite is labeled as HL. Similarly, corn straw and poplar sawdust are abbreviated as CS and PS, respectively. Before the experiments, the coal samples were pulverized to less than 75 μm, while the biomass samples were crushed and sieved into particle sizes of 250–425 μm. Then, the samples were dried in an oven at 60 °C for 12 h, and they were collected in the seal bags. Proximate and ultimate analyses for these samples are shown in Table 1. The coal ash and biomass ash samples were prepared at 550 and 815 °C according to Chinese National Standards, respectively. The ash compositions of corresponding samples were detected by X-ray fluorescence (XRF), and the results are listed in Table 2. Additionally, the blends of coal and biomass were prepared by mechanically stirring at weight ratios of 8:2, 5:5, and 2:8, respectively.

Table 1.
Proximate and ultimate analyses of tested samples.
Table 2.
Chemical compositions of tested ash sample (wt./%).
As shown in Table 2, the AAEMs content of different biomass and coal varied significantly. It could be obviously observed that CS ash had the most K and Mg content but the lowest Fe content, while the most abundant inorganic elements detected in the PS ash were Ca and K, followed by Mg and Fe. Compared with biomass ash, coal ash clearly exhibited extremely lower K and Mg content. However, HL had the most Fe and Ca content, and SA had the most Al content, followed by Fe and Ca.
2.2. Preparation of Char Samples
Pyrolysis experiments of raw materials and blends of coal and biomass were performed in a fixed bed reactor for char preparation. The pyrolysis temperature was 600 °C, and the specific steps have been described in detail in the paper [20]. Subsequently, the char samples of co-pyrolysis were screened by different sieves to achieve the separation of biomass char and coal char based on particle size. Then, the coal char samples separated from the char samples of co-pyrolysis were marked on the basis of type of coal and biomass as well as blend ratio of biomass. For example, the CS2-SA8 coal char sample that represented the weight ratio of CS was 20% in the blend of CS and SA. Finally, char samples were stored in a desiccator for subsequent char characterization and gasification experiment.
2.3. Characterization Analysis of Char Samples
2.3.1. Content of Elements in Char Samples
The sample ash was prepared according to the following procedures. The char sample was heated up to a desired temperature in a muffle furnace under air atmosphere. Subsequently, the inorganic mineral contents (K, Na, Ca, Mg, Al, Fe, Si, P, Ti, and S) of sample ash were analyzed with an inductive coupled plasma–optical emission spectroscopy (ICP-OES). The examination was performed in accordance with Chinese National Standards of MT/T 1014-2006. Afterward, the obtained results were given as oxides. As many studies reported, K2O, Na2O, CaO, MgO, and Fe2O3 in char sample could play an important role in catalytic effect during gasification. In contrast, SiO2 and Al2O3 had an inhibition effect on gasification reactivity of char sample. In general, the proportion of other oxides in char was extremely small. Then, the alkali index (AI) was proposed to quantify the catalytic activity of inorganic mineral [21,22]. In addition, it has been accepted that the K element contributed most to the catalytic effect of the reaction. Thus, the catalytic index (CI) was also employed to reflect the catalytic capability of the K element. In order to find out whether all the catalytic elements together or only the K element contributed most to the catalytic effect on gasification reactivity, the alkali index (AI) and catalytic index (CI) were calculated and compared. The indexes AI and CI were defined as follows:
where Aa is the ash content of char sample.
2.3.2. Microcrystalline Structure Analysis of the Char Samples
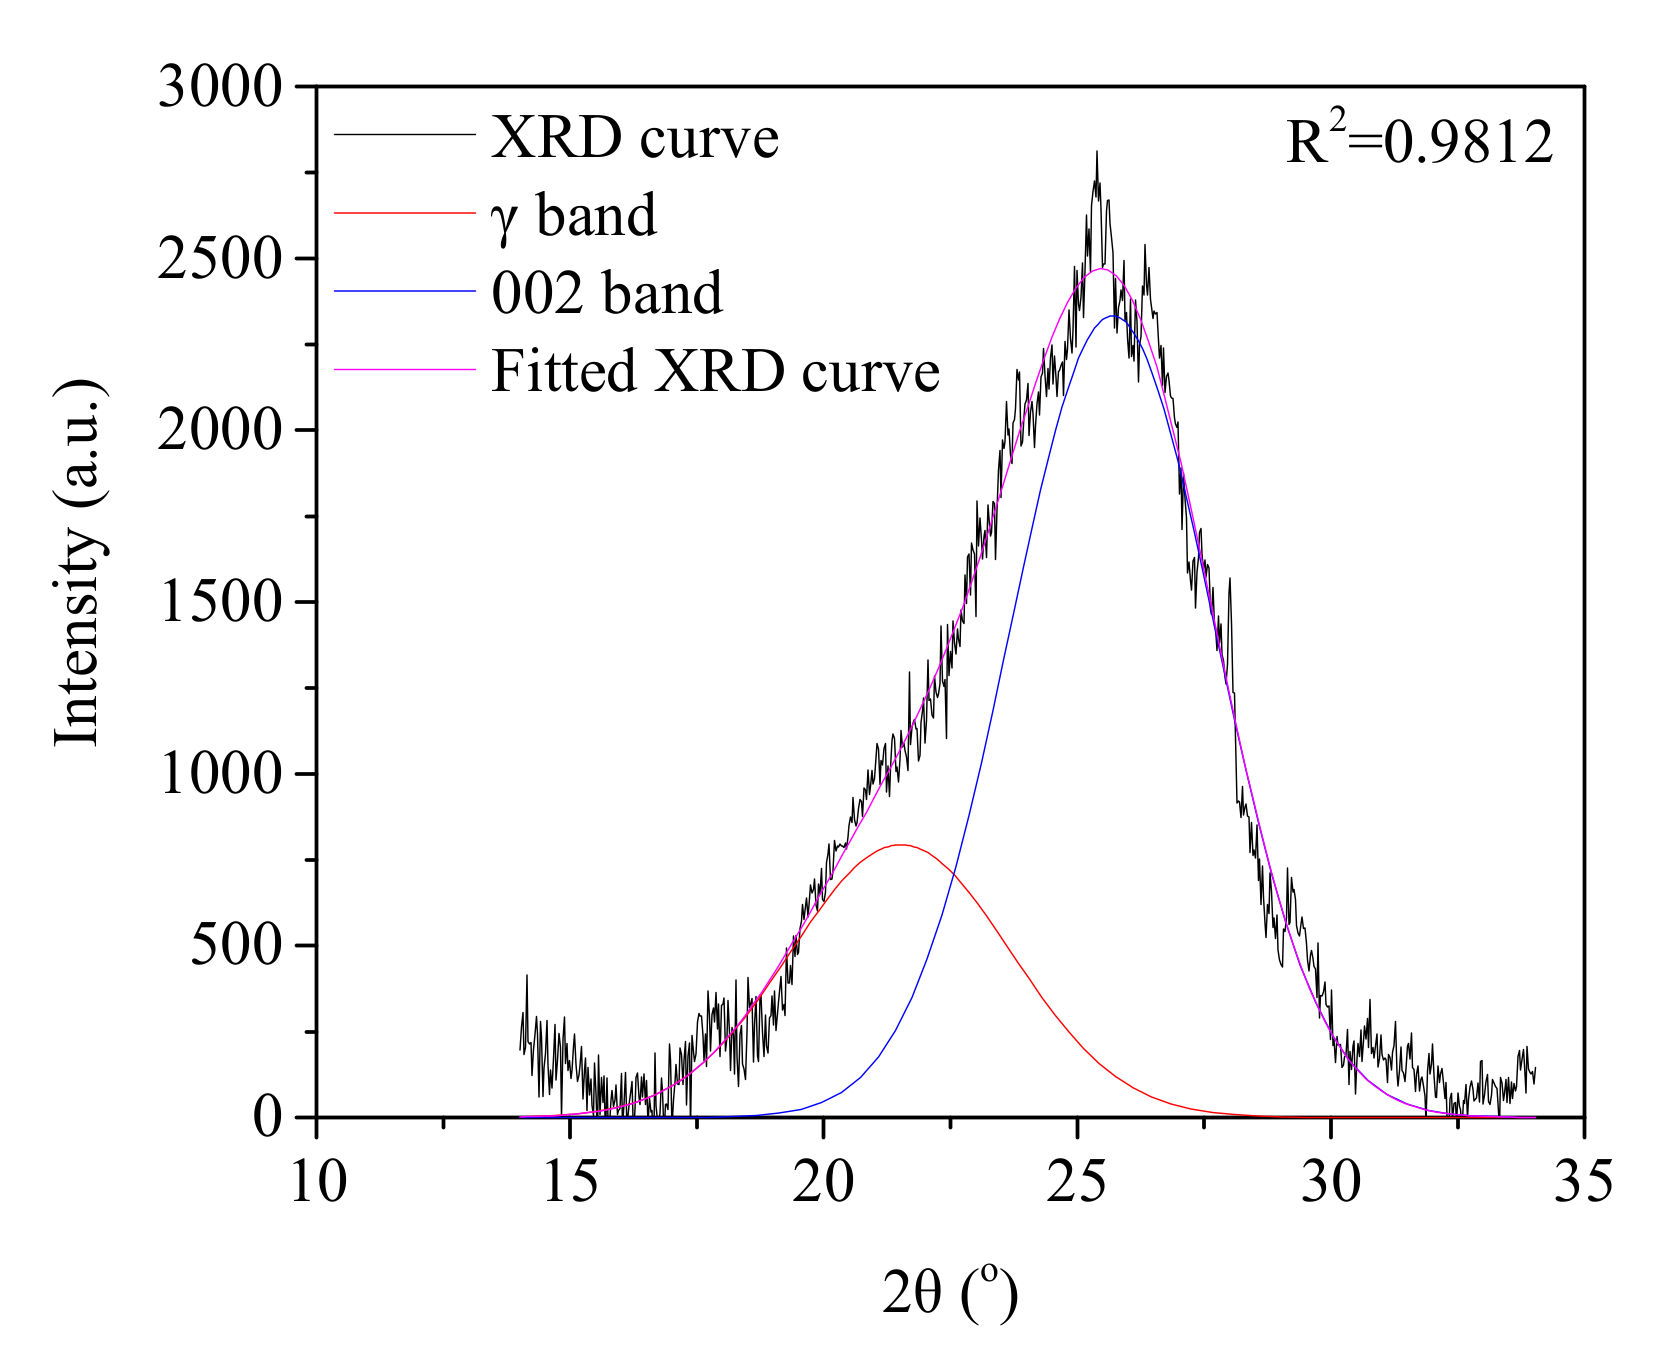
The X-ray diffraction (XRD) patterns of the resulting chars were obtained by using a PANalytical X’Pert3 Powder diffractometer with a Cu Kα radiation source, which could provide the information on graphitization degree. Each spectrum was recorded in a 2θ angle range of 10–80° with a scanning speed of 4°/min. In order to quantify the graphitization degree of char sample, the curve-fitted method was applied for (002) peak of XRD patterns. Take the SA char as an example; a typical curve-fitted result of the resulting char is shown in Figure 1. The formulas and physical meanings of the microcrystalline structure parameters have been described in detail in previous work [23]. In general, a large stacking layer number N of char samples means a higher graphitization degree.
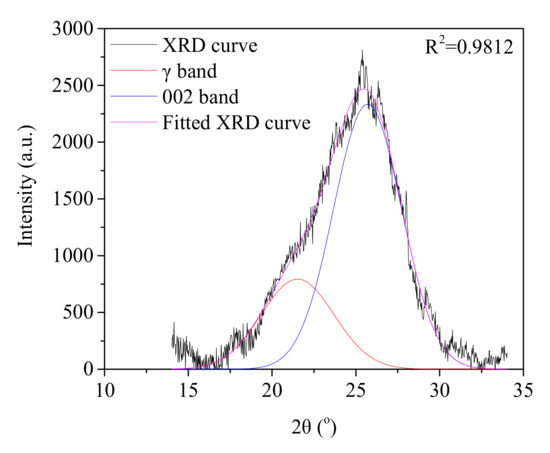
Figure 1.
Curve-fitting XRD spectrum of (002) peak for SA char.
2.3.3. Chemical Structure Analysis of the Char Samples
The chemical functional groups present in char sample were detected by Fourier transform infrared spectrometry (FTIR, Brucker VERTEX 70). Prior to the experiments, the char sample and KBr were dried at 105 °C for 24 h, and then the char sample was first mixed with KBr at a mass ratio of 1:200 (char sample to KBr). Subsequently, the mixture was manually ground to fine powder and then pressed to a translucent disc at a pressure of 12 MPa. Finally, the spectrum of the char sample was collected through 32 scans in the wavenumber range of 4000–400 cm−1 with a resolution of 4 cm−1.
2.4. Isothermal Gasification Experiments of Char Samples
CO2 gasification experiments of the char samples were carried out under isothermal conditions with a thermogravimetric analyzer (TGA, SETARAM, Caluire-et-Cuire, France). For each experimental run, the whole system was purged by using Ar with a flow rate of 140 mL/min for about 20 min. Approximately 10 mg char sample was heated from room temperature to 900 °C with a heating rate of 30 °C/min in Ar atmosphere (140 mL/min), and then Ar was switched to CO2 (140 mL/min) to start the gasification reaction. The system was held for 480 min at the temperature of 900 °C to ensure the completion of the reaction. The carbon conversion (Xc) and reaction rate (r) were calculated using the following equations:
where t is reaction time, m0 and mf are the initial and final mass of char sample, respectively, and mt represents the instantaneous mass of char sample at reaction time t.
Furthermore, to quantitatively compare the reactivity of various samples, the reactivity index (R0.5) was proposed [24,25]. The equation was expressed as follows:
where τ0.5 denotes the required time when the carbon conversion reaches 50% during gasification.
3. Results and Discussion
3.1. Effect of Biomass Type and Blend Ratio on Char Characteristic
3.1.1. Effect of Biomass Type and Blend Ratio on the Content of Elements in Char Samples
The oxide results reflecting the content of the most common element in the char sample are listed in Table 3. Analysis of the results indicated that the trends of the main AAEMs content in ash samples prepared by using raw biomass and coal char samples were in accordance with the results of the ash composition in Table 2. Take the SA char as an example. K content in SA char increased significantly and Mg content increased slightly with the addition of CS. Additionally, both K and Mg content increased slightly with the addition of PS, while a remarkable increase in Ca content was observed. In contrast, the K content in HL char promoted by the addition of biomass was consistent with that in SA char. However, the Ca content in HL showed a decreasing trend. In summary, the increasing degree of K content in char caused by the CS addition was higher than that caused by PS addition during co-pyrolysis. The difference was closely related to the different contents of AAEM species in the different biomass types. The breakage of the bond between metal and char matrix could be responsible for the volatilization of AAEM species in the biomass. Then, the AAEM species deposited on the coal char surface, and thus the contents of AAEM species in the coal char sample were improved. Consequently, the higher K content in CS and the volatility of K determined the variation trend of K content. Accordingly, the K content in coal char was significantly promoted with increasing mass ratio. For example, K content in SA char increased from 0.46 to 10.93% when the mass ratio of CS increased from 0 to 80%, confirming that higher content of AAEM species was beneficial for volatilization and deposited more on the coal char surface. Meanwhile, a slight increase in Mg content also reflected the fact that K was more volatile than Mg in biomass char. It was worth noting that the Ca content in HL char decreased with the increase in mass ratio, which might be attributed to the fact that the Ca content in HL char was relatively high; however, Ca was more difficult to evaporate than K during the pyrolysis process and then it was retained in biomass char, so it was not conducive to the migration and fixation of active Ca in biomass into coal char. Therefore, AAEMs in biomass evaporated easily and deposited in coal char, resulting in the increase in AAEMs content in coal char, and then the contents of AAEM species in the coal char sample were determined by the AAEM species and the contents of AAEMs in biomass during co-pyrolysis.
Table 3.
The content of element in different char samples.
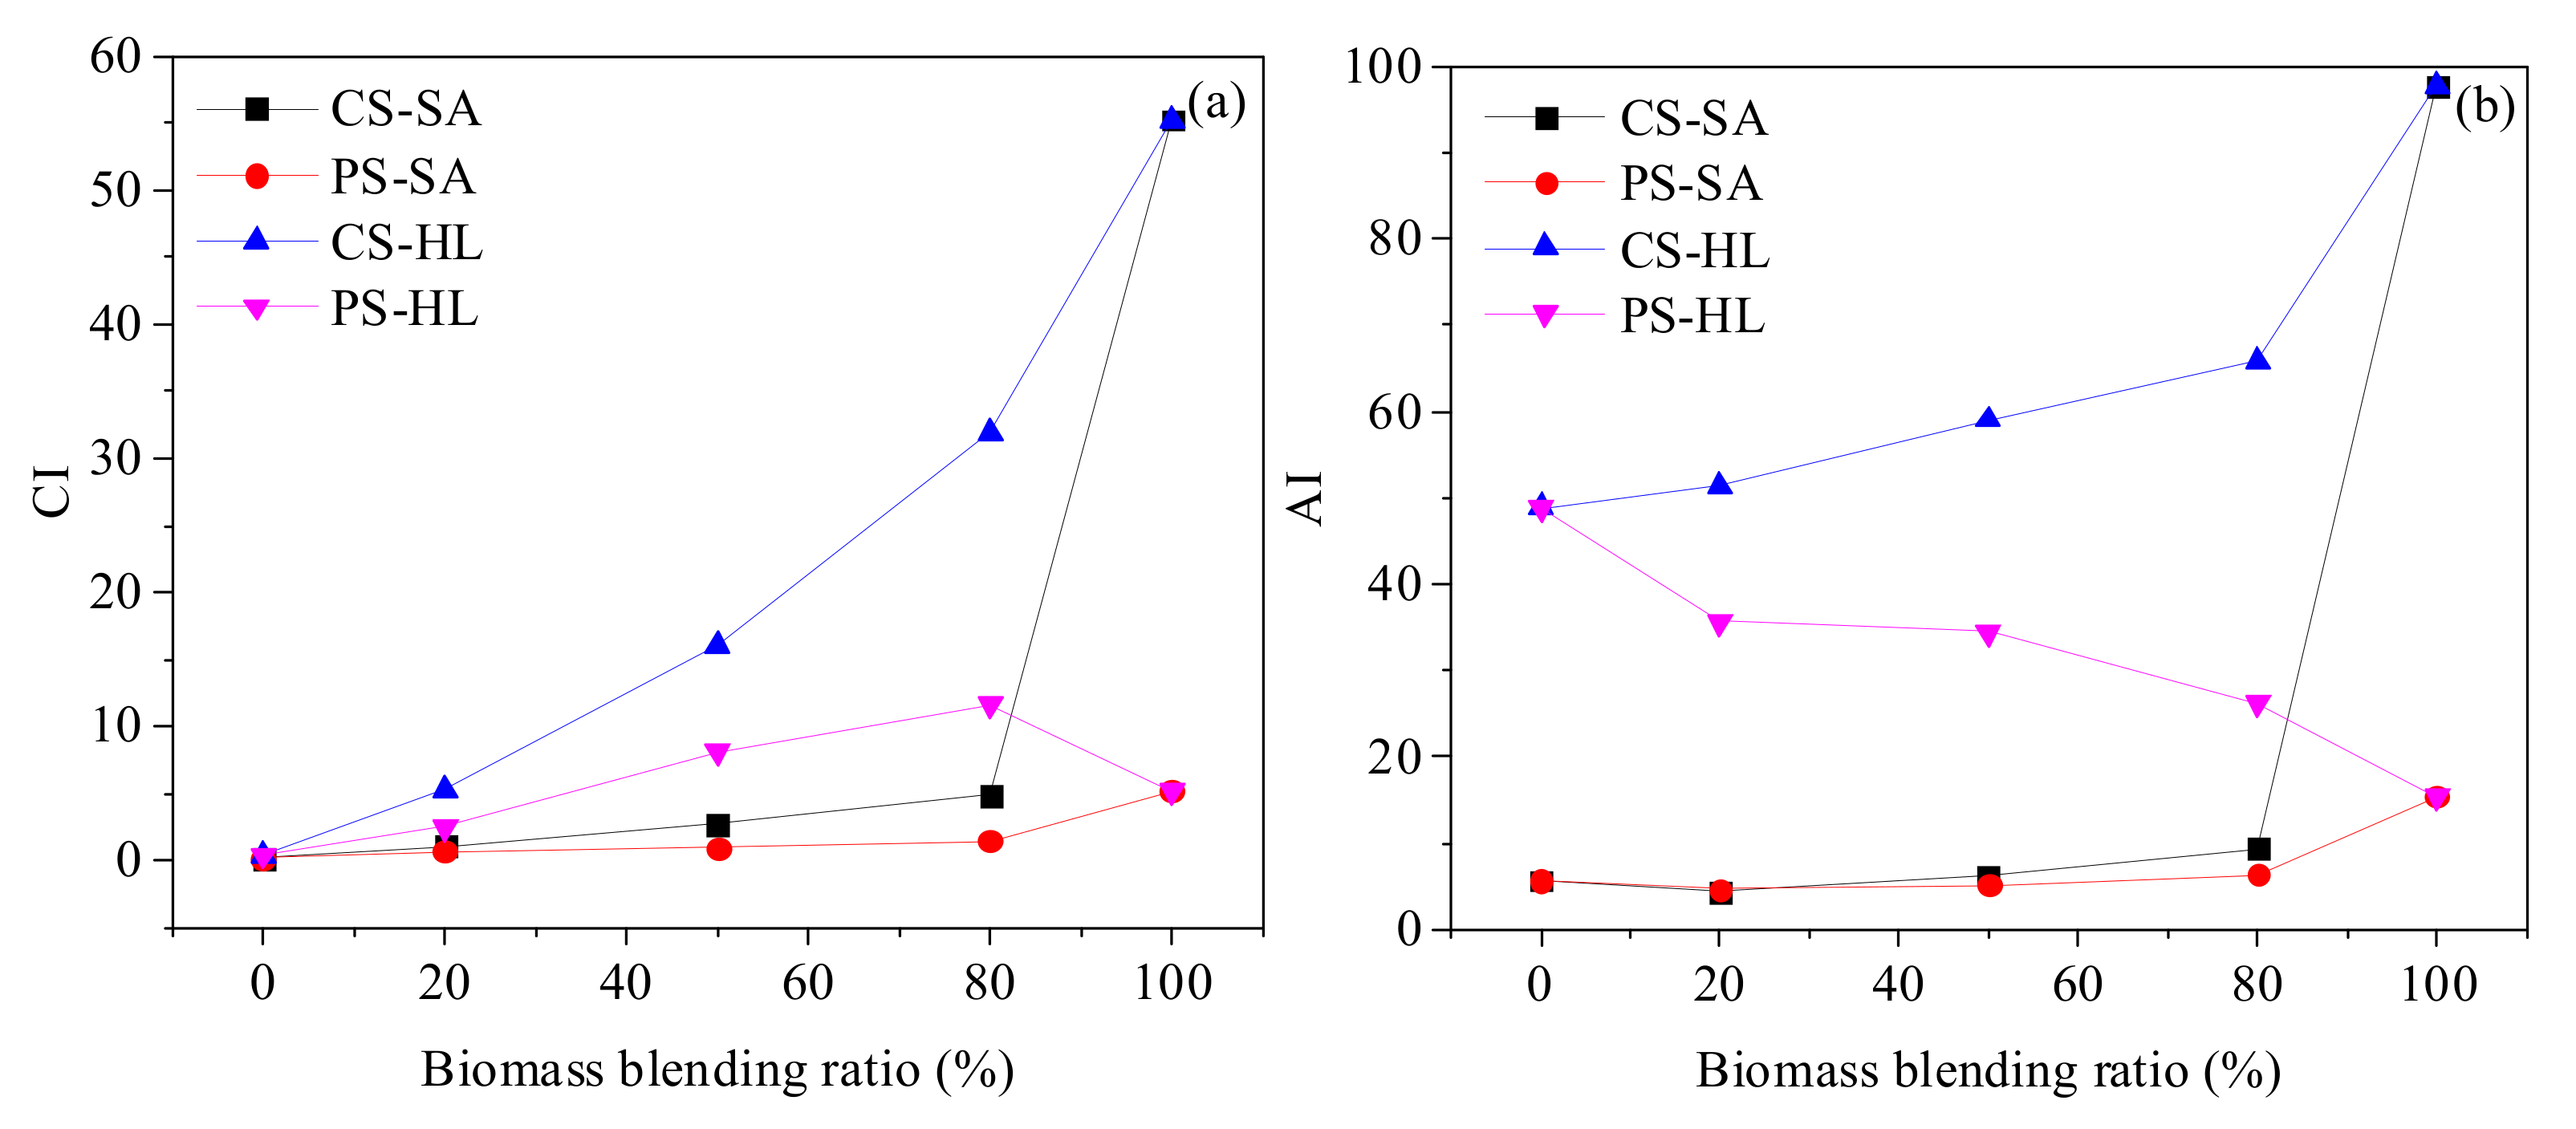
Different AAEMs exhibited different behaviors during pyrolysis, and thus two representative catalytic indices were used to quantitatively describe the role of inorganic materials in the gasification process. As depicted in Figure 2, the value of CI increased with the increase in blend ratio. Additionally, the promotion effect of CS on the CI was more significant than that of PS. The variation trend of CI was consistent with the results of K mentioned above. However, it could be obviously observed that the changes of AI and CI were significantly different, indicating that the selection of catalytic indices needed to be treated with caution.

Figure 2.
(a) CI and (b) AI of different char samples.
3.1.2. Effect of Biomass Type and Blend Ratio on the Microcrystalline Structure
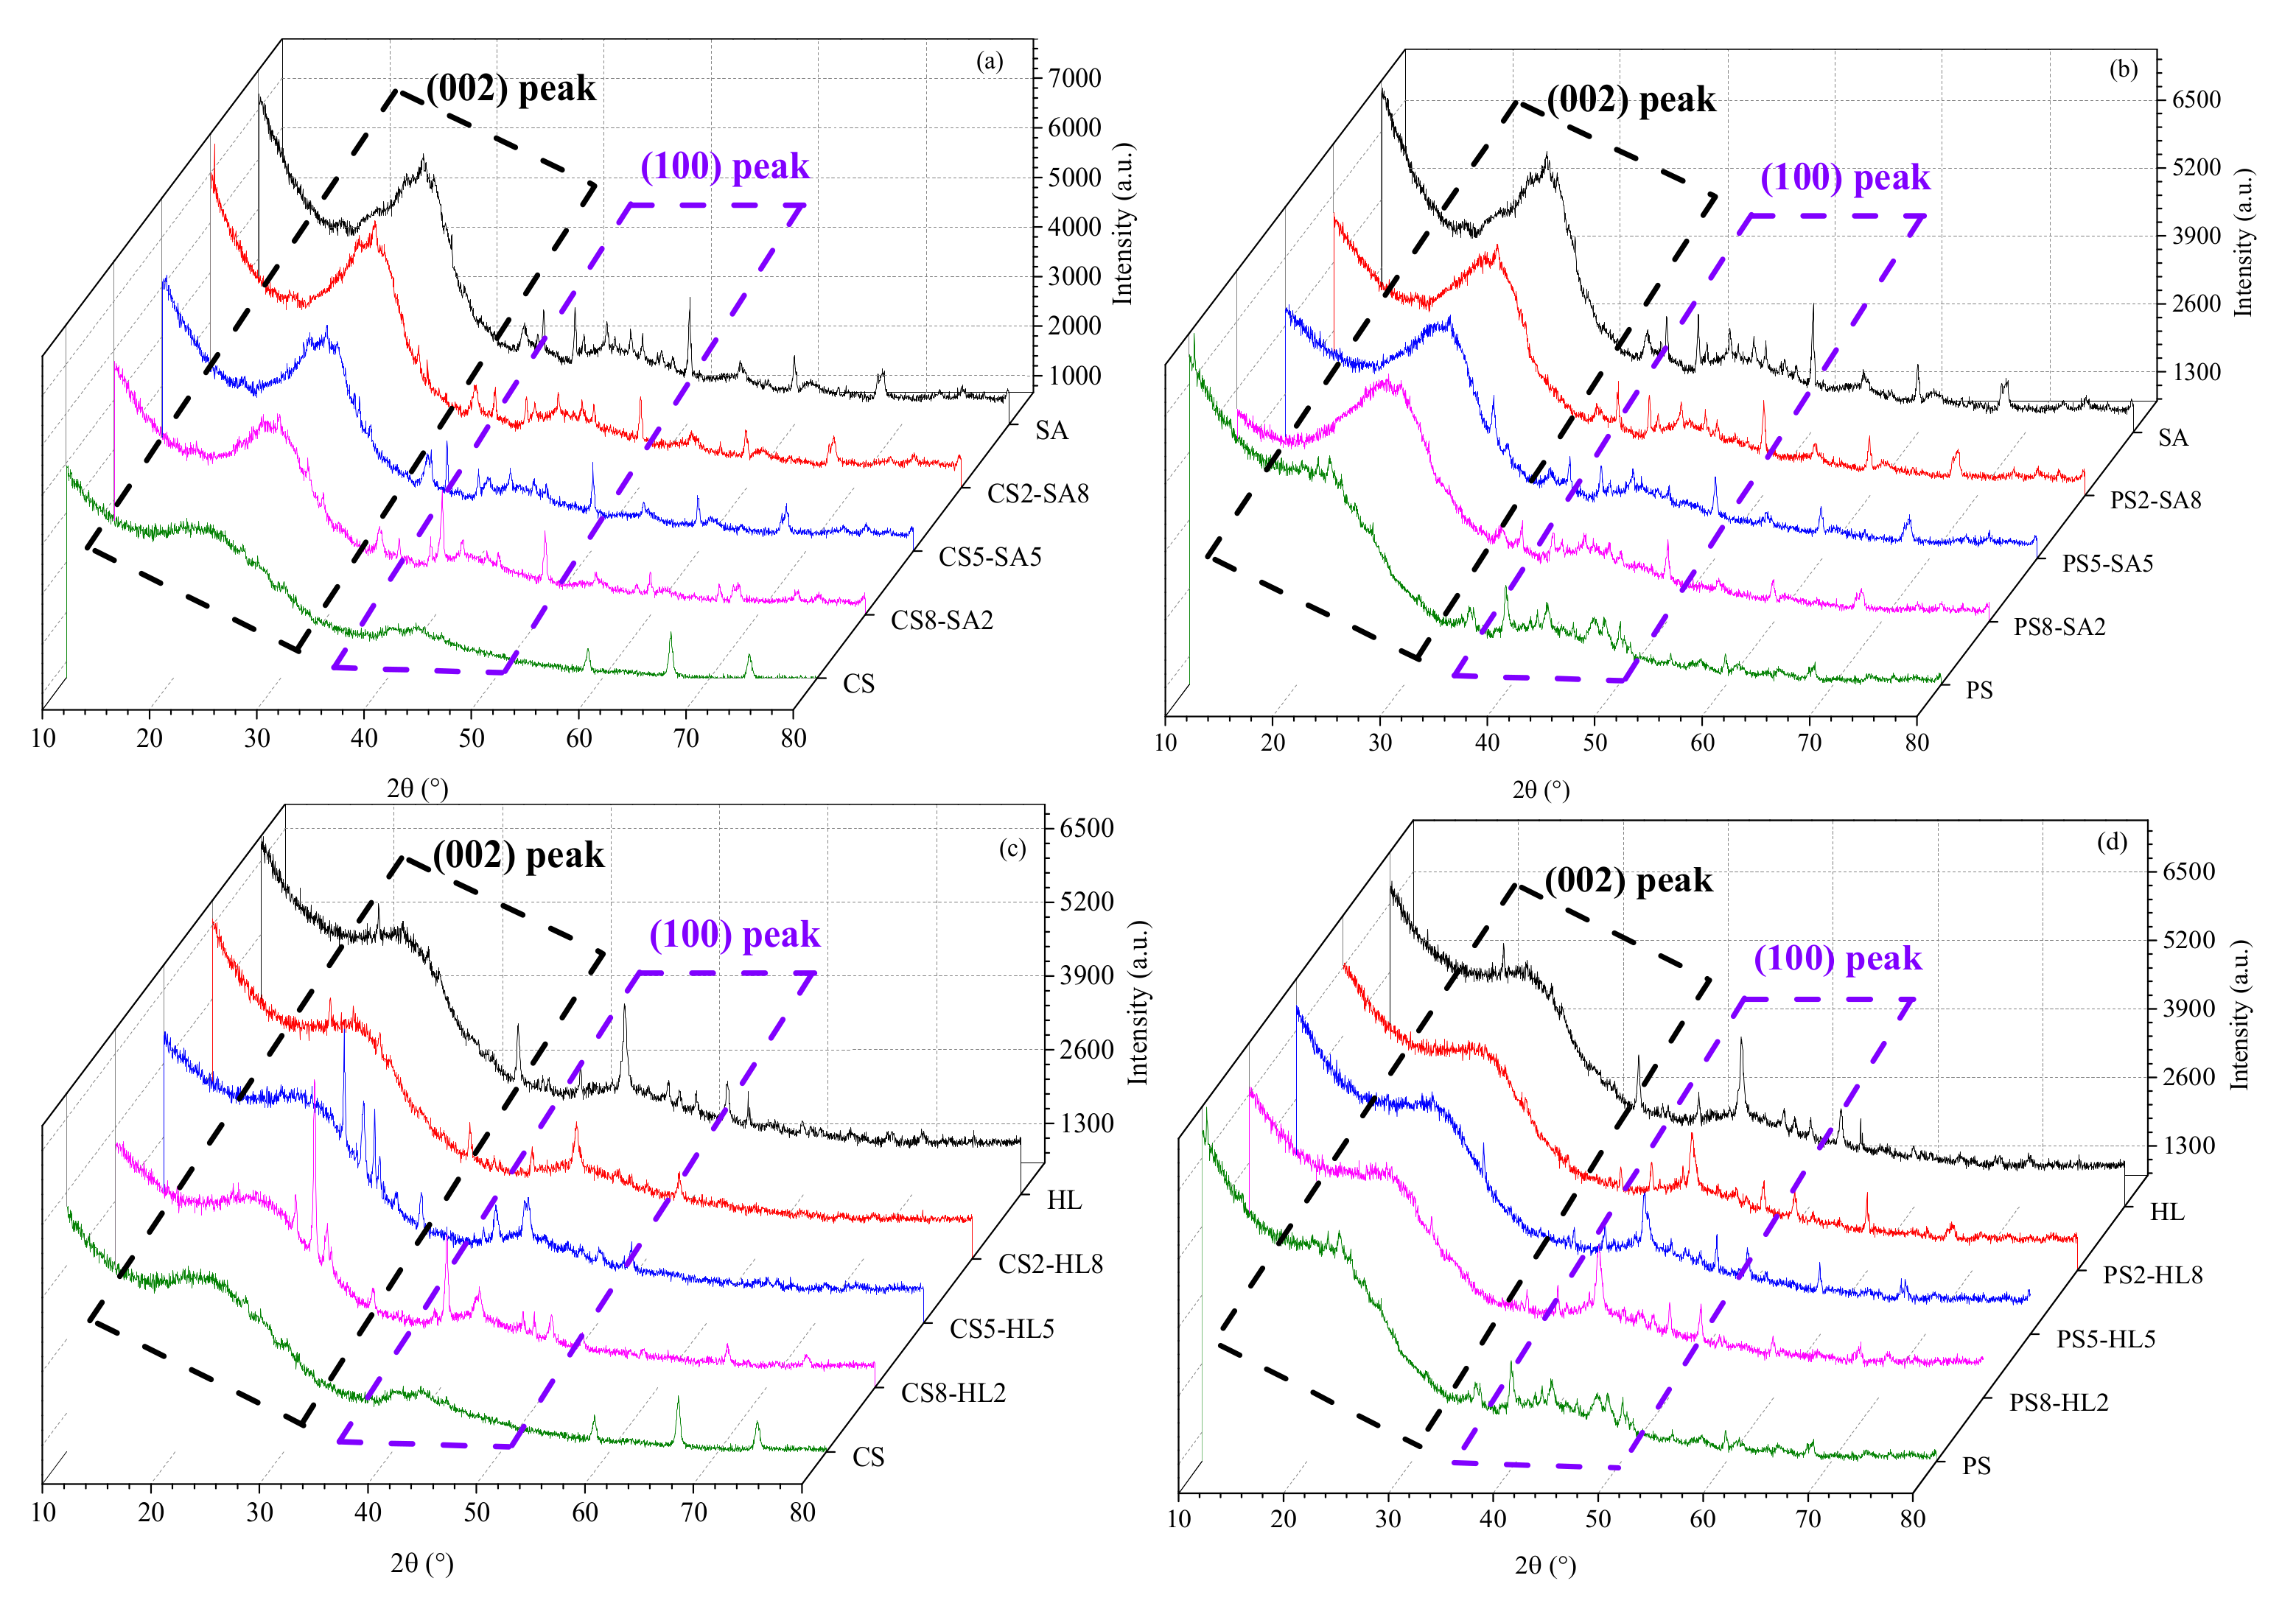
The original XRD patterns of different char samples are presented in Figure 3. The (002) and (100) diffraction peaks at 2θ angle range of 14~34° and 38~50° could be obviously observed in the XRD spectra. In general, the (002) peak could reflect the stacking between the aromatic rings, while the (100) peak could represent the size of aromatic crystallite within a single plane. Results showed that the background intensity of the (002) peak in the XRD spectrum of SA char decreased with the addition of CS and PS. The same results were shown in the XRD spectrum of HL char, indicating that the structure of the coal char tended to disordering owing to the addition of the biomass during co-pyrolysis. Moreover, at the same mass ratio, CS addition showed a more significant decrease effect on background intensity than PS addition.
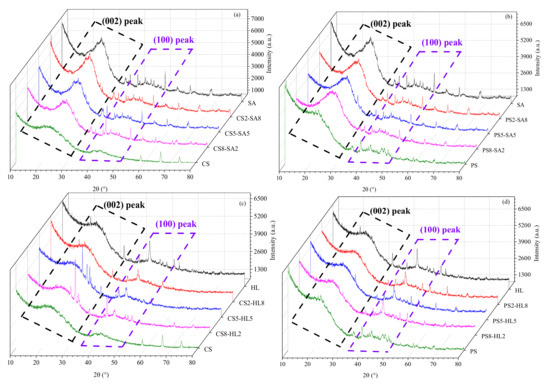
Figure 3.
XRD patterns of different char samples: (a) SA char with different CS mass ratios, (b) SA char with different PS mass ratios, (c) HL char with different CS mass ratios, (d) HL char with different PS mass ratios.
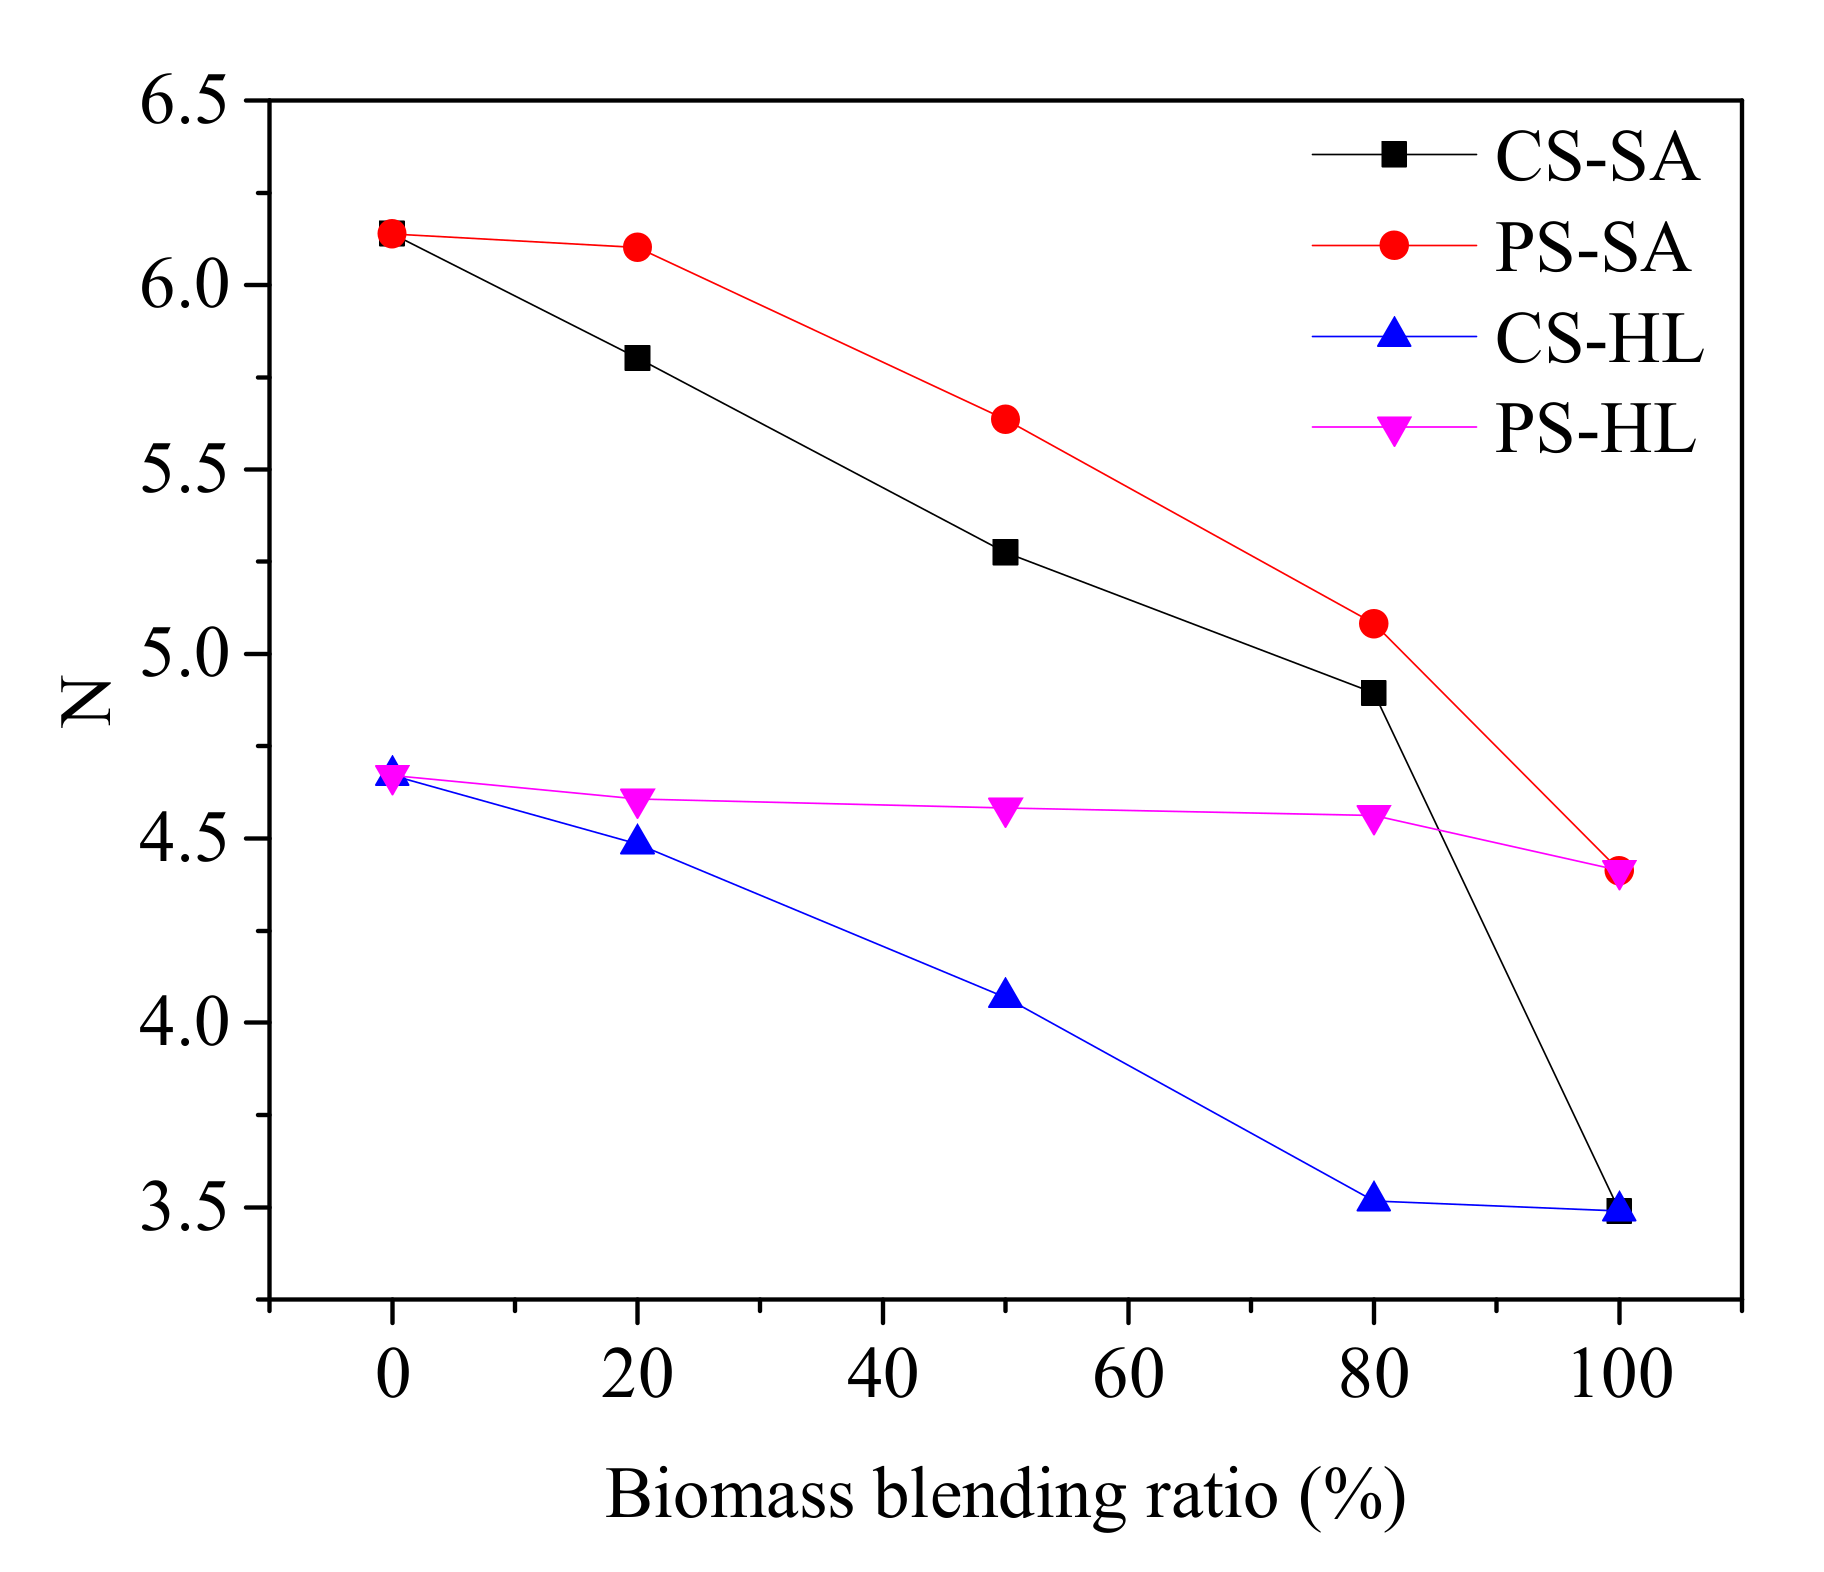
As the literature reported, the interplanar spacing d002 reflects the perfection extent in the periodicity of the stacking structure for aromatic layers, and the stacking height Lc demonstrates the crystallite size changes in-plane and the polymerization of longitudinally aromatic structure [26,27]. The stacking layer number N (Lc/d002 + 1) could better represent the graphitization degree of char sample, which is shown in Figure 4.
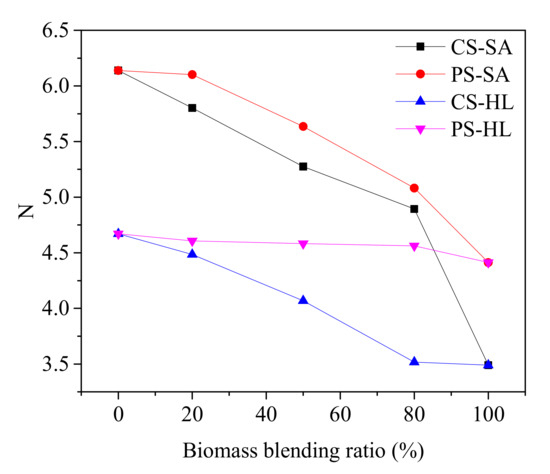
Figure 4.
The stacking layer number of various char samples.
It could be observed that as the CS blend ratios increased from 20 to 80%, N values of CS-SA decreased from 5.8 to 4.89, while the N values of CS-HL decreased from 4.48 to 3.51. Likewise, N values of PS-SA were gradually reduced from 6.1 to 5.08 as the PS blend ratios increased from 20 to 80%, while the N values of PS-HL decreased slightly from 4.61 to 4.56. The results were consistent with the qualitative analysis, indicating that the addition of CS and PS inhibited the graphitization process of coal char during co-pyrolysis. Moreover, the inhibit effect of CS and PS on the graphitization process was promoted with increasing blend ratio, which could be attributed to the fact that with the increase in biomass ratio, the more AAEM contents in coal char were transferred from biomass, and the greater inhibition effect on the graphitization degree of coal char was discovered. Meanwhile, the inhibition effect of CS was higher than that of PS at the same blend ratio. The reason was that CS contained more AAEMs, the content of K and Mg in CS especially was significantly higher than that of PS. It has been well confirmed that the presence of AAEMs could inhibit the microcrystalline structure of char in the pyrolysis process, hindering the development of graphitization degree, and thus promote the formation of amorphous carbon structure [28,29]. On the other hand, compared with CS, PS contained more cellulose and less lignin and hemicellulose from the perspective of biomass compositions [28]. The order of carbon structure could be promoted by the cellulose, while lignin and hemicellulose could promote the three-dimensional development of char structure [19].
3.1.3. Effect of Biomass Type and Blend Ratio on the Molecular Structure
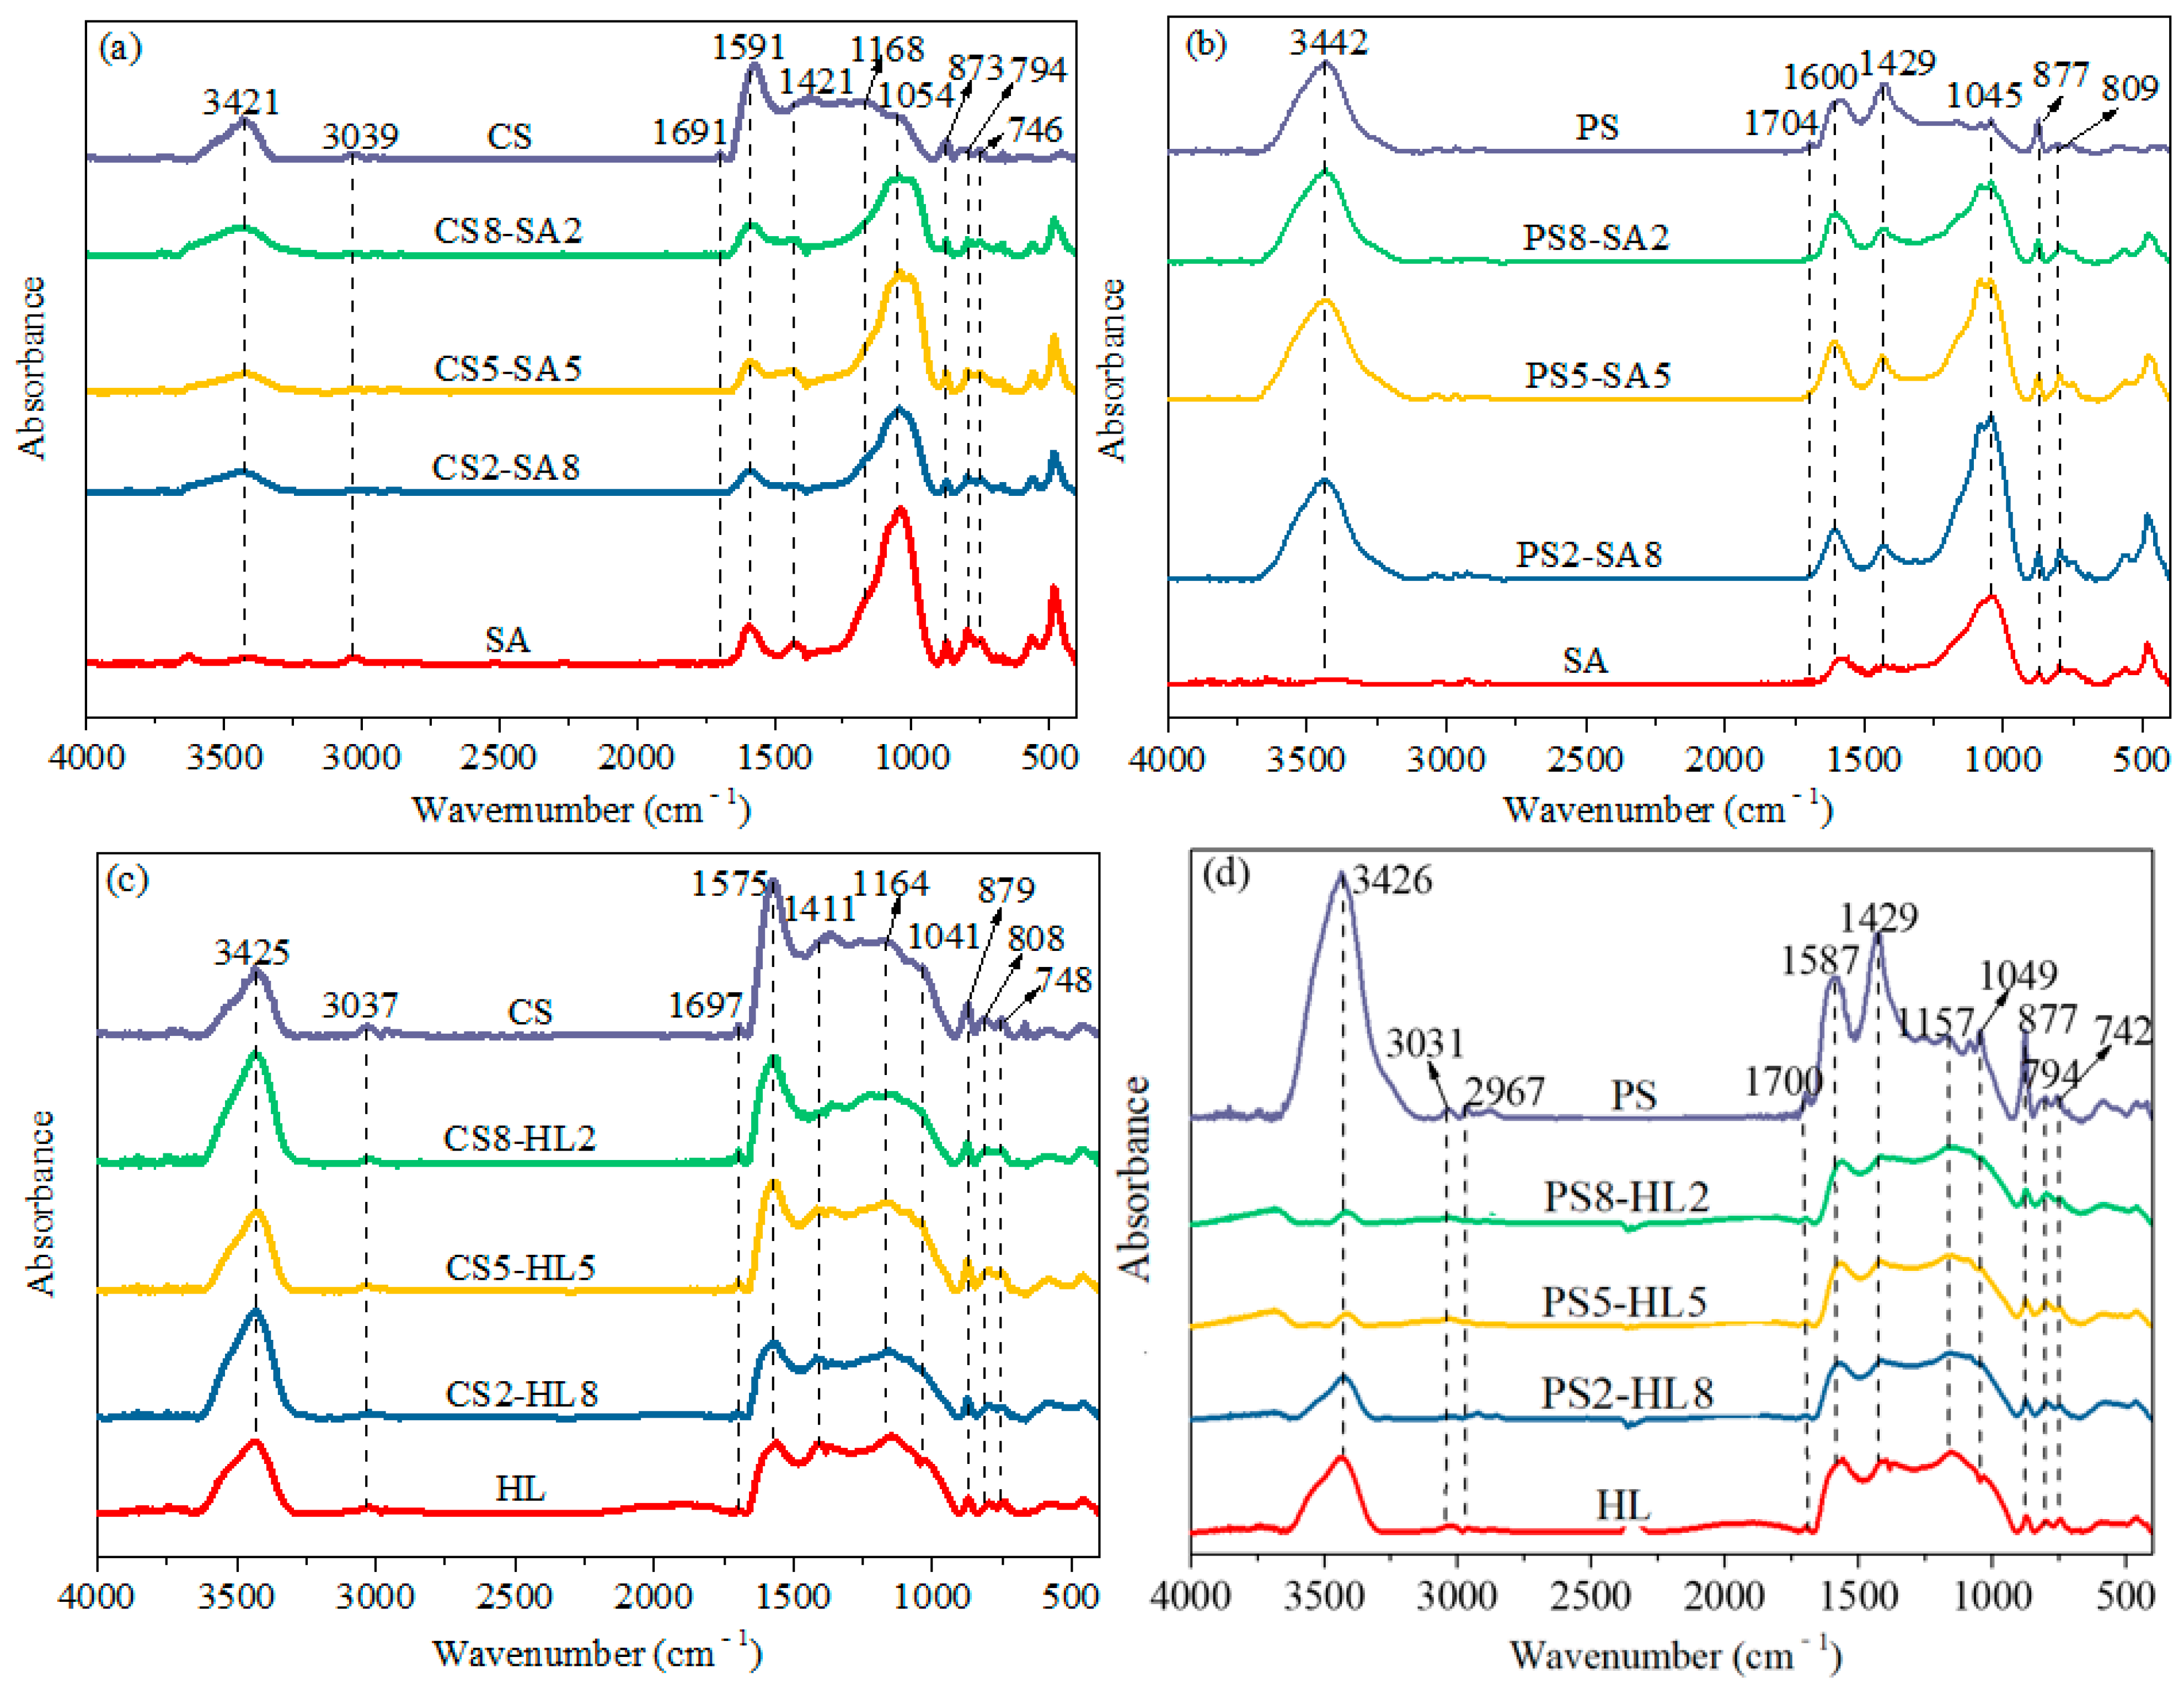
As depicted in Figure 5, all samples had similar characteristic absorption bands, including aromatic structures (700–900 cm−1), oxygen-containing structures (1000–1800 cm−1), aliphatic structures (2800–3100 cm−1), and hydroxyl structures (3200–3600 cm−1) [30]. A remarkable absorption band was found in the 3200–3600 cm−1 zone, which could be attributed to -OH groups and N-H groups. Given the possibility that a small amount of water was still present or was absorbed from the moist air into the translucent disc after drying, the band was not studied to avoid mischaracterizing the intrinsic structure of the sample. It was worth noting that the peak intensities of sharp bands at ~1600, ~1420, ~1045, and ~877 cm−1 varied with the type and blend ratio of biomass. Those bands were related to the C=C, C-O, Si-O-Si (or Si-O-C), and -CH groups, respectively [31]. Meanwhile, compared with SA char, the peak intensities of Si-O-Si (or Si-O-C) and -CH groups in HL char were weak. Low Si content and graphitization degree of HL char could be responsible for the phenomenon. As the CS blend ratio increased from 20 to 80%, the peak intensities of Si-O-Si (or Si-O-C) and -CH in SA char decreased, while the peak intensities of C=C increased. The reason was that many large aromatic ring structures in coal char were broken during co-pyrolysis with CS, resulting in a less condensed ring structure. Likewise, the results that the variation of function groups in HL char were affected by the type and blend ratio of biomass during co-pyrolysis were consistent with the conclusions of XRD patterns.
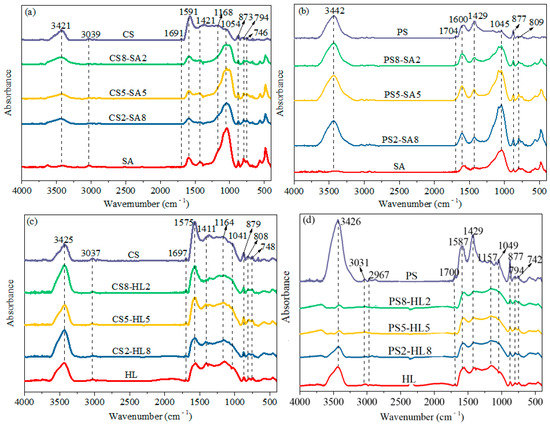
Figure 5.
FTIR spectra of char samples with different biomass mass ratios: (a) SA char with different CS mass ratios, (b) SA char with different PS mass ratios, (c) HL char with different CS mass ratios, (d) HL char with different PS mass ratios.
3.2. Gasification Characteristics of Char Samples
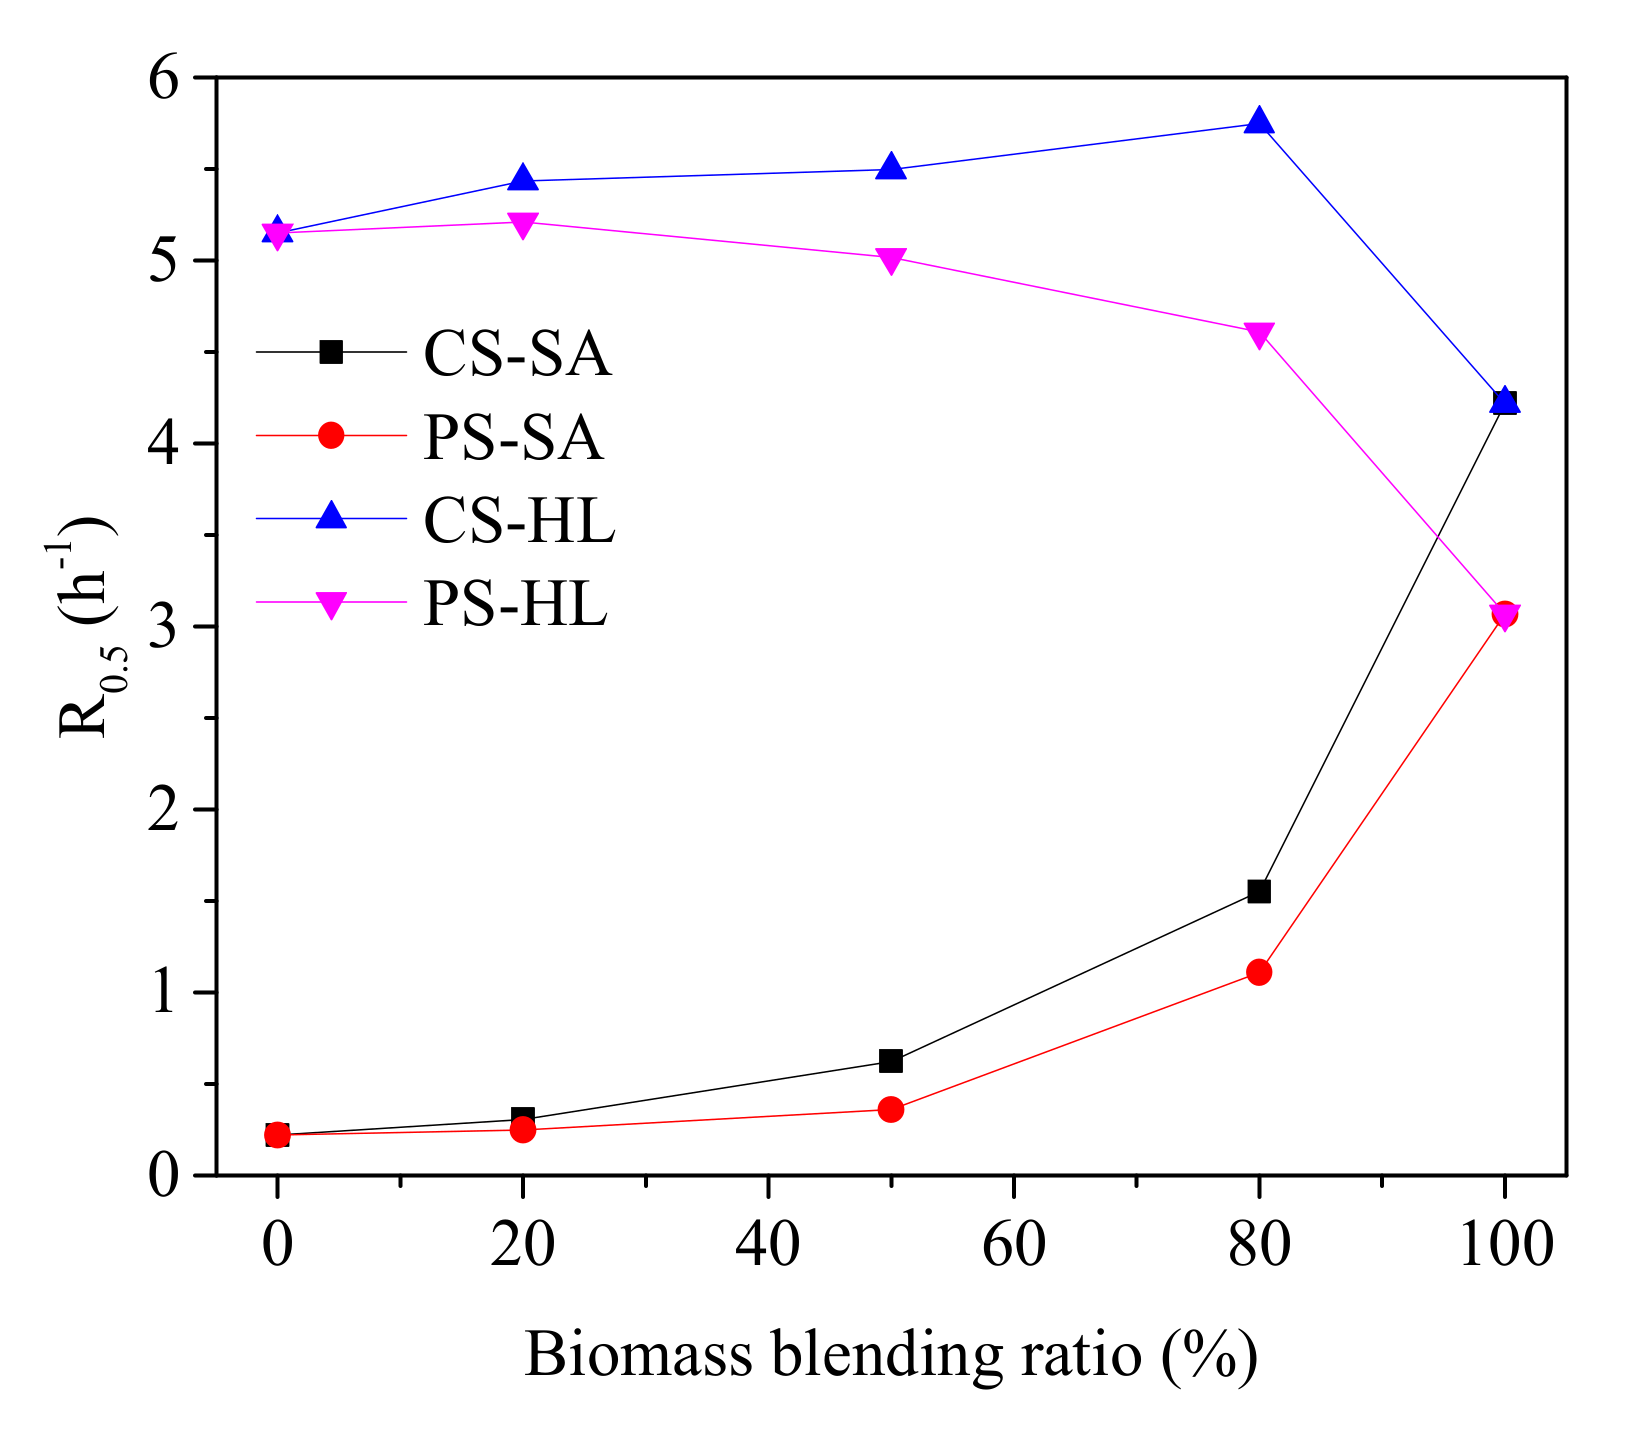
The effect of biomass type and blend ratio on the gasification reactivity of coal char samples was studied. As shown in Figure 6, the gasification reaction time required to achieve the same carbon conversion varied with the type and blend ratio of biomass. Moreover, the R0.5 values of char samples are shown in Figure 7. It could be observed that R0.5 values of SA char samples separated from the co-pyrolysis samples increased with the increasing blend ratio of biomass, indicating that CS and PS had a significant improvement effect on the gasification reactivity of SA char samples, and the improvement degree increased with the increase in additive proportion. In addition, CS had more significant effect on the reactivity of SA char samples than PS. As mentioned above, the changes of CI and AI could be responsible for the phenomenon, indicating that the gasification reactivity could be significantly improved by the AAEMs. Additionally, the small N value of SA char separated from the CS-SA mixture also contributed to improving the reactivity. However, the reactivity of HL char increased slightly with the addition of CS. Even the reactivity of HL char decreased with the addition of PS. Meanwhile, the reactivity of HL char was gradually diminished with increasing PS blend ratio.
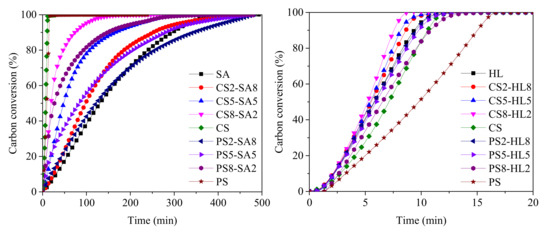
Figure 6.
Carbon conversion variations versus reaction time for different char samples.
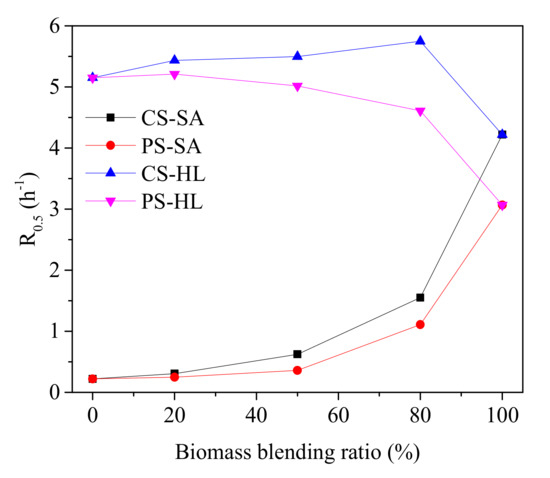
Figure 7.
Reactivity index of char samples with different mass ratios at 900 °C.
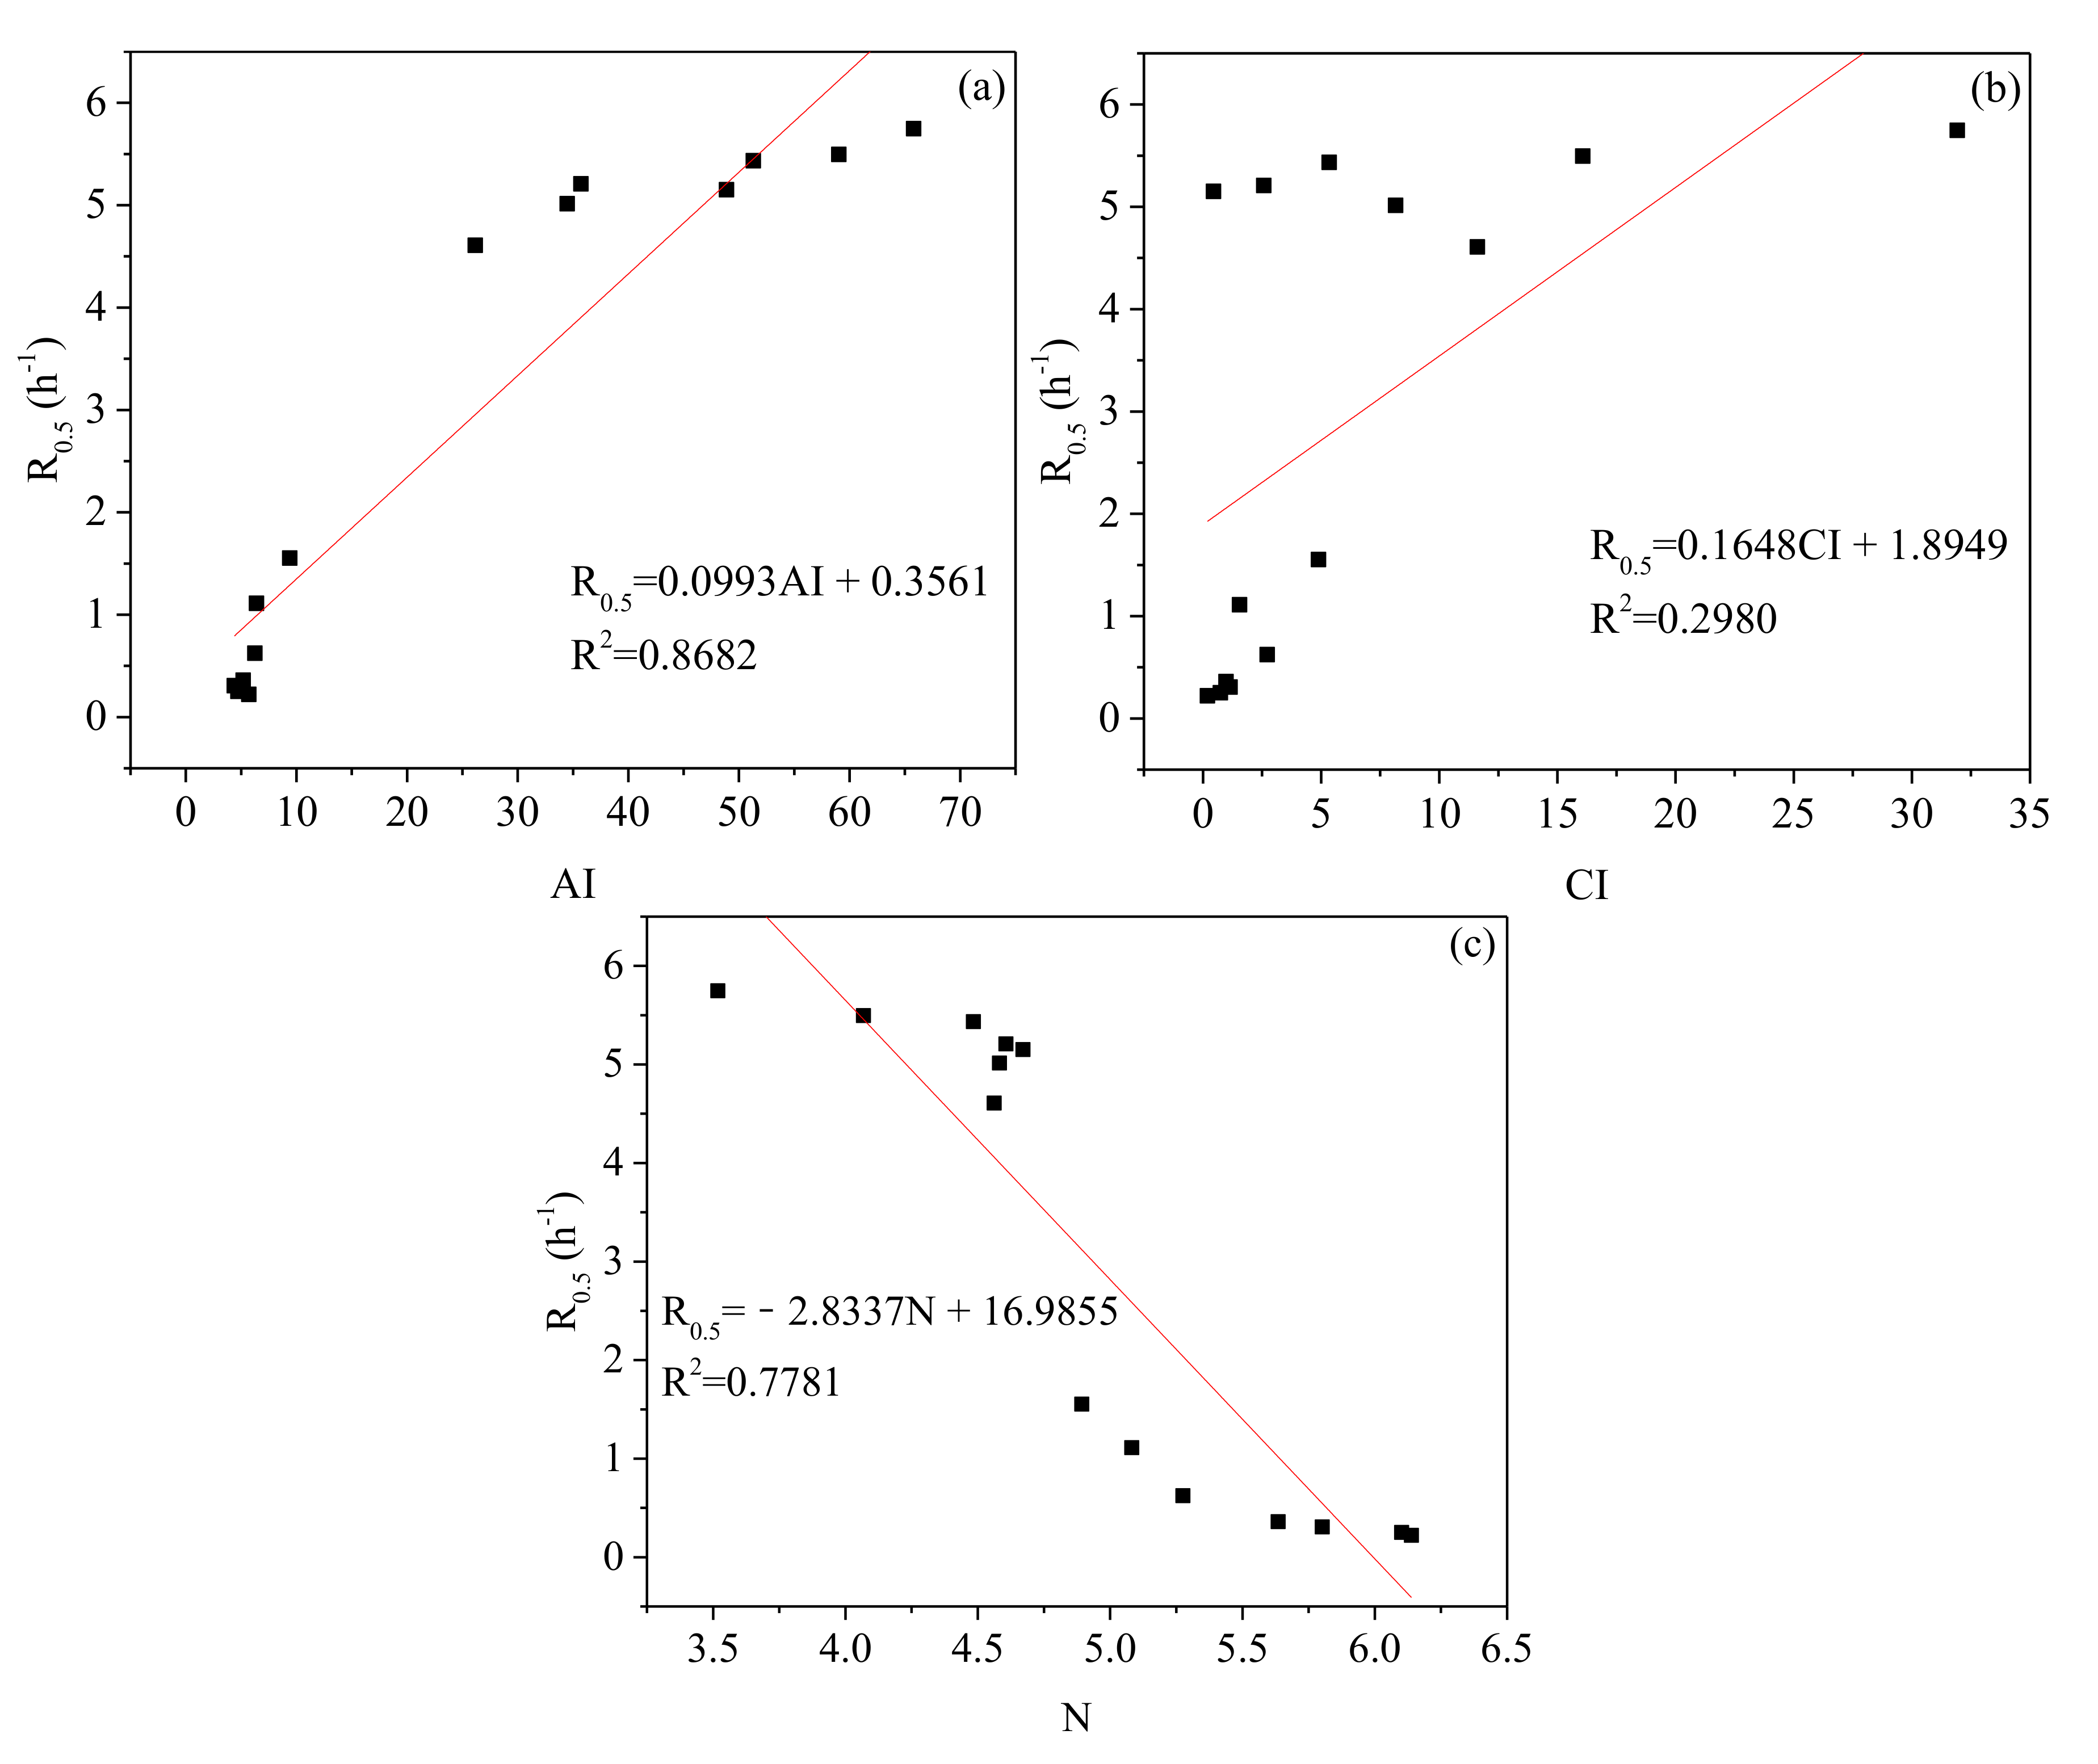
In order to reveal the crucial factors affecting the reactivity during the gasification process, the correlation between reactivity index and structural properties of char samples was conducted using the linear regression model. The fitting results between individual structural parameters and reactivity index R0.5 are presented in Figure 8. Reactivity index of coal char was positively correlated with AI and CI but negatively correlated with N. As expected, it demonstrated that char samples with high catalytic index and low graphitization degree were generally considered to have higher gasification reactivity. The linear correlation coefficients between R0.5 and AI, CI, and N were compared. Then, the influence degree of structural characteristics on reactivity could be ranked as follows, AI > N > CI, indicating that the catalytic activity of inorganic mineral played a much more important role in predicting gasification reactivity than the graphitization degree. Meanwhile, it was also found that the catalytic effect of K on gasification reaction was not as great as expected compared with the correlation between AI and R0.5, indicating that the relationship between AI and R0.5 was not clear. At high gasification temperature, K element evaporated easily, which led to the reduction in catalytic effect on the reaction [32]. Additionally, Na, Ca, Mg, and Fe in the char sample could play an important role in the catalytic effect during gasification. Consequently, the combination of all catalytic oxides may be more consistent with the catalytic effect of minerals on gasification reactivity, which was also successfully verified by Li et al. [33]. Then, CI should be prudently regarded as a probe for gasification reactivity. Considering that the accuracy of single index in predicting the gasification reactivity of coal char in the mixed sample was limited and the reactivity was affected by a variety of factors, an attempt was made to combine the AI and N to better predict the reactivity of coal char in the process of co-gasification between coal and biomass. The reasonable relationship is shown in Equation (6), and the corresponding correlation coefficient was 0.8797.
R0.5 = 0.07164AI − 0.9432N + 5.7514
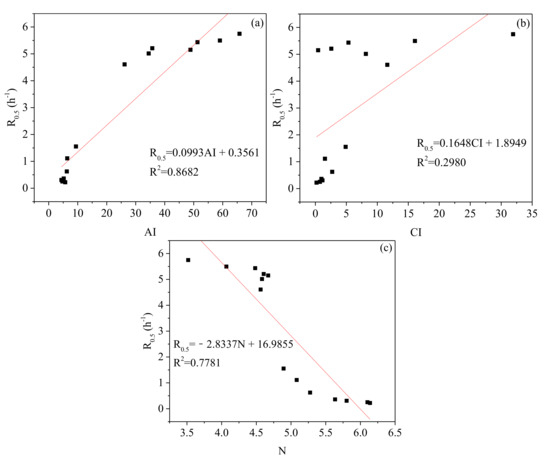
Figure 8.
Relationships between individual structural properties and gasification reactivity index: (a) AI and R0.5, (b) CI and R0.5, (c) N and R0.5.
The above results indicated that the interaction between coal and biomass during co-gasification was related to the migration of AAEMs in biomass during co-pyrolysis and its influence on the degree of graphitization. Co-pyrolysis process, the basic step in the co-gasification process, determines the properties of solid mixture, which affects its gasification reactivity.
4. Conclusions
In this research, the effect of biomass type and blend ratio on the structure properties and gasification characteristics of coal char was investigated by using a method that the coal char was separated from blended char based on the difference in particle size, which gave in-depth insights into the interaction mechanism between coal and biomass during co-gasification. The main conclusions are summarized as follows:
- (1)
- The contents of AAEM species in the coal char sample were determined by the AAEM species and the contents of AAEMs in biomass during co-pyrolysis. Higher K content in CS determined that the increasing degree of K content in coal char caused by the CS addition was higher than that caused by PS addition.
- (2)
- The graphitization process of coal char was inhibited by the addition of CS and PS during co-pyrolysis, and the inhibition effect of CS and PS on graphitization process was promoted with increasing blend ratio. The reason was that, with the increase in biomass ratio, more AAEM contents in coal char were transferred from biomass. Additionally, the inhibition effect of CS was higher than that of PS at the same blend ratio as a result of the higher AI value as well as more lignin and hemicellulose in CS.
- (3)
- The catalytic activity of inorganic mineral played a much more important role in predicting gasification reactivity than the graphitization degree. Moreover, the relationship R0.5 = 0.07164AI − 0.9432N + 5.7514 was established to better predict the reactivity of coal char in the process of co-gasification between coal and biomass.
Author Contributions
Conceptualization, data curation, funding acquisition, methodology, and writing—original draft preparation, X.L.; formal analysis and investigation, J.H.; conceptualization, methodology, and writing—review and editing, M.L.; conceptualization, methodology, validation, and writing—review and editing, J.B.; formal analysis and writing—review and editing, Z.B.; supervision and writing—review and editing, W.L. All authors have read and agreed to the published version of the manuscript.
Funding
This research was funded by the Natural Science Foundation of Shanxi Province, grant number 201801D121050, and National Natural Science Foundation of China, grant number 22178240.
Institutional Review Board Statement
Not applicable.
Informed Consent Statement
Not applicable.
Data Availability Statement
Not applicable.
Acknowledgments
This work was financially supported by the Natural Science Foundation of Shanxi Province (grant number 201801D121050) and NSFC (grant number 22178240).
Conflicts of Interest
The authors declare no conflict of interest.
Nomenclature/Abbreviations
| d002 | Interplanar spacing, Å |
| Lc | Stacking height, Å |
| m0 | Initial mass of char sample, mg |
| mf | Final mass of char sample, mg |
| mt | Instantaneous mass of char sample at the reaction time t, mg |
| N | Stacking layer number |
| r | Reaction rate of char sample, %/h |
| R0.5 | Reactivity index, h−1 |
| R2 | Correlation coefficients |
| t | Time, h |
| Xc | Carbon conversion of char sample, % |
| τ0.5 | Time when the carbon conversion reaches 50%, h |
| AAEMs | Alkali and alkaline earth metals |
| AI | Alkali index |
| CI | Catalytic index |
| CS | Corn straw |
| CS2-HL8 | Separated HL char sample, and the weight ratio of CS was 20% in the blend of CS and HL |
| CS5-HL5 | Separated HL char sample, and the weight ratio of CS was 50% in the blend of CS and HL |
| CS8-HL2 | Separated HL char sample, and the weight ratio of CS was 80% in the blend of CS and HL |
| CS2-SA8 | Separated SA char sample, and the weight ratio of CS was 20% in the blend of CS and SA |
| CS5-SA5 | Separated SA char sample, and the weight ratio of CS was 50% in the blend of CS and SA |
| CS8-SA2 | Separated SA char sample, and the weight ratio of CS was 80% in the blend of CS and SA |
| FTIR | Fourier transform infrared spectrometry |
| HL | Hami lignite |
| ICP-OES | Inductively coupled plasma-optical emission spectrometry |
| PS | Poplar sawdust |
| PS2-HL8 | Separated HL char sample, and the weight ratio of PS was 20% in the blend of PS and HL |
| PS5-HL5 | Separated HL char sample, and the weight ratio of PS was 50% in the blend of PS and HL |
| PS8-HL2 | Separated HL char sample, and the weight ratio of PS was 80% in the blend of PS and HL |
| PS2-SA8 | Separated SA char sample, and the weight ratio of PS was 20% in the blend of PS and SA |
| PS5-SA5 | Separated SA char sample, and the weight ratio of PS was 50% in the blend of PS and SA |
| PS8-SA2 | Separated SA char sample, and the weight ratio of PS was 80% in the blend of PS and SA |
| SA | Shanxi anthracite |
| TGA | Thermogravimetric analyzer |
| XRD | X-ray diffraction |
| XRF | X-ray fluorescence |
References
- Roncancio, R.; Gore, J.P. CO2 char gasification: A systematic review from 2014 to 2020. Energy Convers. Manag. X 2020, 10, 100060. [Google Scholar] [CrossRef]
- Wei, J.; Gong, Y.; Guo, Q.; Chen, X.; Ding, L.; Yu, G. A mechanism investigation of synergy behaviour variations during blended char co-gasification of biomass and different rank coals. Renew. Energy 2019, 131, 597–605. [Google Scholar] [CrossRef]
- Xu, C.; Hu, S.; Xiang, J.; Zhang, L.; Sun, L.; Shuai, C.; Chen, Q.; He, L.; Edreis, E.M.A. Interaction and kinetic analysis for coal and biomass co-gasification by TG-FTIR. Bioresour. Technol. 2014, 154, 313–321. [Google Scholar] [CrossRef] [PubMed]
- Wu, Z.; Yang, W.; Li, Y.; Zhang, B.; Yang, B. On-line analysis on the interaction between organic compounds from co-pyrolysis of microalgae and low-rank coal: Thermal behavior and kinetic characteristics. Bioresour. Technol. 2018, 268, 672–676. [Google Scholar] [CrossRef]
- Li, S.; Chen, X.; Liu, A.; Wang, L.; Yu, G. Co-pyrolysis characteristic of biomass and bituminous coal. Bioresour. Technol. 2015, 179, 414–420. [Google Scholar] [CrossRef]
- Krerkkaiwan, S.; Fushimi, C.; Tsutsumi, A.; Kuchonthara, P. Synergetic effect during co-pyrolysis/gasification of biomass and sub-bituminous coal. Fuel Processing Technol. 2013, 115, 11–18. [Google Scholar] [CrossRef]
- Zhang, Y.; Zheng, Y.; Yang, M.; Song, Y. Effect of fuel origin on synergy during co-gasification of biomass and coal in CO2. Bioresour. Technol. 2016, 200, 789–794. [Google Scholar] [CrossRef]
- Yang, X.; Liu, X.; Li, R.; Liu, C.; Qing, T.; Yue, X.; Zhang, S. Co-gasification of thermally pretreated wheat straw with Shengli lignite for hydrogen production. Renew. Energy 2018, 117, 501–508. [Google Scholar] [CrossRef]
- Saw, W.L.; Pang, S. Co-gasification of blended lignite and wood pellets in a 100 kW dual fluidised bed steam gasifier: The influence of lignite ratio on producer gas composition and tar content. Fuel 2013, 112, 117–124. [Google Scholar] [CrossRef]
- Cabuk, B.; Duman, G.; Yanik, J.; Olgun, H. Effect of fuel blend composition on hydrogen yield in co-gasification of coal and non-woody biomass. Int. J. Hydrog. Energy 2020, 45, 3435–3443. [Google Scholar] [CrossRef]
- Weiland, N.T.; Means, N.C.; Morreale, B.D. Product distributions from isothermal co-pyrolysis of coal and biomass. Fuel 2012, 94, 563–570. [Google Scholar] [CrossRef]
- Kastanaki, E.; Vamvuka, D.; Grammelis, P.; Kakaras, E. Thermogravimetric studies of the behavior of lignite–biomass blends during devolatilization. Fuel Processing Technol. 2002, 77, 159–166. [Google Scholar] [CrossRef]
- Jong, W.D.; Andries, J.; Hein, K. Coal/biomass co-gasification in a pressurised fluidised bed reactor. Renew. Energy 2014, 16, 1110–1113. [Google Scholar] [CrossRef]
- Chen, G.; Yu, Q.; Rosén, C. Promoted reactivity of char in co-gasification of biomass and coal: Synergies in the thermochemical process. Fuel 1999, 78, 1189–1194. [Google Scholar]
- Li, S.; Chen, X.; Wang, L.; Liu, A.; Yu, G. Co-pyrolysis behaviors of saw dust and Shenfu coal in drop tube furnace and fixed bed reactor. Bioresour. Technol. 2013, 148, 24–29. [Google Scholar] [CrossRef] [PubMed]
- Ellis, N.; Masnadi, M.S.; Roberts, D.G.; Kochanek, M.A.; Ilyushechkin, A.Y. Mineral matter interactions during co-pyrolysis of coal and biomass and their impact on intrinsic char co-gasification reactivity. Chem. Eng. J. 2015, 279, 402–408. [Google Scholar] [CrossRef]
- Yang, P.; Zhao, S.; Zhang, Q.; Hu, J.; Liu, R.; Huang, Z.; Gao, Y. Synergistic effect of the cotton stalk and high-ash coal on gas production during co-pyrolysis/gasification. Bioresour. Technol. 2021, 336, 125336. [Google Scholar] [CrossRef]
- Wu, Z.; Ma, C.; Jiang, Z.; Luo, Z. Structure evolution and gasification characteristic analysis on co-pyrolysis char from lignocellulosic biomass and two ranks of coal: Effect of wheat straw. Fuel 2019, 239, 180–190. [Google Scholar] [CrossRef]
- Wu, Z.; Wang, S.; Luo, Z.; Chen, L.; Meng, H.; Zhao, J. Physico-chemical properties and gasification reactivity of co-pyrolysis char from different rank of coal blended with lignocellulosic biomass: Effects of the cellulose. Bioresour. Technol. 2017, 235, 256–264. [Google Scholar] [CrossRef]
- Li, X.-m.; Zhang, H.; Liu, M.-j.; Zhi, L.-f.; Bai, J.; Bai, Z.-q.; Li, W. Investigation of coal-biomass interaction during co-pyrolysis by char separation and its effect on coal char structure and gasification reactivity with CO2. J. Fuel Chem. Technol. 2020, 48, 897–907. [Google Scholar] [CrossRef]
- Lahijani, P.; Zainal, Z.A.; Mohamed, A.R.; Mohammadi, M. CO2 gasification reactivity of biomass char: Catalytic influence of alkali, alkaline earth and transition metal salts. Bioresour. Technol. 2013, 144, 288–295. [Google Scholar] [CrossRef] [PubMed]
- Mitsuhiro, S.; Yoshihisa, S.; Yukiaki, H. Influence of Coal Characteristics on CO2 Gasification. Fuel 1982, 61, 717–720. [Google Scholar]
- Liu, M.; Bai, J.; Yu, J.; Kong, L.; Bai, Z.; Li, H.; He, C.; Ge, Z.; Cao, X.; Li, W. Correlation between Char Gasification Characteristics at Different Stages and Microstructure of Char by Combining X-ray Diffraction and Raman Spectroscopy. Energy Fuels 2020, 34, 4162–4172. [Google Scholar] [CrossRef]
- Takarada, T.; Tamai, Y.; Tomita, A. Reactivities of 34 coals under steam gasification. Fuel 1985, 64, 1438–1442. [Google Scholar] [CrossRef]
- Liu, M.; Li, X.; Wang, X.; Bai, J.; Kong, L.; Bai, Z.; Li, J.; Li, H.; Xing, L.; Li, W. Insights into the effect of particle size on coal char particle gasification by thermogravimetric analyzer and high temperature stage microscope. Fuel 2022, 313, 123010. [Google Scholar] [CrossRef]
- Yin, Y.; Zhang, J.; Sheng, C. Effect of pyrolysis temperature on the char micro-structure and reactivity of NO reduction. Korean J. Chem. Eng. 2009, 26, 895–901. [Google Scholar] [CrossRef]
- Hu, J.; Shao, J.; Yang, H.; Lin, G.; Chen, Y.; Wang, X.; Zhang, W.; Chen, H. Co-gasification of coal and biomass: Synergy, characterization and reactivity of the residual char. Bioresour. Technol. 2017, 244, 1–7. [Google Scholar] [CrossRef]
- Chen, X.; Liu, L.; Zhang, L.; Zhao, Y.; Xing, C.; Jiao, Z.; Yang, C.; Qiu, P. Effect of active alkali and alkaline earth metals on physicochemical properties and gasification reactivity of co-pyrolysis char from coal blended with corn stalks. Renew. Energy 2021, 171, 1213–1223. [Google Scholar] [CrossRef]
- Wei, J.; Wang, M.; Wang, F.; Song, X.; Yu, G.; Liu, Y.; Vuthaluru, H.; Xu, J.; Xu, Y.; Zhang, H.; et al. A review on reactivity characteristics and synergy behavior of biomass and coal Co-gasification. Int. J. Hydrog. Energy 2021, 46, 17116–17132. [Google Scholar] [CrossRef]
- He, X.; Liu, X.; Nie, B.; Song, D. FTIR and Raman spectroscopy characterization of functional groups in various rank coals. Fuel 2017, 206, 555–563. [Google Scholar] [CrossRef]
- Yu, J.; Guo, Q.; Ding, L.; Gong, Y.; Yu, G. Studying effects of solid structure evolution on gasification reactivity of coal chars by in-situ Raman spectroscopy. Fuel 2020, 270, 117603. [Google Scholar] [CrossRef]
- Yu, J.; Guo, Q.; Gong, Y.; Ding, L.; Wang, J.; Yu, G. A review of the effects of alkali and alkaline earth metal species on biomass gasification. Fuel Processing Technol. 2021, 214, 106723. [Google Scholar] [CrossRef]
- Li, S.; Song, H.; Hu, J.; Yang, H.; Zou, J.; Zhu, Y.; Tang, Z.; Chen, H. CO2 gasification of straw biomass and its correlation with the feedstock characteristics. Fuel 2021, 297, 120780. [Google Scholar] [CrossRef]

Publisher’s Note: MDPI stays neutral with regard to jurisdictional claims in published maps and institutional affiliations. |
© 2022 by the authors. Licensee MDPI, Basel, Switzerland. This article is an open access article distributed under the terms and conditions of the Creative Commons Attribution (CC BY) license (https://creativecommons.org/licenses/by/4.0/).