Article

Design of Experiment (DoE) for Optimization of HPLC Conditions for the Simultaneous Fractionation of Seven α-Amylase/Trypsin Inhibitors from Wheat (Triticum aestivum L.)

by
Sorel Tchewonpi Sagu
1,*,
Gerd Huschek
2,
Tess Waldbach Braga
1,
Michal Rackiewicz
1,
Thomas Homann
1 and
Harshadrai M. Rawel
1,*
1
Institute of Nutritional Science, University of Potsdam, Arthur-Scheunert-Allee 114-116, 14558 Potsdam, Germany
2
IGV-Institut für Getreideverarbeitung GmbH, Arthur-Scheunert-Allee 40/41, 14558 Nuthetal, Germany
*
Authors to whom correspondence should be addressed.
Processes 2022, 10(2), 259; https://doi.org/10.3390/pr10020259
Submission received: 24 November 2021 / Revised: 24 January 2022 / Accepted: 25 January 2022 / Published: 28 January 2022
(This article belongs to the Special Issue Recent Advances in Protein Separation and Purification Methods)

Abstract

:
Wheat alpha-amylase/trypsin inhibitors remain a subject of interest considering the latest findings showing their implication in wheat-related non-celiac sensitivity (NCWS). Understanding their functions in such a disorder is still unclear and for further study, the need for pure ATI molecules is one of the limiting problems. In this work, a simplified approach based on the successive fractionation of ATI extracts by reverse phase and ion exchange chromatography was developed. ATIs were first extracted from wheat flour using a combination of Tris buffer and chloroform/methanol methods. The separation of the extracts on a C18 column generated two main fractions of interest F1 and F2. The response surface methodology with the Doehlert design allowed optimizing the operating parameters of the strong anion exchange chromatography. Finally, the seven major wheat ATIs namely P01083, P17314, P16850, P01085, P16851, P16159, and P83207 were recovered with purity levels (according to the targeted LC-MS/MS analysis) of 98.2 ± 0.7; 98.1 ± 0.8; 97.9 ± 0.5; 95.1 ± 0.8; 98.3 ± 0.4; 96.9 ± 0.5, and 96.2 ± 0.4%, respectively. MALDI-TOF-MS analysis revealed single peaks in each of the pure fractions and the mass analysis yielded deviations of 0.4, 1.9, 0.1, 0.2, 0.2, 0.9, and 0.1% between the theoretical and the determined masses of P01083, P17314, P16850, P01085, P16851, P16159, and P83207, respectively. Overall, the study allowed establishing an efficient purification process of the most important wheat ATIs. This paves the way for further in-depth investigation of the ATIs to gain more knowledge related to their involvement in NCWS disease and to allow the absolute quantification in wheat samples.

1. Introduction

Alpha-amylase/trypsin inhibitors (ATIs) constitute a group of low molecular weight proteins capable of simultaneously inhibiting endogenous α-amylase and the proteinase subtilisin [1]. Recently, they have been reported to be involved in non-celiac wheat sensitivity (NCWS), a type of wheat-related disorder also known as baker’s asthma which is one of the most important occupational allergies in many countries [2,3,4,5,6]. Oda and Schofield [7] and Tatham et al. [6] stated that it is probable for ATIs to be accumulated in the protein portion during grain development, along with gluten proteins. These deposits then break down to form a continuous protein matrix as the grain matures; some of them associate with the surface of the starch granules, which are thus released during dry milling. According to Osborne classification, defining four wheat protein fractions (also referred to as Osborne fractions), ATIs belong to the group of globulins (extracted in dilute salt solution); the other fractions are extracted in water (albumins), alcohol/water mixtures (prolamins), and dilute acid (glutenins) [8,9,10,11]. In their native form, ATIs can be split into three subfamilies, displaying a tetrameric, dimeric, and monomeric structure, with apparent molecular weights of 60, 24, and 12 kDa, respectively [12]. On the other hand, the family of ATIs consisting of tetrameric proteins (CM1, CM2, CM3, CM16, and CM17) is often referred to as chloroform–methanol (CM) proteins, given their selective extraction in chloroform/methanol mixtures. The dimeric ATIs 0.19 and 0.53 as well as the monomeric ATI 0.28 primarily inhibit the amylase activity only [13]. All these variants differ in their spectrum of activity [6,14].
In the last few years, several studies have focused specifically on the identification and quantification of wheat ATIs using a proteomics approach [4,15,16,17]. However, further investigations on the elucidation of the interactions between the enzymes involved (amylase and trypsin) and individual proteins that constitute the group of wheat ATIs, their characterization at the molecular level, as well as the triggering of the allergic reactions are still lacking. A key step in this context is to produce pure fractions of respective ATIs. Very few works have referred to the purification of ATIs, most of the studies being limited to extraction procedures for identification and quantification purposes. To our knowledge, a unique available protocol was reported by Sotkovsky et al. [13] aiming to purify, characterize, and identify the most important water/salt-soluble wheat allergens from natural sources. The three-step strategy consisted of ultrafiltration, native (liquid-phase) isoelectric focusing, and affinity chromatography (HPLC).
The challenge of purifying ATIs lies in the fact that this group of proteins presents similar physicochemical properties, with masses in the vicinity of 13 kDa, and substantial similarities in their primary protein chain structure for most of them. Moreover, removing the target protein from all other compounds within the extracted matrix while maintaining both biological activity and chemical integrity is one of the most challenging and problematic issues involved in the purification of proteins [18]. In fact, proteins are molecules with a well-defined three-dimensional structure in aqueous media, with polar and charged amino acid residues on the surface and hydrophobic residues tending to be enclosed inside. These tertiary structures are generally involved in protein biological activities. Fractionating and purifying proteins usually requires the combination of different techniques. Chemical, structural, and functional properties of proteins including size, shape, hydrophobicity, charge, charge distribution, isoelectric point, and solubility association are then typically exploited to separate proteins [19,20].
Among the most commonly applied downstream processing allowing high resolution/yields as well as cost efficiency, high performance liquid chromatography (HPLC) is one of the main methods used. Different types of HPLC classified according to their separation modes are known, including normal phase (NP-HPLC), reversed phase HPLC (RP-HPLC), size exclusion HPLC (SEC), and ion exchange HPLC (IEX-HPLC) [21,22]. Reverse phase chromatography (RP-HPLC) is one of the most widely used techniques for protein separation and is commonly applied for large-scale protein purification. The stationary phase is based on silica gel or a synthetic polymer, bearing hydrophobic ligands which are essentially C4, C8, or C18 alkyl chains [23,24,25]. The protein retention on the column increases with the hydrophobicity of the solutes, the hydrophobicity of the stationary phase surface, and the polarity of the mobile phase [26]. The separation is then ensured by the partitioning process and/or the adsorption phenomenon [21]. Hydrophilic interaction chromatography (HILIC-HPLC) has been significantly assessed and has become more popular. It is generally established that separation occurs through the partitioning process, adsorption phenomenon, and ion-exchange interactions [27,28]. In the NP-HPLC process, the stationary phase presents a higher degree of polarity than the mobile phase, resulting in an elution based on the polarity of the proteins, from the most hydrophobic to the most hydrophilic molecules [21,29,30]. Ion exchange chromatography separates proteins based on their net charge, which is directly related to the number and nature of charged amino acid residues present on the protein as well as the pH of the buffers [31,32]. Anionic and cationic resins of different strengths can be used to adsorb proteins of opposite charge, the regulation of pH to control the polarity, and the amplitude of the charge of the proteins being exploited to selectively adsorb target proteins [31,33]. The use of a salt or pH gradient can be applied to disrupt ionic interactions for elution, and salt-mediated pH gradients (combining the two complementary elution mechanisms) has also emerged as a valuable tool for improving separation efficiency [34,35,36]. Mixed-mode chromatography (MMC) in which several modes of interaction occur between the stationary and mobile phases has been suggested to improve fractionation procedures [37,38,39]. In contrast to RP, NP, and IEX chromatography, where prominent interaction patterns are hydrophobic, hydrophilic and ionic, mixed mode chromatography relies on a combination of two or more of these interaction patterns [40,41].
The aim of this work was to develop a simple and efficient procedure for fractionation and purification of the most abundant wheat ATIs. One of the main necessities arises due to lack of proper calibration standards for their absolute quantification. The approach consisted of successively applying ATI extracts on a reverse phase and then an ion exchange column for their purification. The design of the experiment was used to optimize the chromatographic parameters, while analysis including SDS PAGE, MALDI-TOF-MS, and LC-MS/MS were performed to monitor the fractionation process and to assess the purity level. The Doehlert design was chosen as it offers many advantages compared to other designs such as the highest efficiency and the lowest number of experiments needed to complete the optimization process. Moreover, each variable is studied at a different number of levels [42]. The Doehlert design describes a circular domain for two variables and a spherical domain for three variables, increasing the uniformity of the parameters [43].

2. Materials and Methods

2.1. Materials

2.1.1. Experimental Material

German wheat cultivar Elixer (Triticum aestivum L.) from the 2019 harvest project and kindly provided by the IGV-Institut für Getreideverarbeitung GmbH, Nuthetal (Germany) was used for the extraction and fractionation of the ATIs.

2.1.2. Standards and Chemicals

Bovine serum albumin (BSA) used as standards for the determination of protein content was obtained from Sigma-Aldrich Chemie GmbH, Steinheim (Germany). Trypsin crystalline, proteomics grade (EC 3.4.21.4) used for protein digestion was provided by Amresco, Inc., Solon, OH, USA. Dihydroxyacetophenone (DHAP) used as matrix for MALDI mass spectrometry analysis of fractionated ATIs was obtained from Alfa Aesar, Heysham, England. Ammonium bicarbonate and Tris-(hydroxymethyl)-amino methane were purchased from Carl Roth GmbH + Co. KG, Karlsruhe, Germany. Chloroform, methanol, and acetonitrile were procured from Sigma-Aldrich Chemie GmbH, Steinheim, Germany. Chemicals listed above as well as all the other chemicals used in this work were of analytical grade.

2.2. Extraction of Wheat α-Amylase/Trypsin Inhibitors

An improvement of the extraction process combining sequentially the ammonium bicarbonate buffer extraction [44,45] and the chloroform/methanol solvent mixture extraction [8,46] was applied. Briefly, samples were first defatted by applying 1 mL of petroleum ether to 100 mg of wheat flour in 2 mL microtubes. After shaking at 60 rpm for 10 min, the mixture was centrifuged (centrifuge 5415R, Eppendorf AG, Hamburg, Germany), the supernatant discarded, and the precipitates were air-dried under a hood for about 20 min. One milliliter of the extraction buffer (100 mM ammonium bicarbonate) was then added and the extraction was performed at room temperature for 60 min under shaking conditions (60 rpm). The mixture was centrifuged (10,000× g for 5 min, 4 °C), the supernatants collected, frozen at −20 °C for about 60 min, then thawed at 4 °C and again centrifuged (10,000× g for another 5 min). The clear supernatant was freeze-dried and 0.5 mL of the chloroform/methanol mixture (2:1, v/v) was added. The whole was vortexed, followed by centrifugation (10,000× g for 5 min, 4 °C) and the supernatants were dried using a centrifugal evaporator (RC10-22, Jouan S.A., Saint-Herblain, France). Finally, the samples were re-dissolved in 25 mM Tris buffer containing 1.67 M of NaCl and after vortex and centrifugation (10,000× g, 4 °C for 5 min), the supernatants constituting the ATI extracts were collected and transferred into new microtubes for further processing.

2.3. ATIs Fractionation and Purification

High performance liquid chromatography (HPLC) was used to finalize the purification of the targeted wheat ATIs by applying successively extracts to a reversed phase and an anion exchange column. A Shimadzu HPLC system (Shimadzu Europa GmbH, Duisburg, Germany) equipped with a degasser (DGU-20A5), two pumps A and B (LC-20AD), an auto sampler (SIL-20AC), a column oven (CTO-20AC), a diode array detector (SPD-M20A), a fraction collector (FRC-10A), and a communication bus module (CBM-20A) was used for this purpose.

2.3.1. Reversed Phase Chromatography

Hydrophobic separation was performed on a PerfectSil 300 ODS C18 column (300 × 4.6 mm, 300 Å, 5 µm; MZ Analysetechnik, Mainz, Germany). The oven temperature was set at 30 °C. A volume of 100 µL of the CM ATI extracts (with protein concentration of 0.4–0.5 mg/mL) was injected in the system and the separation was carried out for a total time of 34 min at a flow rate of 1 mL/min under the gradient condition. The solvent system constituted of bidest water containing 0.1% trifluoroacetic acid (eluent A) and 70% of acetonitrile (eluent B). A preliminary study was first performed in order to check different operating conditions (data not shown). The final elution program used was set as follows: 0.01 to 1.0 min, 0% solvent B; at 10 min of the separation, 40% solvent B; at 26 min of the separation, 55% solvent B; at 27 min of the separation, 100% solvent B; at 28 min of the separation, 100% solvent B; at 29 min, 0% solvent B; at 34 min, 0% solvent B. Detection of proteins was performed by measuring absorption at 280 nm. Figure 1 shows the resulting chromatogram of the C18 fractionation. Different fractions were initially collected and analyzed and accordingly, two fractions containing the proteins of interest were collected, freeze-dried, re-dissolved in distilled water, and then used as input for the ion exchange separation.

2.3.2. Anion-Exchange Chromatography

A strong anion-exchange column (ProPac TM SAX-10, 250 × 4 mm; Thermo Fisher Scientific, Sunnyvale, CA, USA) was used to finalize the purification of the proteins of interest. For this purpose, the separation was performed with a gradient mode using 20 mM of Tris buffer, pH 8.5 as eluent A and 20 mM of Tris buffer containing 0.5 M NaCl, pH 8.5 as eluent B. Both buffers were always prepared freshly. The detection wavelength was 280 nm. Different strategies were applied for each of the two fractions previously selected and collected from the reverse phase separation. The protein concentrations of both fractions were around 0.5 mg/mL.
(a) For fraction F2, 100 µL of sample were injected in the system and the separation was performed for 17 min under gradient conditions as follows: from 0.01 to 1.0 min, 0% solvent B; at 10 min of the separation, 5% solvent B; at 11 min of the separation, 80% solvent B; at 12 min, 80% solvent B; at 13 min, 0% solvent B; at 17 min, 0% solvent B. The different fractions where collected, freeze-dried, and re-dissolved in HPLC grade water for further analysis.
(b) The response surface methodology (RSM) with the Doehlert design was employed to optimize the separation of the fraction F1 containing a large number of proteins. A total separation time of 17 min was set. To this end, three parameters, including flow rate, gradient, and column temperature were selected for the optimization. The experimental domain was set (according to a preliminary study performed—data not shown) as follows: Flow rate, 0.4–1.2 mL/min; gradient, 0.1–0.5% eluent B/min; and column temperature, 30–40 °C. The coded values given by the Doehlert design were converted into the corresponding real values according to Equation (1). Table 1 summarizes the experimental design. A total of 17 experiments were performed with four replications at the central point.
X = Xi + ∆ Xi × xi
where X is the real variable, xi coded variable given by the Doehlert design, Xi the centre of variation range, and ∆ Xi the increment.
The retention factor of the first eluted peak (RTP1), the resolution between the critical pair peaks F1-3 and F1-4 (∆tCR), and the resolution factor (RF) indicating the ratio between the separation time of the first and the last eluted peaks and the total separation time were used as experimental responses to assess the quality of the chromatographic separation. Mathematical models of second order polynomial type with interaction between factors as presented in Equation (2) were used to predict the effects of the different factors on the experimental responses, and furthermore to perform the numerical optimization.
Y = δ0 + ΣαiXi + ΣβiiXiXi + ΣγijXiXj
where Y is the experimental response, Xi and Xj the levels of variables, δ0 the constant term, αi the coefficients of the linear terms, βii the coefficients of the quadratic terms, and γij the coefficients of the interactions terms.

2.4. Characterization of the Extracted and Purified Targeted Proteins

A broad range of analysis was performed in order to identify and determine the purity of the proteins in each of the fractions. This includes the determination of protein content, SDS PAGE, matrix-assisted lasers desorption/ionization time-of-flight mass spectrometry (MALDI-TOF-MS), as well as targeted LC-MS/MS.

2.4.1. Protein Content

Protein content was determined using the method by Lowry et al. [47] with bovine serum albumin as standard.

2.4.2. SDS PAGE

Electrophoresis of extracted and fractionated ATIs was performed according to Laemmli [48] under reducing and denaturing conditions using a 12% Invitrogen NuPAGE Bis-Tris precast gels (Thermo Fisher Scientific, Carlsbad, CA, USA). Samples were initially mixed with the sample buffer (containing glycerol, 2-mercaptoethanol, SDS and Coomassie blue G250, pH 8.4) at a ratio of 1:1 (v/v) and heated for five min at 95 °C. Twenty microliters of the mixtures and 5 µL of the protein ladder (broad range Page Ruler Plus marker, Thermo Fisher Scientific, Carlsbad, CA, USA) were loaded onto the gel and separation was carried out at a constant currant (50 mA per gel) for approx. 90 min. After staining overnight with the Coomassie Brilliant Blue R-250 solution, the gels were destained for 2 to 3 h in a solution of 10% acetic acid. The gels were finally scanned using a Bio-500 Professional VIS Gel Scanner (SERVA Electrophoresis GmbH, Heidelberg, Germany) and analyzed with ImageLab software (Bio-Rad Laboratories Ltd., Hemel Hempstead, UK).

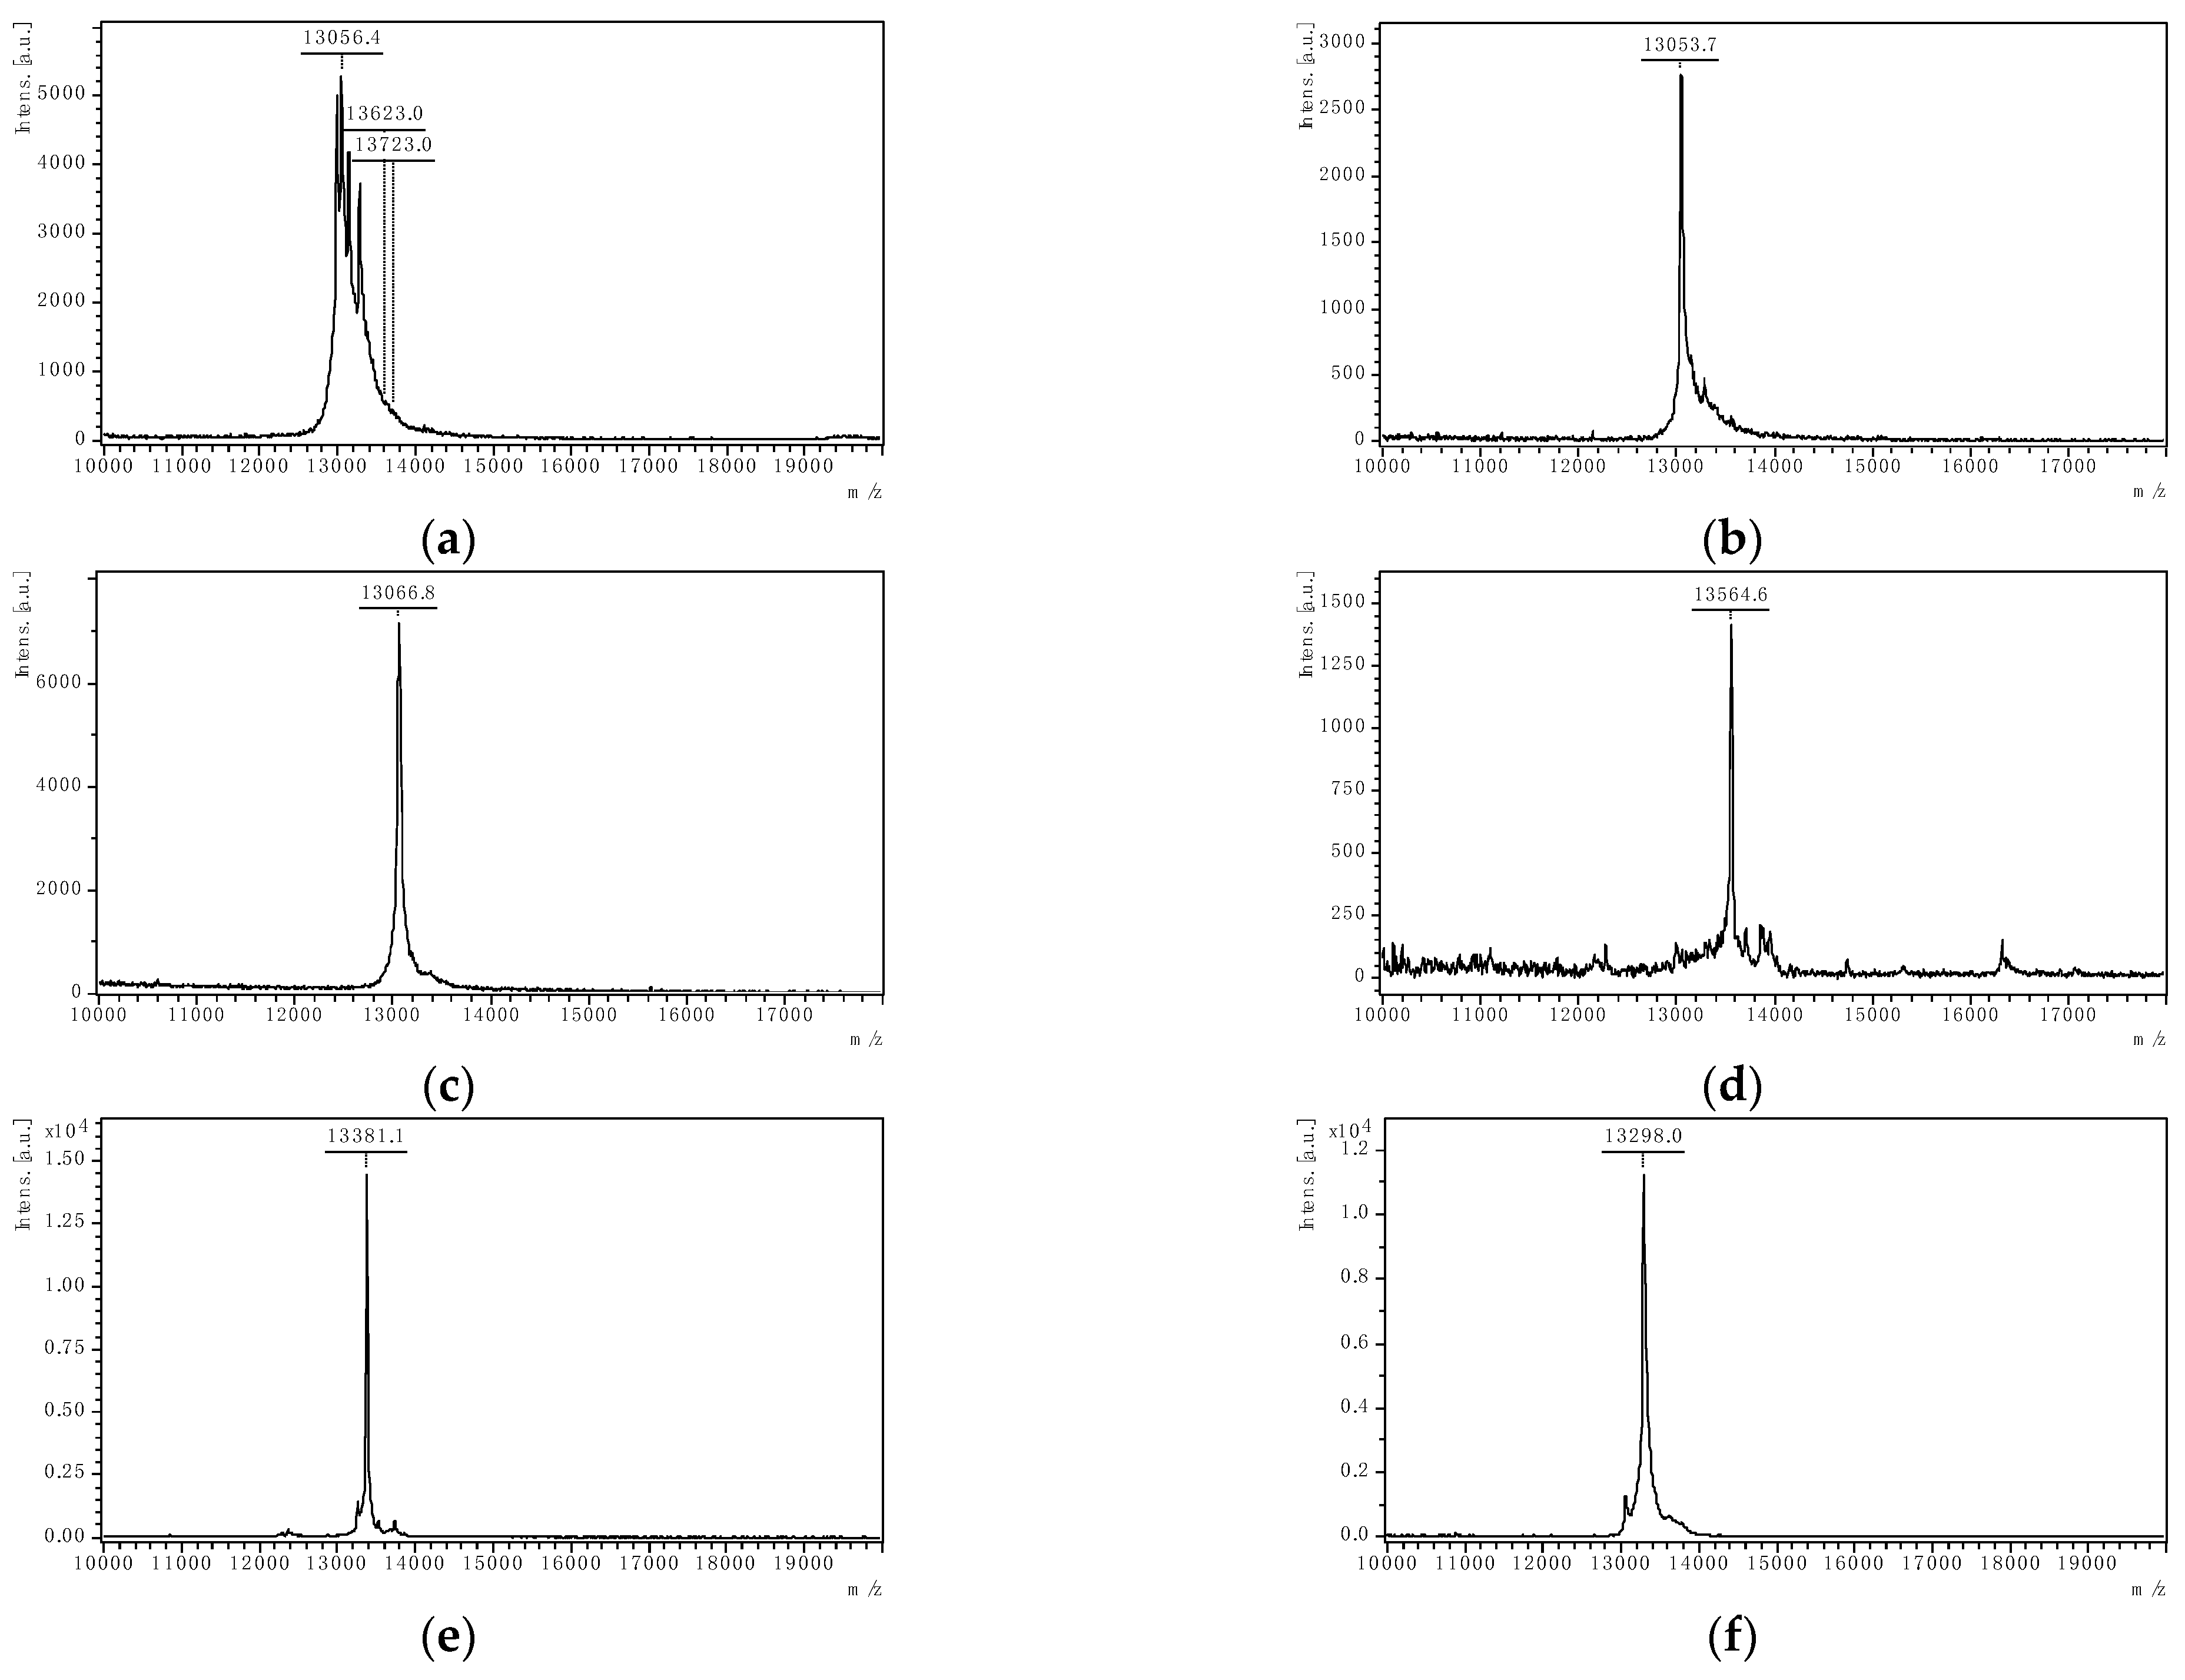
2.4.3. MALDI-TOF Mass Spectrometry Analysis

MALDI-TOF-MS was performed in order to identify the mole masses of proteins and to check the purity of the fraction. The matrix was prepared by mixing 7.6 mg of 2,5-Dihydroxy acteto-phenone (2,5-DHAP) with 375 µL of ethanol and 125 µL of 18 mg/mL di-ammonium hydrogen citrate. Samples (2 µL) were mixed with 2 µL of 2% trifluoroacetic acid and 2 µL of the matrix solution. The mixture was pipetted up and down until crystallization started. One to two drops of the crystal suspension were spotted onto a ground steel target (MTP target frame III, Bruker Daltonik GmbH, Bremen, Germany). After being allowed to dry at room temperature, measurements were carried out with an Autoflex Speed LRF equipped with a Smart beam-Laser 200 (Bruker Daltonik GmbH, Bremen, Germany). Internal standard containing a mixture of six proteins (insulin [M + H]+, 5734.52 Da; cytochrome C [M + 2H]2+, 6181.05 Da; Myoglobin [M + 2H]2+, 8476.66 Da; ubiquitin I [M + H]+, 8565.76 Da; Cytochrom C [M + H]+, 12360.97 Da and myoglobin [M + H]+, 16952.31 Da) was used to calibrate the instrument. The spectra were analyzed using the Bruker Daltonics FlexAnalysis software, Version 3.3 (Bruker Daltonik GmbH, Bremen, Germany).

2.4.4. Targeted LC–MS/MS

Targeted tandem mass spectrometry was used to identify the purified proteins and to allocate the purity level. Sample preparation consisted of protein reduction using tris(2-carboxyethyl)phosphine (TECP) followed by alkylation with iodoacetamide (IAA). The digestion buffer (100 mM of ammonium bicarbonate), and the proteomics grade trypsin solution were then added to the mixture (ratio of approximately 20:1, protein/enzyme) and the digestion was performed for 20 h at 37 °C. A solution of 40% formic acid was used to stop the digestion. The samples were filled into the vials for the analysis while the solid phase extraction (SPE) was applied as previously described [49] to the digested crude extract prior to the analysis.
The multiple reaction monitoring (MRM) method previously established [8] was used with some modifications for this purpose. The analysis were performed on an Agilent Infinity 1260 liquid chromatography system equipped with a binary pump, a multi-column thermostat, a VL vial sampler; coupled with an Agilent G6470A Series Triple Quad HPLC/MS mass spectrometer (Agilent Technologies Sales and Services GmbH and Co. KG, Waldbronn, Germany). Briefly, the sequences of the 14 reviewed wheat ATIs available from the online database UniProt (UniProtKB; https://www.uniprot.org; accessed on 6 October 2021) were downloaded as FASTA file and imported into the Skyline software (MacCoss Lab Software, version 20.2, University of Washington, Seattle, WA, USA). The sequences were theoretically digested using trypsin as enzyme, with zero missed cleavage and filtering peptides between 5 and 30 amino acids in length. Carbamidomethylation of cysteine residues was labeled as structural modification and the following criteria were set: precursor charge 2, 3; ionic charge 1; and y and b ion types. Three to four transitions with the highest signal intensity were selected per peptide and one biomarker peptide (quantifier) and as well as two additional peptides (qualifiers) were selected for each ATI [8]. Biomarkers previously selected were grouped in a single method and exclusively used for the analysis. The injection valve of autosampler was set without bypass for delay volume reduction and the separation was performed on a Kinetex C8 column (150 × 4.6 mm, 2.6 µm, Phenomenex, Torrance, CA, USA). Column temperature and flow rate were set at 30 °C and 0.5 mL/min, respectively. For each analysis, 10 µL of analyte solutions were injected in the system and the elution was performed in gradient mode using 0.1% formic acid (solvent A) and 100% acetonitrile (solvent B). The final elution program lasted 28 min as follows: 0% acetonitrile for 0–1 min, 50% acetonitrile at 18 min, 95% acetonitrile at 19–22 min, and then 0% acetonitrile from 23–28 min. The column was re-equilibrated for 4 min under 100% solvent A (postrun step). Analysis (MS detection) were conducted in positive mode electrospray ionization (ESI) with nitrogen as desolvation gas at 275 °C, a flow rate of 11.0 L/min, a capillary voltage of 4000 V in positive modus, and a nebulizer pressure of 35.0 psi.

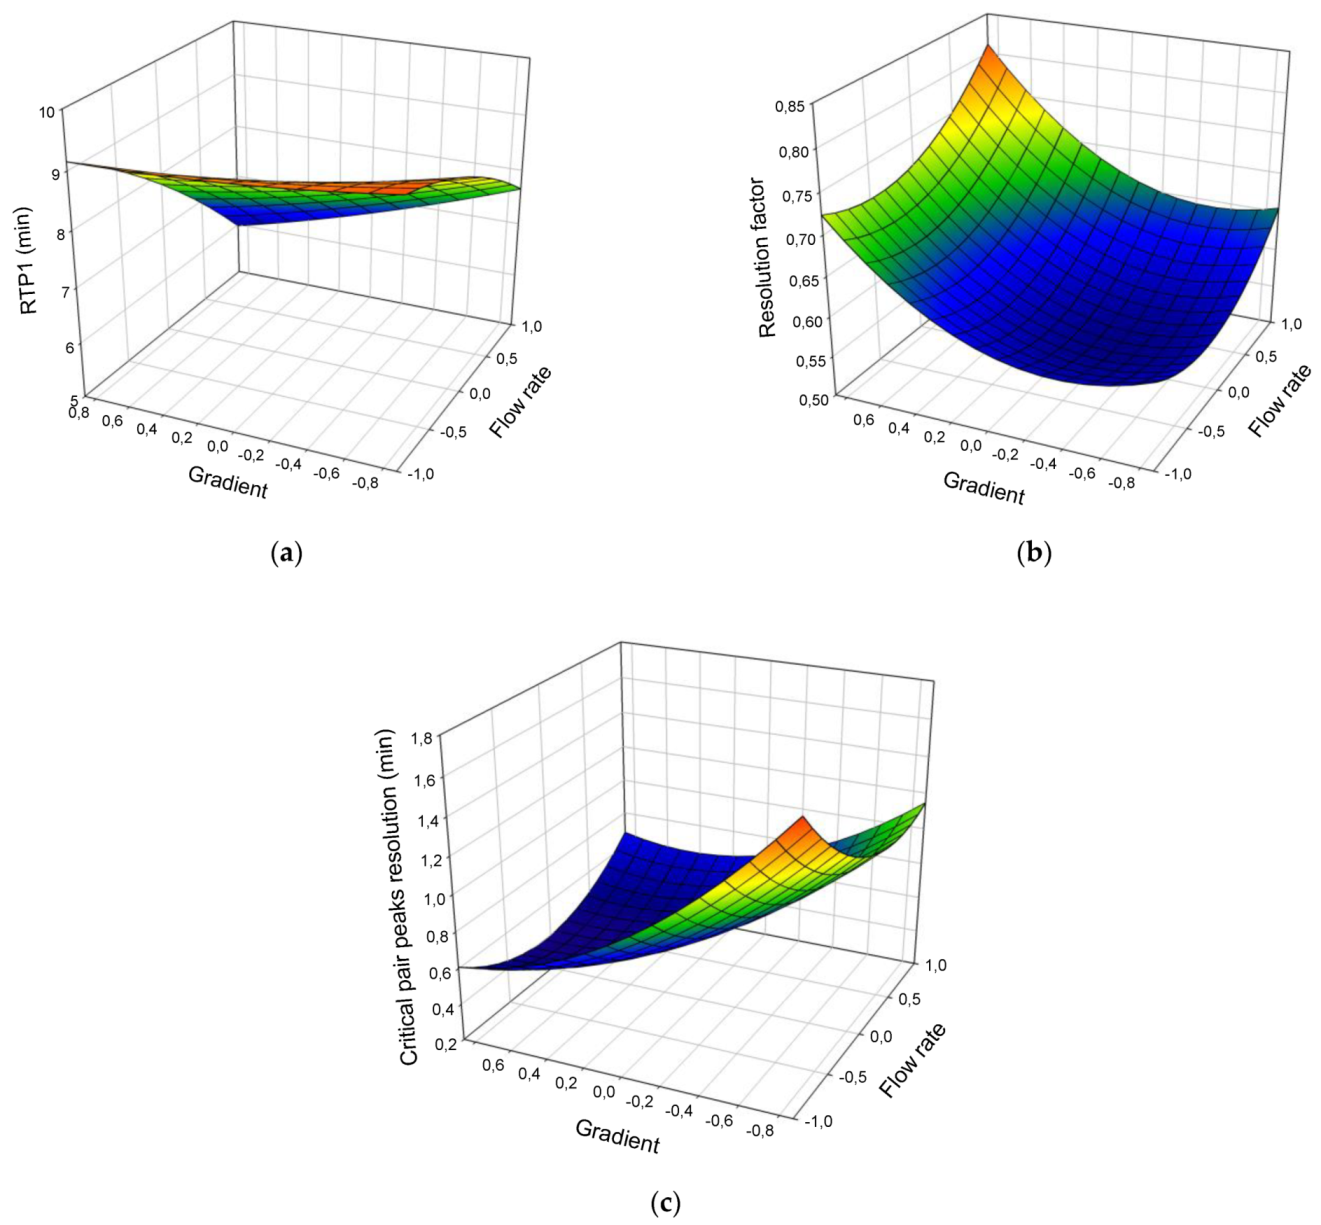
2.5. Statistical Analysis

All experiments were performed in three independent replicates and data were reported as mean ± standard deviation. Mathematical models from the Doehlert design were examined using STATGRAPHICS Centurion XIX software (Statgraphics Technologies, Inc., The Plains, VA, USA). The models were validated using coefficient of determination R2 as well as the Bias factor ( B F ) and the Accuracy factor ( A F ), as described in Equations (3) and (4), respectively [42,50,51]. They were then used to represent the response surfaces describing the individual and interaction effects of the factors on the experimental responses (using SigmaPlot Version 11.0, Systat Software, Inc., San Jose, CA, USA).
B F = 10   ( l o g ( Y i , c a l Y i , e x p ) / N )
A F = 10   ( | l o g ( Y i , c a l Y i , e x p ) | / N )
where, Y i , e x p is the experimental response, Y i , c a l the calculated response, and N the number of experiments.

3. Results and Discussion

3.1. ATIs Extraction and Quantification

ATIs were extracted from the German wheat cultivar Elixer according to the optimized method combining the ammonium bicarbonate buffer extraction and the chloroform/methanol solvent mixture extraction. Prior to the HPLC fractionation, the extracts were first analyzed by LC-MS and the composition as well as proportion of each individual ATI was investigated. The peak areas values were used for the calculation and the results expressed as percent are presented in Table 2. The most abundant ATIs were found to be P01083 (23.7 ± 0.3%), P17314 (18.3 ± 0.5%), P16851 (13.4 ± 0.1%), P16159 (12.1 ± 0.5%), P01085 (8.4 ± 0.1%), P83207 (6.7 ± 0.1%), and P16850 (6.5 ± 0.0%), respectively. The seven molecules together accounted for almost 90% of the total ATIs in the extract. The remaining seven ATIs accounted for only about 10%.
These results are consistent with those presented in previous work where more than 20 different wheat cultivars were screened [44]. Based on two-dimensional electrophoresis analysis followed by immunoblotting and mass spectrometry analysis, Zoccatelli et al. [12] also identified proteins 0.19 (P01085) and 0.28 (P01083) as two of the major ATIs in salt-soluble protein fractions using 53 different wheat types. Similarly, Rogniaux et al. [16] evaluated the allergen relative abundance in several wheat varieties and identified proteins 0.28, 0.19, CM1, CM2, and CM3 as the most predominant ATIs. Altenbach et al. [2] investigated the spectrum of low molecular weight α-amylase/protease inhibitor genes from milled white flour from wheat cultivar Butte 86 by tandem mass spectrometry (MS/MS). They found that monomeric P01083 and tetrameric subunits of CM2 (P16851), CM3 (P17314), and CM16 (P16159) were accumulated to the highest levels in flour. Moreover, the CM3 protein (P17314) was identified as an allergen involved in baker’s asthma and was quantified from 18 durum wheat samples (content ranging from 0.22 to 1.10 mg/g) [15].
Considering the objective of this work and in view of these results obtained, ATIs P01083, P17314, P16850, P01085, P16851, P16159, and P83207 were selected as target molecules for the purification process.

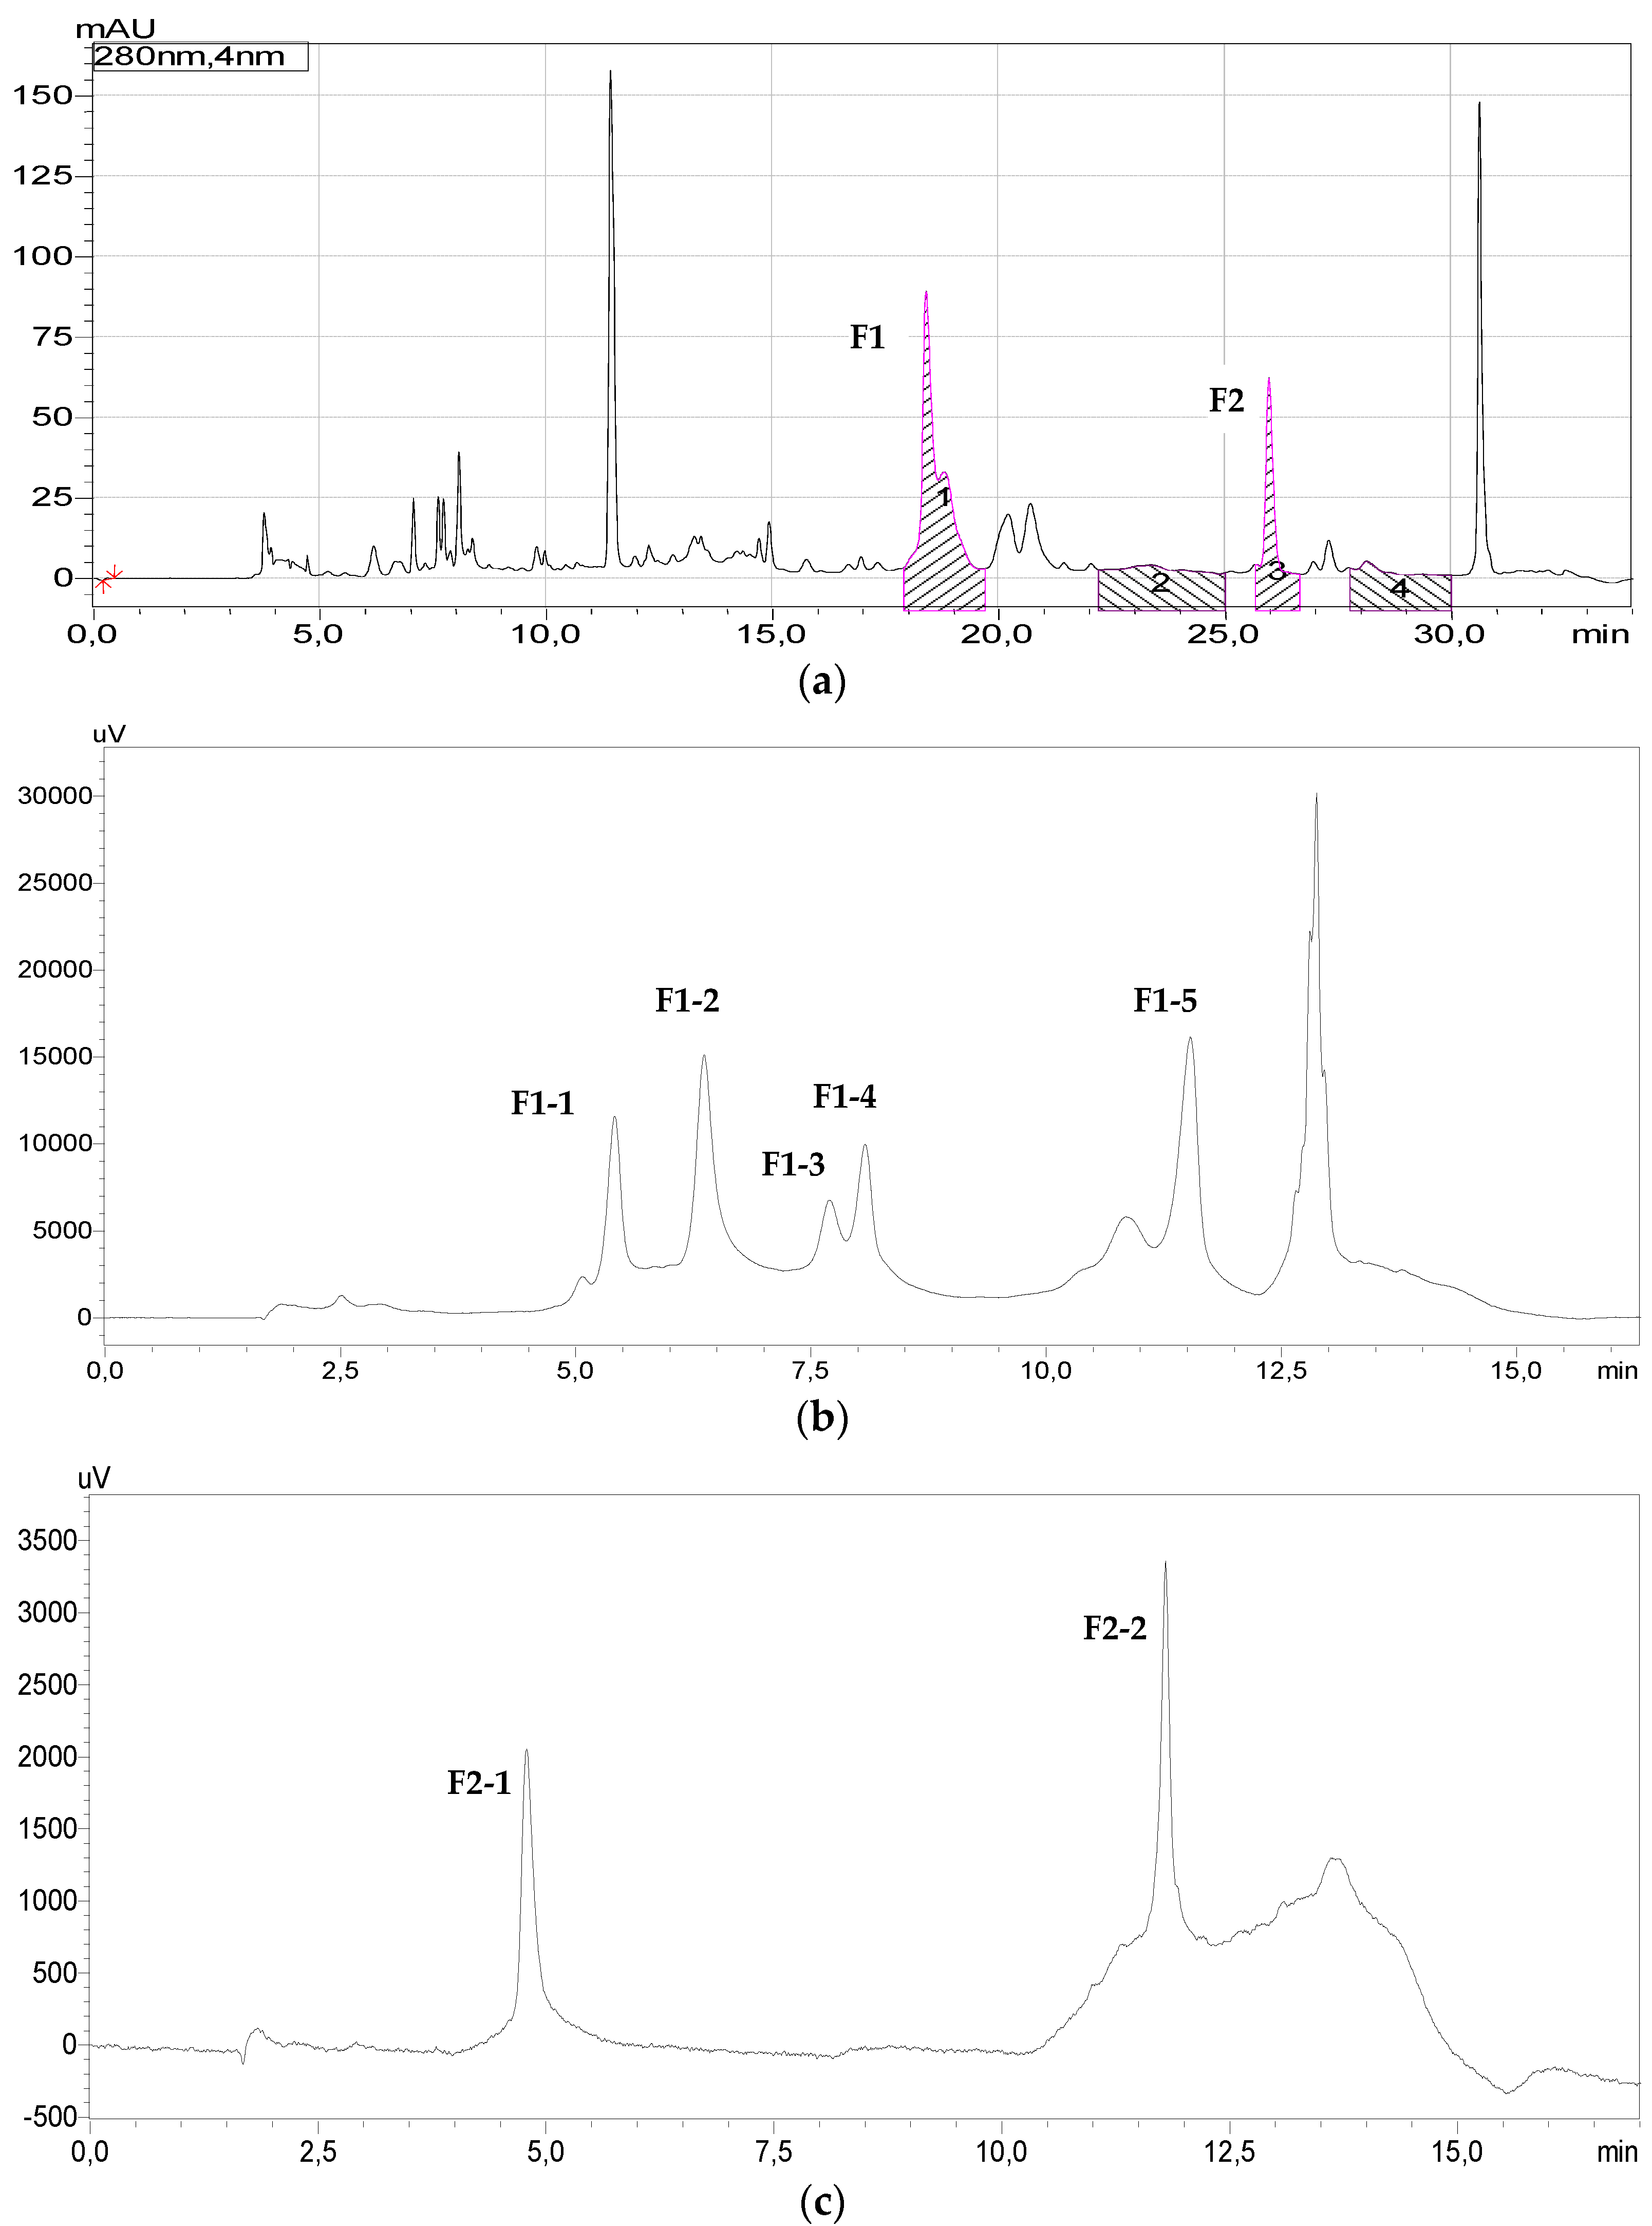
3.2. Reverse Phase Chromatography

Figure 1a shows the HPLC fractionation pattern of the separation of ATI extracts by reverse phase chromatography. The online database Uniprot reports 143,269 different proteins/peptides (including 379 reviewed) constituting the proteome of wheat (Triticumaestivum). In other words, if the extraction method itself here was specifically designed to yield essentially ATIs molecules, it is clear that many other proteins with similar physico-chemical properties could have been extracted simultaneously. Accordingly, this first separation generated many peaks.
Different fractions from the RP-HPLC were collected and the targeted LC-MS/MS analysis was performed to determine in which fractions the proteins of interest were contained. Two main peaks were finally selected, including Peak F1 (between retention time of 18 and 19.5 min) and peak F2 (between retention time of 25.8 and 26.5 min) (Figure 1a). The F1 fraction was found to contain 33.0 ± 1.7; 20.0 ± 0.1; 16.0 ± 0.3; 12.3 ± 0.5, and 9.5 ± 0.1% of proteins P01083, P16851, P16159, P01085, and P16850, respectively (Table 2), while F2 fraction contained essentially 74.8 ± 1.3% of P17314 and 15.9 ± 0.9% of P83207.
Interestingly, it is particularly captivating to see that the F1 fraction was found to contain a specific group of ATIs. Several attempts to improve the separation of these molecules by reverse phase chromatography were carried out. Different types of hydrophobic columns including C8/C18 stationary phase column with different lengths and pore size, as well as different separation gradients were tested (data not shown). However, it was not possible to obtain a better separation of these molecules by RP-HPLC. The five ATIs identified in the above fraction have similar molecular weights around 13 kDa. Correspondingly, the SDS PAGE analysis showed the presence of a large band within this molecular weight range (Figure 2).
In reverse phase chromatography, hydrophobic interactions are the dominant interaction modes. The more hydrophilic a molecule is, the less it is retained in the C18 column, and is therefore eluted from the column with the hydrophilic solvent during the first minute of the separation. On the other hand, the more hydrophobic a molecule is, the higher the interactions with the stationary phase are (silica gel or polymers with specific functional groups such as alkyl chain C18) [11,30]. It is then necessary to reach a high proportion of hydrophobic eluent to carry them away and elute them from the column. In the present case, the two fractions F1 and F2 collected were eluted at 35 to 45% of acetonitrile (hydrophobic eluent).
Therefore, a large number of RP-HPLC runs were necessary to collect enough samples from both peaks. The two fraction samples were freeze-dried, then re-dissolved with distilled water, and used as input for the next fractionation step using ion exchange chromatography.

3.3. Ion Exchange Chromatography

Two distinct approaches were used to finalize the purification of ATIs from each of the F1 and F2 fractions by ion exchange chromatography. The F2 fraction containing two ATIs was separated within 17 min under the gradient mode while design of experiment and response surface methodology was employed in order to optimize the separation conditions of the fraction F1. The separation of both fractions was carried out using a strong anion exchange column.

3.3.1. Ion Exchange Separation of Fraction of F2

The fraction F2 obtained from reverse phase chromatography and containing initially two ATIs was applied to the strong anion exchange chromatography for the final purification of both proteins contained in this fraction. Figure 1c presents the chromatogram of the separation. Two peaks were obtained. These two proteins which were eluted together in the same fraction with RP-HPLC were consequently successfully separated on an ion-exchange column, due to the significant differential total charge of the both proteins with theoretical isoelectric points (pI) of 7.42 and 6.66 for P83207 and P17314 molecules, respectively.
Both fractions F2-1 and F2-2 were collected and analyzed for the protein identification. ATI P83207 was found to be the major protein in the fraction F2-1 while fraction F2-2 contained ATI P17314 (Table 2). Purity degrees of 96.2 ± 0.4 and 98.1 ± 0.8% were achieved for proteins P83207 and P17314, respectively. MALDI-TOF-MS analysis was performed and both fractions showed a single peak on the spectra (Figure 3). These results confirmed those obtained from targeted analysis. Moreover, the masses of the two molecules (12,935 and 15,524 m/z; with z = 1) were found to be similar to the theoretical masses of the proteins P83207 (12,943 Da) and P17314 (15,832 Da), respectively (Table 3). Finally, the visualization of the samples collected from fractions F2-1 and F2-2 revealed unique bands on the electrophoresis gel in the range of 13 and 15 kDa (Figure 2).

3.3.2. Ion Exchange Chromatography of Fraction F1

The strategy employed here was to use the Doehlert design to optimize the fractionation of F1 by ion exchange chromatography, as this fraction contained a set of proteins with similar masses and chemical properties, making the purification more complex. The separation mechanism in ion exchange chromatography involves an electrostatic attraction between the proteins to be separated and the functional groups of the stationary phase, which have opposite charges [52]. With anion exchange chromatography (which was the case in this work), the positive functional groups have affinities for negatively charged proteins at basic pH. There are several parameters affecting the separation process. After a preliminary study (data not shown), three of these parameters were considered for the optimization approach: flow rate, separation gradient, and oven temperature, generating 17 experiments including four replicates at the center of the experimental domain.
Experiments were performed and a statistical analysis was conducted. In addition to the coefficient of determination R2, the bias factor and the accuracy factor were also calculated to support the mathematical models describing the interaction between the variables and the experimental responses. Accordingly, coefficients of determination of 0.93, 0.98, and 0.96 were obtained for RTP1, ∆tCR and RF, respectively (Table 4). These R2 values indicate that all these suggested mathematical models were found to be able to explain more than 93% of the experimental observations in terms of operating variables. BF and AF values of 1.00, 1.00, and 1.00; 1.02, 1.05, and 1.02 were achieved for RTP1, ∆tCR and RF, respectively. These two factors provide a quantitative measure of the relative deviations between the predicted responses from the mathematical models and those obtained experimentally. Values of the bias factor and the precision factor equal to one suggest a perfect balance between the observed and predicted responses [42]. In view of the values obtained, all the proposed models are highly representative of the interactions between the independent variables and the experimental responses. Accordingly, these models were therefore used to generate the response surfaces and to perform the numerical optimization.
Figure 4 shows the response surface plots illustrating the effects of the three factors on the investigated experimental responses. With the column temperature set at the center of the experimental domain, a decrease in RTP1 with flow rate can be observed at high gradients. Conversely, at low gradients, RTP1 remained almost constant with the variation of flow rate (Figure 4a). Similar effects were observed with respect to gradient. At a flow rate of 0.4 mL/min, RTP1 was found to be constant with gradient changes, while at a flow rate of 1.2 mL/min, a decrease in RTP1 was observed with gradient increases. The ANOVA revealed that these two factors were significantly involved (p < 0.001) and the negative sign of both parameters’ coefficients indicates that the observed effects were clearly negative (Table 4). No significant effect was observed for column temperature.
Figure 4b represents the response surface showing the effect of the different parameters on the resolution factor. Here, there is an increase in term of the resolution factor with the gradient and the flow rate increase, the column temperature being fixed in the center of the experimental domain. The interaction between these two parameters shows a strong effect on the experimental response. It can be observed that increasing the gradient and the flow rate at the same time led to a better resolution of the separation. The statistical analysis revealed that these two parameters, as well as their interaction, had significant effects on this experimental response (p < 0.001). These effects were all positive given the positive sign of their coefficients (Table 4).
Finally, it can be observed that the ∆tCR was mainly affected by the linear terms of flow rate (p < 0.01) and gradient (p < 0.001), the quadratic terms of all three factors (p < 0.01) as well as the interaction between the flow rate and the column temperature (p < 0.05) (Table 4). Figure 4c displays the response surfaces showing the effect of the variables on ∆tCR. A decrease in ∆tCR with gradient is observed, reaching its lowest level (0.6 min) at a gradient of 0.5% eluent B/min. Furthermore, a decrease in ∆tCR is observed up to a flow rate of about 0.8 mL/min, followed by an increase with a further gradual flow rate increment up to 1.2 mL/min (Figure 4c).
Multi-response numerical optimization was performed to determine the best combination of factors that simultaneously optimize the three experimental responses while maximizing a desirability function. Specifically, the objectives were to minimize the retention time of the first eluted peak, and to maximize the resolution between the critical pair peaks as well as the resolution factor.
The highest desirability achieved was thus 0.88. The combination of factors for which the optimum is reached was 0.8 mL/min, 0.35% eluent B/min and 30 °C for the flow rate, gradient and column temperature, respectively. The corresponding response values were 5.2 min, 0.69 min, and 0.81 for the retention time of the first eluted peak, the resolution between the critical pair peaks and the resolution factor, respectively. Fractionation was accordingly performed at these optimal conditions and the analysis were carried out in order to confirm the results obtained numerically. Values of 5.1 min, 0.71 min, and 0.80 were achieved for RTP1, ∆tCR, and RF, respectively. The fractionation was then performed at these conditions and five different peaks F1-1, F1-2, F1-3, F1-4, and F1-5 (see Figure 1b) were collected. The different analyses were then conducted to identify and characterize the content of the different fractions collected.
The collected samples were digested with trypsin and ATIs were identified through targeted LC-MS/MS analysis. The results are reported in Table 2. It is noteworthy that all five fractions collected showed different types of ATIs with purity levels higher than 95%. For instance, proteins P01085, P16159, P161851, P16850, and P01083 were identified in fractions F1-1, F1-2, F1-3, F1-4, and F1-5, with purity levels of 95.1 ± 0.8; 96.9 ± 0.5; 98.3 ± 0.4; 97.9 ± 0.5, and 98.2 ± 0.7%, respectively. The achieved high purities demonstrate the effectiveness of the applied procedure to efficiently fractionate low molecular weight proteins with similar physiochemical properties.
In order to consolidate the results obtained from the targeted analysis (LC-MS), the MALDI-TOF-MS analysis was performed in order to determine the compositions and intact masses of proteins from the different fractions. While the high resolution mass spectrometry method only targeted the 14 reviewed wheat ATIs officially listed in the Uniprot KB online database, the untargeted MALDI-TOF-MS analysis allowed for an accurate assessment of the existence of additional potential protein in the fractions. Figure 5 shows the spectra acquired. At least two observations can be made: The first is that only one peak was detected in each sample, showing that each of the analyzed fractions contained only one protein, confirming purity levels measured using targeted analysis.
Secondly, the theoretical masses of the identified ATIs were compared to the masses of the peaks from the MALDI-TOF-MS spectra. The results are reported in Table 3. Masses of 13,298, 13,565, 13,054, 13,067, and 13,381 m/z (z = 1) were detected; compared to the theoretical masses of 13,328, 13,437, 13,034, 13,085, and 13,326 Da and corresponding to ATIs P01085, P16159, P161851, P16850, and P01083, respectively. With deviations of 0.2, 0.9, 0.2, 0.1, and 0.4% for P01085, P16159, P161851, P16850, and P01083, respectively, it is clear that these results are in agreement with those obtained from the targeted analysis.
Finally, the samples collected from the different fractions were analyzed by SDS PAGE and the results are shown in Figure 2. No additional bands in the fraction samples suggest a high degree of purity of the collected samples, again demonstrating the effectiveness of the applied separation methods.

4. Conclusions

The aim of this work was to fractionate and purify the most important wheat ATIs. After extracting ATIs using the Tris buffer method combined with the CM method, RP-HPLC followed by ion exchange chromatography were applied to accomplish the purification. The RP-HPLC on a C18 column yielded two different peaks containing the molecules of interests, which were collected. Subsequent optimization of the ion exchange chromatography established optimal conditions that purify the F1 fraction into five different ATIs, while sample F2 was further fractionated into two clear different fractions. Using Targeted LC-MS/MS analysis, the seven most abundant wheat ATIs were identified in the final fractions with high purity degrees, including P01083, P17314, P16850, P01085, P16851, P16159, and P83207. Complementary analysis (MALDI-TOF-MS and SDS-PAGE) corroborated these results and the masses of the purified proteins were found to be close to the corresponding theoretical masses of the seven targeted ATIs. Preliminary experiments showed that the biological properties are retained while applying the fractionation procedure to purify the ATIs such as the inhibitory effect on α-amylase activity. Data of these further experiments are subject of our further work and will be presented in due time. Finally, the results obtained in this work are very promising and will allow continuing the in-depth investigation of this group of proteins of interest, especially at the molecular level. We also intend to apply the resulting pure proteins as calibration standards to conduct studies on the absolute quantification of ATIs in a wide range of wheat cultivars.

Author Contributions

Conceptualization, S.T.S., H.M.R. and G.H.; methodology, S.T.S., H.M.R. and G.H.; software, S.T.S.; formal analysis, S.T.S.; investigation, S.T.S. and H.M.R.; resources, T.W.B., M.R. and T.H.; data curation, S.T.S., T.W.B., M.R. and T.H.; writing—original draft preparation, S.T.S.; writing—review and editing, H.M.R., S.T.S., G.H., T.H., T.W.B. and M.R.; supervision, H.M.R. and G.H.; project administration, S.T.S.; funding acquisition, S.T.S. and H.M.R. All authors have read and agreed to the published version of the manuscript.

Funding

The author Sorel Tchewonpi Sagu was funded by the Alexander von Humboldt Foundation; under the Georg Forster Research Fellowship (Ref 3.4-CMR-1164093-GF-P).

Acknowledgments

We acknowledge the support of the Deutsche Forschungsgemeinschaft and Open Access Publishing Fund of University of Potsdam.

Conflicts of Interest

The authors declare no conflict of interest.

References

  1. Mundy, J.; Hejgaard, J.; Svendsen, I. Characterization of a bifunctional wheat inhibitor of endogenous α-amylase and subtilisin. FEBS Lett. 1984, 167, 210–214. [Google Scholar] [CrossRef] [Green Version]
  2. Altenbach, S.B.; Vensel, W.H.; Dupont, F.M. The spectrum of low molecular weight alpha-amylase/protease inhibitor genes expressed in the US bread wheat cultivar Butte 86. BMC Res. Notes 2011, 4, 242. [Google Scholar] [CrossRef] [PubMed] [Green Version]
  3. Junker, Y.; Zeissig, S.; Kim, S.J.; Barisani, D.; Wieser, H.; Leffler, D.A.; Zevallos, V.; Libermann, T.A.; Dillon, S.; Freitag, T.L.; et al. Wheat amylase trypsin inhibitors drive intestinal inflammation via activation of toll-like receptor 4. J. Exp. Med. 2012, 209, 2395–2408. [Google Scholar] [CrossRef] [PubMed]
  4. Zevallos, V.F.; Raker, V.; Tenzer, S.; Jimenez-Calvente, C.; Ashfaq-Khan, M.; Russel, N.; Pickert, G.; Schild, H.; Steinbrink, K.; Schuppan, D. Nutritional Wheat Amylase-Trypsin Inhibitors Promote Intestinal Inflammation via Activation of Myeloid Cells. Gastroenterology 2017, 152, 1100–1113 e1112. [Google Scholar] [CrossRef] [PubMed] [Green Version]
  5. Zevallos, V.F.; Raker, V.K.; Maxeiner, J.; Scholtes, P.; Steinbrink, K.; Schuppan, D. Dietary wheat amylase trypsin inhibitors exacerbate murine allergic airway inflammation. Eur. J. Nutr. 2019, 58, 1507–1514. [Google Scholar] [CrossRef]
  6. Tatham, A.S.; Shewry, P.R. Allergens to wheat and related cereals. Clin. Exp. Allergy 2008, 38, 1712–1726. [Google Scholar] [CrossRef]
  7. Oda, S.; Schofield, J.D. Characterisation of Friabilin Polypeptides. J. Cereal Sci. 1997, 26, 29–36. [Google Scholar] [CrossRef]
  8. Sagu, S.T.; Zimmermann, L.; Landgraber, E.; Homann, T.; Huschek, G.; Ozpinar, H.; Schweigert, F.J.; Rawel, H.M. Comprehensive Characterization and Relative Quantification of alpha-Amylase/Trypsin Inhibitors from Wheat Cultivars by Targeted HPLC-MS/MS. Foods 2020, 9, 1448. [Google Scholar] [CrossRef]
  9. Kick, F.; Belitz, H.D.; Wieser, H.; Kieffer, R. Comparative studies of the Osborne protein fraction of wheat varieties with different dough and baking properties. Z. Lebensm. Unters. Forsch. 1992, 195, 437–442. [Google Scholar] [CrossRef]
  10. Kumar, A.; Nayak, R.; Purohit, S.R.; Rao, P.S. Impact of UV-C irradiation on solubility of Osborne protein fractions in wheat flour. Food Hydrocoll. 2021, 110, 105845. [Google Scholar] [CrossRef]
  11. Weegels, P.L.; Hamer, R.J.; Schofield, J.D. RP–HPLC and Capillary Electrophoresis of Subunits from Glutenin Isolated by SDS and Osborne Fractionation. J. Cereal Sci. 1995, 22, 211–224. [Google Scholar] [CrossRef]
  12. Zoccatelli, G.; Sega, M.; Bolla, M.; Cecconi, D.; Vaccino, P.; Rizzi, C.; Chignola, R.; Brandolini, A. Expression of alpha-amylase inhibitors in diploid Triticum species. Food Chem. 2012, 135, 2643–2649. [Google Scholar] [CrossRef] [PubMed]
  13. Sotkovsky, P.; Sklenar, J.; Halada, P.; Cinova, J.; Setinova, I.; Kainarova, A.; Golias, J.; Pavlaskova, K.; Honzova, S.; Tuckova, L. A new approach to the isolation and characterization of wheat flour allergens. Clin. Exp. Allergy 2011, 41, 1031–1043. [Google Scholar] [CrossRef]
  14. Carbonero, P.; García-Olmedo, F. A Multigene Family of Trypsin/α-Amylase Inhibitors from Cereals. In Seed Proteins; Springer: Dordrecht, The Netherlands, 1999; pp. 617–633. [Google Scholar] [CrossRef] [Green Version]
  15. Prandi, B.; Faccini, A.; Tedeschi, T.; Galaverna, G.; Sforza, S. LC/MS analysis of proteolytic peptides in wheat extracts for determining the content of the allergen amylase/trypsin inhibitor CM3: Influence of growing area and variety. Food Chem. 2013, 140, 141–146. [Google Scholar] [CrossRef]
  16. Rogniaux, H.; Pavlovic, M.; Lupi, R.; Lollier, V.; Joint, M.; Mameri, H.; Denery, S.; Larre, C. Allergen relative abundance in several wheat varieties as revealed via a targeted quantitative approach using MS. Proteomics 2015, 15, 1736–1745. [Google Scholar] [CrossRef]
  17. Geisslitz, S.; Ludwig, C.; Scherf, K.A.; Koehler, P. Targeted LC-MS/MS Reveals Similar Contents of alpha-Amylase/Trypsin-Inhibitors as Putative Triggers of Nonceliac Gluten Sensitivity in All Wheat Species except Einkorn. J. Agric. Food Chem. 2018, 66, 12395–12403. [Google Scholar] [CrossRef]
  18. Labrou, N.E. Protein purification: An overview. Methods Mol. Biol. 2014, 1129, 3–10. [Google Scholar] [CrossRef]
  19. Kallberg, K.; Johansson, H.O.; Bulow, L. Multimodal chromatography: An efficient tool in downstream processing of proteins. Biotechnol. J. 2012, 7, 1485–1495. [Google Scholar] [CrossRef]
  20. Wilken, L.R.; Nikolov, Z.L. Recovery and purification of plant-made recombinant proteins. Biotechnol. Adv. 2012, 30, 419–433. [Google Scholar] [CrossRef]
  21. Zuvela, P.; Skoczylas, M.; Jay Liu, J.; Ba Czek, T.; Kaliszan, R.; Wong, M.W.; Buszewski, B.; Heberger, K. Column Characterization and Selection Systems in Reversed-Phase High-Performance Liquid Chromatography. Chem. Rev. 2019, 119, 3674–3729. [Google Scholar] [CrossRef]
  22. Khatwani, S.L.; Pavlova, A.; Pirot, Z. Anion-exchange HPLC assay for separation and quantification of empty and full capsids in multiple adeno-associated virus serotypes. Mol. Ther. Methods Clin. Dev. 2021, 21, 548–558. [Google Scholar] [CrossRef] [PubMed]
  23. Josic, D.; Kovac, S. Reversed-phase High Performance Liquid Chromatography of proteins. Curr. Protoc. Protein Sci. 2010, 61, 8.7.1–8.7.22. [Google Scholar] [CrossRef] [PubMed]
  24. Ostertag, F.; Schmidt, C.M.; Berensmeier, S.; Hinrichs, J. Development and validation of an RP-HPLC DAD method for the simultaneous quantification of minor and major whey proteins. Food Chem. 2021, 342, 128176. [Google Scholar] [CrossRef] [PubMed]
  25. Attimarad, M.; Venugopala, K.N.; Nair, A.B.; Sreeharsha, N.; Deb, P.K. Experimental Design Approach for Quantitative Expressions of Simultaneous Quantification of Two Binary Formulations Containing Remogliflozin and Gliptins by RP-HPLC. Separations 2022, 9, 23. [Google Scholar] [CrossRef]
  26. Snyder, L.R. Role of the solvent in liquid-solid chromatography. Review. Anal. Chem. 2002, 46, 1384–1393. [Google Scholar] [CrossRef]
  27. Jandera, P.; Janas, P. Recent advances in stationary phases and understanding of retention in hydrophilic interaction chromatography. A review. Anal. Chim. Acta 2017, 967, 12–32. [Google Scholar] [CrossRef]
  28. Dousa, M.; Jires, J. HILIC-MS determination of dimethylamine in the active pharmaceutical ingredients and in the dosage forms of metformin. J. Pharm. Biomed. Anal. 2020, 191, 113573. [Google Scholar] [CrossRef]
  29. Wu, D.; Lucy, C.A. Study of the slope of the linear relationship between retention and mobile phase composition (Snyder-Soczewinski model) in normal phase liquid chromatography with bonded and charge-transfer phases. J. Chromatogr. A 2016, 1475, 31–40. [Google Scholar] [CrossRef]
  30. Pesek, J.J.; Matyska, M.T.; Boysen, R.I.; Yang, Y.; Hearn, M.T.W. Aqueous normal-phase chromatography using silica-hydride-based stationary phases. TrAC Trends Anal. Chem. 2013, 42, 64–73. [Google Scholar] [CrossRef]
  31. Gottschalk, U. 3.57—Overview of Downstream Processing in the Biomanufacturing Industry. Compr. Biotechnol. 2011, 3, 698–711. [Google Scholar] [CrossRef]
  32. Kumar, V.; Leweke, S.; Heymann, W.; von Lieres, E.; Schlegel, F.; Westerberg, K.; Lenhoff, A.M. Robust mechanistic modeling of protein ion-exchange chromatography. J. Chromatogr. A 2021, 1660, 462669. [Google Scholar] [CrossRef] [PubMed]
  33. Trappe, A.; Fussl, F.; Carillo, S.; Zaborowska, I.; Meleady, P.; Bones, J. Rapid charge variant analysis of monoclonal antibodies to support lead candidate biopharmaceutical development. J. Chromatogr. B 2018, 1095, 166–176. [Google Scholar] [CrossRef] [PubMed]
  34. Murisier, A.; Duivelshof, B.L.; Fekete, S.; Bourquin, J.; Schmudlach, A.; Lauber, M.A.; Nguyen, J.M.; Beck, A.; Guillarme, D.; D’Atri, V. Towards a simple on-line coupling of ion exchange chromatography and native mass spectrometry for the detailed characterization of monoclonal antibodies. J. Chromatogr. A 2021, 1655, 462499. [Google Scholar] [CrossRef] [PubMed]
  35. Farsang, E.; Murisier, A.; Horvath, K.; Beck, A.; Kormany, R.; Guillarme, D.; Fekete, S. Tuning selectivity in cation-exchange chromatography applied for monoclonal antibody separations, part 1: Alternative mobile phases and fine tuning of the separation. J. Pharm. Biomed. Anal. 2019, 168, 138–147. [Google Scholar] [CrossRef] [PubMed]
  36. Nesterenko, P.N.; Nesterenko, E.P. Hydrophobicity of polymer based anion-exchange columns for ion chromatography. Heliyon 2021, 7, e07290. [Google Scholar] [CrossRef] [PubMed]
  37. Zhang, K.; Liu, X. Mixed-mode chromatography in pharmaceutical and biopharmaceutical applications. J. Pharm. Biomed. Anal. 2016, 128, 73–88. [Google Scholar] [CrossRef] [Green Version]
  38. Maria, S.; Joucla, G.; Garbay, B.; Dieryck, W.; Lomenech, A.M.; Santarelli, X.; Cabanne, C. Purification process of recombinant monoclonal antibodies with mixed mode chromatography. J. Chromatogr. A 2015, 1393, 57–64. [Google Scholar] [CrossRef]
  39. Kazarian, A.A.; Taylor, M.R.; Haddad, P.R.; Nesterenko, P.N.; Paull, B. Single column comprehensive analysis of pharmaceutical preparations using dual-injection mixed-mode (ion-exchange and reversed-phase) and hydrophilic interaction liquid chromatography. J. Pharm. Biomed. Anal. 2013, 86, 174–181. [Google Scholar] [CrossRef]
  40. Santarelli, X.; Cabanne, C. Mixed Mode Chromatography: A Novel Way Toward New Selectivity. Curr. Protein Pept. Sci. 2019, 20, 14–21. [Google Scholar] [CrossRef]
  41. Kreusser, J.; Jirasek, F.; Hasse, H. Influence of pH value and salts on the adsorption of lysozyme in mixed-mode chromatography. Eng. Life Sci. 2021, 21, 753–768. [Google Scholar] [CrossRef]
  42. Sagu, S.T.; Nso, E.J.; Karmakar, S.; De, S. Optimisation of low temperature extraction of banana juice using commercial pectinase. Food Chem. 2014, 151, 182–190. [Google Scholar] [CrossRef] [PubMed]
  43. Bezerra, M.A.; Santelli, R.E.; Oliveira, E.P.; Villar, L.S.; Escaleira, L.A. Response surface methodology (RSM) as a tool for optimization in analytical chemistry. Talanta 2008, 76, 965–977. [Google Scholar] [CrossRef] [PubMed]
  44. Sagu, S.T.; Landgraber, E.; Henkel, I.M.; Huschek, G.; Homann, T.; Bussler, S.; Schluter, O.K.; Rawel, H. Effect of Cereal alpha-Amylase/Trypsin Inhibitors on Developmental Characteristics and Abundance of Digestive Enzymes of Mealworm Larvae (Tenebrio molitor L.). Insects 2021, 12, 454. [Google Scholar] [CrossRef] [PubMed]
  45. Sagu, S.T.; Landgraber, E.; Rackiewicz, M.; Huschek, G.; Rawel, H. Relative Abundance of Alpha-Amylase/Trypsin Inhibitors in Selected Sorghum Cultivars. Molecules 2020, 25, 5982. [Google Scholar] [CrossRef]
  46. Sagu, S.T.; Huschek, G.; Bonick, J.; Homann, T.; Rawel, H.M. A New Approach of Extraction of alpha-Amylase/trypsin Inhibitors from Wheat (Triticum aestivum L.), Based on Optimization Using Plackett-Burman and Box-Behnken Designs. Molecules 2019, 24, 3589. [Google Scholar] [CrossRef] [Green Version]
  47. Lowry, O.; Rosebrough, N.; Farr, A.L.; Randall, R. Protein Measurement with the Folin Phenol Reagent. J. Biol. Chem. 1951, 193, 265–275. [Google Scholar] [CrossRef]
  48. Laemmli, U.K. Cleavage of structural proteins during the assembly of the head of bacteriophage T4. Nature 1970, 227, 680–685. [Google Scholar] [CrossRef]
  49. Sagu, S.T.; Huschek, G.; Homann, T.; Rawel, H.M. Effect of Sample Preparation on the Detection and Quantification of Selected Nuts Allergenic Proteins by LC-MS/MS. Molecules 2021, 26, 4698. [Google Scholar] [CrossRef]
  50. Baranyi, J.; Pin, C.; Ross, T. Validating and comparing predictive models. Int. J. Food Microbiol. 1999, 48, 159–166. [Google Scholar] [CrossRef]
  51. Ross, T. Indices for performance evaluation of predictive models in food microbiology. J. Appl. Bacteriol. 1996, 81, 501–508. [Google Scholar] [CrossRef]
  52. Manadas, B.; Mendes, V.M.; English, J.; Dunn, M.J. Peptide fractionation in proteomics approaches. Expert Rev. Proteom. 2014, 7, 655–663. [Google Scholar] [CrossRef] [PubMed] [Green Version]
Figure 1. Chromatogram of (a) the reverse phase separation of ATI extracts; and (b,c) the strong anion exchange separation of fractionations F1 and F2 at the optimal conditions, respectively. Fractions F1 and F2 of the RP-HPLC were first collected and further fractionated by ion exchange.
Processes 10 00259 g001
Figure 2. SDS PAGE of the ATI extract and the different fractions collected from the reverse phase and ion exchange chromatography. F1 and F2 are the two fractions collected from the C18 separation, while F1-1, F1-2, F1-3, F1-4, F1-5, F2-1, and F2-2 are fractions collected from the strong anion exchange separation.
Processes 10 00259 g002
Figure 3. MALDI-TOF-MS spectra of (a) ATI extract; (b) fraction F2 from the C18 separation; and (c) F2-1 and (d) F2-2 fractions from ion exchange chromatography.
Processes 10 00259 g003
Figure 4. Response surface plot showing the effect of the flow rate and the gradient on (a) the retention time of the first eluted peak RTP1, (b) the resolution factor RF, and (c) the resolution between the critical pair peaks ∆tCR. The parameters are presented in their coded values and the column temperature was fixed constant at the center of variation of the experimental domain.
Processes 10 00259 g004
Figure 5. MALDI-TOF-MS spectra of (a) fraction F1 from the C18, (b) P16851, (c) P16850, (d) P16159 (e) P01083 and (f) P01085 purified proteins from the ion exchange chromatography.
Processes 10 00259 g005
Table 1. Experimental design of the strong anion exchange separation of F1 with the coded values of the Doehlert design, the real values, and the experimental responses.
RunsCoded ValuesReal ValuesExperimental Responses
Flow Rate
(mL/min)
Gradient
(%B/min)
Temp.
(°C)
RTP1
(min)
∆tCR
(min)
RF
-
x1x2x3X1X2X3
10000.80.30356.00 ± 0.120.55 ± 0.020.58 ± 0.01
21001.20.30355.08 ± 0.520.66 ± 0.010.67 ± 0.01
3−1000.40.30356.90 ± 0.420.96 ± 0.040.59 ± 0.03
40.50.86601.00.50355.03 ± 0.480.50 ± 0.010.73 ± 0.01
5−0.5−0.86600.60.10357.13 ± 0.141.35 ± 0.060.60 ± 0.00
60.5−0.86601.00.10356.32 ± 0.171.17 ± 0.050.59 ± 0.01
7−0.50.86600.60.50356.32 ± 0.090.37 ± 0.000.72 ± 0.01
80.50.2890.8161.00.37405.66 ± 0.300.44 ± 0.010.72 ± 0.04
9−0.5−0.289−0.8160.60.23306.77 ± 0.260.94 ± 0.070.60 ± 0.01
100.5−0.289−0.8161.00.23305.78 ± 0.250.84 ± 0.040.59 ± 0.01
1100.577−0.8160.80.43306.86 ± 0.410.55 ± 0.010.68 ± 0.02
12−0.50.2890.8160.60.37406.49 ± 0.330.65 ± 0.020.60 ± 0.01
130−0.5770.8160.80.17406.62 ± 0.450.84 ± 0.010.59 ± 0.01
140000.80.30356.11 ± 0.080.57 ± 0.010.59 ± 0.00
150000.80.30356.38 ± 0.410.55 ± 0.030.57 ± 0.01
160000.80.30356.15 ± 0.350.57 ± 0.010.57 ± 0.01
170000.80.30356.23 ± 0.090.58 ± 0.010.58 ± 0.01
RTP1 is the retention time of the first eluted peak, ∆tCR the resolution between the critical pair peaks F1-3 and F1-4 and RF the resolution factor indicating the ratio between the separation time of the first and the last eluted peaks and the total separation time.
Table 2. Proportion of individual ATIs in the extract.
Proportion (%)
RP-HPLCSAX-HPLC
UniProt Access Nr.ExtractF1-C18F2-C18F1-1F1-2F1-3F1-4F1-5F2-1F2-3
P0108323.7 ± 0.333.0 ± 1.73.0 ± 0.70.0 ± 0.00.9 ± 0.10.0 ± 0.00.4 ± 0.198.2 ± 0.70.8 ± 0.00.4 ± 0.0
P1731418.3 ± 0.50.7 ± 0.074.8 ± 1.30.0 ± 0.00.0 ± 0.00.0 ± 0.00.0 ± 0.00.0 ± 0.01.4 ± 0.198.1 ± 0.8
P168506.5 ± 0.09.5 ± 0.10.0 ± 0.42.6 ± 0.20.3 ± 0.00.5 ± 0.097.9 ± 0.50.0 ± 0.00.0 ± 0.00.2 ± 0.0
P010858.4 ± 0.112.3 ± 0.50.4 ± 0.095.1 ± 0.80.3 ± 0.00.1 ± 0.00.4 ± 0.10.1 ± 0.00.0 ± 0.00.0 ± 0.0
P010841.3 ± 0.03.5 ± 0.40.0 ± 0.00.8 ± 0.00.1 ± 0.00.0 ± 0.00.3 ± 0.00.2 ± 0.00.0 ± 0.00.0 ± 0.0
P1685113.4 ± 0.120.0 ± 0.10.2 ± 0.00.5 ± 0.00.6 ± 0.098.3 ± 0.40.4 ± 0.10.2 ± 0.00.0 ± 0.00.1 ± 0.0
P1615912.1 ± 0.516.0 ± 0.31.7 ± 0.10.0 ± 0.096.9 ± 0.50.3 ± 0.00.1 ± 0.00.8 ± 0.10.6 ± 0.10.1 ± 0.0
P814961.8 ± 0.00.1 ± 0.00.0 ± 0.01.0 ± 0.00.2 ± 0.00.0 ± 0.00.3 ± 0.00.2 ± 0.00.0 ± 0.00.0 ± 0.0
Q437233.6 ± 0.03.8 ± 0.32.3 ± 0.10.0 ± 0.00.3 ± 0.00.9 ± 0.10.0 ± 0.00.0 ± 0.00.4 ± 0.00.3 ± 0.0
P936021.8 ± 0.10.5 ± 0.01.1 ± 0.10.0 ± 0.00.0 ± 0.00.0 ± 0.00.0 ± 0.00.2 ± 0.00.4 ± 0.00.1 ± 0.0
P832076.7 ± 0.10.1 ± 0.015.9 ± 0.90.0 ± 0.00.3 ± 0.00.0 ± 0.00.0 ± 0.00.0 ± 0.096.2 ± 0.40.8 ± 0.1
Q4U1991.2 ± 0.20.4 ± 0.00.5 ± 0.00.0 ± 0.00.1 ± 0.00.0 ± 0.00.2 ± 0.00.1 ± 0.00.1 ± 0.00.0 ± 0.0
Q415401.1 ± 0.10.2 ± 0.00.0 ± 0.00.0 ± 0.00.0 ± 0.00.0 ± 0.00.0 ± 0.00.3 ± 0.00.0 ± 0.00.0 ± 0.0
RP-HPLC: reverse phase chromatography; SAX-HPLC: strong anion exchange chromatography.
Table 3. Reference and experimental masses of the fractionated wheat ATIs according to the MALDI-TOF-MS analysis.
Uni-Prot Access Nr.Signal PeptidsChain
(Amino Acids)
Reference Mass
(Da)
Determined Mass
(m/z)
Error
(%)
P010831-3031-15313,32613,3810.4
P173141-2526-16815,83215,5241.9
P168501-2425-14513,08513,0670.1
P01085-1-12413,32813,2980.2
P168511-2526-14513,03413,0540.2
P161591-2425-14313,43713,5650.9
P83207-1-11912,94312,9350.1
Table 4. Linear, quadratic, and interaction coefficients of the mathematical models and validation.
Coefficientsδ0α1α2α 3β1β2β3γ12γ13γ23R2BFAF
RTP18.23−1.26 ***−0.59 **−0.18−0.250.130.41−0.380.26−0.940.931.001.02
∆tCR0.56−0.12 **−0.45 ***−0.08 *0.25 **0.29 **0.080.18 *−0.130.050.981.001.05
RF0.580.03 **0.07 ***0.010.05 **0.09 **0.04 *0.010.08 *0.000.961.001.02
With RTP1, the retention time of the first eluted peak, RF the resolution factor, ∆tCR the resolution between the critical pair peaks F1-3 and F1-4. δ, α, β, and γ represent the coefficients of the different mathematical models with δ0 the constant term; α1, α2, and α 3 the linear effects, β1, β2, and β3 the quadratic effects; and γ12, γ13, and γ23 the interactions (1, 2 and 3 are flow rate, gradient, and column temperature, respectively. R2 is the coefficient of determination, BF the Bias factor and AF the accuracy factor. * Significant at p < 0.05; ** Significant at p < 0.01; *** Significant at p < 0.001.
Publisher’s Note: MDPI stays neutral with regard to jurisdictional claims in published maps and institutional affiliations.

