Article

Molecular Dynamics Simulation for Structural Evolution of Mixed Ash from Coal and Wheat Straw

1
Institute of Energy Research, Jiangsu University, Zhenjiang 212013, China
2
School of Energy and Power Engineering, Jiangsu University, Zhenjiang 212013, China
3
SINTEF Industry, P.O. Box 124, Blindern, 0314 Oslo, Norway
*
Authors to whom correspondence should be addressed.
Processes 2022, 10(2), 215; https://doi.org/10.3390/pr10020215
Submission received: 13 December 2021 / Revised: 16 January 2022 / Accepted: 19 January 2022 / Published: 24 January 2022
(This article belongs to the Special Issue Biomass Conversion and Organic Waste Utilization)

Abstract

:
We conducted molecular dynamics (MD) simulations to investigate the structural evolution of molten slag composed of wheat straw (WS) and Shenhua (SH) coal. The content of wheat straw in the slag was varied from 0 to 100 wt%. The MD results indicated a slight reduction in the sharpness of the radial-distribution-function curve of each ion–oxygen pair and a decrease in bonding strength with increasing WS content. WS introduced many metal ions to the ash system, increasing its overall activity. The number of bridging and non-bridging oxygen atoms changed upon straw addition, which affected the stability of the system. There were relatively few highly coordinated Si ions. The number of low-coordination Si was highest for a WS content of 30%, at which the density reached a minimum value. The degree of ash polymerization was analyzed by counting the number (Q) of tetrahedra with the number (n) of the bridging oxygen atoms. With increasing WS content, Q4 (tetrahedral Si) decreased, whereas Q3, Q2, Q1, and Q0 increased. Q4 reached a minimum value for a WS content of 30%, at which point the degree of ion aggregation was the weakest and the degree of disorder was the strongest.

1. Introduction

Coal gasification is important for the high-efficiency utilization of coal, production of liquid fuel and hydrogen, reduction of iron, and other processes. Co-gasification of biomass and coal increases the energy density of the biomass and decreases the clinkering rate of coal ash owing to its high fluidity. Understanding the network structure for the co-gasification ash of biomass and coal is important when designing the gasifier and selecting the operating temperature and fuel ratio [1,2].
Shenhua (SH) coal from the China Shenhua coalfield has good surface activity, high calorific value, and low sulfur and ash content. In particular, the melting temperature of SH coal ash is lower than other coal, which is suitable for a flow bed gasifier with liquid slag discharge. Coal ash is mainly composed of metal oxides and nonmetallic oxides [3,4]. Ions can be divided into three types on the basis of their different structures in slag: network ions, modified ions, and neutral ions. The roles of SiO2, Al2O3, Fe2O3, and CaO in melt have been studied extensively [5,6]. Because of the high SiO2 content in coal ash, the structure of silicates is of particular importance for understanding the structure and behavior of slags. Silicate slags contain Si cations surrounded by four tetrahedrally arranged oxygen anions. These SiO44− tetrahedra are joined in chains or rings by bridging oxygen (BO) atoms. Cations, such as Na+, Ca2+, Mg2+, K+, and Fe2+, break these bonded oxygens to form non-bridging oxygen (NBO), O, and free oxygen, O2− [7,8].
Compared with coal ash, the content of alkali metal elements such as K, Na, Mg, and Ca in biomass ash is high, and the content of network ions (Si and Al) is low [9]. The addition of biomass ash (such as wheat straw, corn straw, etc.) can reduce the melting point of coal ash [8], changing the flow characteristics of ash at high temperatures [10].
MD is an excellent tool to study the structure with classic dynamics and obtain information such as the chemical bond. This method has already been used in slag [11,12,13,14,15,16]. For example, experimental and MD simulations results indicated that the SiO44− tetrahedron is the most stable unit in the slag, and the bonding stability decreases in the order: Si–O > Al–O > Fe–O > Mg–O > Ca–O [13]. Zhang et al. [14] also point out that alkalis (Na2O and K2O) have only marginal influence on the structure of molten aluminosilicates, while the Na+ ion prefers to locate in the BO/NBO networks, and the K+ ion tends to be present in various oxygen tri-clusters. Moreover, Si–O and Al-O networks were observed to depolymerize into a simple structure at high alkalinity, with atomic self-diffusion increasing and the viscosity decreasing with increasing alkalinity [15]. The decrease in viscosity led to an increase in the proportion of NBO in the network. In another study, an increase in the MgO:Al2O3 ratio led to the introduction of more Mg2+ ions to destroy the network structure, resulting in the conversion of BO to NBO [16]. Moreover, as the basicity increased, more BO was converted to free oxygen.
At present, there are plenty of studies on the structure of coal ash, but few studies on the structure of mixed ash from coal and biomass. In this study, we carried out MD simulations to investigate the effect of wheat straw (WS) content (varied from 0 to 100 wt%) on the structural properties of ash slag, including the radial distribution functions (RDF), mean square displacement (MSD), coordination numbers (CN), distribution of oxygen types, distribution of bond angles, and distribution of Qn.

2. Methodology

2.1. Ash Samples Preparation

SH coal was supplied by the China Energy Investment Corporation; WS was collected from Bingjiang farm in Zhengjiang city. The industrial analysis of SH coal and WS was carried out using SH coal and WS powder (<100 μm) under the PRC National Standard GB/T 212-2008 [17] and GB/T28731-2012 [18], respectively. The analysis results are shown in Table 1.
SH coal ash and WS ash were prepared under the ASTM D3174-12 standard in which the final ashing temperature was set at 575 °C to minimize the loss of volatile elements such as Na [19]. The ash composition was analyzed by XRF (ARL ADVANT’X Intellipower 4200, ThermoFisher Scientific, USA), as shown in Table 2.
Simulation of real ash is difficult as as there are some impurities (P2O5, SO3, and Fe2O3) in real ash, as shown in Table 2. In this simulation study, six main components in coal ash and WS ash were selected for calculation to simplify the ash system, and the molar compositions are shown in Table 3, of which the content of WS in the slag was varied from 0% to 100 wt%.

2.2. Simulation Method

We used the Amorphous Cell Tools module of the Materials Studio 7.1 (MS) software to build an amorphous structural system model. The particles were randomly distributed in the system model to simulate the melt at high temperature, as shown in Figure 1. The density of the system determined the size of the cubic box.
CFF (Compass force filed) and PCFF (polymer consistent force field) in the Amorphous Cell Tools module of Materials Studio are widely used to build irregular cell structure of inorganic compounds. However, an oxygen atom cannot be added in CFF, only in the form of oxide, which is not adjusted for random distribution of atoms. In this work, the PCFF was selected for building the model as O can be added in the form of randomly distributed oxygen atoms. Other atoms were directly added to the force field, namely, Si, Na, Ca, Mg, Al, and K.
Periodic boundary conditions were applied on all sides of the model box to create an infinite system. The time step was set as 1 fs, and the data were saved each 100 steps. In the simulation system, the total number of atoms was set to 4000 and the number of different atoms was decided according to their mole fractions. The molar composition of the different ash samples is shown in Table 3. We selected the atoms with high mole fractions, i.e., Na, Mg, Al, Si, K, Ca, and O. The effective charge of ions was set as follows: Si was +1.89, Al was +1.4175, Ca was +0.945, Mg was +0.945, Na was +0.4725, K was +0.4725, and O was −0.945.
The number and density of each atom and the side length of the cubic model box in the system are listed in Table 4. The main components in the ash slag were feldspar (2.55–2.67 g/cm3) and diopside (3.27–3.38 g/cm3) [20]. Because the addition of biomass increases the diopside content in the ash, we selected a slag density of 3.0 g/cm3. Since the sizes of Na, Mg, Al, Si, K, Ca, and O atoms are different, there are differences in the length of the cubic model box to ensure the same total atoms and slag density in different slag systems.

2.3. MD Simulation Process

We used potential functions based on the Garofalini potential function [21], which includes a pair potential and three-body potential. The Born–Mayer–Huggins (BMH) function was used as a pair potential function, which is written as
V i j B M H = A i j e x p ( r i j ρ i j ) + q i q j r i j ξ ( r i j β i j )
where rij is the interatomic distance between atoms i and j, qi and qj represent the charges of atoms i and j, and ξ represents correction function. Aij, ρij, and βij represent the potential parameters of BMH. The parameters used are listed in Table 5. The form of the three-body potential function can be written as:
φ j i k = λ i j λ j k e x p ( γ i j r i j R i j + γ j k r j k R j k ) ω j i k
where Rij is the distance between particles i and j; Rjk is the distance between particles j and k; λij and γij are the potential parameters between particles i and j; λjk and γjk are the potential parameters between particles j and k; and ωijk is a function related to the angle. The parameters of the three potentials are taken from Garofalini’s work [22], as shown in Table 6. Simulations were carried out in the NVT ensemble, i.e., keeping the number of particles (N), system volume (V), and temperature (T) fixed. As shown in Figure 2, the system was thermally stabilized for 25 ps at T = 5000 K to ensure full mixing of the particles and was then cooled to 2000 K in 25 ps with a cooling rate of 1.2 × 10¹⁴ K/s. To achieve a state of equilibrium, the system was kept at 2000 K for 25 ps and then cooled to 1623 K in 25 ps with a cooling rate of 1.508 × 10¹³ K/s. In the final stage, the system was equilibrated at 2223 K for 25 ps to obtain a uniform ash slag in a molten state.

3. Results and Discussion

3.1. Radial Distribution Functions (RDFs)

From RDFs, basic structural information, including the degree of material ordering and the degree of correlation of electrons, can be obtained. The formula for the RDF can be written as [23]:
g i j ( r ) = V N i N j j n i j ( r Δ r 2 , r + Δ r 2 ) 4 π r 2 Δ r
where V is the volume of the system; nij is the number of i atoms included in a spherical shell of thickness; Δr is located at a distance r; and N is the total number of particles.
The distributions of the RDF for each particle in the ash sample are shown in Figure 3. The location of the first peak in the RDF graph represents the average bond length of the atomic pair. For Si–O, the location of first peak in all five samples was unaffected by the addition of WS, which corresponds to a bond length of 1.61 Å. The locations of the first peaks seen in Al–O for SH, SH-WS (10%), SH-WS (30%), and SH-WS (50%) were similar, although the addition of WS shifted the peak slightly, indicating a decrease in bond length from 1.75 to 1.73 Å. The peak values of Si–O and Al–O were consistent with previous reports [21], indicating that the calculated results are reasonable.
The sharpness of the first peak in the RDF curves reflect the bonding ability and interaction between ions [24]. With increasing WS content, the width of the first peak of Si–O and Al–O increased, indicating a decrease in bond strength. The first peaks for Na–O, Mg–O, K–O, and Ca–O corresponded to bond lengths of 2.29–2.35, 2.00–2.06, 2.61–2.65, and 2.30–2.35Å, respectively. The width of the first peaks for these bonds was larger than for Si–O and Al-O, indicating weaker bonding than for Si–O and Al–O.

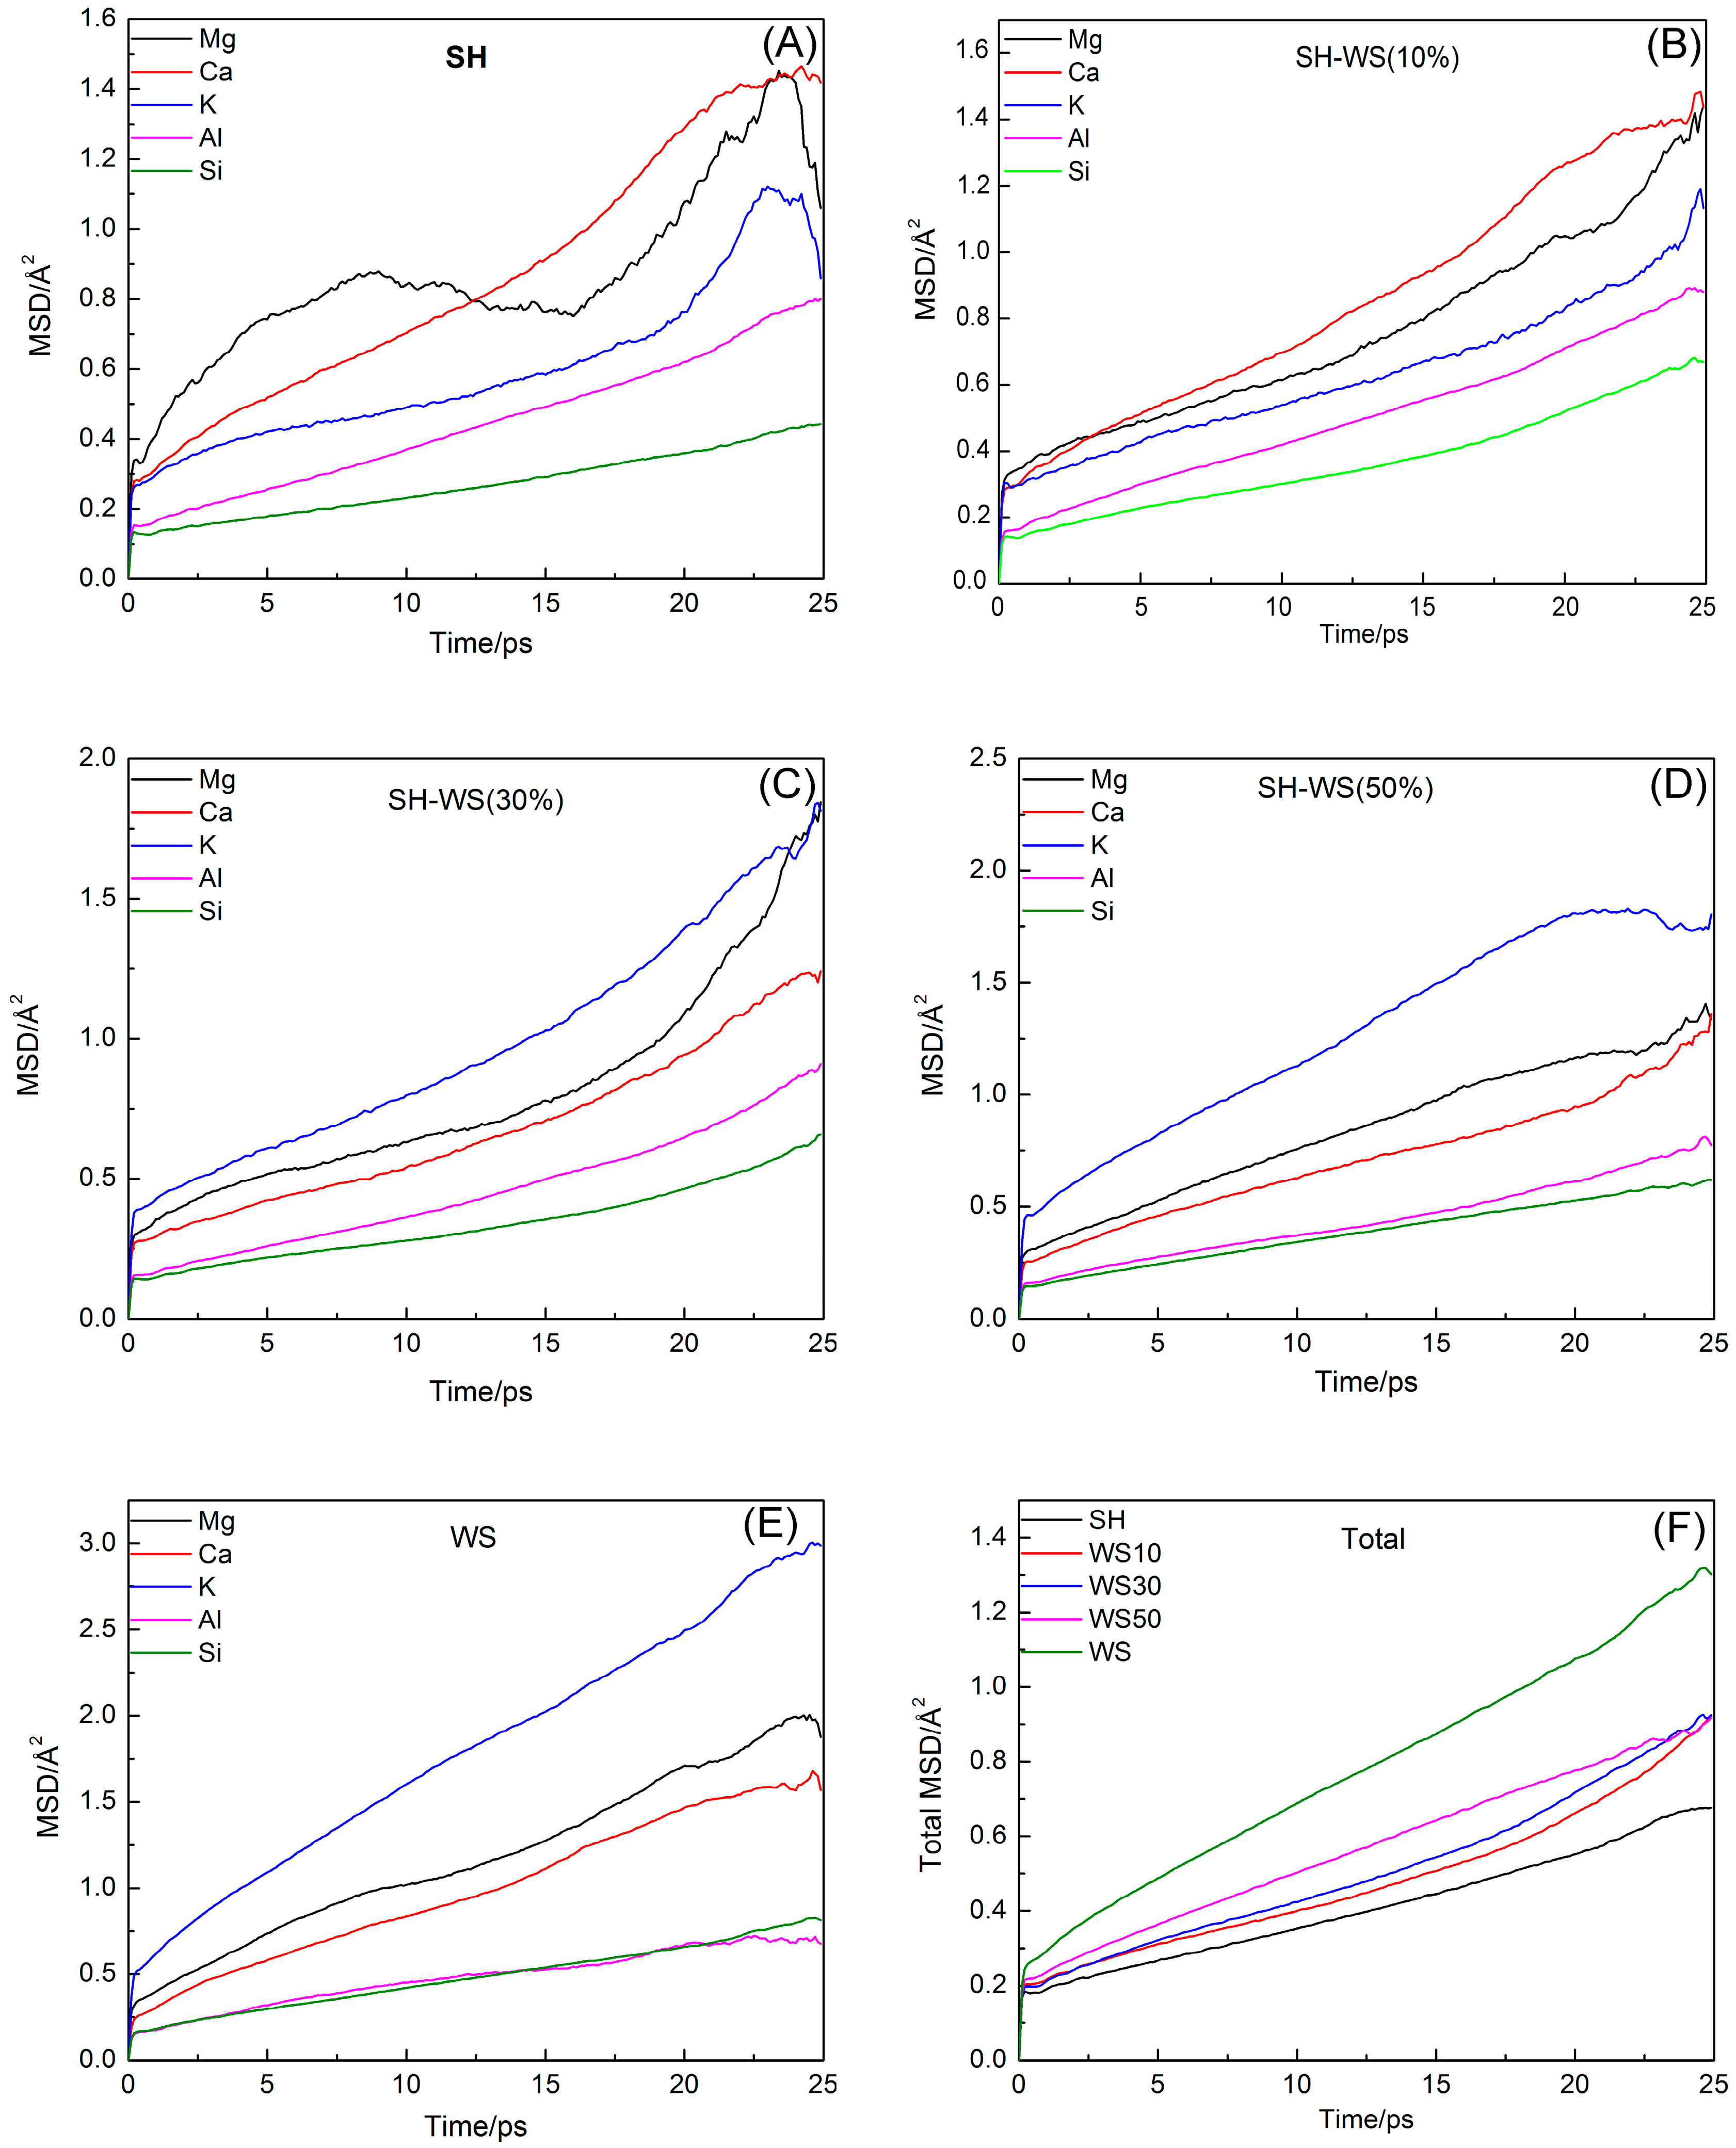
3.2. Mean Square Displacement

The atoms do not stay in a fixed position in the system; rather, they are in continuous movement. The mean square displacement (MSD) of each atom can be determined from its trajectory as [25]:
M S D = Δ r ( t 2 ) = 1 N i = 1 N | r i ( t ) r i ( 0 ) | 2
where ri(0) is the displacement of atom i at time zero, and ri(t) represents the displacement of atom i at time t. The MSD has a linear relationship with the diffusion coefficient (DC), which can be written as [26]:
D C = l i m t 1 6 d ( Δ r ( t ) 2 ) d t
The MSDs of Si, Al, Ca, Mg, and K, and the total displacement of all atoms in the system are shown in Figure 4. For all samples, the activity and diffusion coefficient of Si atoms were the lowest, because Si formed the network structure of the system. However, with increasing WS content, the activity of other metal oxides (e.g., K2O, MgO, and CaO) in the ash increased. For a WS content of 0–10 wt%, the activity of Ca was the highest among all elements in the ash. Between 30% and 100 wt%, K had the highest activity. The high activity of Ca and K is because these elements do not form the network structure and can move freely in the network. As shown in Figure 4F, the total MSD increased with increasing WS content. A possible explanation for this trend is that the addition of more oxide reduces the complexity of the system.
We calculated the diffusion coefficients in the system on the basis of the law of diffusion, as shown in Figure 5. The diffusion coefficients decreased in the following order: DCa > DMg > DK > DAl > DSi at WS contents up to 10%. The order of diffusion coefficients was DK > DMg > DCa for WS contents between 30% and 100%, and at 100%, DSi > DAl.

3.3. Coordination Numbers

The microstructure of the Na2O-MgO-Al2O3-SiO2-K2O-CaO slag system was mainly composed of the silicoaluminate and the network modifier. The coordination numbers (CN) varied with the fraction of WS, as shown in Figure 6. It could be seen that the coordination number of Si was maintained at about four, but decreased with increasing WS content, indicating a reduction in the strength of Si–O bond. We attributed this to the depolymerization of the highly coordinated Si by metal atoms, such as Mg and K. For Al, not only four-coordinate Al–O structures but also a large number of structures with fewer than four coordination bonds formed. With increasing WS content, the fraction of more highly coordinated Al–O structures increased. This indicates that the [AlO4] tetrahedral unit is not as stable as the [SiO4] tetrahedron.

3.4. Distribution of Oxygen Types

The oxygen ions in this system can be classified as either BO or NBO on the basis of the cations to which they are connected. As shown in Figure 7A, the proportion of BO decreased and the proportion of NBO increased with increasing WS content. We classified BO into Si–O–Si, Si–O–Al, and Al–O–Al. There was less Al in the form of Al–O–Al than Al–O–Si, indicating the Al–O–Si bonds were more stable than Al–O–Al bonds (Figure 7B). A similar trend was not observed for Si.
For NBOs, we considered Si–O–Ca, Si–O–Na, Si–O–K, Si–O–Mg, Al–O–Mg, Al–O–Ca, Al–O–Na, and Al–O–K, the distributions of which are shown in Figure 7C. The most abundant NBOs were Al–O–K and Si–O–K, indicating that the tetrahedron is more easily destroyed by K2O than other oxides in this network structure. Zhang et al. [23] proposed that the disparity between (Si-O-M (Ca, Mg, Na, K))/Si and (Al-O-M)/Al can indirectly reflect the proportion of charge-balancing M for tetrahedron. The ratios of (Si-O-Ca)/Si, (Al-O-Ca)/Al, (Si-O-Mg)/Si, (Al-O-Mg)/Al, (Si-O-Na)/Si, (Al-O-Na)/Al, (Si-O-K)/Si, and (Al-O-K)/Al, represent the average numbers of M, which forms non-bridging in one [SiO4] or [AlO4] tetrahedron. Figure 7C shows that the disparity between (Si-O-M*(Ca, Mg, Na)/Si and (Al-O-M*)/Al is much smaller than the disparity between (Si-O-K)/Si and (Al-O-K)/Al, indicating that Ca2+, Mg2+, Na+ are not the charge-balancing atoms.

3.5. Distribution of Bond Angles

The distributions of bond angles for the different samples are shown in Figure 8. The configurations of different bond angles in the Si–O and Al–O networks are shown in the insets of Figure 8A,B. The angular distributions of O–Si–O had a symmetric shape for all samples, averaging approximately 107° (Figure 8A), whereas the angular distributions of O–Al–O were asymmetric in all samples. The bond angle of O–Al–O reached a maximum when the WS content was 30%, which could be attributed to the transformation of [AlO4] to [AlO3]. Because of the stability of the [SiO4] structure, the O–Si–O angle was close to the ideal tetrahedral angle (109.5°). However, at least four forms of O–Al–O (each with different bond angles) were identified owing to the presence of one-, two-, and three-coordinated Al atoms. The peak of the O–Al–O angle distribution was much wider than that of O–Si–O because of the contribution of the non-tetrahedral forms of O–Al–O.

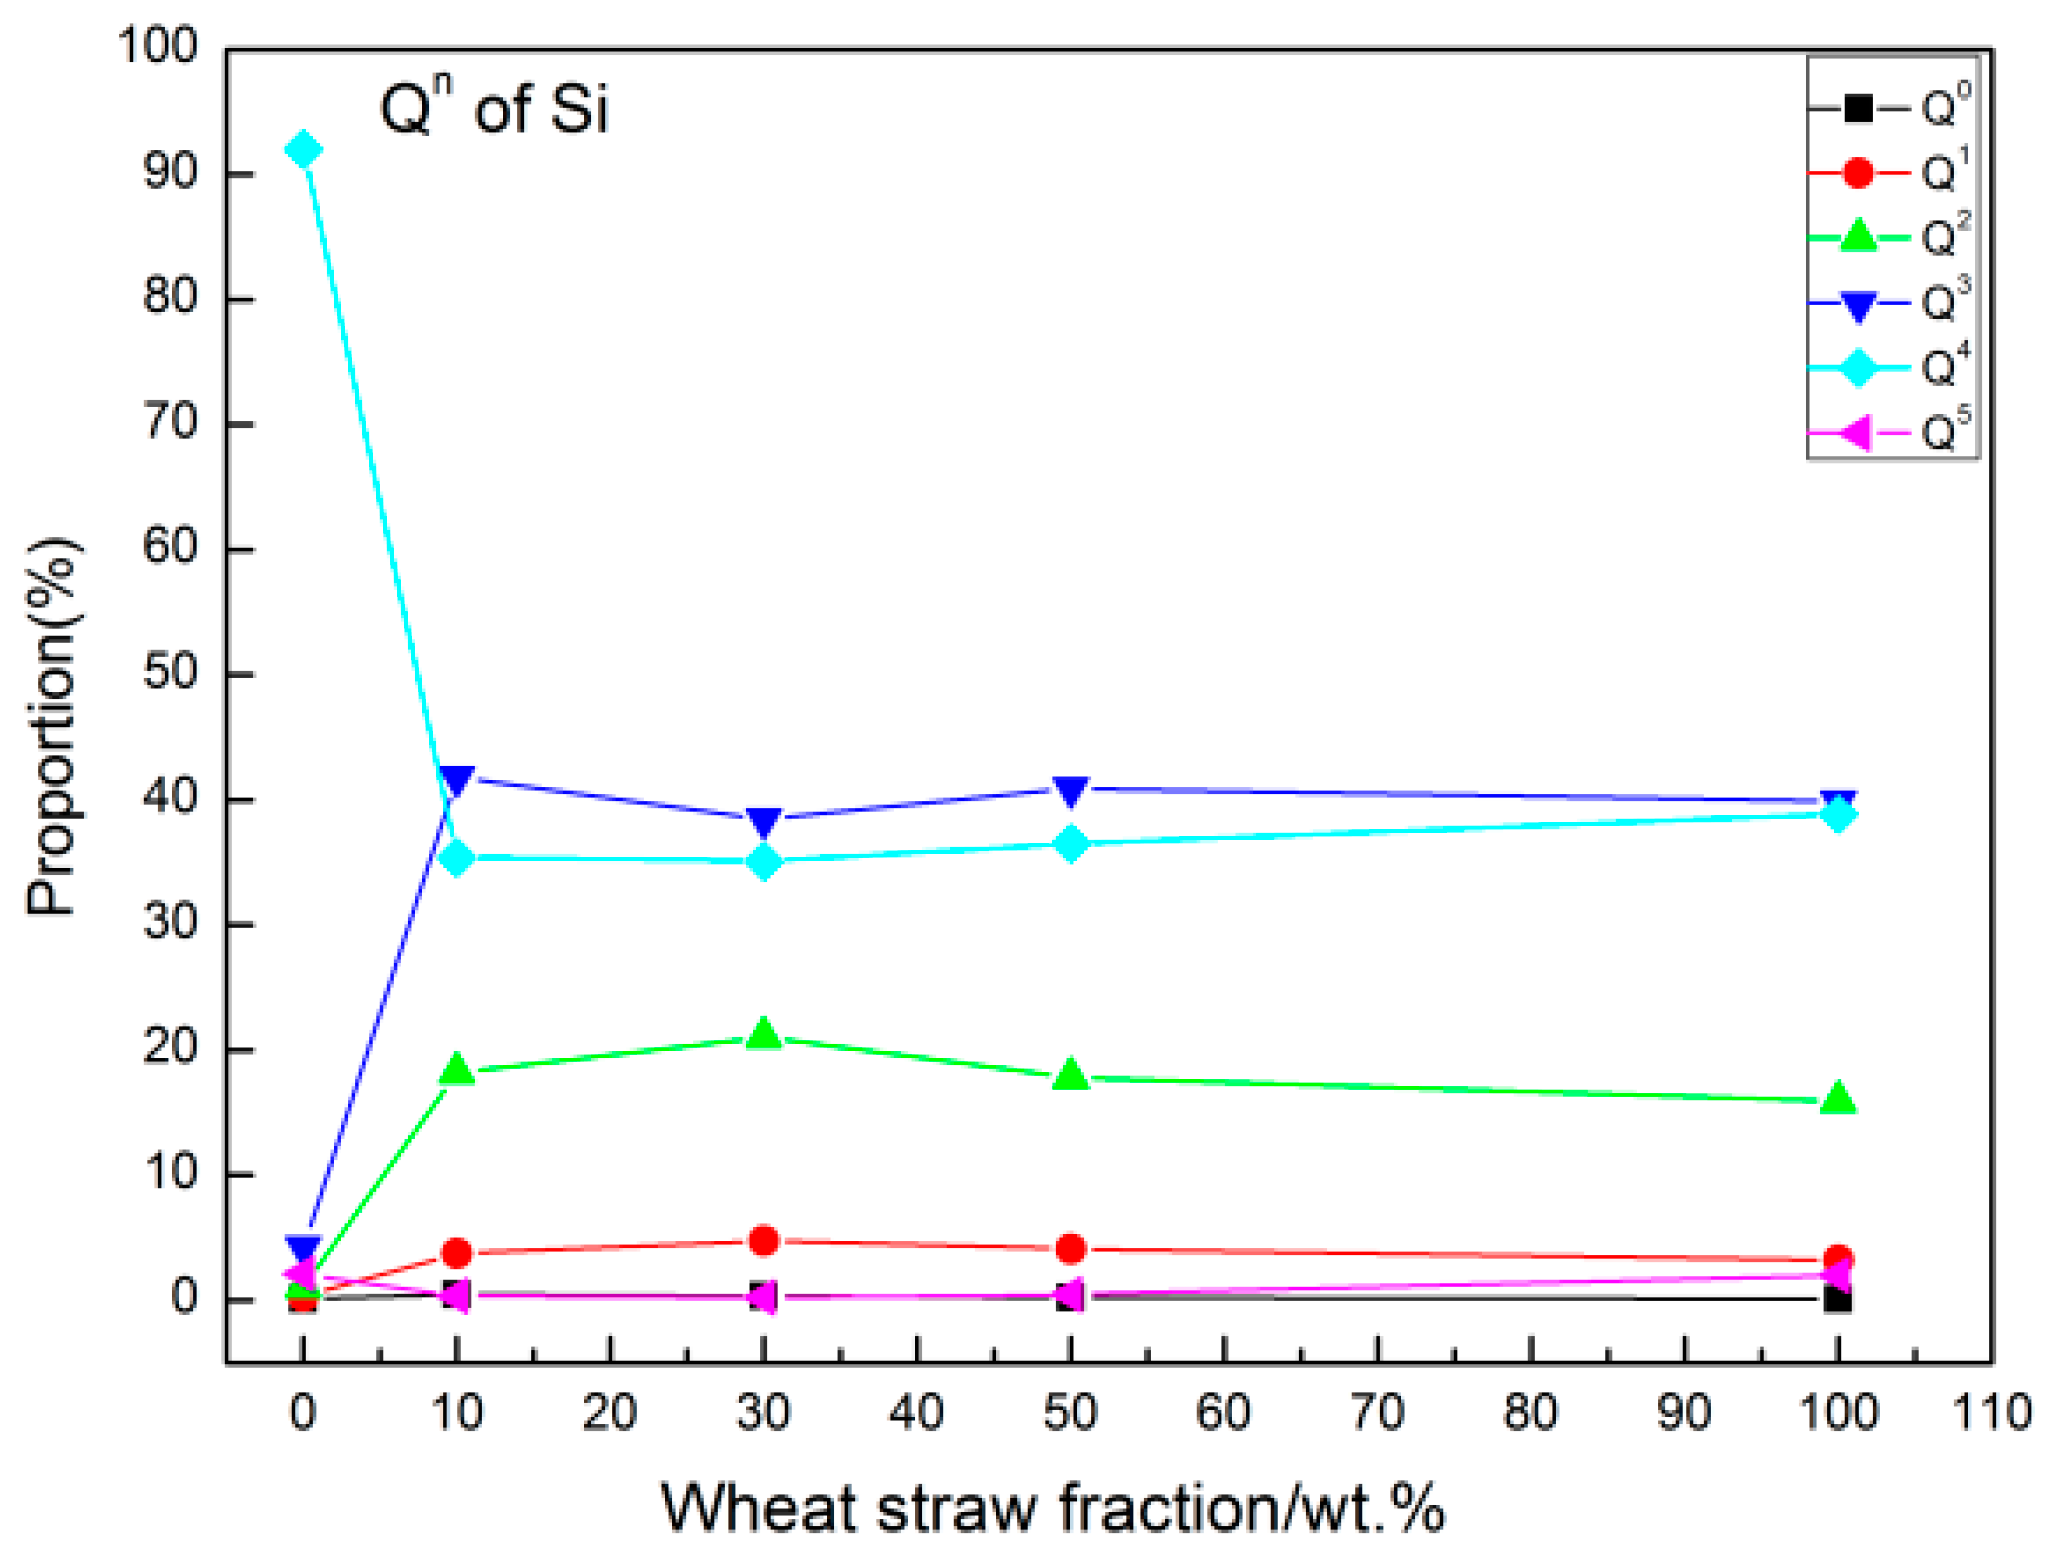
3.6. Distribution of Qn

The degree of polymerization is an important parameter for characterizing the integrity of the melt network structure. This can be analyzed by counting the number (Q) of tetrahedra with n bridging oxygen atoms. The influence of the WS fraction on Qn for Si is shown in Figure 9. With increasing WS content up to 30%, Q4 and Q5 decreased, whereas Q0, Q1, Q2, and Q3 increased. We attribute these trends to the depolymerization of the network structure, which results in the ash having good fluidity.

4. Conclusions

In conclusion, we investigated the structure of ash slags via MD simulations. The content of WS in the slag was varied from 0% to 100 wt%. The simulations provided structural information, such as the RDF, MSD, coordination number, bond angle, distribution of oxygen types, and Qn. We draw the following conclusions:
(1)
By analyzing the RDFs of the ion–oxygen pair, we found that the WS had no obvious influence on the bond length of Si–O. The widths of the first peaks in other ion–oxygen pairs were larger than that of Si–O, indicating a weaker bond strength than Si–O. The coordination number of Al was influenced by the addition of WS, demonstrating that WS influences the stability of the network structure. Moreover, the [AlO4] tetrahedron was found to be less stable than the [SiO4] tetrahedron.
(2)
The concentration of BO decreased and that of NBO increased with increasing WS content. This indicates that the network structure can be destroyed by metal ions, resulting in the conversion of BO to NBO.
(3)
The O–Si–O bond angle was constant at approximately 107.5°. The O–Al–O bond angles were wide and varied with increasing WS content.
(4)
With increasing WS content, the diffusion coefficients of Si4+ varied only slightly with no obvious trend. The sum of all diffusion coefficients increased with WS content, indicating an increased diffusion capacity of the system.
(5)
For a WS content of 30%, the Q4 and Q5 structural units transformed into Q3, Q2, Q1, and Q0 structural units to the greatest extent, which corresponded to the lowest degree of polymerization and highest ash fluidity.

Author Contributions

All six authors participated in the research and in the writing of this paper. All authors have read and agreed to the published version of the manuscript.

Funding

This research was supported by the Zhenjiang Science and Technology Bureau (High-tech Research Key laboratory of Zhenjiang, project No. SS2018002; Key Research and Development Program, project No. SH2020007), Department of Human Resources and Social Security of Jiangsu Province (Jiangsu Postdoctoral Research Funding Program, project No. 2021K180B), Taizhou Science and Technology Bureau (Technology Support Programme, project No. SSF20210131), and Jiangsu University (High-level Scientific Research Foundation for the introduction of talent, project No. 18JDG015).

Institutional Review Board Statement

Not applicable.

Informed Consent Statement

Not applicable.

Data Availability Statement

Not applicable.

Conflicts of Interest

The authors declare no conflict of interest.

References

  1. Dudley, B. BP Statistical Review of World Energy; Whitehouse Associates: London, UK, 2019. [Google Scholar]
  2. Jiang, N.; Li, L.; Wang, S.; Li, Q.; Dong, Z.; Duan, S.; Zhang, R.; Li, S. Variation tendency of pollution characterization, sources, and health risks of PM 2.5 -bound polycyclic aromatic hydrocarbons in an emerging megacity in China: Based on three-year data. Atmos. Res. 2019, 217, 81–92. [Google Scholar] [CrossRef]
  3. Steinberg, M.; Cheng, H.-C. Modern and prospective technologies for hydrogen production from fossil fuels. Int. J. Hydrog. Energy 1989, 14, 797–820. [Google Scholar] [CrossRef]
  4. Mahgagaokar, U.; Krewinghaus, A.-B. Coal conversion processes (gasification). Encycl. Chem. Technol. 1992, 6, 541–568. [Google Scholar]
  5. Dai, J.; Cui, H.; Grace, J.-R. Biomass feeding for thermochemical reactors. Prog. Energy Combust. 2012, 38, 716–736. [Google Scholar] [CrossRef]
  6. Yun, S.; Dai, Z.-H.; Zhou, Z.-J.; Chen, X.-L.; Yu, G.-S.; Wang, F.-C. Rapid co-pyrolysis of rice straw and a bituminous coal in a high-frequency furnace and gasification of the residual char. Bioresour. Technol. 2012, 109, 188–197. [Google Scholar] [CrossRef] [PubMed]
  7. Ilyushechkin, A.-Y.; Shwe, H.-S.; Chen, X.; Roberts, D.-G. Effect of sodium in brown coal ash transformations and slagging behaviour under gasification conditions. Fuel Process Technol. 2018, 179, 86–98. [Google Scholar] [CrossRef]
  8. Magdziarz, A.; Gajek, M.; Nowak-Wozny, D.; Wilk, M. Mineral phase transformation of biomass ashes—Experimental and thermochemical calculations. Renew. Energy 2018, 128, 446–459. [Google Scholar] [CrossRef]
  9. Wei, J.; Gong, Y.; Ding, L.; Yu, J.; Yu, G. Influence of Biomass Ash Additive on Reactivity Characteristics and Structure Evolution of Coal Char–CO2 Gasification. Energy Fuels 2018, 32, 10428–10436. [Google Scholar] [CrossRef]
  10. Fang, X.; Jia, L. Experimental study on ash fusion characteristics of biomass. Bioresour. Technol. 2012, 104, 769–774. [Google Scholar] [CrossRef]
  11. Li, K.-J.; Bouhadja, M.; Khanna, R.; Zhang, J.-L.; Liu, Z.-J.; Zhang, Y.-P.; Yang, T.-J.; Sahajwalla, V.; Yang, Y.-D.; Barati, M. Influence of SiO2 reduction on the local structural order and fluidity of molten coke ash in the high temperature zone of a blast furnace. A molecular dynamics simulation investigation. Fuel 2016, 186, 561–570. [Google Scholar] [CrossRef]
  12. Zhang, S.; Zhang, X.; Liu, W.; Lv, X.; Bai, C.; Wang, L. Relationship between structure and viscosity of CaO–SiO2–Al2O3–MgO–TiO2 slag. J. Non-Crys. Solids 2014, 402, 214–222. [Google Scholar] [CrossRef]
  13. Xuan, W.; Wang, H.; Xia, D. Deep structure analysis on coal slags with increasing silicon content and correlation with melt viscosity. Fuel 2019, 242, 362–367. [Google Scholar] [CrossRef]
  14. Li, K.; Khanna, R.; Bouhadja, M.; Zhang, J.; Liu, Z.; Su, B.; Yang, T.; Sahajwalla, V.; Singh, C.-V.; Barati, M. A molecular dynamic simulation on the factors influencing the fluidity of molten coke ash during alkalization with K2O and Na2O. Chem. Eng. J. 2017, 313, 1184–1193. [Google Scholar] [CrossRef]
  15. Wu, T.; Wang, Q.; Yu, C.-F.; He, S.-P. Structural and viscosity properties of CaO-SiO2-Al2O3-FeO slags based on molecular dynamic simulation. J. Non-Crys. Solids 2016, 450, 23–31. [Google Scholar] [CrossRef]
  16. Jiang, C.; Li, K.; Zhang, J.; Qin, Q.; Liu, Z.; Sun, M.; Wang, Z.; Wang, L. Effect of MgO/Al2O3 ratio on the structure and properties of blast furnace slags: A molecular dynamics simulation. J. Non-Crys. Solids 2018, 502, 76–82. [Google Scholar] [CrossRef]
  17. PRC National Standard GB/T 212-2008. Methods for Industrial Analysis of Coal; China Quality and Standards Publishing: Beijing, China, 2008. [Google Scholar]
  18. PRC National Standard GB/T 28731-201. Methods for Industrial Analysis of Solid Biomass Fuel; China Quality and Standards Publishing: Beijing, China, 2012. [Google Scholar]
  19. ASTM Standard D3174-2012. Standard Test Method for Ash in the Analysis Sample of Coal and Coke from Coal; ASTM International: West Conshohocken, PA, USA, 2012. [Google Scholar]
  20. Ma, C.; Skoglund, N.; Carlborg, M.; Brostrm, M. Viscosity of molten CaO-K2O-SiO2 woody biomass ash slags in relation to structural characteristics from molecular dynamics simulation. Chem. Eng. Sci. 2020, 215, 115464. [Google Scholar] [CrossRef]
  21. Dai, X.; Bai, J.; Huang, Q.; Liu, Z.; Bai, X.; Cao, R.; Wen, X.; Li, W.; Du, S. Viscosity temperature properties from molecular dynamics simulation: The role of calcium oxide, sodium oxide and ferrous oxide. Fuel 2019, 237, 163–169. [Google Scholar] [CrossRef]
  22. Litton, D.-A.; Garofalini, S.-H. Atomistic structure of sodium and calcium silicate intergranular films in alumina. J. Mater. Res. Technol. 1999, 14, 1418–1429. [Google Scholar] [CrossRef] [Green Version]
  23. Zheng, K.; Zhang, Z.; Yang, F.; Sridhar, S. Molecular Dynamics Study of the Structural Properties of Calcium Aluminosilicate Slags with Varying Al2O3/SiO2 Ratios. ISIJ Int. 2012, 52, 342–349. [Google Scholar] [CrossRef] [Green Version]
  24. Liu, L.; Xu, Z.; Li, R.; Zhu, R.; Xu, J.; Zhao, J.; Wang, C.; Nordlund, K.; Fu, X.; Fang, F. Molecular dynamics simulation of helium ion implantation into silicon and its migration. Nucl. Instrum. Meth. B 2019, 456, 53–59. [Google Scholar] [CrossRef] [Green Version]
  25. Wang, B.; Cormack, A.-N. Molecular dynamics simulations of Mg-doped beta″-alumina with potential models fitted for accurate structural response to thermal vibrations. Solid State Ionics 2014, 263, 9–14. [Google Scholar] [CrossRef]
  26. Mongalo, L.; Lopis, A.-S.; Venter, G.-A. Molecular dynamics simulations of the structural properties and electrical conductivities of CaO–MgO–Al2O3–SiO2 melts. J. Non-Crys. Solids 2016, 452, 194–202. [Google Scholar] [CrossRef]
Figure 1. MD model of ash.
Processes 10 00215 g001
Figure 2. Temperature of the ash during the simulation.
Processes 10 00215 g002
Figure 3. Radial distribution functions of Si-O (A), Al-O (B), K-O (C), Mg-O (D), Ca-O (E), and Na-O (F).
Processes 10 00215 g003
Figure 4. The mean square displacement of each atom in SH (A), WS (B), SH-WS(30%) (C), SH-WS(50%) (D), and WS (E). The mean square displacement of different samples (Total) (F).
Processes 10 00215 g004
Figure 5. Diffusion coefficients of the different atoms in the ash slag system.
Processes 10 00215 g005
Figure 6. The variation of CNSi-O (A) and CNAl-O (B) against the WS content.
Processes 10 00215 g006
Figure 7. The influence of WS contents on the distribution of two kinds of oxygen (A); the influence of WS content on the distribution of bridging oxygen (B) and non-bridging oxygen (C).
Processes 10 00215 g007
Figure 8. The influence of the WS contents on the O-Si-O angle (A) and O-Al-O angle (B).
Processes 10 00215 g008
Figure 9. Qn distribution of Si tetrahedra for different WS contents.
Processes 10 00215 g009
Table 1. Industrial analysis of SH coal and WS.
SampleContent (wt%)Gross Calorific Value (cal/g)
AshVolatilesH2OC-Fix
SH coal8.1228.029.5054.366336.8
WS11.566.47.9514.154354.4
Table 2. Composition analysis of SH coal ash and WS ash.
SampleContent (wt%)
Na2OMgOAI2O3SiO2P2O5SO3K2OCaOFe2O3
SH ash1.862.3419.1258.030.505.661.098.293.11
WS ash0.664.281.1958.762.394.7419.397.541.04
Table 3. Molar composition of different ash samples for simulation study.
SampleMol%
Na2OMgOAl2O3K2OCaOSiO2
SH2.14.213.30.910.668.9
SH-WS(10%)1.94.611.52.810.468.8
SH-WS(30%)1.65.48.414.410.168.6
SH-WS(50%)1.36.15.98.99.868.5
WS0.77.50.914.49.468.2
Table 4. Numbers of atoms, density, and side length of the cubic model box.
SampleAtomic NumberDensity
(g/cm3)
Length
(Å)
NaMgAlSiKCaO
SH55533428842213525083.035.82
SH-WS(10%)50602998947213424913.035.93
SH-WS(30%)427222390816113424593.036.13
SH-WS(50%)348215892223913224323.036.31
WS211042494740013023743.036.67
Table 5. Two-body-potential parameters [21].
AtomsParameter
ijAij (fJ)βij (pm)ρij (pm)
NaNa0.215923029
NaAl0.217823029
NaSi0.200123029
NaO0.319523429
MgMg1.0643231.829
MgAl0.2084623029
MgSi0.221623029
MgO0.284223429
AlAl0.050023529
AlSi0.252323329
AlO0.249023429
SiSi0.187723029
SiO0.296223429
KK0.99706253.829
KAl0.4448236.629
KSi0.4420253.829
KO0.60802253.829
CaCa0.700023029
CaAl0.217823029
CaSi0.221523029
CaO0.570023429
OO0.072523429
Table 6. Three-body potential parameters.
Atomtripletλij (fJ)γij (pm)Rij (pm)ωjik (deg)
Al/Si–O–Al/Si0.001200260109.5
O–Al/Si–O0.024280300109.5
Publisher’s Note: MDPI stays neutral with regard to jurisdictional claims in published maps and institutional affiliations.

