
Overview of Gene Expression Analysis in Gastric Disease Infected with Helicobacter pylori: CLDN1 and MMP9 Could Be Biomarkers for Early Diagnosis of Gastric Cancer

 , ,
, ,  and
and
Abstract
:1. Introduction
2. Materials and Methods
2.1. Ethical Approval and Consent to Participate
2.2. Gastric Biopsy Samples
2.3. RNA Isolation and Expression Microarray Analysis
2.4. Microarray Assays
2.5. Microarray Analysis and Selection of Differentially Expressed Genes
2.6. Enriched Gene Ontology Terms
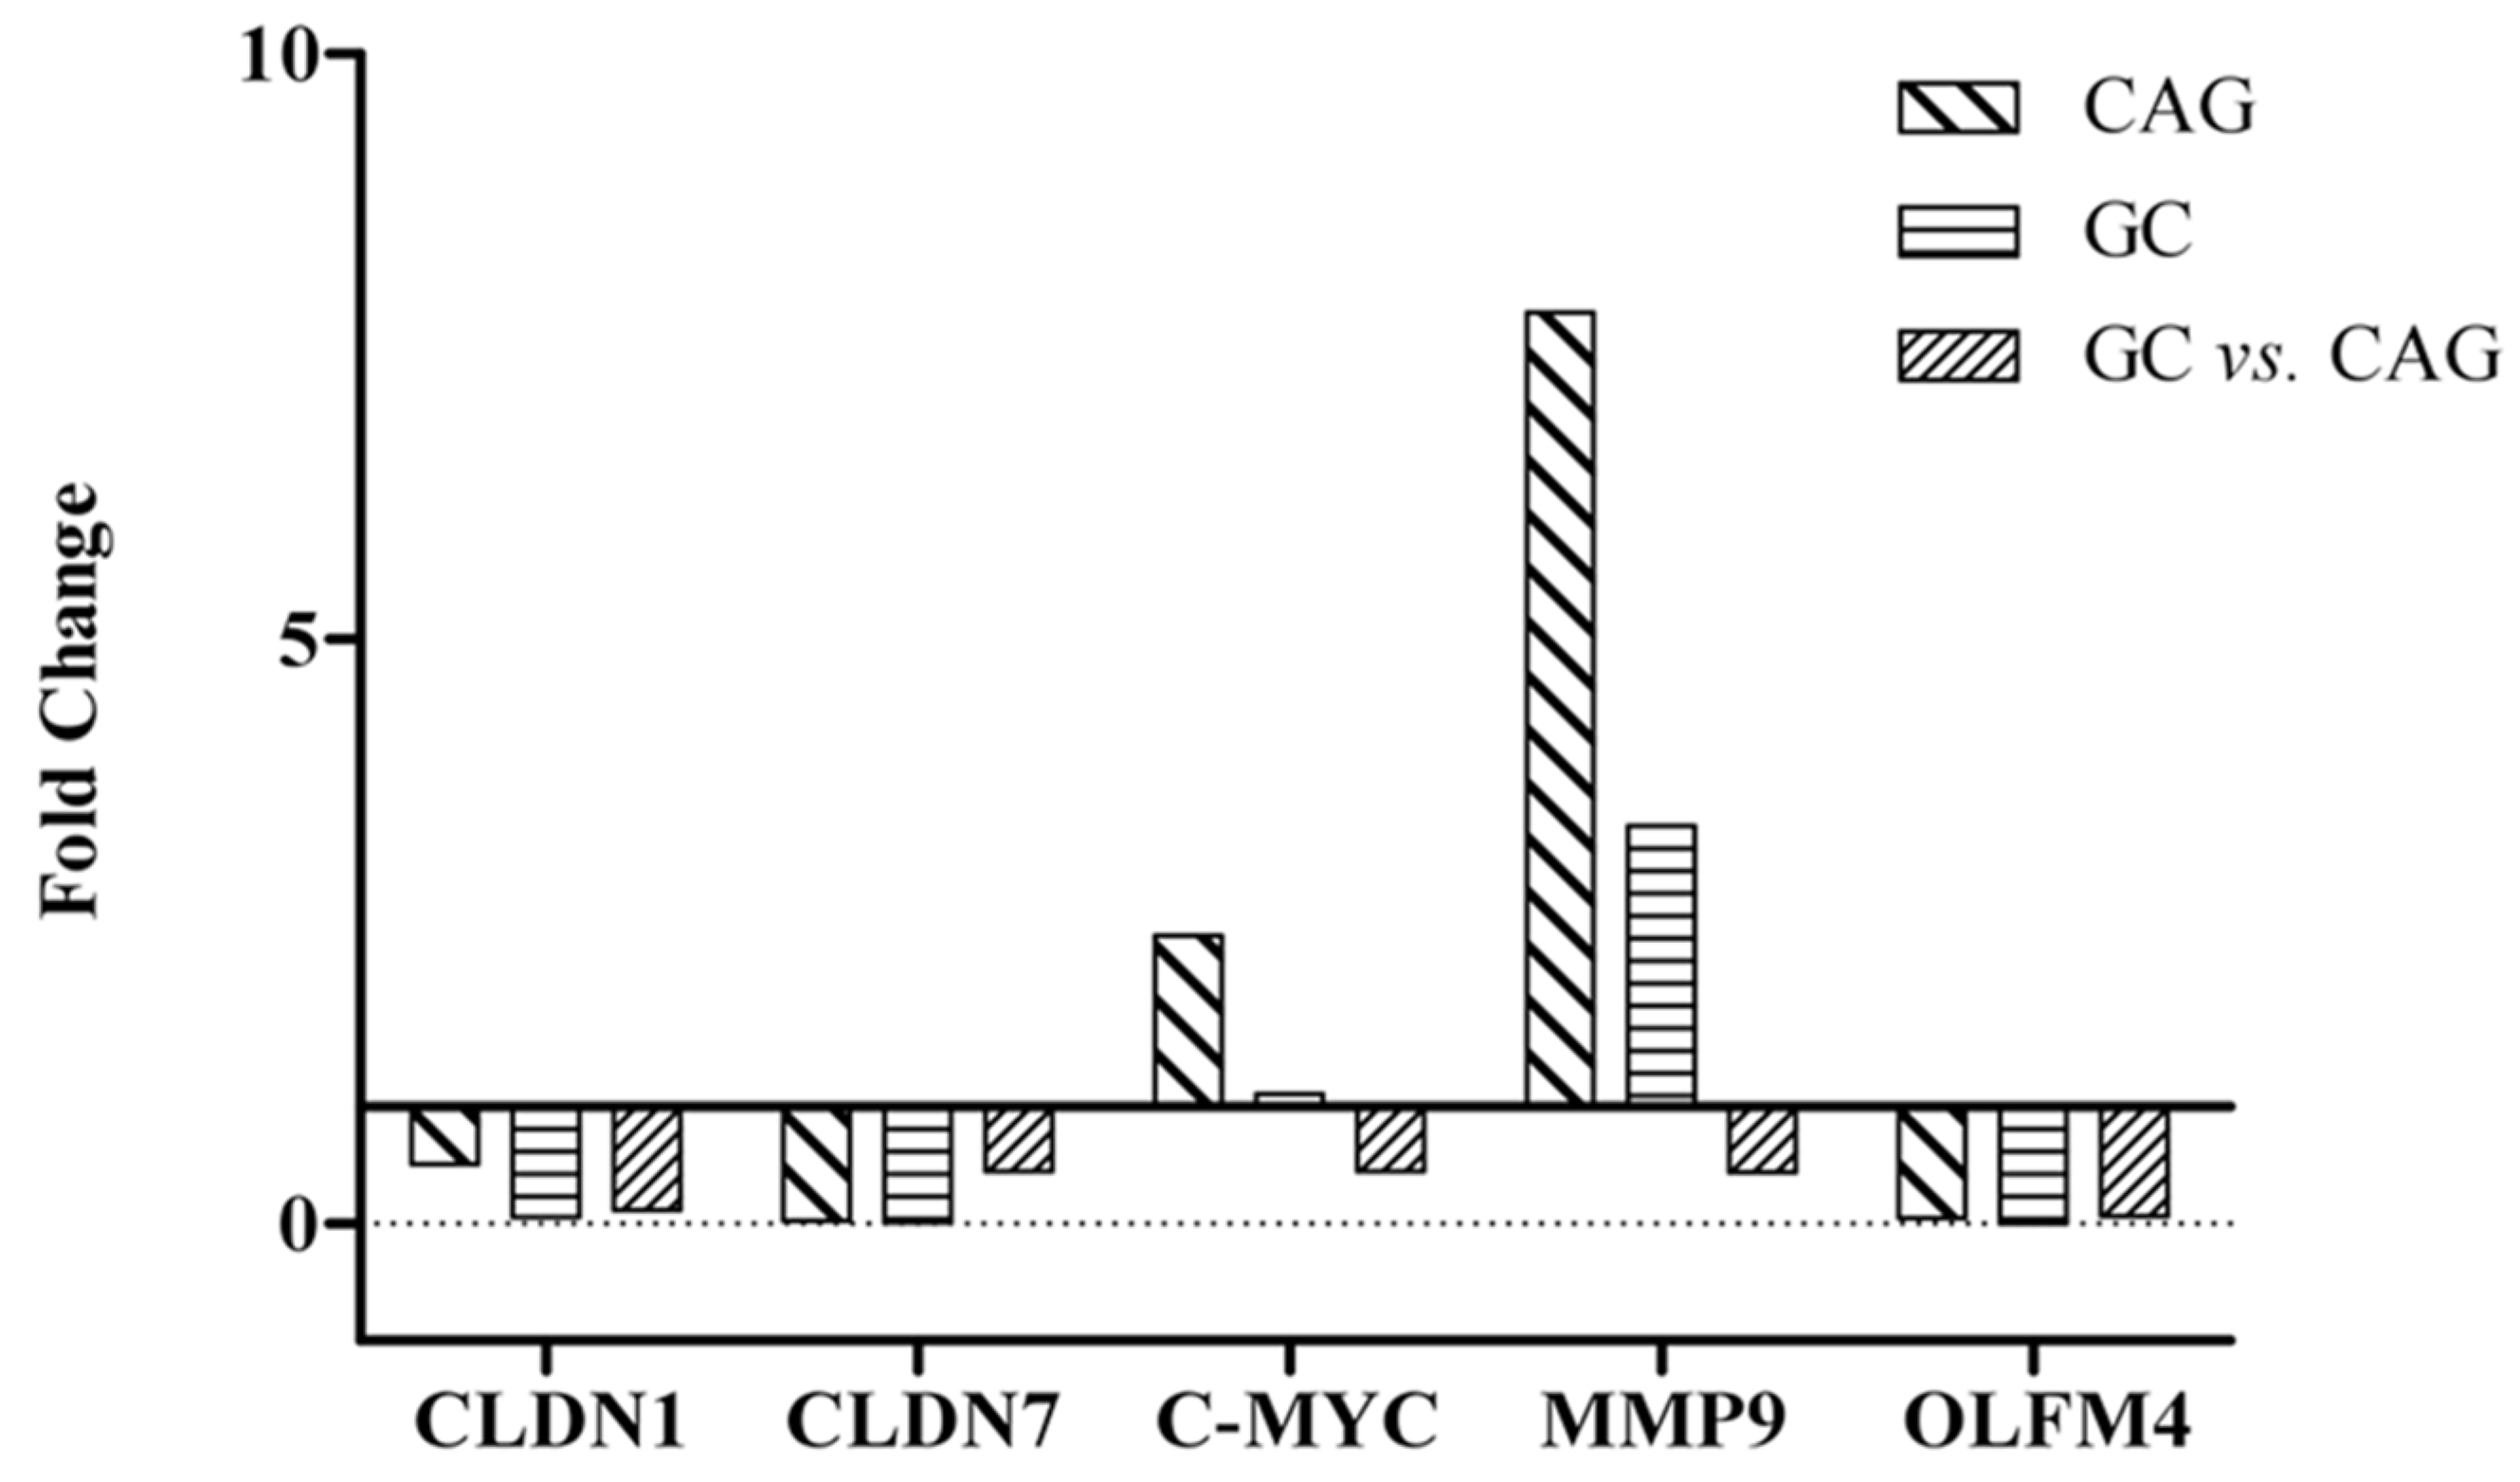
2.7. Amplification of Gene Expression by qPCR
2.8. Validation of Gene Assays
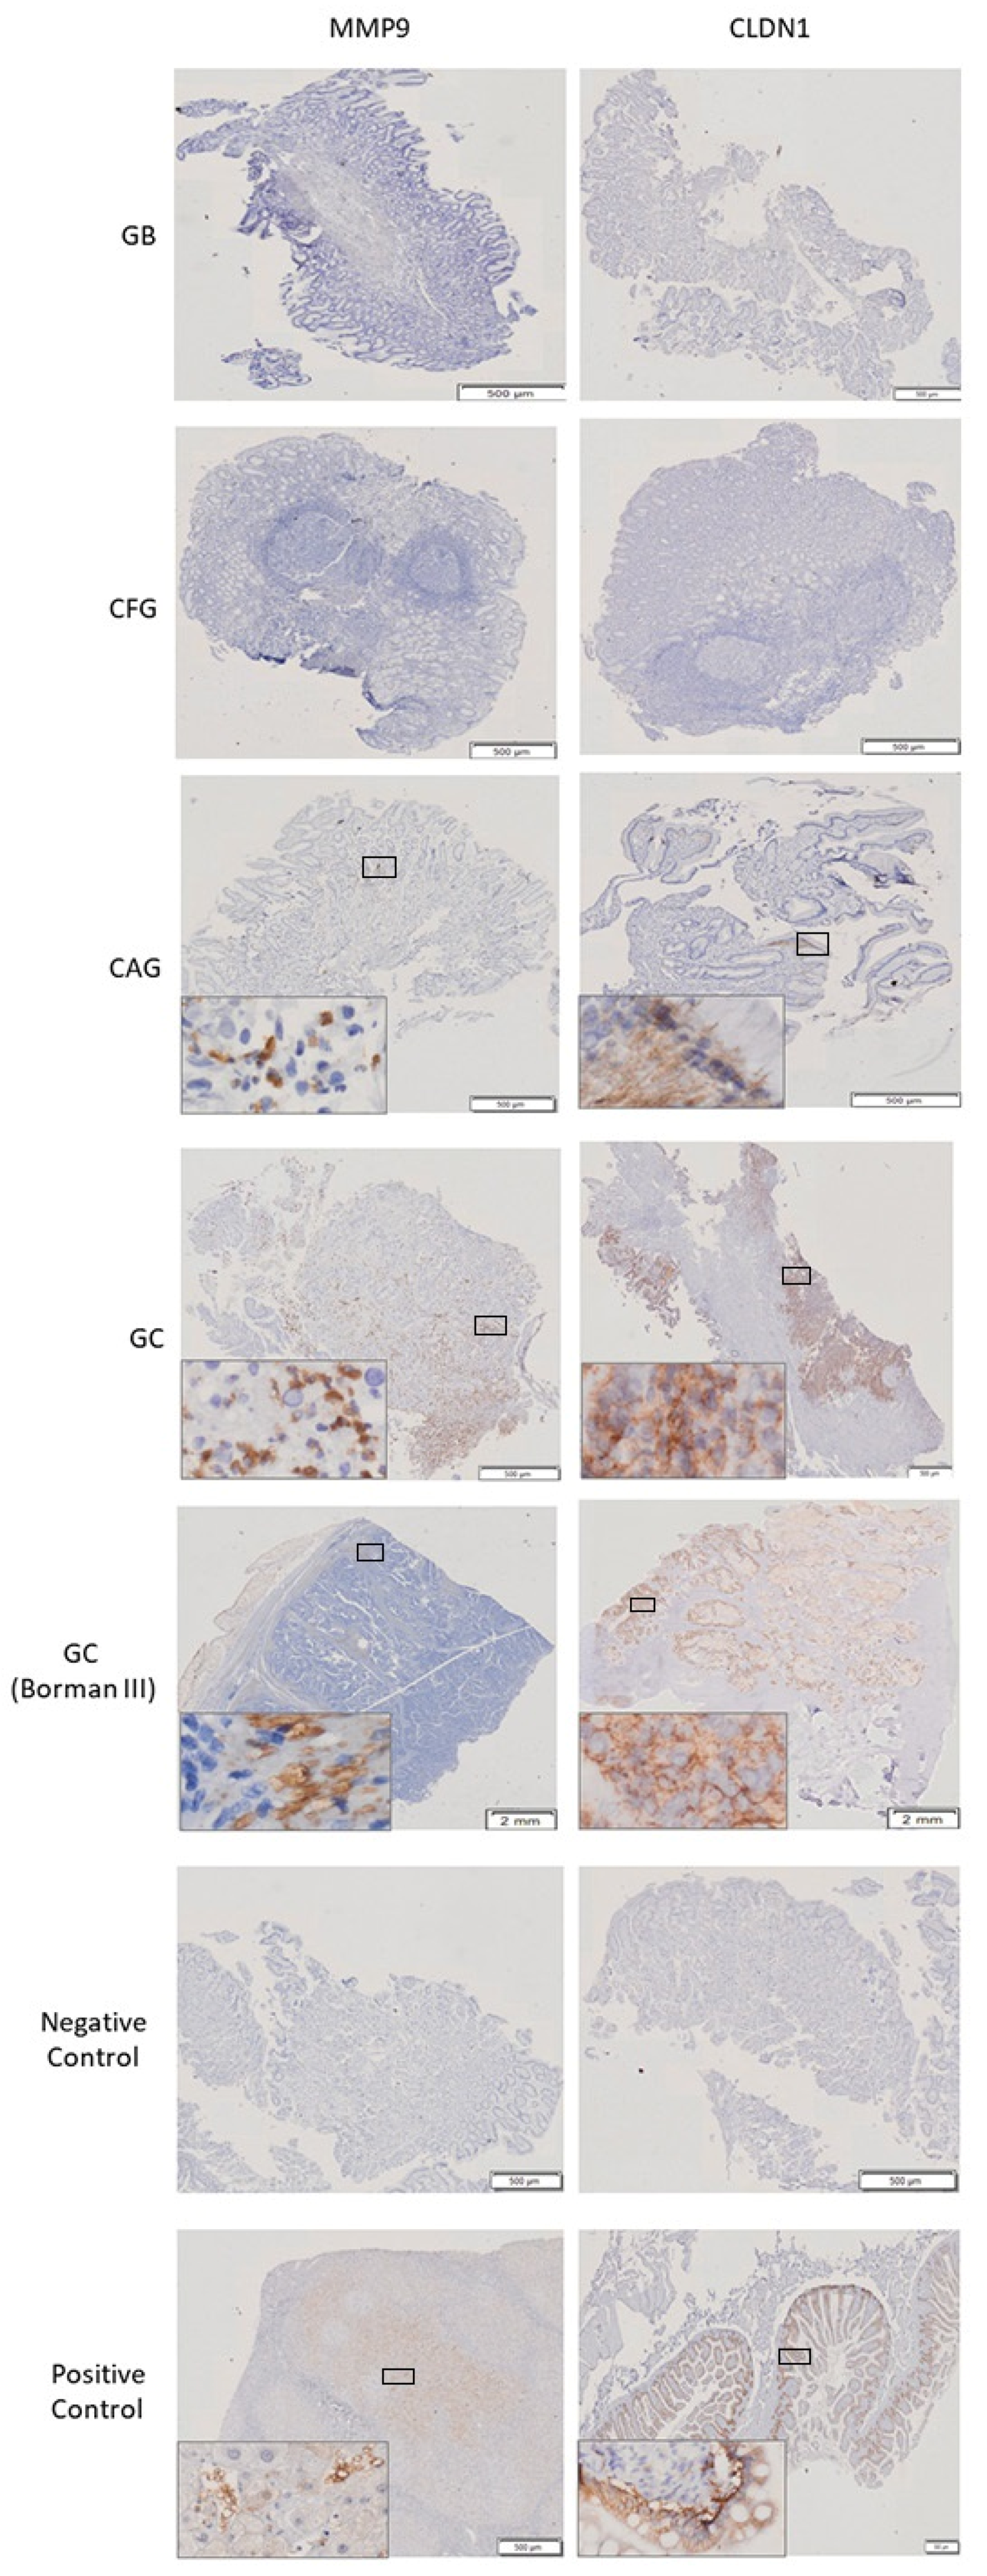
2.9. Immunohistochemistry of CLDN1 and MMP9
2.10. Statistical Analysis
3. Results
3.1. Clinical Characteristics of Enrolled Patients
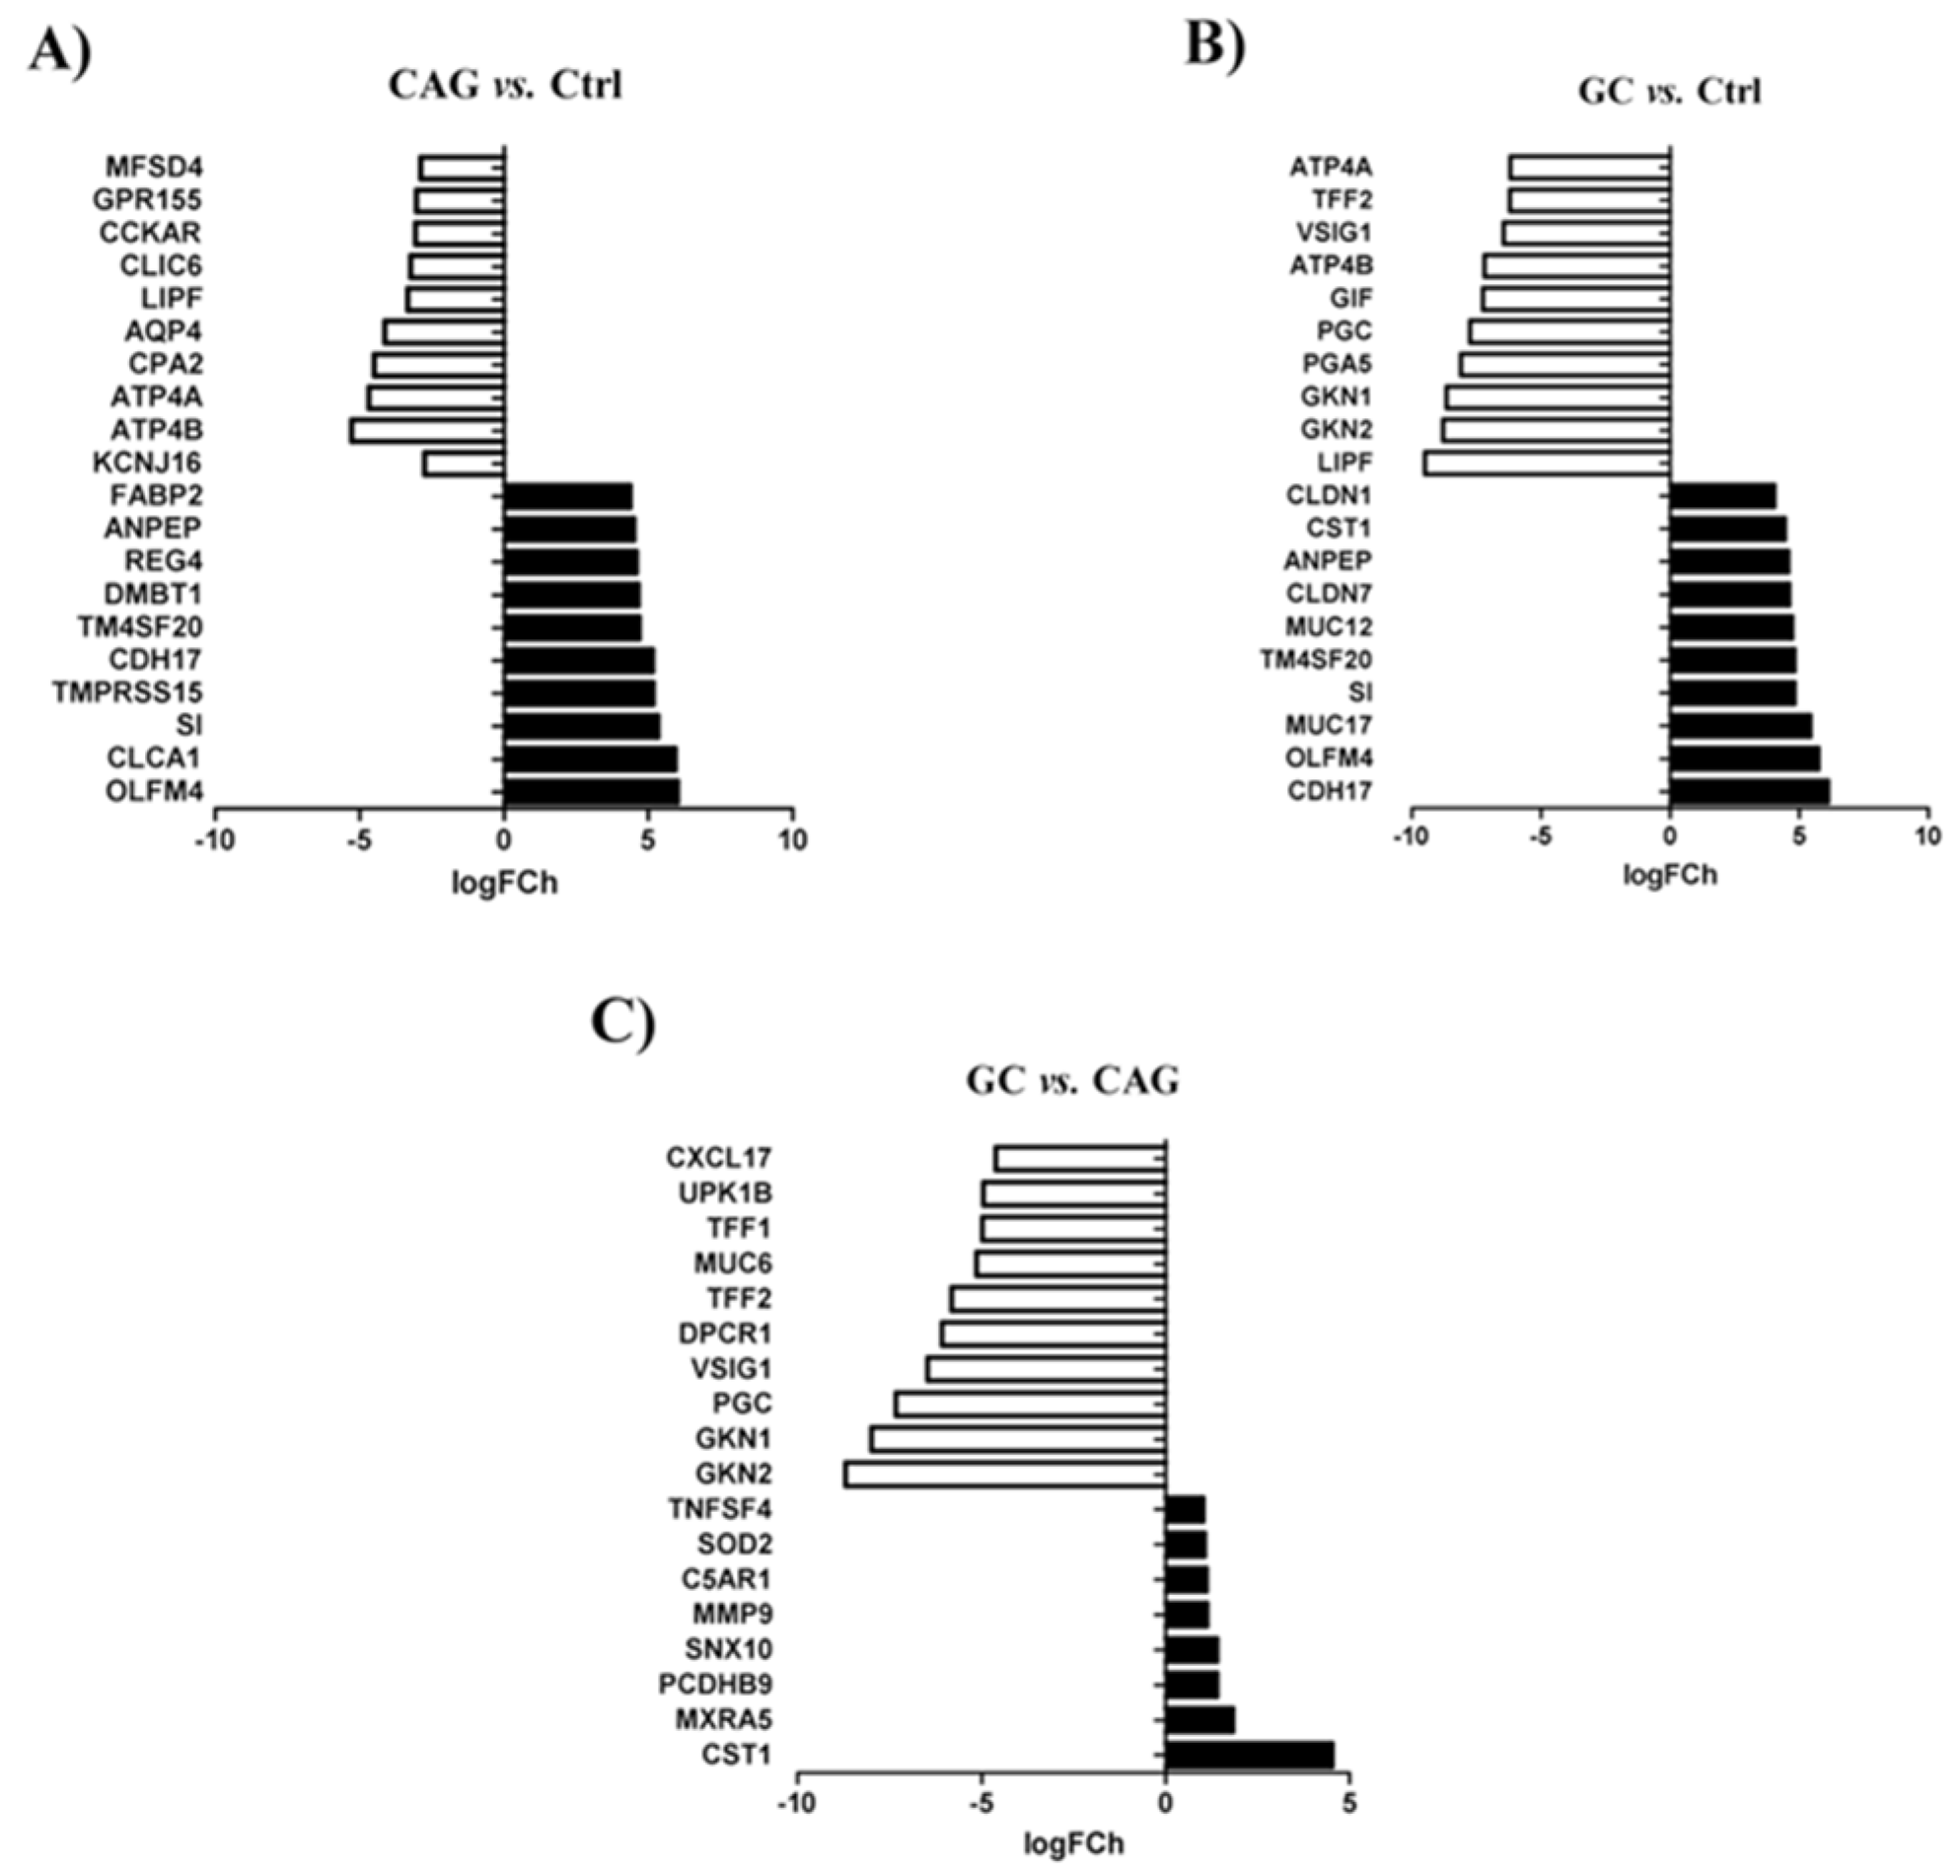
3.2. Differential Expression of Genes between the Study Groups
3.3. Differential Expression of Genes between Chronic Atrophic Gastritis and Gastric Cancer
3.4. Differential Expression of Genes between Chronic Atrophic Gastritis and the Control
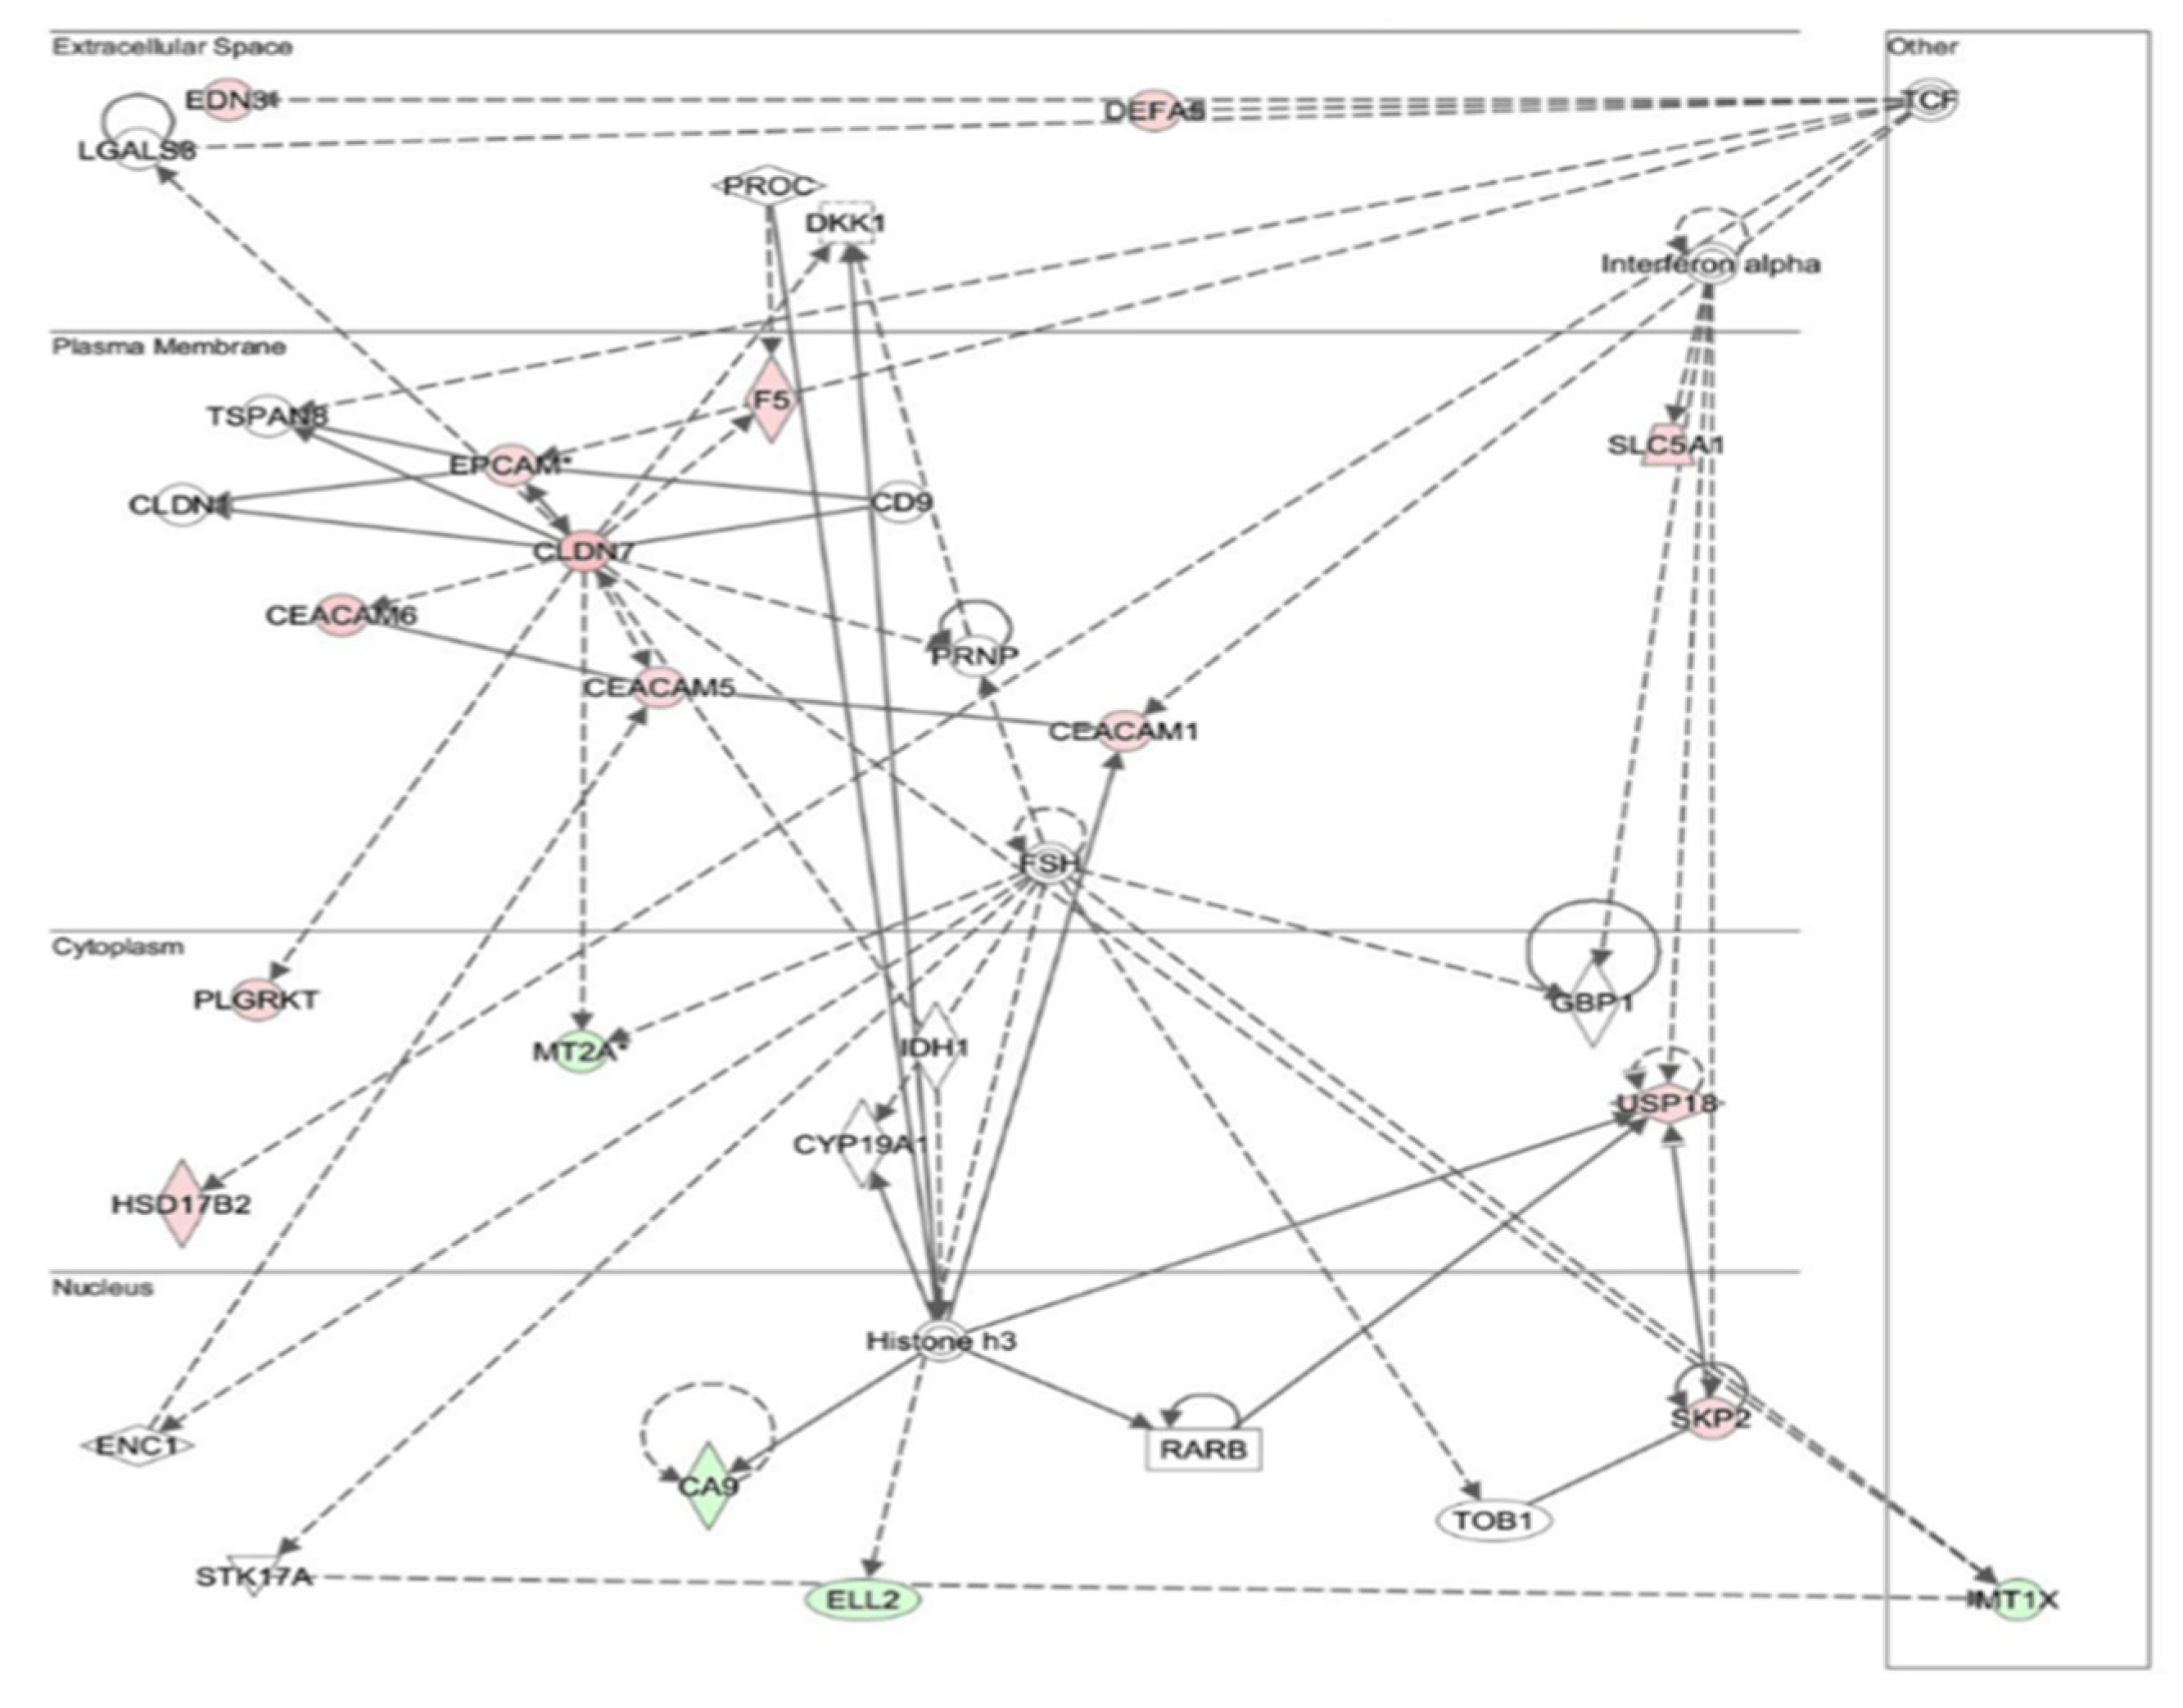
3.5. Significant Molecular Differences between Gastric Cancer and the Control Group
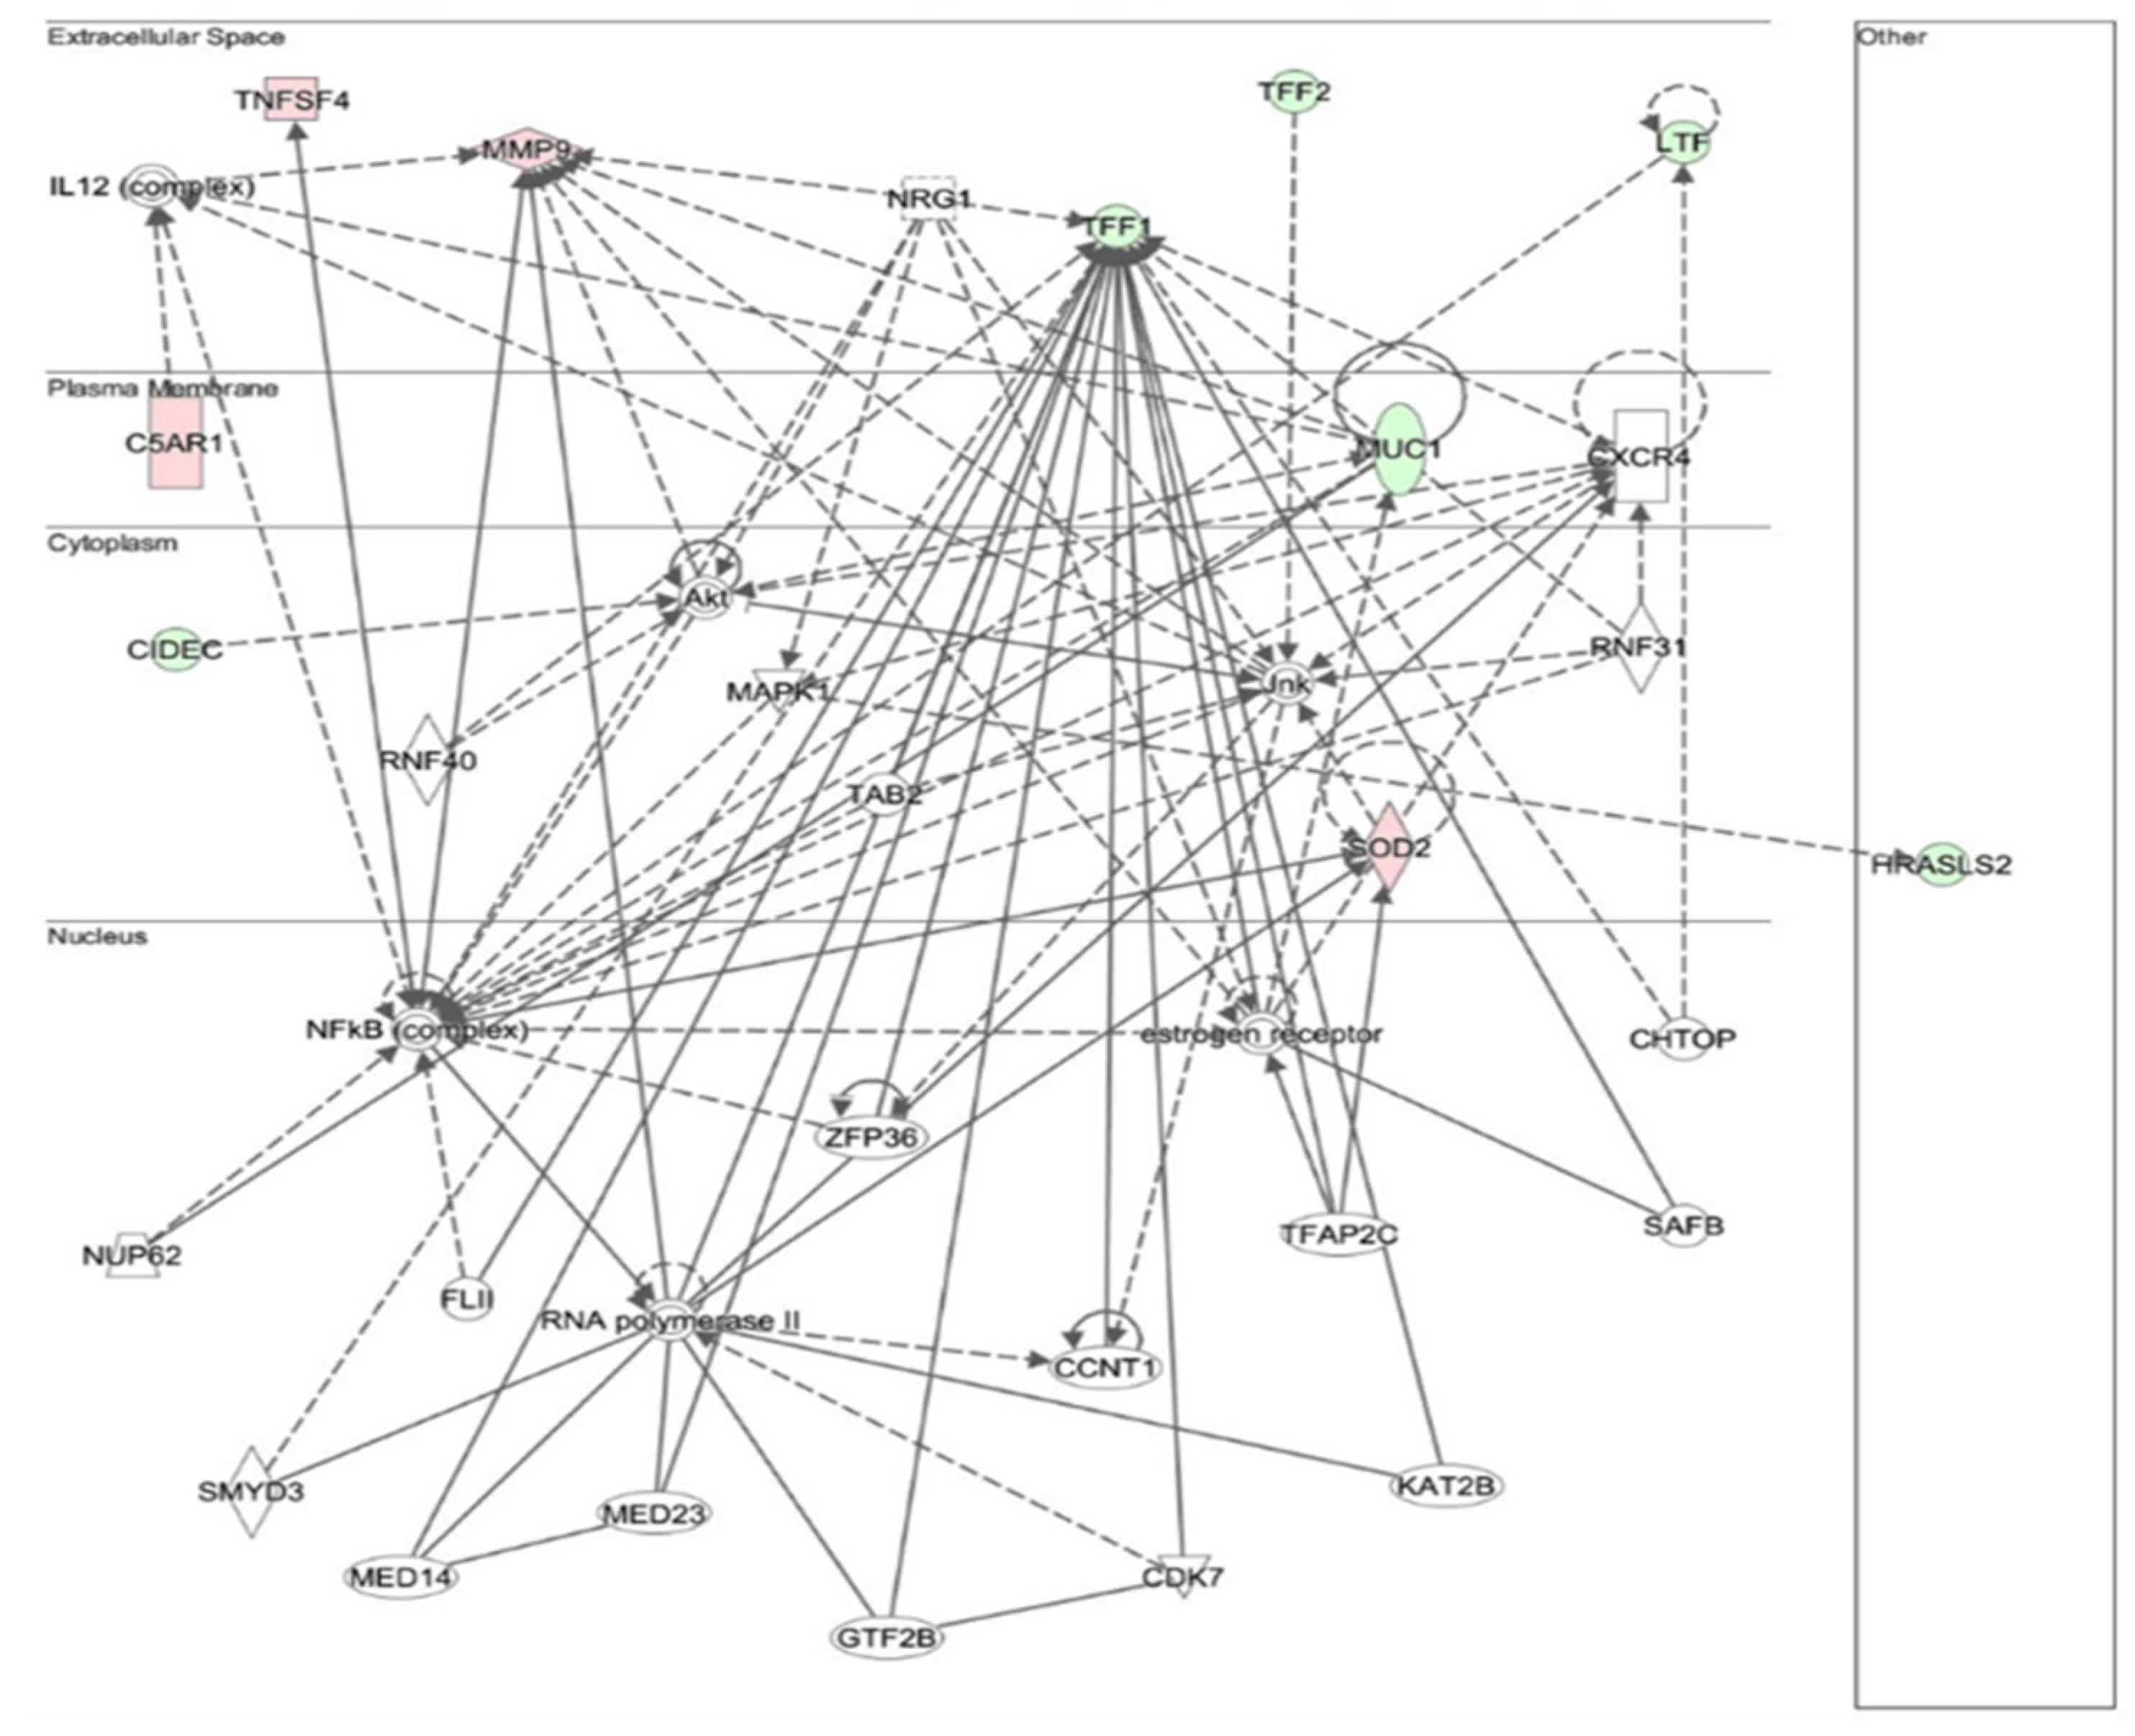
3.6. Biological Difference between Gastric Cancer and Chronic Atrophic Gastritis
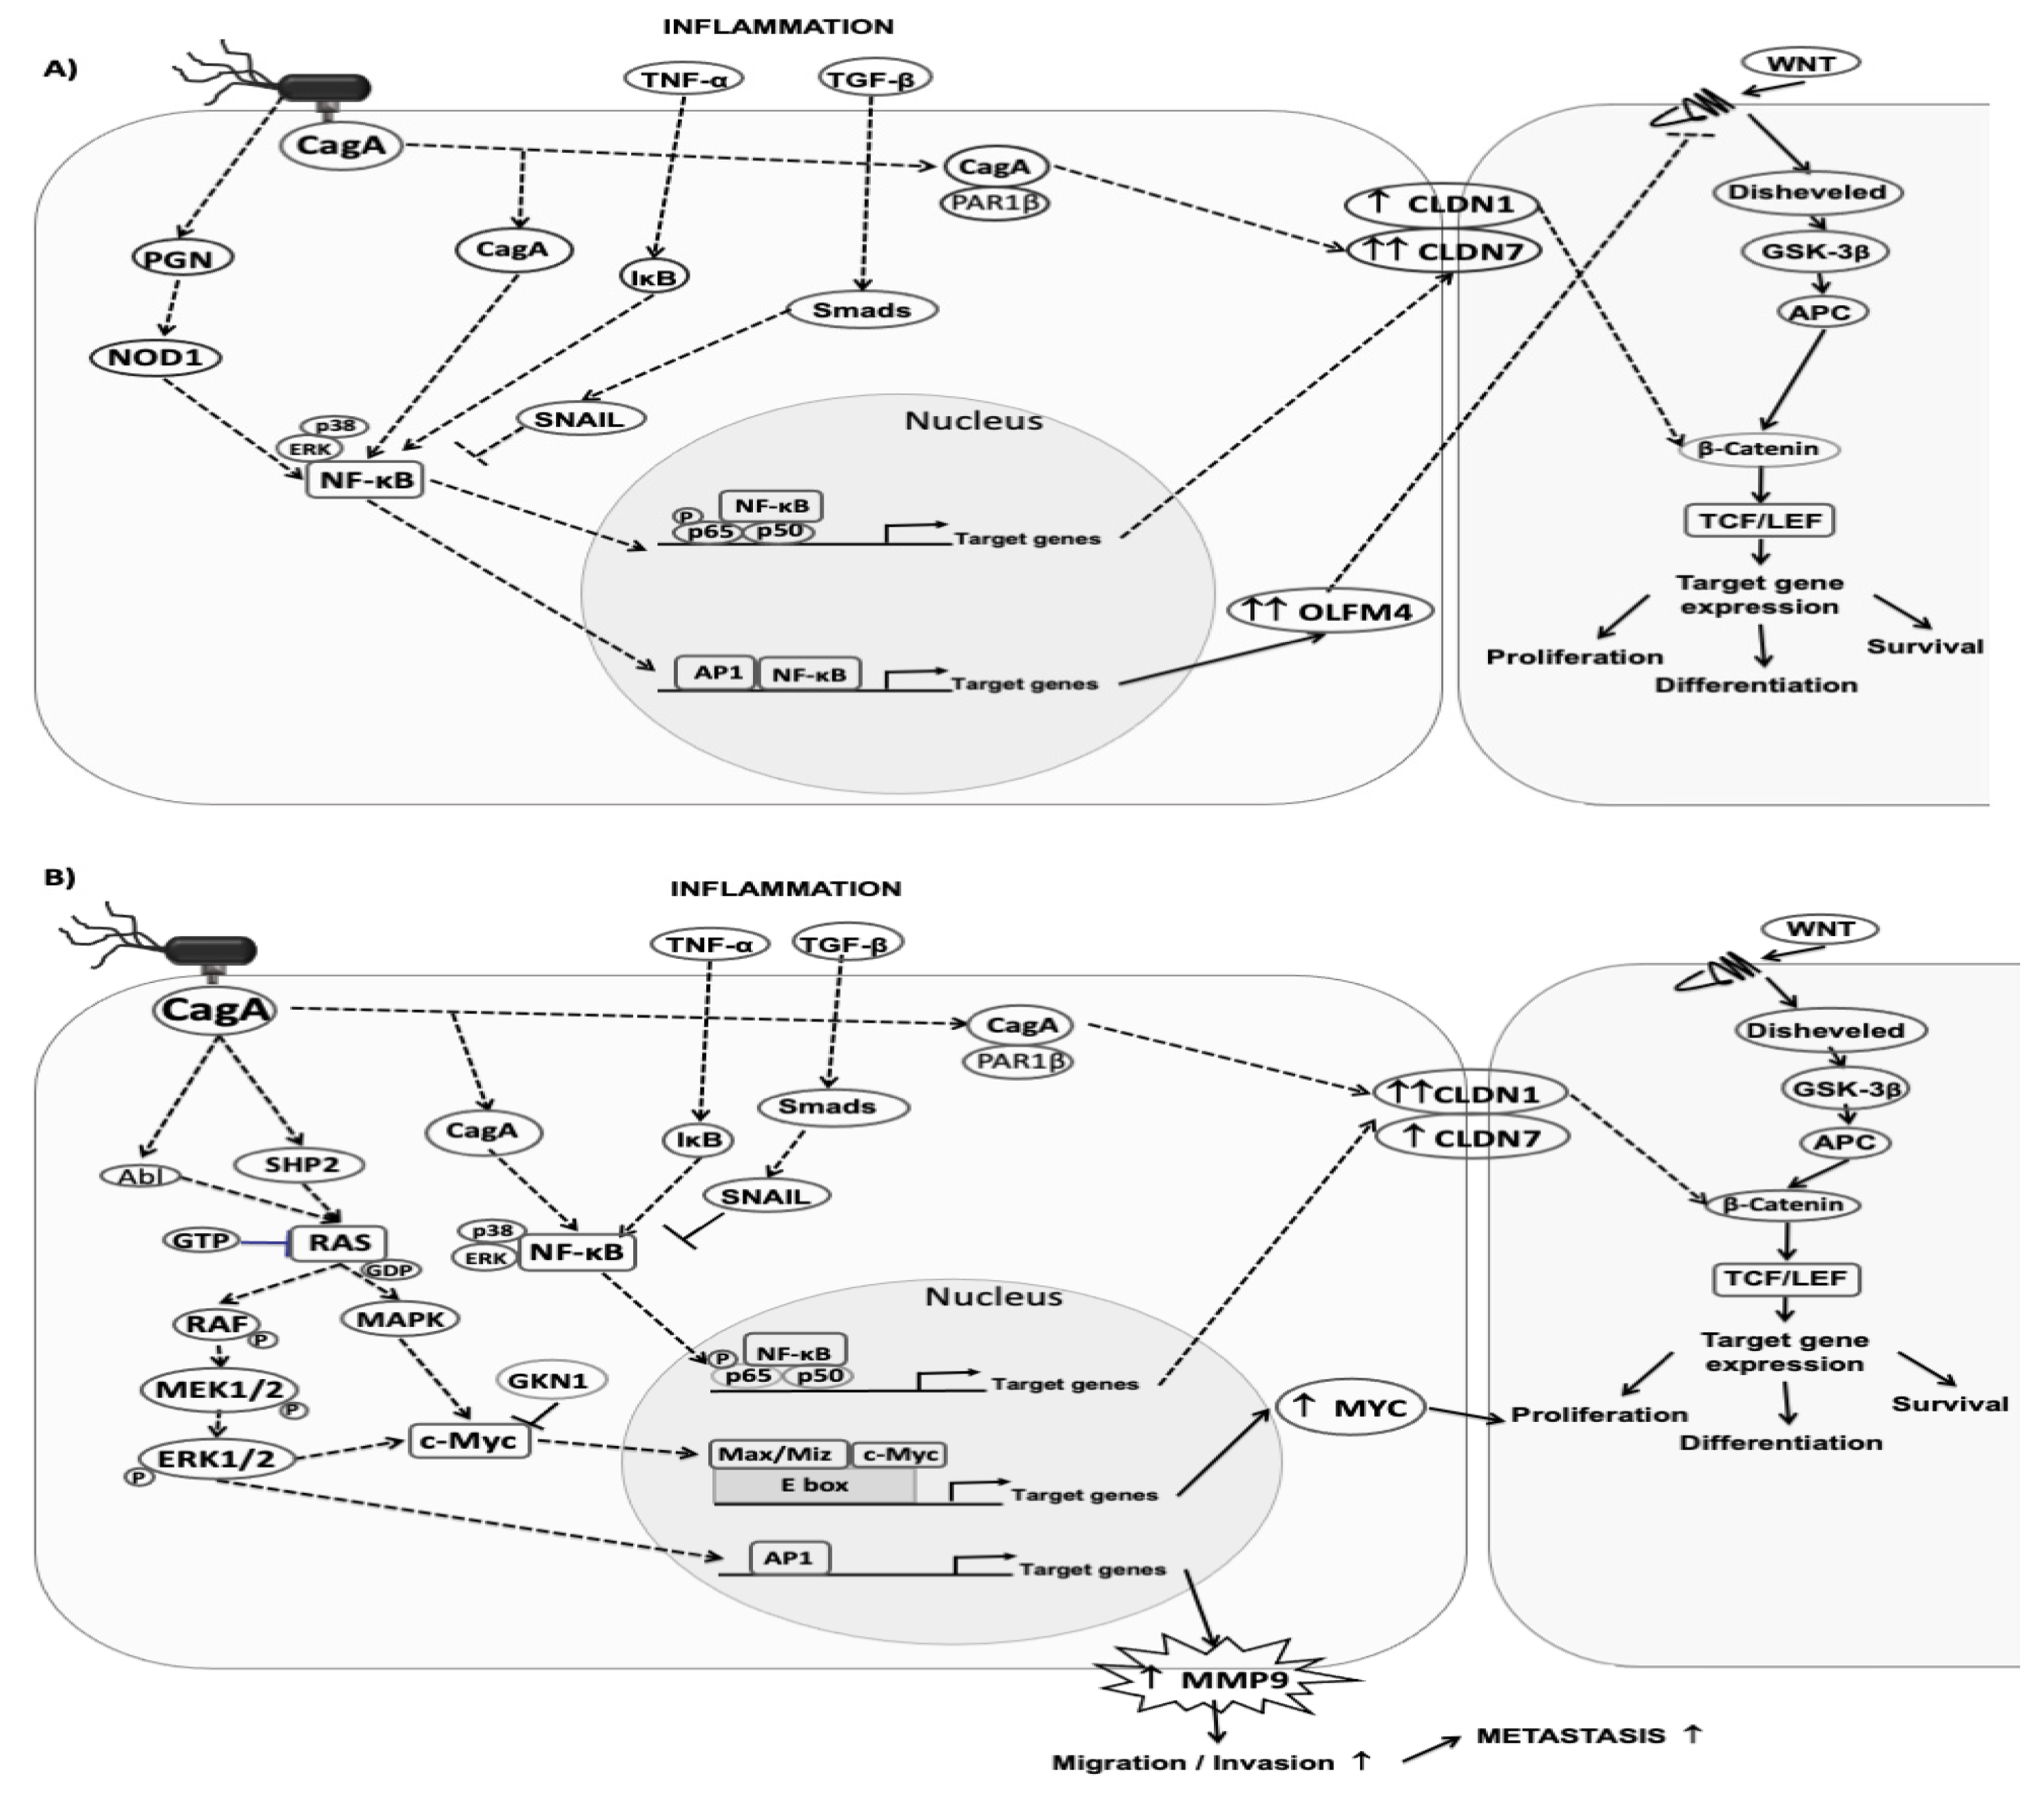
3.7. Changes in Gene Expression in Chronic Atrophic Gastritis Tissue May Be Involved in Carcinogenesis
4. Discussion
5. Conclusions
Supplementary Materials
Author Contributions
Funding
Institutional Review Board Statement
Informed Consent Statement
Data Availability Statement
Acknowledgments
Conflicts of Interest
References
- Ferlay, J.; Ervik, M.; Lam, F.; Colombet, M.; Mery, L.; Piñeros, M.; Znaor, A.; Soerjomataram, I.; Bray, F. Globocan 2020, Global Cancer Observatory: Cancer Today; International Agency for Research on Cancer: Lyon, France, 2020. [Google Scholar]
- Icaza-Chávez, M.E.; Tanimoto, M.A.; Huerta-Iga, F.M.; Remes-Troche, J.M.; Carmona-Sánchez, R.; Ángeles-Ángeles, A.; Bosques-Padilla, F.J.; Blancas-Valencia, J.M.; Grajales-Figueroa, G.; Hernández-Mondragón, O.V.; et al. Consenso mexicano sobre detección y tratamiento del cáncer gástrico incipiente. Rev. Gastroenterol. México 2020, 85, 69–85. [Google Scholar] [CrossRef]
- Li, R.; Zhang, H.; Cao, Y.; Liu, X.; Chen, Y.; Qi, Y.; Wang, J.; Yu, K.; Lin, C.; Liu, H.; et al. Lauren classification identifies distinct prognostic value and functional status of intratumoral CD8+ T cells in gastric cancer. Cancer Immunol. Immunother. 2020, 69, 1327–1336. [Google Scholar] [CrossRef] [PubMed]
- Stoicov, C.; Saffari, R.; Cai, X.; Hasyagar, C.; Houghton, J. Molecular biology of gastric cancer: Helicobacter infection and gastric adenocarcinoma: Bacterial and host factors responsible for altered growth signaling. Gene 2004, 341, 1–17. [Google Scholar] [CrossRef] [PubMed]
- Correa, P. Human gastric carcinogenesis: A multistep and multifactorial process—First American Cancer Society Award Lecture on Cancer Epidemiology and Prevention. Cancer Res. 1992, 52, 6735–6740. [Google Scholar]
- Polk, D.B.; Peek, R.M., Jr. Helicobacter pylori: Gastric Cancer and Beyond. Nat. Rev. Cancer 2010, 10, 403–414. [Google Scholar] [CrossRef] [Green Version]
- Fox, J.G.; Wang, T.C. Inflammation, Atrophy, and Gastric Cancer. J. Clin. Investig. 2007, 117, 60–69. [Google Scholar] [CrossRef]
- Hippo, Y.; Taniguchi, H.; Tsutsumi, S.; Machida, N.; Chong, J.-M.; Fukayama, M.; Kodama, T.; Aburatani, H. Global gene expression analysis of gastric cancer by oligonucleotide microarrays. Cancer Res. 2002, 62, 233–240. [Google Scholar]
- Kim, K.R.; Oh, S.Y.; Park, U.C.; Wang, J.H.; Lee, J.D.; Kweon, H.J.; Kim, S.Y.; Park, S.H.; Choi, D.K.; Gil Kim, C.; et al. Gene expression profiling using oligonucleotide microarray in atrophic gastritis and intestinal metaplasia. Korean J. Gastroenterol. 2007, 49, 209–224. [Google Scholar]
- Guzmán, M.; Rafael; Torres, L.T.; Cabrero, I.A.; Franco, H.M.; Zúñiga, R.B.; Carrillo, F.J.O.; Ocaña, L.F.O.; Orozco, A.F.; Velazco, A.E.; et al. Parámetros de Práctica Clínica Para El Tratamiento Integral del Cáncer Gástrico. Gac. Mex. Oncol. 2015, 14, 3–44. [Google Scholar]
- Stolte, M.; Meining, A. The Updated Sydney System: Classification and Grading of Gastritis as the Basis of Diagnosis and Treatment. Can. J. Gastroenterol. 2001, 15, 591–598. [Google Scholar] [CrossRef] [Green Version]
- Irizarry, R.A.; Hobbs, B.; Collin, F.; Beazer-Barclay, Y.D.; Antonellis, K.J.; Scherf, U.; Speed, T.P. Exploration, Normalization, and Summaries of High-Density Oligonucleotide Array Probe Level Data. Biostatistics 2003, 4, 249–264. [Google Scholar] [CrossRef] [Green Version]
- Gautier, L.; Cope, L.; Bolstad, B.M.; Irizarry, R.A. Affy—Analysis of Affymetrix GeneChip data at the probe level. Bioinformatics 2004, 20, 307–315. [Google Scholar] [CrossRef] [PubMed]
- Bolstad, B.M.; Irizarry, R.A.; Astrand, M.; Speed, T.P. A Comparison of Normalization Methods for High Density Oligonucleotide Array Data Based on Variance and Bias. Bioinformatics 2003, 19, 185–193. [Google Scholar] [CrossRef] [Green Version]
- Smyth, G.K. Linear Models and Empirical Bayes Methods for Assessing Differential Expression in Microarray Experiments. Stat. Appl. Genet. Mol. Biol. 2004, 3, 1–25. [Google Scholar] [CrossRef] [PubMed]
- Ritchie, M.E.; Phipson, B.; Wu, D.; Hu, Y.; Law, C.W.; Shi, W.; Smyth, G.K. Limma Powers Differential Expression Analyses for Rna-Sequencing and Microarray Studies. Nucleic Acids Res. 2015, 43, e47. [Google Scholar] [CrossRef]
- Huang, D.W.; Sherman, B.T.; Lempicki, R.A. Systematic and Integrative Analysis of Large Gene Lists Using David Bioinformatics Resources. Nat. Protoc. 2009, 4, 44–57. [Google Scholar] [CrossRef] [PubMed]
- Huang, D.W.; Sherman, B.T.; Lempicki, R.A. Bioinformatics Enrichment Tools: Paths toward the Comprehensive Functional Analysis of Large Gene Lists. Nucleic Acids Res. 2009, 37, 1–13. [Google Scholar] [CrossRef] [Green Version]
- Subramanian, A.; Tamayo, P.; Mootha, V.K.; Mukherjee, S.; Ebert, B.L.; Gillette, M.A.; Paulovich, A.; Pomeroy, S.L.; Golub, T.R.; Lander, E.S.; et al. Gene Set Enrichment Analysis: A Knowledge-Based Approach for Interpreting Genome-Wide Expression Profiles. Proc. Natl. Acad. Sci. USA 2005, 102, 15545–15550. [Google Scholar] [CrossRef] [Green Version]
- Mootha, V.K.; Lindgren, C.M.; Eriksson, K.F.; Subramanian, A.; Sihag, S.; Lehar, J.; Puigserver, P.; Carlsson, E.; Ridderstrale, M.; Laurila, E.; et al. Pgc-1alpha-Responsive Genes Involved in Oxidative Phosphorylation Are Coordinately Downregulated in Human Diabetes. Nat. Genet. 2003, 34, 267–273. [Google Scholar] [CrossRef]
- Matsuoka, T.; Adair, J.E.; Lih, F.B.; Hsi, L.C.; Rubino, M.; Eling, T.E.; Tomer, K.B.; Yashiro, M.; Hirakawa, K.; Olden, K.; et al. Elevated dietary linoleic acid increases gastric carcinoma cell invasion and metastasis in mice. Br. J. Cancer 2010, 103, 1182–1191. [Google Scholar] [CrossRef] [Green Version]
- Brown, D.G.; Rao, S.; Weir, T.L.; O’Malia, J.; Bazan, M.; Brown, R.J.; Ryan, E.P. Metabolomics and Metabolic Pathway Networks from Human Colorectal Cancers, Adjacent Mucosa, and Stool. Cancer Metab. 2016, 4, 11. [Google Scholar] [CrossRef] [Green Version]
- Gong, L.; Xia, Y.; Qian, Z.; Shi, J.; Luo, J.; Song, G.; Xu, J.; Ye, Z. Overexpression of MYC binding protein promotes invasion and migration in gastric cancer. Oncol. Lett. 2018, 15, 5243–5249. [Google Scholar] [CrossRef] [Green Version]
- Maues, J.; Ribeiro, H.F.; Pinto, G.R.; Lopes, L.O.; Lamarao, L.M.; Pessoa, C.M.F.; Moreira-Nunes, C.F.A.; de Carvalho, R.M.; Assumpcao, P.P.; Rey, J.A.; et al. Gastric Cancer Cell Lines Have Different Myc-Regulated Expression Patterns but Share a Common Core of Altered Genes. Can. J. Gastroenterol. Hepatol. 2018, 2018, 5804376. [Google Scholar] [CrossRef] [Green Version]
- Resnick, M.B.; Gavilanez, M.; Newton, E.; Konkin, T.; Bhattacharya, B.; Britt, D.E.; Sabo, E.; Moss, S.F. Claudin Expression in Gastric Adenocarcinomas: A Tissue Microarray Study with Prognostic Correlation. Hum. Pathol. 2005, 36, 886–892. [Google Scholar] [CrossRef] [PubMed]
- Huang, J.; Li, J.; Qu, Y.; Zhang, J.; Zhang, L.; Chen, X.; Liu, B.; Zhu, Z. The Expression of Claudin 1 Correlates with Beta-Catenin and Is a Prognostic Factor of Poor Outcome in Gastric Cancer. Int. J. Oncol. 2014, 44, 1293–1301. [Google Scholar] [CrossRef] [Green Version]
- Wu, Y.L.; Zhang, S.; Wang, G.R.; Chen, Y.P. Expression Transformation of Claudin-1 in the Process of Gastric Adenocarcinoma Invasion. World J Gastroenterol 2008, 14, 4943–4948. [Google Scholar] [CrossRef] [PubMed]
- Zavala-Zendejas, V.E.; Torres-Martinez, A.C.; Salas-Morales, B.; Fortoul, T.I.; Montaño, L.F.; Rendon-Huerta, E.P. Claudin-6, 7, or 9 Overexpression in the Human Gastric Adenocarcinoma Cell Line AGS Increases Its Invasiveness, Migration, and Proliferation Rate. Cancer Investig. 2010, 29, 1–11. [Google Scholar] [CrossRef]
- Eftang, L.L.; Esbensen, Y.; Tannaes, T.M.; Bukholm, I.R.; Bukholm, G. Interleukin-8 Is the Single Most up-Regulated Gene in Whole Genome Profiling of H. pylori Exposed Gastric Epithelial Cells. BMC Microbiol. 2012, 12, 9. [Google Scholar] [CrossRef] [PubMed] [Green Version]
- Rendon-Huerta, E.; Teresa, F.; Teresa, G.M.; Xochitl, G.-S.; Georgina, A.-F.; Veronica, Z.-Z.; Montaño, L.F. Distribution and Expression Pattern of Claudins 6, 7, and 9 in Diffuse- and Intestinal-Type Gastric Adenocarcinomas. J. Gastrointest. Cancer 2009, 41, 52–59. [Google Scholar] [CrossRef]
- Park, J.Y.; Park, K.H.; Oh, T.Y.; Hong, S.P.; Jeon, T.J.; Kim, C.H.; Park, S.W.; Chung, J.B.; Song, S.Y.; Bang, S. Up-regulated claudin 7 expression in intestinal-type gastric carcinoma. Oncol. Rep. 2007, 18, 377–382. [Google Scholar] [CrossRef] [Green Version]
- Johnson, A.H.; Frierson, H.F.; Zaika, A.; Powell, S.M.; Roche, J.; Crowe, S.; Moskaluk, C.A.; El-Rifai, W. Expression of Tight-Junction Protein Claudin-7 Is an Early Event in Gastric Tumorigenesis. Am. J. Pathol. 2005, 167, 577–584. [Google Scholar] [CrossRef] [Green Version]
- Gioannini, T.L.; Teghanemt, A.; Zhang, D.; Coussens, N.P.; Dockstader, W.; Ramaswamy, S.; Weiss, J. Isolation of an endotoxin-MD-2 complex that produces Toll-like receptor 4-dependent cell activation at picomolar concentrations. Proc. Natl. Acad. Sci. USA 2004, 101, 4186–4191. [Google Scholar] [CrossRef] [PubMed] [Green Version]
- Eftang, L.L.; Esbensen, Y.; Tannæs, T.M.; Blom, G.P.; Bukholm, I.R.; Bukholm, G. Up-regulation of CLDN1 in gastric cancer is correlated with reduced survival. BMC Cancer 2013, 13, 586. [Google Scholar] [CrossRef] [PubMed] [Green Version]
- Yoon, C.H.; Kim, M.J.; Park, M.J.; Park, I.C.; Hwang, S.G.; An, S.; Choi, Y.H.; Yoon, G.; Lee, S.J. Claudin-1 Acts through C-Abl-Protein Kinase Cdelta (Pkcdelta) Signaling and Has a Causal Role in the Acquisition of Invasive Capacity in Human Liver Cells. J. Biol. Chem. 2010, 285, 226–233. [Google Scholar] [CrossRef] [Green Version]
- Leotlela, P.D.; Wade, M.S.; Duray, P.H.; Rhode, M.J.; Brown, H.F.; Rosenthal, D.T.; Dissanayake, S.K.; Earley, R.; Indig, F.E.; Nickoloff, B.J.; et al. Claudin-1 overexpression in melanoma is regulated by PKC and contributes to melanoma cell motility. Oncogene 2006, 26, 3846–3856. [Google Scholar] [CrossRef] [Green Version]
- Gooz, M.; Gooz, P.; Smolka, A.J. Epithelial and Bacterial Metalloproteinases and Their Inhibitors in H. pylori Infection of Human Gastric Cells. Am. J. Physiol. Gastrointest. Liver Physiol. 2001, 281, G823–G832. [Google Scholar] [CrossRef] [PubMed] [Green Version]
- De Mingo, M.; Morán, A.; Sánchez-Pernaute, A.; Iniesta, P.; Díez-Valladares, L.; Pérez-Aguirre, E.; De Juan, C.; García-Aranda, C.; Díaz-López, A.; García-Botella, A.; et al. Expression of MMP-9 and TIMP-1 as prognostic markers in gastric carcinoma. Hepatogastroenterology 2007, 54, 315–319. [Google Scholar] [PubMed]
- Egeblad, M.; Werb, Z. New functions for the matrix metalloproteinases in cancer progression. Nat. Cancer 2002, 2, 161–174. [Google Scholar] [CrossRef]
- Kitamura, T.; Kometani, K.; Hashida, H.; Matsunaga, A.; Miyoshi, H.; Hosogi, H.; Aoki, M.; Oshima, M.; Hattori, M.; Taka-bayashi, A.; et al. Smad4-Deficient Intestinal Tumors Recruit Ccr1+ Myeloid Cells That Promote Invasion. Nat. Genet. 2007, 39, 467–475. [Google Scholar] [CrossRef]
- Huang, F.Y.; Chan, A.O.; Rashid, A.; Wong, D.K.; Seto, W.K.; Cho, C.H.; Lai, C.L.; Yuen, M.F. Interleukin-1 beta Increases the Risk of Gastric Cancer through Induction of Aberrant DNA Methylation in a Mouse Model. Oncol. Lett. 2016, 11, 2919–2924. [Google Scholar] [CrossRef] [PubMed] [Green Version]
- Zhang, Y.; Li, Y.; Ma, Y.; Liu, S.; She, Y.; Zhao, P.; Jing, M.; Han, T.; Yan, C.; Wu, Z.; et al. Dual Effects of Interleu-kin-18: Inhibiting Hepatitis B Virus Replication in HepG2.2.15 Cells and Promoting Hepatoma Cells Metastasis. Am. J. Physiol. Gastrointest Liver Physiol. 2011, 301, G565–G573. [Google Scholar] [CrossRef]
- Bekes, E.M.; Schweighofer, B.; Kupriyanova, T.A.; Zajac, E.; Ardi, V.C.; Quigley, J.P.; Deryugina, E.I. Tumor-Recruited Neutrophils and Neutrophil TIMP-Free MMP-9 Regulate Coordinately the Levels of Tumor Angiogenesis and Efficiency of Malignant Cell Intravasation. Am. J. Pathol. 2011, 179, 1455–1470. [Google Scholar] [CrossRef] [PubMed]
- Cools-Lartigue, J.; Spicer, J.; McDonald, B.; Gowing, S.; Chow, S.; Giannias, B.; Bourdeau, F.; Kubes, P.; Ferri, L. Neutrophil extracellular traps sequester circulating tumor cells and promote metastasis. J. Clin. Investig. 2013, 123, 3446–3458. [Google Scholar] [CrossRef] [PubMed]
- Houghton, A.M.; Quintero, P.A.; Perkins, D.L.; Kobayashi, D.K.; Kelley, D.G.; Marconcini, L.A.; Mecham, R.P.; Senior, R.M.; Shapiro, S.D. Elastin fragments drive disease progression in a murine model of emphysema. J. Clin. Investig. 2006, 116, 753–759. [Google Scholar] [CrossRef]
- Ramteke, A.; Ting, H.; Agarwal, C.; Mateen, S.; Somasagara, R.; Hussain, A.; Graner, M.; Frederick, B.; Agarwal, R.; Deep, G. Exosomes secreted under hypoxia enhance invasiveness and stemness of prostate cancer cells by targeting adherens junction molecules. Mol. Carcinog. 2013, 54, 554–565. [Google Scholar] [CrossRef] [PubMed] [Green Version]


| Clinical Entity | N | Age * | Gender | Pathological Diagnosis |
|---|---|---|---|---|
| Follicular gastritis (control group) | 7 | 45 ± 3.6 | M | Chronic follicular gastritis demonstrating activity associated with H. pylori and scarce bacilli in the body and antrum |
| F | Chronic follicular gastritis with a moderate activity associated with H. pylori in the antral mucosa | |||
| M | Chronic follicular gastritis with moderate activity in the antrum and body, associated with moderate bacilli H. pylori | |||
| F | Chronic follicular gastritis with a moderate activity associated with H. pylori and a moderate amount in the antrum | |||
| F | Chronic follicular gastritis with a moderate activity associated with H. pylori and scarce bacilli in the antrum and body | |||
| F | Chronic follicular gastritis moderate with a moderate activity associated with H. pylori in the mucous membrane of the antrum | |||
| F | Chronic follicular gastritis with a mild activity associated with H. pylori and scarce bacilli in the antrum and body | |||
| Chronic atrophic gastritis | 3 | 67 ± 1.76 | F | Chronic atrophic gastritis with an intense activity associated in the antrum |
| F | Chronic atrophic gastritis with complete intestinal metaplasia | |||
| F | Chronic atrophic gastritis with a mild activity associated with complete intestinal metaplasia in the antral mucosa and chronic follicular gastritis with a mild activity associated with complete intestinal metaplasia in the oxyntic mucosa | |||
| Gastric cancer | 3 | 59 ± 10.07 | F | Gastric adenocarcinoma of intestinal type well differentiated in the antrum. There is no residual mucosa, so immunohistochemistry will not be performed |
| F | Gastric adenocarcinoma of the intestinal type with mucinous areas | |||
| F | Gastric adenocarcinoma of the intestinal type |
| KEGG Pathway | Genes | % | Enrichment | p-Value | Benjamini |
|---|---|---|---|---|---|
| Drug metabolism | 6 | 2.79 | 10.4343 | 0.0002 | 0.0203 |
| Caffeine metabolism | 3 | 1.40 | 32.0483 | 0.0034 | 0.1467 |
| Arginine and proline metabolism | 5 | 2.33 | 7.0547 | 0.0050 | 0.1416 |
| PPAR signaling pathway | 5 | 2.33 | 5.4188 | 0.0125 | 0.2517 |
| Histidine metabolism | 3 | 1.40 | 7.7358 | 0.0553 | 0.6487 |
| Alanine, aspartate, and glutamate metabolism | 3 | 1.40 | 7.2367 | 0.0623 | 0.6268 |
| KEGG Pathway | Genes | % | Enrichment | p-Value | Benjamini |
|---|---|---|---|---|---|
| Arrhythmogenic right ventricular cardiomyopathy | 10 | 2.02 | 4.3447 | 0.0004 | 0.0568 |
| Arginine and proline metabolism | 8 | 1.62 | 4.9841 | 0.0009 | 0.0653 |
| Nitrogen metabolism | 5 | 1.01 | 7.1781 | 0.0045 | 0.1933 |
| Tight junction | 11 | 2.22 | 2.7106 | 0.0067 | 0.2163 |
| Leukocyte transendothelial migration | 10 | 2.02 | 2.7983 | 0.0087 | 0.2230 |
| Histidine metabolism | 5 | 1.01 | 5.6930 | 0.0104 | 0.2222 |
| Maturity onset diabetes of the young | 4 | 0.81 | 5.2831 | 0.0378 | 0.5477 |
| Glycerolipid metabolism | 5 | 1.01 | 3.6688 | 0.0452 | 0.5652 |
| P53 signaling pathway | 6 | 1.21 | 2.9135 | 0.0529 | 0.5754 |
| Dilated cardiomyopathy | 7 | 1.41 | 2.5124 | 0.0578 | 0.5754 |
| Focal adhesion | 11 | 2.22 | 1.8070 | 0.0799 | 0.6638 |
| KEGG Pathway | Genes | % | Enrichment | p-Value | Benjamini |
|---|---|---|---|---|---|
| Linoleic acid metabolism | 2 | 4.35 | 25.9439 | 0.0693 | 0.7942 |
| Fructose and mannose metabolism | 2 | 4.35 | 21.3655 | 0.0836 | 0.6173 |
| Genes | Microarray Fold Change | qPCR 2−ΔΔCt | ||||
|---|---|---|---|---|---|---|
| CAG | GC | GC vs. CAG | CAG | GC | GC vs. CAG | |
| Claudin-1 | 3.42 | 6.04 | 4.62 | 0.51 | 0.06 | 0.12 |
| Claudin-7 | 5.89 | 6.62 | 2.72 | 0.03 | 0.01 | 0.45 |
| MYC | 2.50 | 3.43 | 2.93 | 2.46 | 1.11 | 0.45 |
| Matrix metalloproteinase-9 | 1.55 | 2.68 | 3.13 | 7.79 | 3.40 | 0.44 |
| Olfactomedin-4 | 8.02 | 7.75 | 1.73 | 0.05 | 0.003 | 0.06 |
| Clinical Entity | N | Age * | Gender | Pathological Diagnosis | |
|---|---|---|---|---|---|
| F | M | ||||
| Gastric biopsy without alterations | 18 | 49 ± 4.58 | 13 | 5 | Gastric biopsy without significant histological alterations in antral or oxyntic mucosa |
| Follicular gastritis | 20 | 56 ± 3.73 | 14 | 6 | Chronic follicular gastritis with a mild or moderate activity, associated with H. pylori infection in the antrum, body, or oxyntic mucosa |
| Chronic atrophic gastritis | 20 | 68 ± 2.80 | 12 | 8 | Non-metaplastic chronic atrophic gastritis in the fund, antrum, or body |
| Gastric cancer | 24 | 60 ± 3.56 | 10 | 14 | Moderately—poorly differentiated adenocarcinoma intestinal type (13) |
| Moderately—poorly differentiated, invasive and ulcerated intestinal type adenocarcinoma (6) | |||||
| Gastric adenocarcinoma of the intestinal type (1) | |||||
| Well-differentiated intestinal adenocarcinoma (1) | |||||
| Intestinal adenocarcinoma with papillary pattern (1) | |||||
| Moderately differentiated, ulcerated intestinal adenocarcinoma (T3). Gastric Resection (3) | |||||
| Positive control CLDN1 | 1 | 75 | F | Right colon biopsy | |
| Positive control MMP9 | 1 | 40 | M | Liver explant | |
Publisher’s Note: MDPI stays neutral with regard to jurisdictional claims in published maps and institutional affiliations. |
© 2022 by the authors. Licensee MDPI, Basel, Switzerland. This article is an open access article distributed under the terms and conditions of the Creative Commons Attribution (CC BY) license (https://creativecommons.org/licenses/by/4.0/).
Share and Cite
Rivas-Ortiz, C.I.; Morales-Guerrero, S.E.; Ponce-de-León-Rosales, S.; Gamboa-Domínguez, A.; Rangel-Escareño, C.; Uscanga-Domínguez, L.F.; Aguilar-Gutiérrez, G.R.; Kershenobich-Stalnikowitz, D.; López-Vidal, Y.; Castillo-Rojas, G. Overview of Gene Expression Analysis in Gastric Disease Infected with Helicobacter pylori: CLDN1 and MMP9 Could Be Biomarkers for Early Diagnosis of Gastric Cancer. Processes 2022, 10, 196. https://doi.org/10.3390/pr10020196
Rivas-Ortiz CI, Morales-Guerrero SE, Ponce-de-León-Rosales S, Gamboa-Domínguez A, Rangel-Escareño C, Uscanga-Domínguez LF, Aguilar-Gutiérrez GR, Kershenobich-Stalnikowitz D, López-Vidal Y, Castillo-Rojas G. Overview of Gene Expression Analysis in Gastric Disease Infected with Helicobacter pylori: CLDN1 and MMP9 Could Be Biomarkers for Early Diagnosis of Gastric Cancer. Processes. 2022; 10(2):196. https://doi.org/10.3390/pr10020196
Chicago/Turabian StyleRivas-Ortiz, Claudia Ivette, Stephanie Euridice Morales-Guerrero, Sergio Ponce-de-León-Rosales, Armando Gamboa-Domínguez, Claudia Rangel-Escareño, Luis Federico Uscanga-Domínguez, Germán Rubén Aguilar-Gutiérrez, David Kershenobich-Stalnikowitz, Yolanda López-Vidal, and Gonzalo Castillo-Rojas. 2022. "Overview of Gene Expression Analysis in Gastric Disease Infected with Helicobacter pylori: CLDN1 and MMP9 Could Be Biomarkers for Early Diagnosis of Gastric Cancer" Processes 10, no. 2: 196. https://doi.org/10.3390/pr10020196
APA StyleRivas-Ortiz, C. I., Morales-Guerrero, S. E., Ponce-de-León-Rosales, S., Gamboa-Domínguez, A., Rangel-Escareño, C., Uscanga-Domínguez, L. F., Aguilar-Gutiérrez, G. R., Kershenobich-Stalnikowitz, D., López-Vidal, Y., & Castillo-Rojas, G. (2022). Overview of Gene Expression Analysis in Gastric Disease Infected with Helicobacter pylori: CLDN1 and MMP9 Could Be Biomarkers for Early Diagnosis of Gastric Cancer. Processes, 10(2), 196. https://doi.org/10.3390/pr10020196