Article

Isolation and Purification of Mustard Glucosinolates by Macroporous Anion-Exchange Resin: Process Optimization and Kinetics’ Modelling

Centre de Recherches de Royallieu, Laboratoire Transformations Integrees de la Matiere Renouvelable (UTC/ESCOM, EA 4297 TIMR), Universite de Technologie de Compiegne, Sorbonne Universites, CEDEX CS 60319, 60200 Compiegne, France
*
Author to whom correspondence should be addressed.
Processes 2022, 10(2), 191; https://doi.org/10.3390/pr10020191
Submission received: 26 December 2021 / Revised: 4 January 2022 / Accepted: 6 January 2022 / Published: 18 January 2022

Abstract

:
Glucosinolates (GSL) (β-thioglucoside-N-hydroxy sulfates) are rich-sulfur secondary metabolites raising potential biofumigation interest due to their biological properties. Sinigrin and gluconapin are the main glucosinolates present in brown mustard seeds (Brassica juncea). These glucosinolates are very suitable for the development of phytosanitary products due to their fungicidal, bactericidal and insecticidal effects. In this work, the purification of sinigrin and gluconapin extracted from defatted mustard seeds was studied using macroporous anion exchange resins. A strongly and a weakly anionic resin were first tested according to the nature of their functional group and through their selectivity towards glucosinolates. Anion-exchange resin purification was first studied in static (batch) mode in order to determine the optimal operating conditions; it was then tested in a dynamic (continuous) mode (column) to validate the process. In static mode, the adsorption behavior and characteristics of both resins were compared. The results showed that the strongly basic resin PA312LOH ensures better adsorption of glucosinolates and that the experimental data fit well with the Freundlich isotherm. Moreover, analysis showed that PA312LOH resin was selective for glucosinolates purification towards the proteins. The desorption of glucosinolates was then investigated. Firstly, the operating conditions were optimized by studying the effects of salt concentration and the eluate-resin ratio. This preliminary optimization allowed recovering 72.9% of intact sinigrin and the juice purity was increased from 43.05% to 79.63%. Secondly, dynamic (continuous mode) experiments allowed the recovery of 64.5% of sinigrin and 28% of gluconapin by varying the eluent ionic strength and the flow rate. Resin was finally successfully regenerated using NaOH.

1. Introduction

Glucosinolates (GSL) (β-thioglucoside-N-hydroxy sulfates) are rich-sulfur secondary metabolites raising potential biofumigation interest due to their biological properties. These molecules are inactive in their native form but they are precursors of various highly reactive products presenting fungicidal, bactericidal and insecticidal properties [1,2,3,4,5,6]. These properties raise the interest of GSL as natural biopesticides and suitable biofumigant agents for crop protection instead of chemical products [7,8]. Brassica juncea, commonly known as Indian or brown mustard, is one of the main plants rich in GSL. Sinigrin and gluconapin are the major GSL in mustard seeds (Figure 1). They are inactive unless interacting with an endogenous enzyme called myrosinase (ß-thioglucosidase, E.C. 3.2.1.147) to produce allyl and but-3-enyl isothiocyanates (AITC & BITC) respectively [9,10,11]. These hydrolysis products are biologically reactive, but they are very volatile. In this context, GSL should be recovered and purified in their native form to formulate suitable biofumigant agents. The isolation and purification of glucosinolates have been documented with different chromatography methods including alumina column chromatography [12,13,14], preparative high-speed counter-current chromatography [15], preparative high performance liquid chromatography [16,17] and strong ion-exchange centrifugal partition chromatography [18,19]. These techniques are mainly used to isolate glucosinolates as standards for direct commercial use. Globally, mentioned techniques have unsatisfying recovering yield, can use environmentally harmful chemical products, and present many restrictions of scale-up.
The purpose of our study is to propose an alternative, efficient and simple method for the isolation and purification of glucosinolates using macroporous ion-exchange resins. As compared to previously cited methods, this technique is more environmentally friendly, adapted to the continuous production at large scale and less energy costly. The separation by ion exchange resin is based on the adsorption of the ionized targeted molecules on the resin matrix. The trapping of ions occurs along with the accompanying release of other ions, resulting in ions exchange. The trapped ions are then recovered during the desorption step using an eluent. Ion-exchange resins are widely used in different separation, purification and decontamination processes: typically for water softening and purification [20], sugar manufacturing [21], metals separation [22], fruit juice purification [23,24,25] and pharmaceuticals manufacturing [26].
The literature review revealed that the applicability of ion-exchange resin technique for the purification of GSL has, yet, been minimally studied and that purification of GSL is commonly proposed through ISO 9167-1, where a DEAE Sephadex resin leads to desulphation of GSL. In this line, our work is aimed at studying and optimizing the purification of intact GSL using ion-exchange resin. For this purpose, mustard seeds were first pressed to obtain oil and a defatted meal rich in GSL. Solid/liquid extraction was performed using a water/ethanol mixture for GSL extraction. The obtained crude juice is rich in GSL in their native form, but it contains many impurities such as proteins, sugars, colloids, etc. Purification of this juice was investigated using strongly (PA312LOH) and weakly anionic resins (RELITE RAM1). The study was performed in static mode to optimize the process by tuning experimental conditions (temperature, resin/juice ratio, time). Selectivity of separation was considered and experimental adsorption kinetics were modeled. Finally, the studied process was tested and validated in the continuous dynamic mode at the laboratory scale.

2. Materials and Methods

2.1. Chemicals and Reagents

Sinigrin monohydrate as standard was purchased from Sigma Aldrich (Saint-Quentin Fallavier, France). Glucotropaeolin was provided by Terres Inovia (Ardon laboratory, France). Acetonitrile, ethanol, tetraheptylammonium bromide, sodium phosphate monobasic anhydrous were purchased from Fischer Scientific (Illkirch, France). Bradford reagent and salts pellets KCl and NaCl were provided by VWR (Strasbourg, France).

2.2. Ion Exchange Resins

Two types of macroporous ion-exchange resin have been used and tested, including a strongly basic anion exchange resin PA312LOH and a weak basic anion-exchange resin RELITE RAM1 supplied by Mitsubishi Chemical (Tokyo, Japan). Physical properties of resins are summarized in Table 1. The resins were cleaned with deionized water before their use.

2.3. Glucosinolates Extraction

The crude juice rich in glucosinolates was extracted from brown mustard seeds (Brassica juncea, Etamine) cultivated and harvested in Dijon in 2017 and supplied by Chambre d’Agriculture Côte d’Or (Bretenière, France). HPLC analyses have shown that seeds are rich in oil (33.9%), proteins (28.1%) and glucosinolates: sinigrin (94.7 µmol/g DM) and gluconapin (10.9 µmol/g DM).
The seeds were firstly subjected to a thermal treatment to inactivate the myrosinase, an endogenous enzyme responsible for GSL hydrolysis. The inactivation was performed by dipping a sealed bottle containing the seeds in hot bathwater (Julabo SW22) at 90 °C during 70 min. Analyses showed that this thermal treatment allowed almost total (97%) inactivation of the enzyme. Treated seeds are then flaked (cylinder Trilabo 100 × 200 grinder) and twice pressed at 80 °C for 60 min using a laboratory hydraulic press (Creusot-Loire, France). In total, 84% of the oil was extracted and obtained press-cake was used for GSL extraction.
GSL recovery was performed through a solid/liquid extraction under controlled stirring and temperature conditions. Optimization study permitted recovery of 90% of the intact glucosinolates during 8 min using a water/ethanol solution of (60/40, v:v) and a temperature of 40 °C. The obtained juice was rich in glucosinolates (3.46 and 0.27 g/L of sinigrin and gluconapin, respectively) and proteins (1.95 g/L). More details are available in Hebert et al., 2020 [27] and Hebert et al., 2021 [9]. The objective of the following purification step is to separate GSL and proteins in order to obtain a purified juice rich in GSL.

2.4. Glucosinolates Purification

Glucosinolates purification using anion-exchange resin was first studied in static (batch) mode in order to determine the optimal operating conditions and then tested in dynamic (continuous) mode (column) to validate the process.

2.4.1. Static (Batch) Purification

Adsorption and Desorption

Static mode (batch) experiments were performed by mixing 50 mL of the crude juice with a constant mass of resin (resin concentration was 10 to 100 g/L) in a flask under controlled stirring (300 rpm) and temperature (20–60 °C) for 120 min. Liquid samples were taken regularly. Samples were filtered through 0.45 µm membrane filter and analyzed by HPLC for GSL quantification. For each sample, the adsorption capacity qe (mg/g) and the ratio of adsorption E (%) were calculated using Equations (1) and (2), respectively:
q e = ( C 0 C ) × V m r  
E = C 0 C C 0 × 100
qe represents the mass of solute adsorbed by 1 g of resin at the adsorption equilibrium point. E represents the part of solute adsorbed at the adsorption equilibrium point. C0 and C (mg/mL) are the initial and actual concentration of GSL in the juice, V (mL) is the initial volume of juice and mr is the mass of resin (g) added to the juice. At the end of the adsorption step, resins were recovered, washed with deionized water, and the desorption was carried out under stirring of 300 rpm at 30 °C for 120 min. The influence of the eluent (KCl, NaCl), its concentration (0.3 to 1.5 mol/L) and the solid-liquid ratio (20 to 40 mL/gresin) were investigated. Samples were taken regularly and analyzed to determine the concentration of desorbated GSL in the eluent. The desorption ratio D (%) was calculated using Equation (3).
D = C d × V d ( C 0 C e ) × V × 100
where Cd is the concentration of desorbated GSL in the eluent (mg/mL), Ce is the equilibrium concentration of adsorbated GSL in solution (mg/mL) and Vd is the volume of eluent (mL).

Modelling of the Adsorption Process

  • Isotherms of adsorption
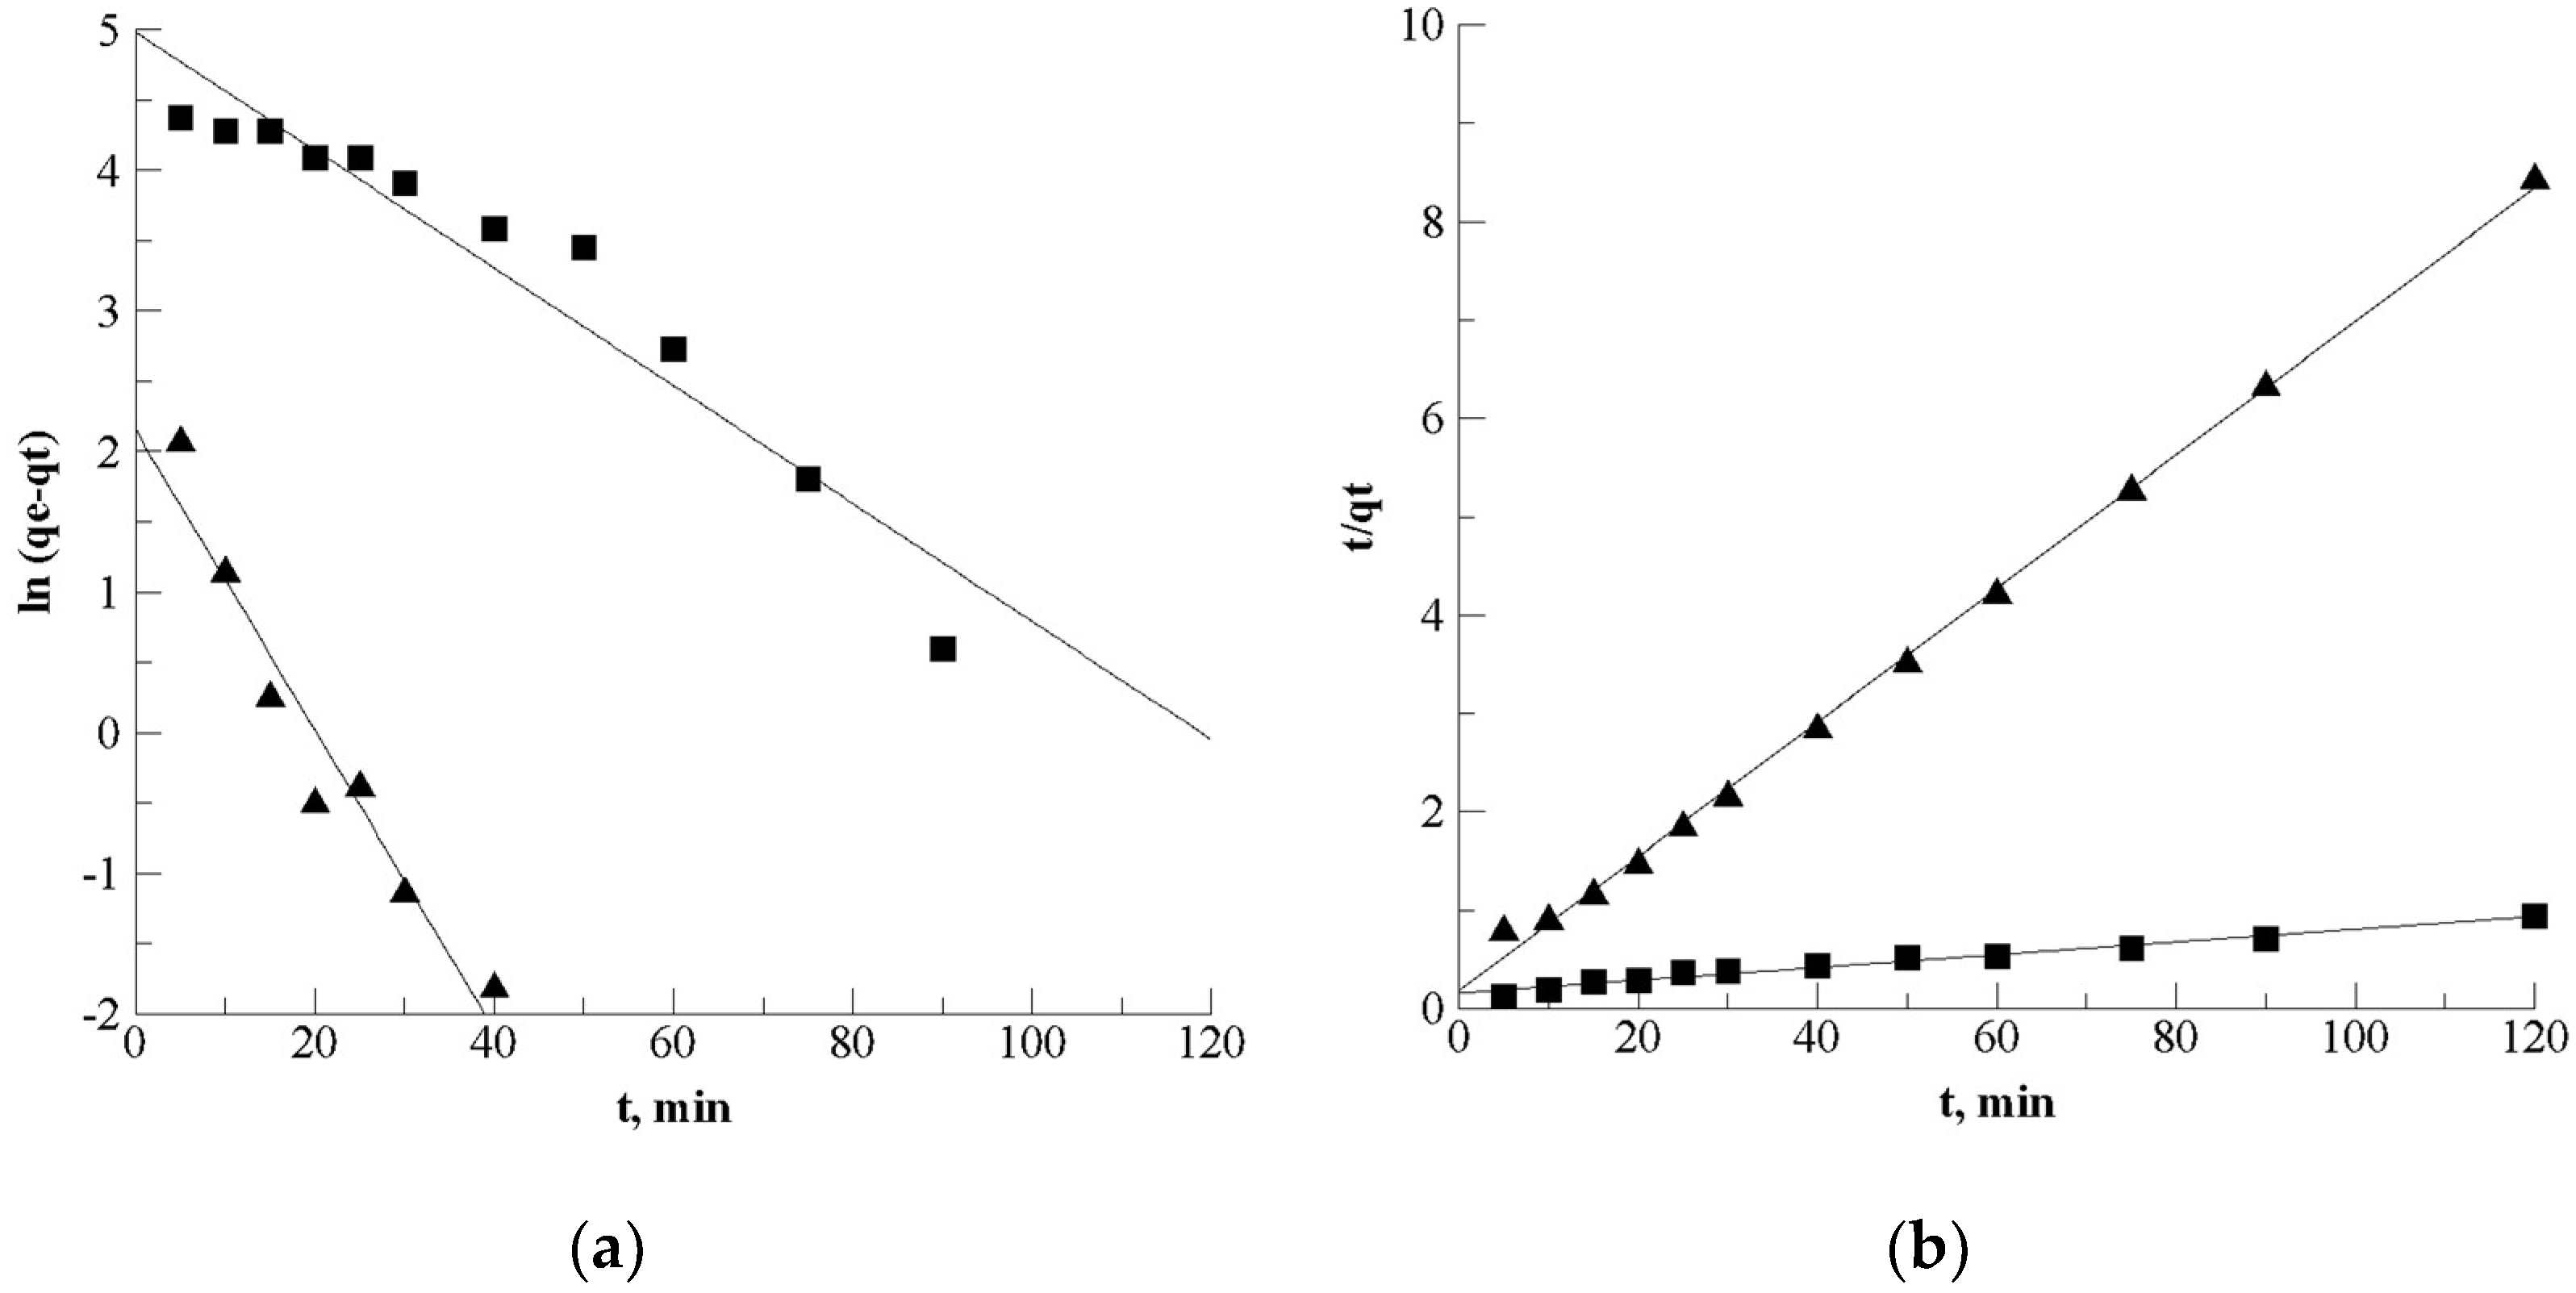
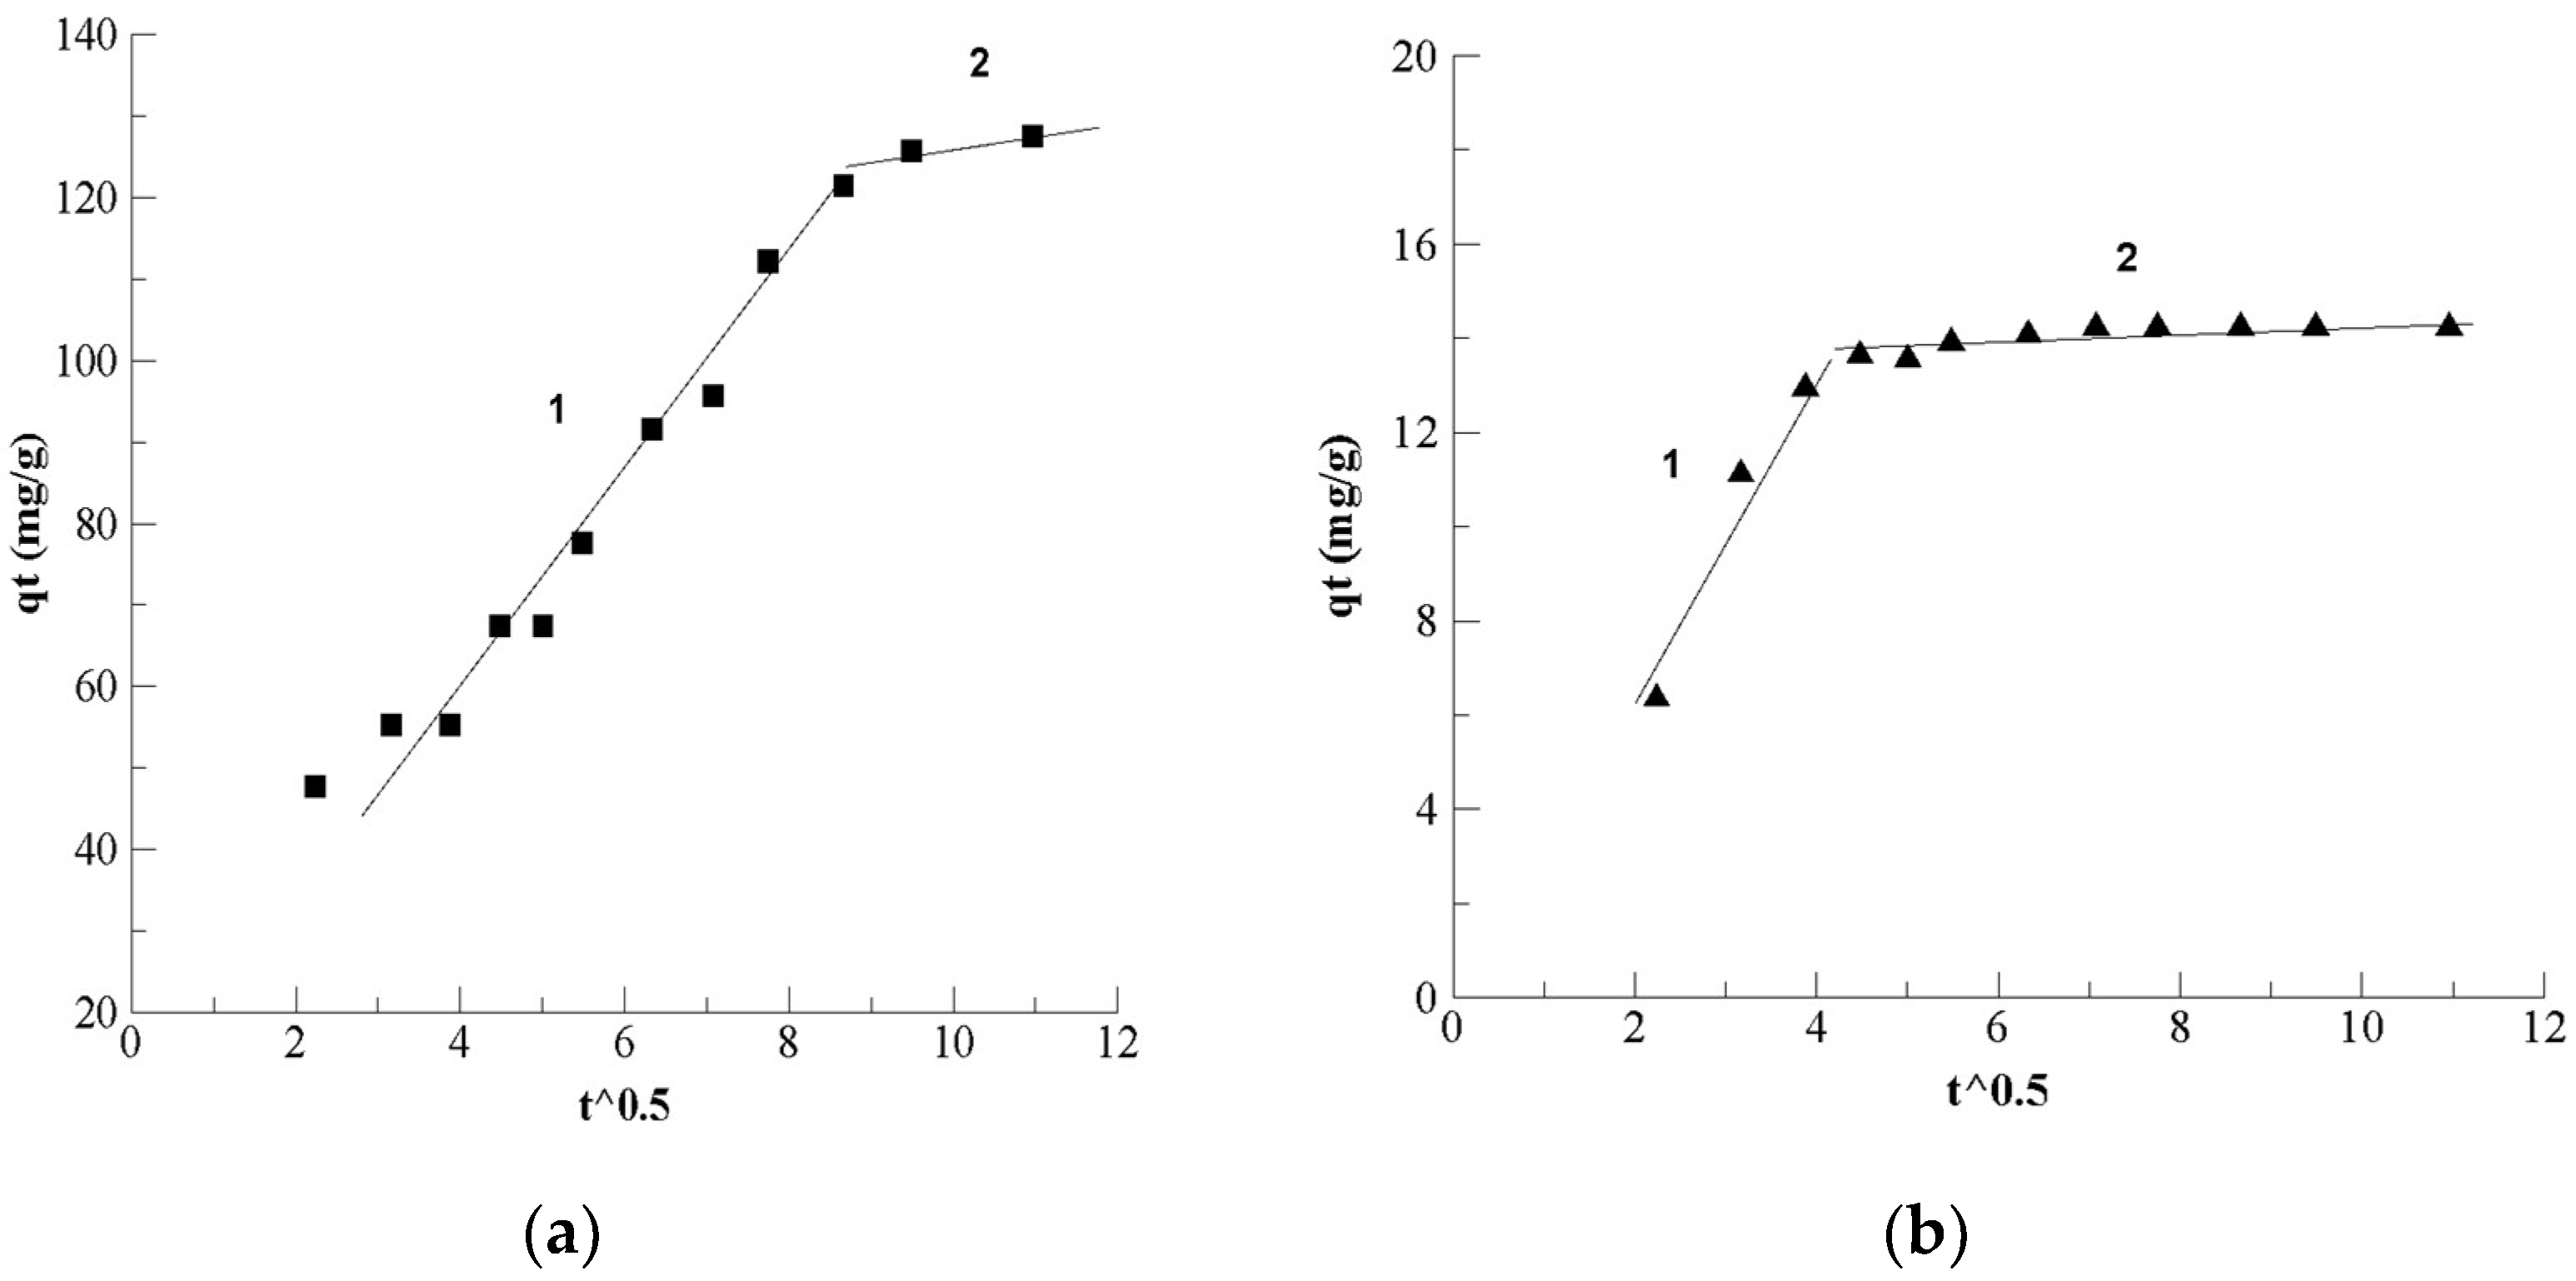
Adsorption experimental data were fitted with Langmuir and Freundlich equations, most frequently applied models for the description of solute adsorption.
The Langmuir equation is a simple model, which describes a monolayer adsorption with equal adsorption sites. The adsorption capacity and concentration of solute in solution at the equilibrium are linked according to the Equation (4):
q e = q 0 K L C e 1 + K L C e
where qe and q0 are, respectively, the adsorption capacity at the equilibrium and the maximal adsorption capacity (mg/g), Ce is the equilibrium solute concentration (mg/mL), and KL (mL/mg) is the adsorption equilibrium constant. The favorability of the adsorption described by the model of Langmuir can be represented with a dimensionless parameter RL using Equation (5):
R L = 1 1 + K L C 0
where C0 is the initial concentration of the solute adsorbed. The value of RL, defined as separation factor, indicates the favorability of the adsorption process: the adsorption is considered unfavorable when RL >1, favorable when 0 < RL < 1 and irreversible when RL = 0.
The Freundlich equation (Equation (6)) describes a multilayer adsorption with heterogeneous behavior of adsorption sites. It can also be used to describe a monolayer adsorption:
q e = K F C e 1 n
where KF and n are the empirical constants. KF represents an indicator of adsorption capacity, and the ratio 1/n is an indicator of sorption favorability. 1/n between 0.1 and 0.5 indicates a good feasibility of adsorption, while adsorption is considered less favorable when 1/n is higher than 0.5, and it can be very difficult to happen when 1/n exceeds 1 [28].
The thermodynamic behavior of adsorption was characterized using the Temkin Equation:
q e = R T Δ Q ln ( K T C e )
where KT (mL·g−1) is the equilibrium constant and ∆Q (J·mol−1) is the Temkin constant related to the sorption heating.
  • Adsorption kinetics
The description of the glucosinolates adsorption mechanism was modeled using a pseudo first order model (Lagergren model) (Equation (8)) and pseudo second order model (Equation (9)) [29]:
ln ( q e - q t ) = ln q e - K 1 t
t q t = 1 q e t + 1 K 2 q e 2
where qt is the actual adsorption capacity, K1 is the constant rate (min−1) estimated by plotting ln (qeqt) versus t, and K2 (g/mg·min) is the constant rate estimated by plotting t/qt versus t.
The intra-particle diffusion model was used to investigate the mechanism of diffusion. This model is commonly described according to the equation of Webber and Morris (Equation (10)):
q t = K i t 0.5 + C
where Ki is the intra-particle diffusion rate constant (mg/g·min0.5) and C is an indicator of boundary layer thickness.

Resins Regeneration

After desorption experiments, the resins were regenerated with NaOH solution. The concentration of NaOH (2–8%) and the liquid/solid ratio (2 to 8 mL/g résine) were optimized. Washing/regeneration was performed for 30 min at 300 rpm. After washing, resins were rinsed with deionized water to remove the regeneration solution and a new cycle of adsorption/desorption was performed. The efficiency of regeneration was evaluated by comparing the kinetics of adsorption of GSL with new and regenerated resins.

2.4.2. Dynamic (Continuous) Purification

Dynamic adsorption and desorption experiments were carried out in a glass column with an internal diameter of 22 mm. The column was manually packed with a 3 cm bed of resin giving a total volume of 11.4 cm3. In total, 50 mL of juice was flowed through the column with a flow rate of 5.3 BV (Bed Volume)/h with a peristaltic pump. The adsorbed-loaded column was then washed with deionized water and eluted with a salt solution for the desorption. The adsorption and desorption experiments were performed in the optimal conditions previously determined in the static mode. The impacts of the flow rate (2.6–5.3 BV/h) and the eluent pH on the desorption efficiency were studied. Samples were collected every 4 mL for the analysis of GSL to evaluate the efficiency of separation.

2.5. Analysis

2.5.1. Juice Purity

The juice purity was determined based on the HPLC response of GSL (area %) towards other detected peaks by applying Equation (11):
P r = Σ A G S L Σ A H P L C
where Σ A G S L are the summed areas of GSL peaks (sinigrin and gluconapin) and Σ A H P L C are the summed areas of all detected components peaks (glucosinolates and impurities). The purity of raw juice was estimated to 43.05% according to the HPLC chromatogram (Figure 2).

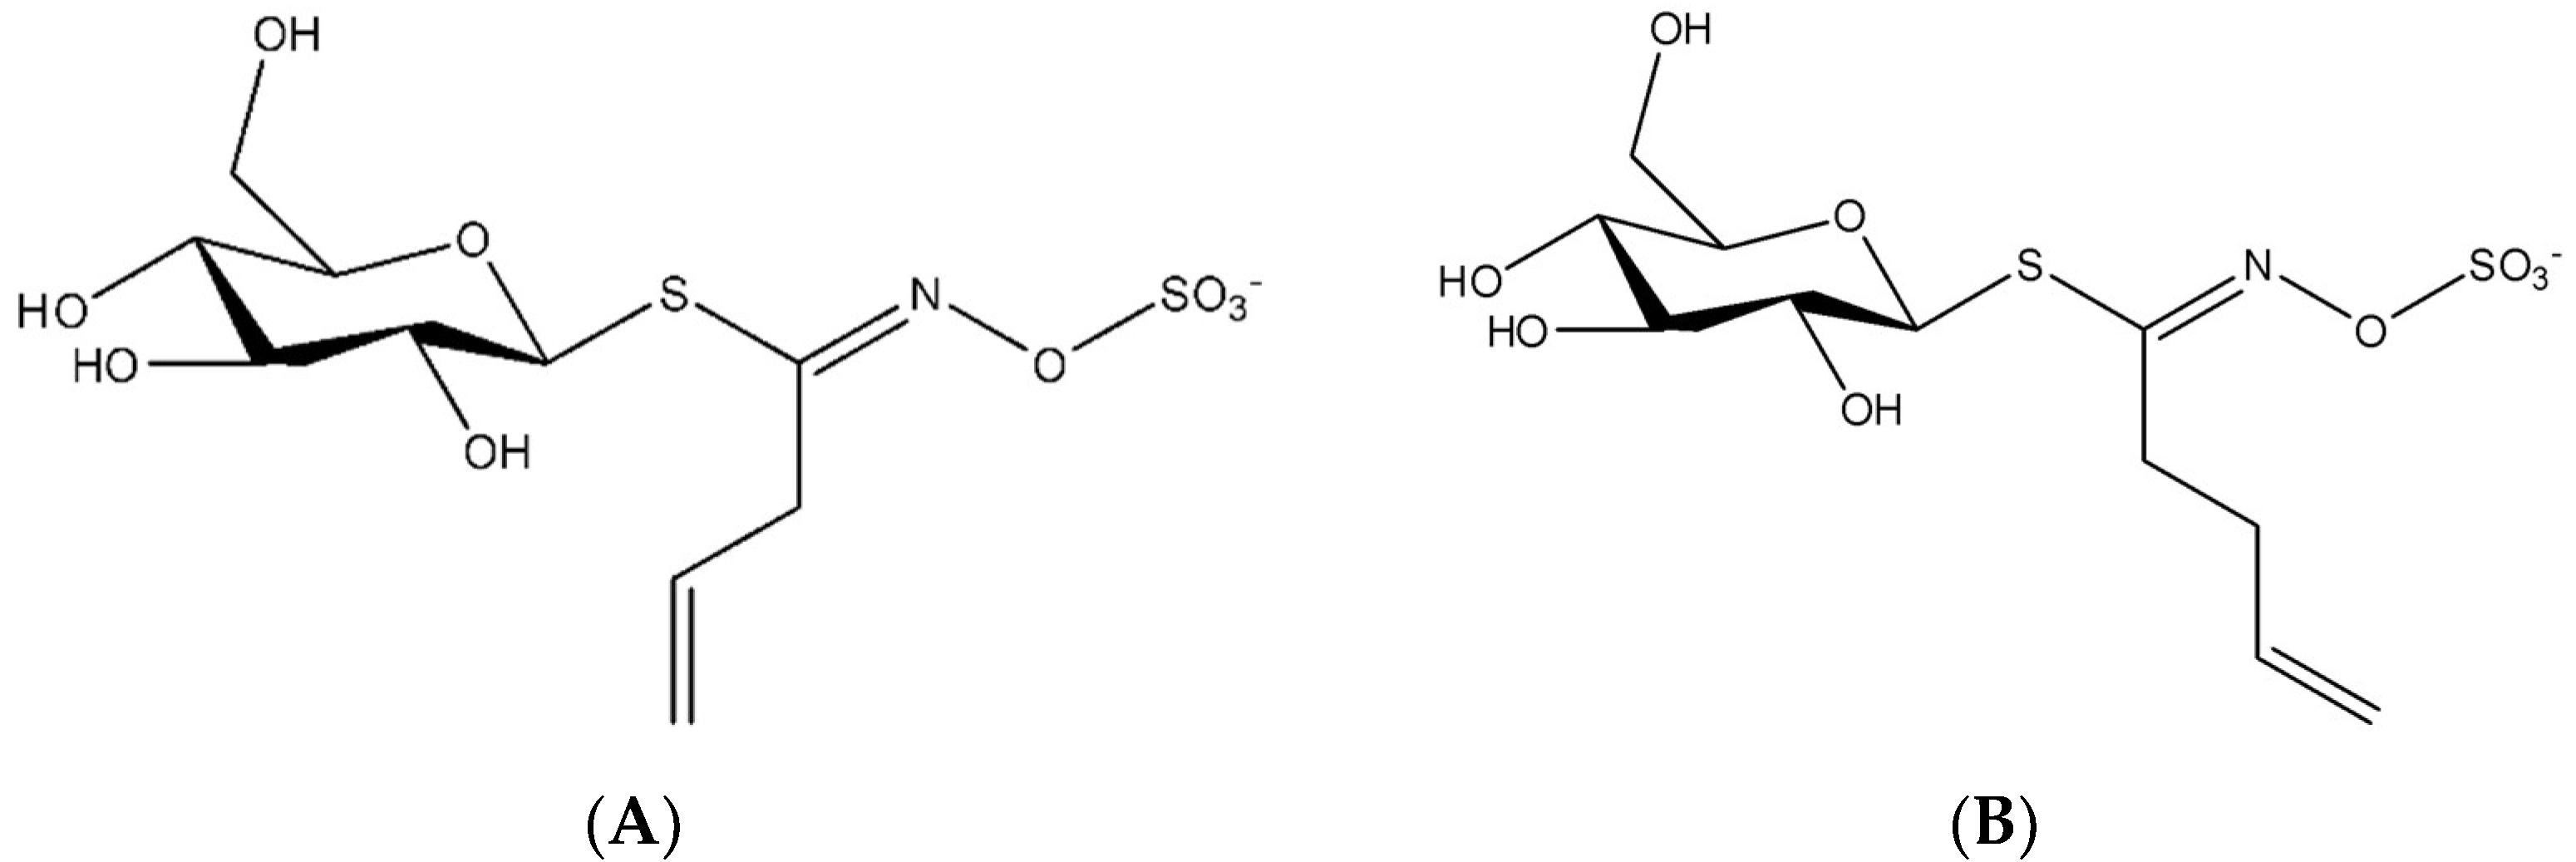
2.5.2. Glucosinolates Quantification

The GSL concentration in juices was determined by reversed phase ion-pair liquid chromatography. HPLC experiments were performed on a Thermo Scientific Dionex Ultimate 3000 Series equipped with diode array detectors (DAD-3000 RS and MWD-3000 RS). A C18 column (Prontosil 250 × 4.6 mm 5.0 µM) was used for the analyses. The mobile phase was an acetonitrile-water solution (45%) with NaH2PO4 at 10 mM and THABr as counterion at 5 mM conditioned at pH 7.0. Analyses were performed with a mobile phase flow rate of 1.5 mL/min, UV wavelength of 229 nm and column temperature of 35 °C. In total, 20 µL of the sample are injected in the chromatograph, the elution was carried out in isocratic mode. A standard calibration curve (Figure S1 in the Supplementary Materials Section) was constructed using solutions of standard sinigrin from 0.1 mM to 4 mM. Gluconapin was determined by an internal method using glucotropaeolin as an internal standard.

2.5.3. Proteins Quantification

The concentration of proteins in the juice was determined according to the Bradford method. The details of analysis are presented in the Technical Bulletin for Bradford Reagent (B 6916, Sigma Aldrich).

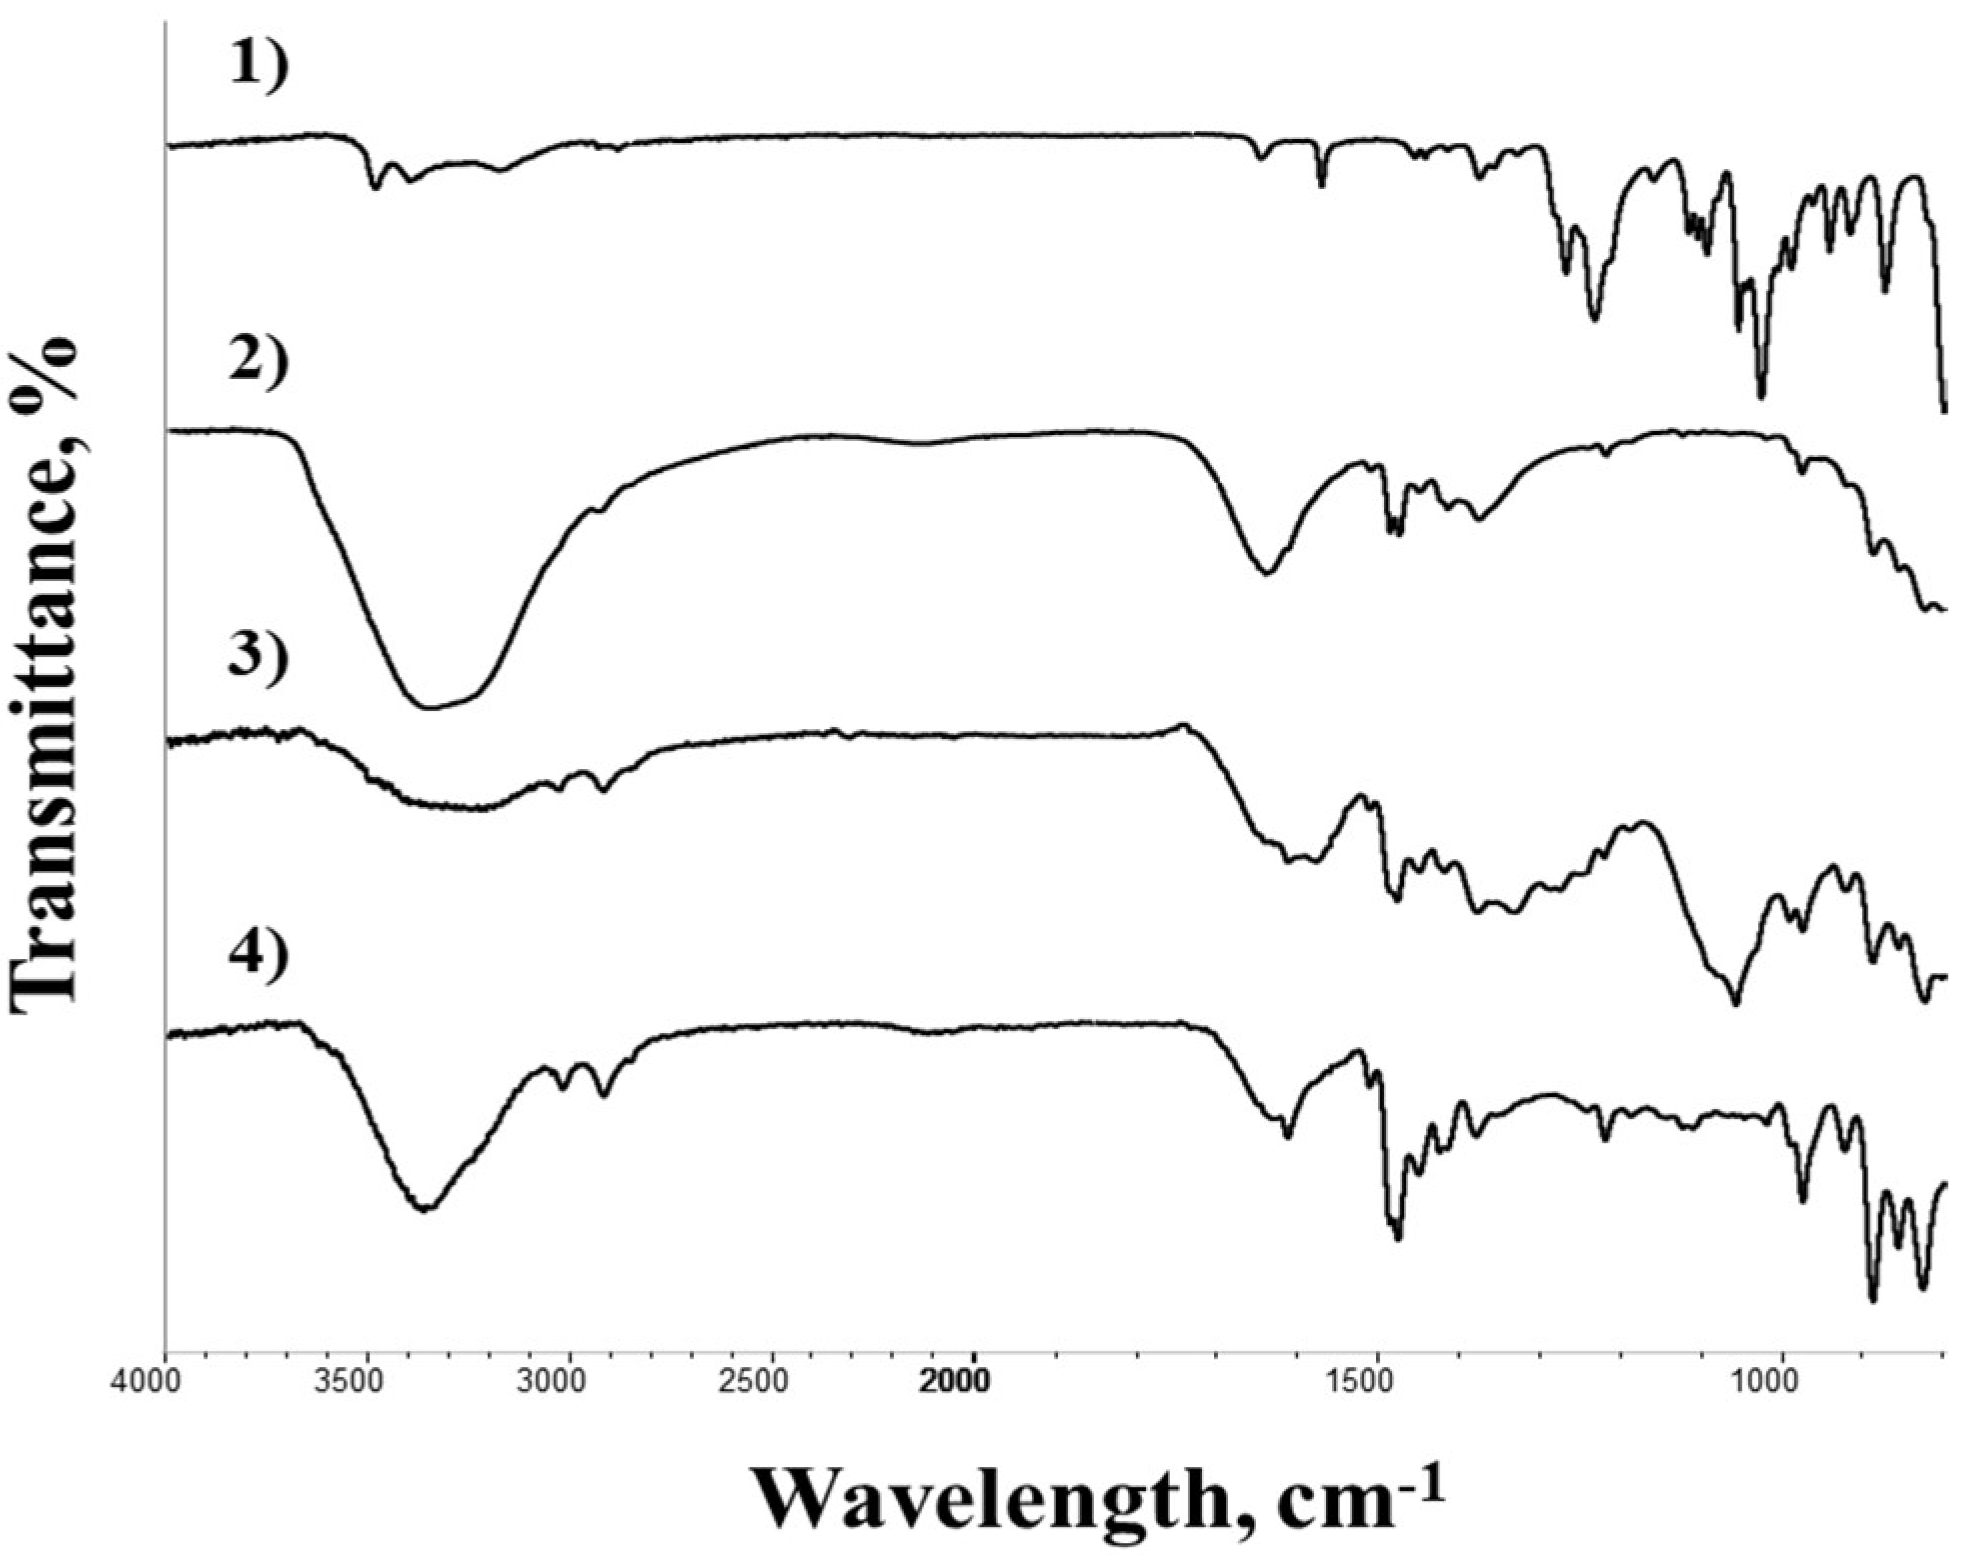
2.5.4. Infrared Characterization (FTIR)

Ion-exchange resins were analyzed before and after their use meaning Fourier transform infrared spectroscopy from press discs using a Nicolet iS5 ID1 Transmission FTIR Spectrometer (Thermo Scientific) and FTIR spectra were recorded in the range of 4000–400 cm−1, averaging the data of 16 successive scan. In brief, press discs were prepared from a mixture of resin and KBr pellets as powder. The functional groups of macroporous resin were characterized. The standard of sinigrin (commercial sinigrin monohydrate) was also analyzed and the different spectra were compared.

3. Results and Discussion

3.1. Optimization of the Adsorption/Desorption in a Static (Batch) Mode

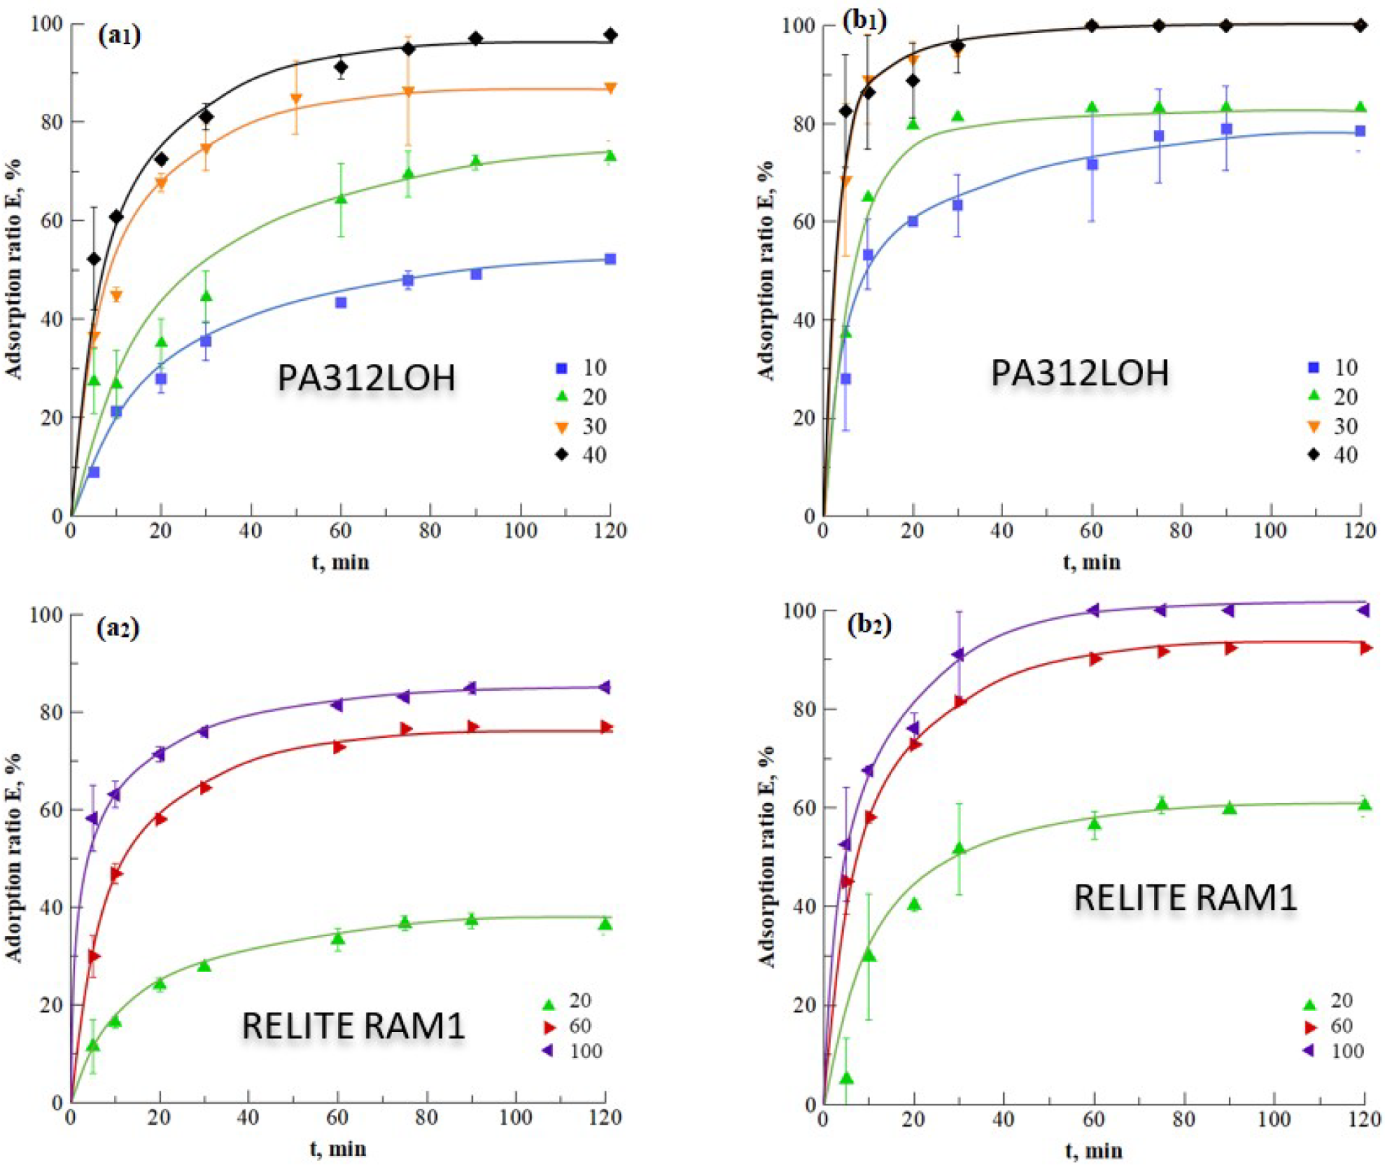
3.1.1. Resin Selection

Figure 3 presents the adsorption kinetics of sinigrin (Figure 3(a1,a2)) and gluconapin (Figure 3(b1,b2)) using strongly (PA312LOH) and weakly basic resin (RELITE RAM1) at different concentrations under static conditions (30 °C, 300 rpm). It can be noticed that the adsorption ratio of both sinigrin and gluconapin was increased rapidly before reaching a plateau after about 60–70 min for sinigrin, and more rapidly (after 40 min) for gluconapin (Figure 3). Moreover, the adsorption ratio of gluconapin was higher than that of sinigrin. For example, 83.2% of gluconapin was finally adsorbed using strongly basic resin PA312LOH at the concentration 20 g/L, while only 72.9% of sinigrin was adsorbed in the same conditions. It can be supposed that gluconapin has better affinity with the resin functional group than sinigrin. For instance, gluconapin was totally adsorbed after 30 min with the resin PA312LOH at 30 g/L (Figure 3(a1)). However, a longer time (80 min) and higher concentration (40 g/L) were needed for total sinigrin adsorption (Figure 3(b1,b2)). The difference of adsorption behavior between gluconapin and sinigrin may be attributed to their structural difference inducing different interactions with the functional group of the resin. In fact, the occurrence of the further carbon on the side chain of gluconapin compared to sinigrin may induce more inductive impact (+I) and better stabilization of the complex formed with the amine group of the resin. On the other hand, the difference may be explained by the lower concentration of gluconapin in the crude juice as compared to sinigrin (0.27 vs. 3.46 g/L). Wang et al. (2014) have previously observed that the adsorption ratio of gluconapin was higher than sinigrin, whatever the adsorbent [30]. This result can be very useful to separate sinigrin and gluconapin using resin in a consecutive way.
Comparison of the tested resins show that the strongly basic resin PA312LOH is more efficient than the weakly one (RELITE RAM1) for GSL adsorption (Figure 3). For instance, the equilibrium adsorption capacity of gluconapin and sinigrin was twice as high with PA312LOH in comparison with the RELITE RAM1 resin (Figure 4). For example, the adsorption capacity was increased from 58.2 to 127.5 mg/g and from 9.1 to 14.2 mg/g for sinigrin and gluconapin, respectively. This difference towards glucosinolates adsorption could be associated to the nature of the resin’s functional group. It can be supposed that the quaternary amine group (-N+(CH3)3) present in the PA312LOH resin can interact more efficiently with the anionic sulfate part SO3− of glucosinolates as compared to the tertiary amine (N(CH3)2) forming the ELITE RAM1 resin, leading to a higher adsorption capacity. This result was preliminarily confirmed by the measurement of pH increasing during adsorption. Indeed, during the adsorption process, the pH was increased from 6.1 to 10.3 for the strong resin but only to 6.7 with the weak one. The increase of pH is directly linked to the release of OH- anions after the adsorption of glucosinolates by the resin. The more glucosinolates are adsorbed, the more OH- anions are released and the higher is the pH, showing higher affinity and better adsorption capacity. In 2014, Wang et al. reported similar results for the adsorption of sinigrin using a strong resin (D261) similar to the PA312LOH resin [30,31]. They observed that the equilibrium was reached after 50 min of sinigrin adsorption with D261 resin at 20 °C.
In order to better characterize the interactions between the resins and the adsorbed glucosinolates, the PA312LOH resin was characterized by FTIR before and after adsorption and at the end of the desorption step. The obtained spectra are presented in Figure 5. It can be observed that the functional group –N+(CH3)3 is displayed by the spectral band around 885 cm−1. Its presence can also clearly be identified thanks to vibrations of the O-H bond linked with the quaternary charged nitrogen as N+(CH3)3-OH-. Before the adsorption (new resin before use), O-H stretching and bending vibration were represented, respectively, by the broad band in 3100–3500 cm−1 and the band in 1640 cm−1. A small peak in 975 cm−1 related to the O-H deformation vibration was also an indicator of the hydroxyl group. After the adsorption, these peaks and particularly the band 3100–3500 cm−1 were decreased significantly, indicating that most of O-H groups were replaced by the adsorbed sinigrin and gluconapin. Moreover, the peak of the adsorbed sinigrin could be found with peaks in 1060 cm−1 and 1270 cm−1, as compared with the standard of sinigrin. After desorption, these peaks were significantly decreased, confirming the desorption of sinigrin.
Considering the previous analysis, the mechanism of adsorption/desorption of the strongly basic resin PA312LOH can be illustrated by Figure 6.
In order to evaluate the selectivity of adsorption, the proteins content in the juice was measured before and after adsorption. Results showed that the resin did not adsorb proteins and the concentration of proteins in the solution remained equivalent to that in the crude extract. This may be explained by the fact that proteins are positively charged in the initial solution (pH 6.1), so they cannot react effectively with a resin of the same charge. Based on these results, PA312LOH resin was selected to study the impact of temperature on the adsorption efficiency.

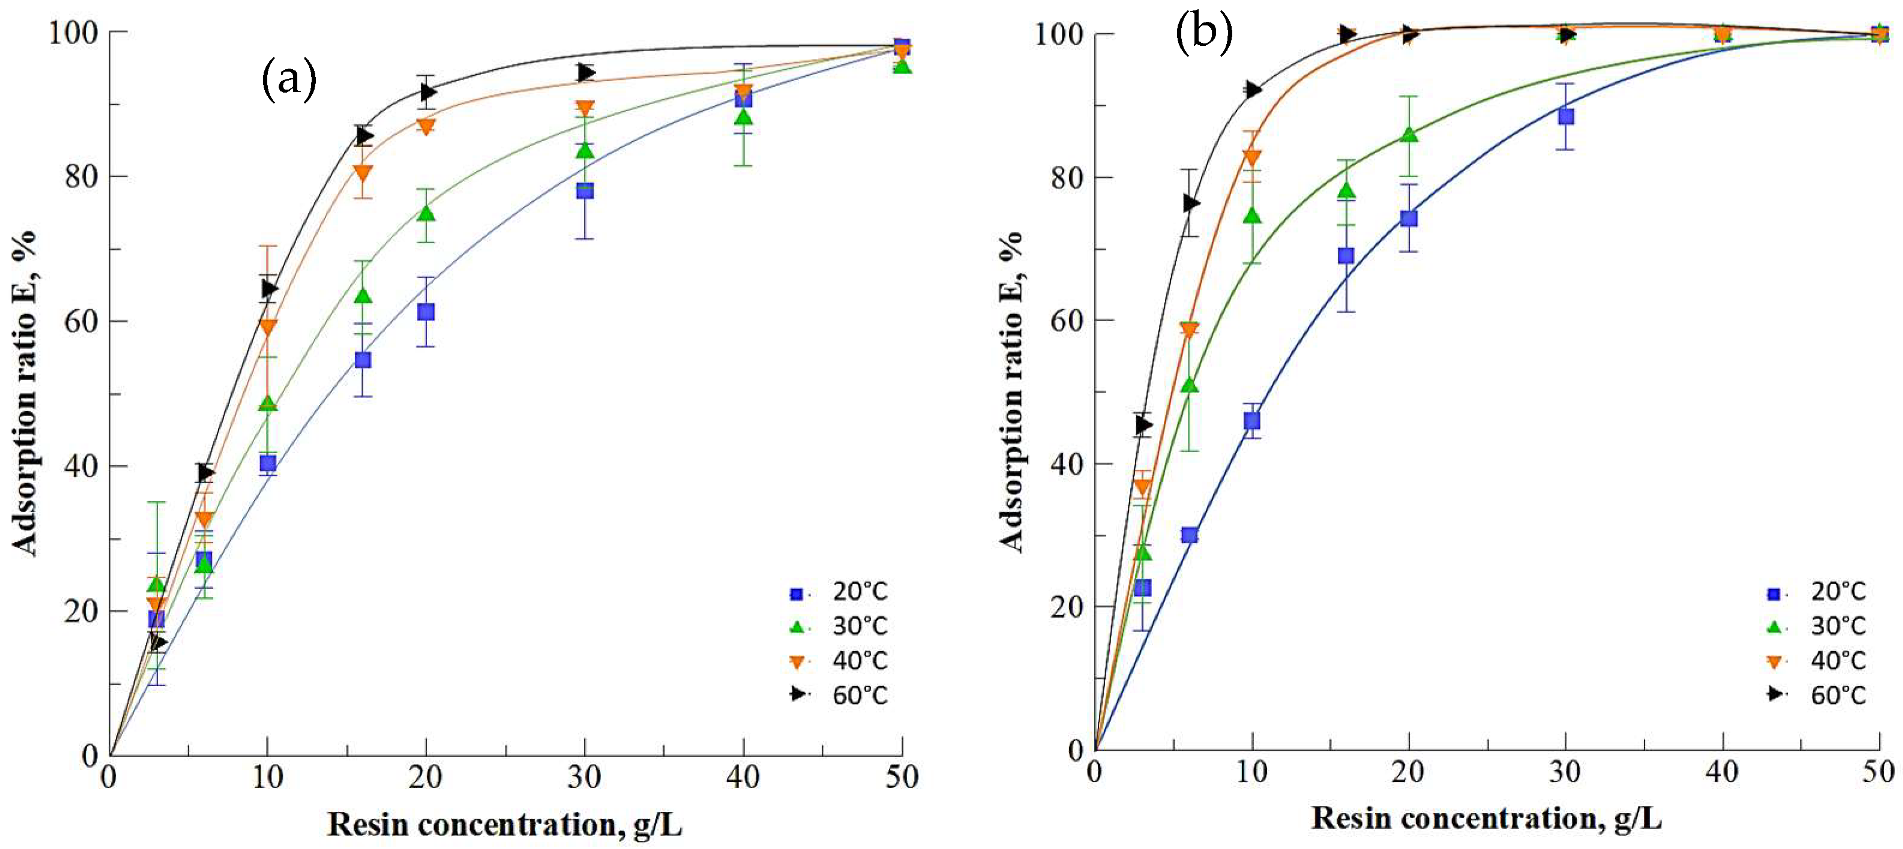
3.1.2. Impact of Temperature

The adsorption temperature was varied in the range 20–60 °C and the adsorption kinetics were determined. Figure 7 shows that increasing the temperature leads to more rapid adsorption kinetics mainly with low resin concentration (<30 g/L). For example, the adsorption ratio with the resin PA312LOH (concentration 20 g/L) was increased from 61.3 and 77.6% at 20 °C to 91.7% and 100% at 60 °C for sinigrin and gluconapin respectively. The effect of temperature becomes less pronounced with the increase of the resin concentration beyond 30 g/L. Results suggest that the adsorption reaction is endothermic, which is quite uncommon.
To confirm this statement, the experimental results were fitted with The Temkin model. Results (Table 2) show that the heat adsorption values are positive ∆Q > 0 confirming that adsorption is endothermic.
In addition, experimental data were fitted by Langmuir and Freundlich equations (Figure 8).
Results (Table 3) show that the Langmuir model describes the adsorption of both sinigrin and gluconapin with higher correlation coefficient (R² = 0.90–0.99) in comparison to the Freundlich model (R² = 0.81–0.97). The favorability indicators calculated with both models (RL = 0.05–0.2 for Langmuir equation and 1/n = 0.2–0.5 for Freundlich equation) indicate the favorability of glucosinolates adsorption with the selected PA312LOH resin. Results at 60 °C match with the limit temperature of resin use. Nevertheless, data clearly indicate that the maximum adsorption capacity increased from 167.2 to 268.1 mg/g and from 20.5 to 84.8 mg/g for sinigrin and gluconapin respectively, with increasing temperature from 20 to 60 °C confirming thus the endothermic character of the adsorption process. Wang et al. [31] have obtained similar results for the adsorption of sinigrin using the macro-porous resin D261.

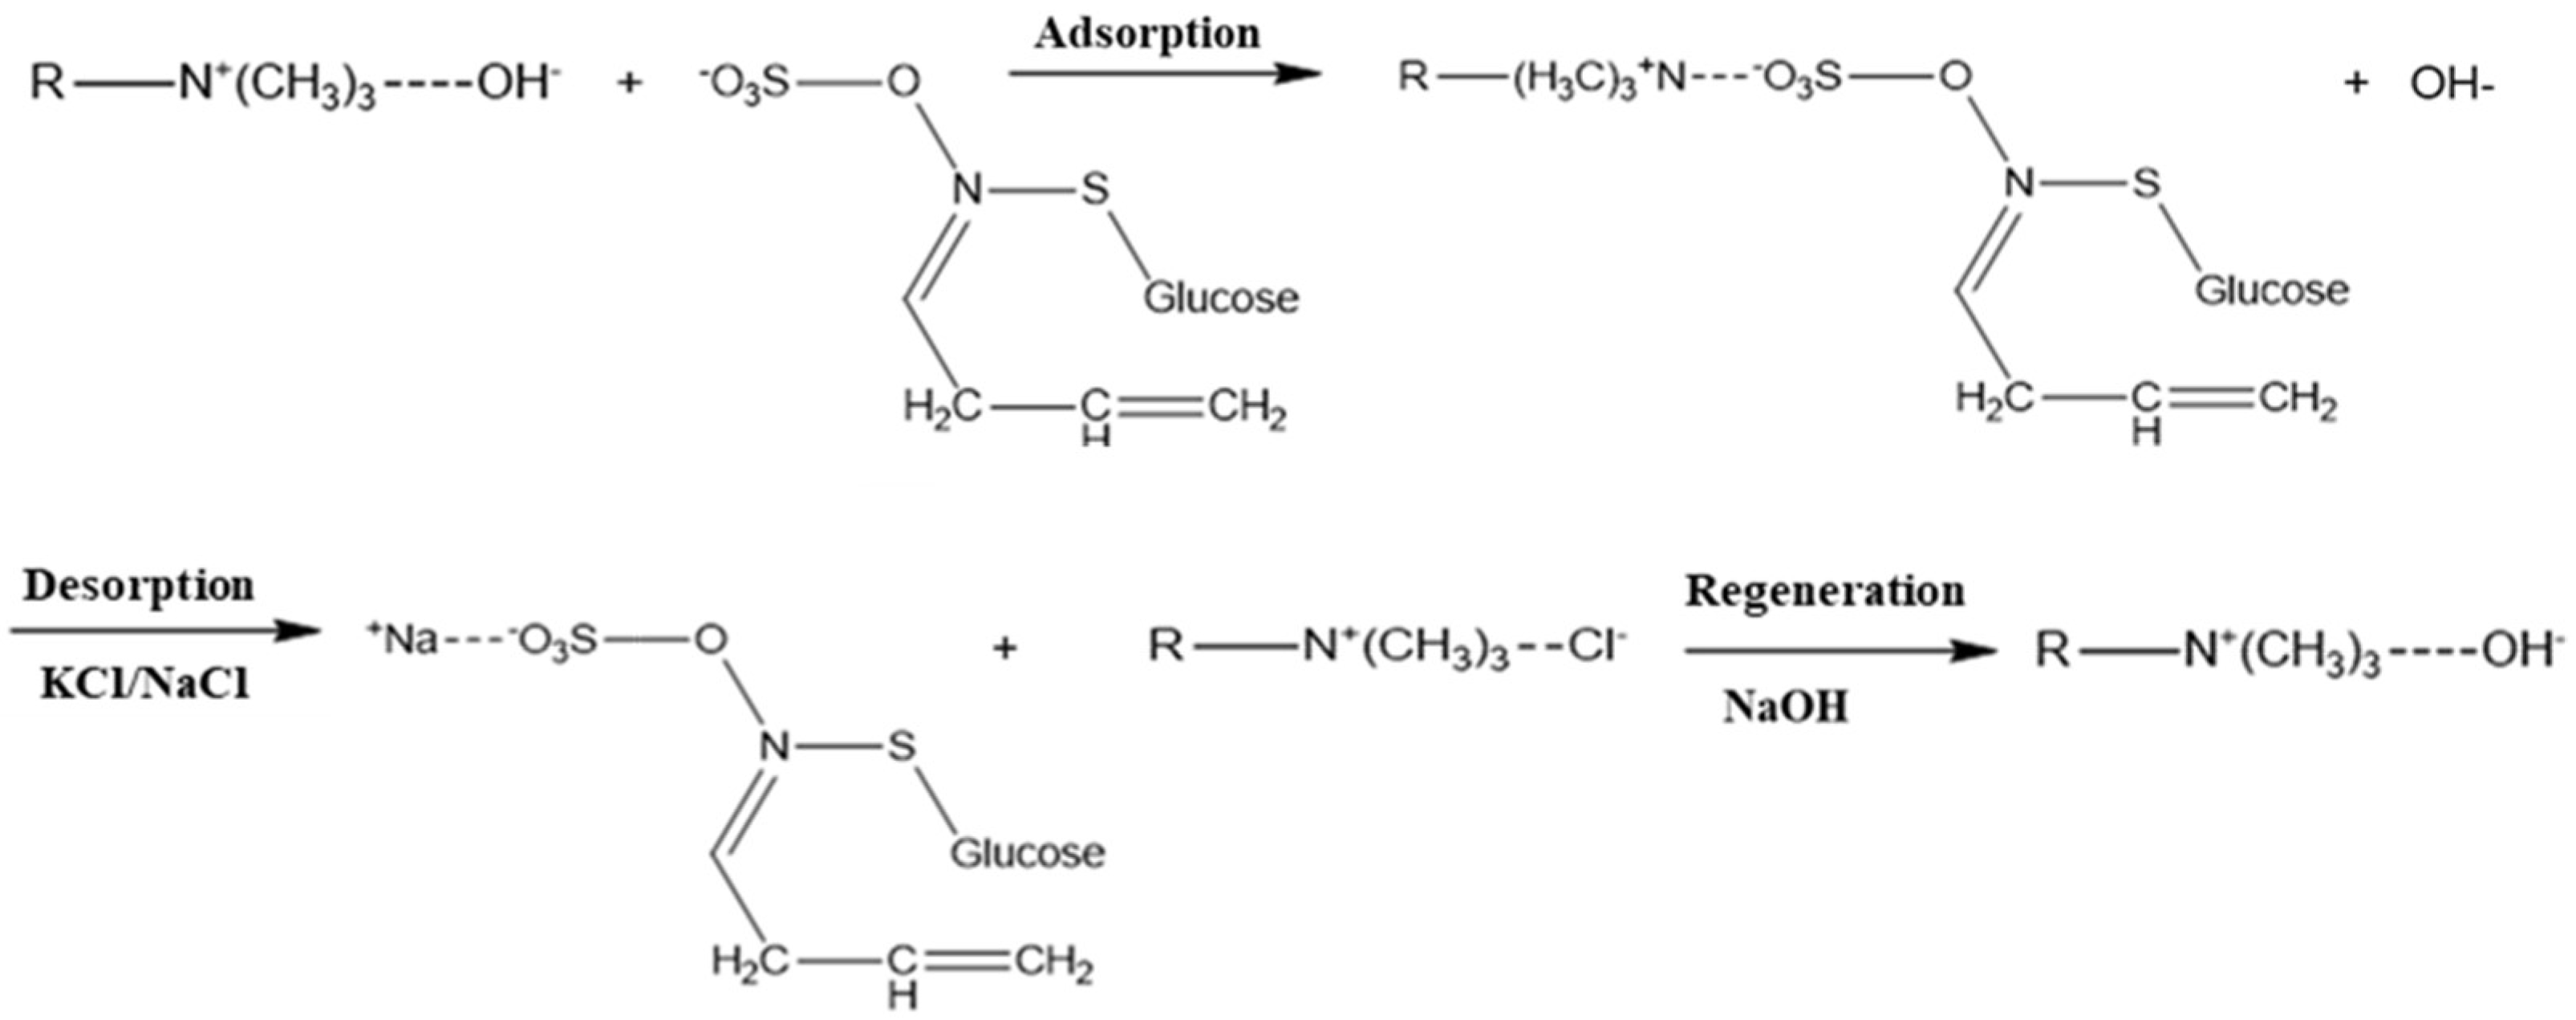
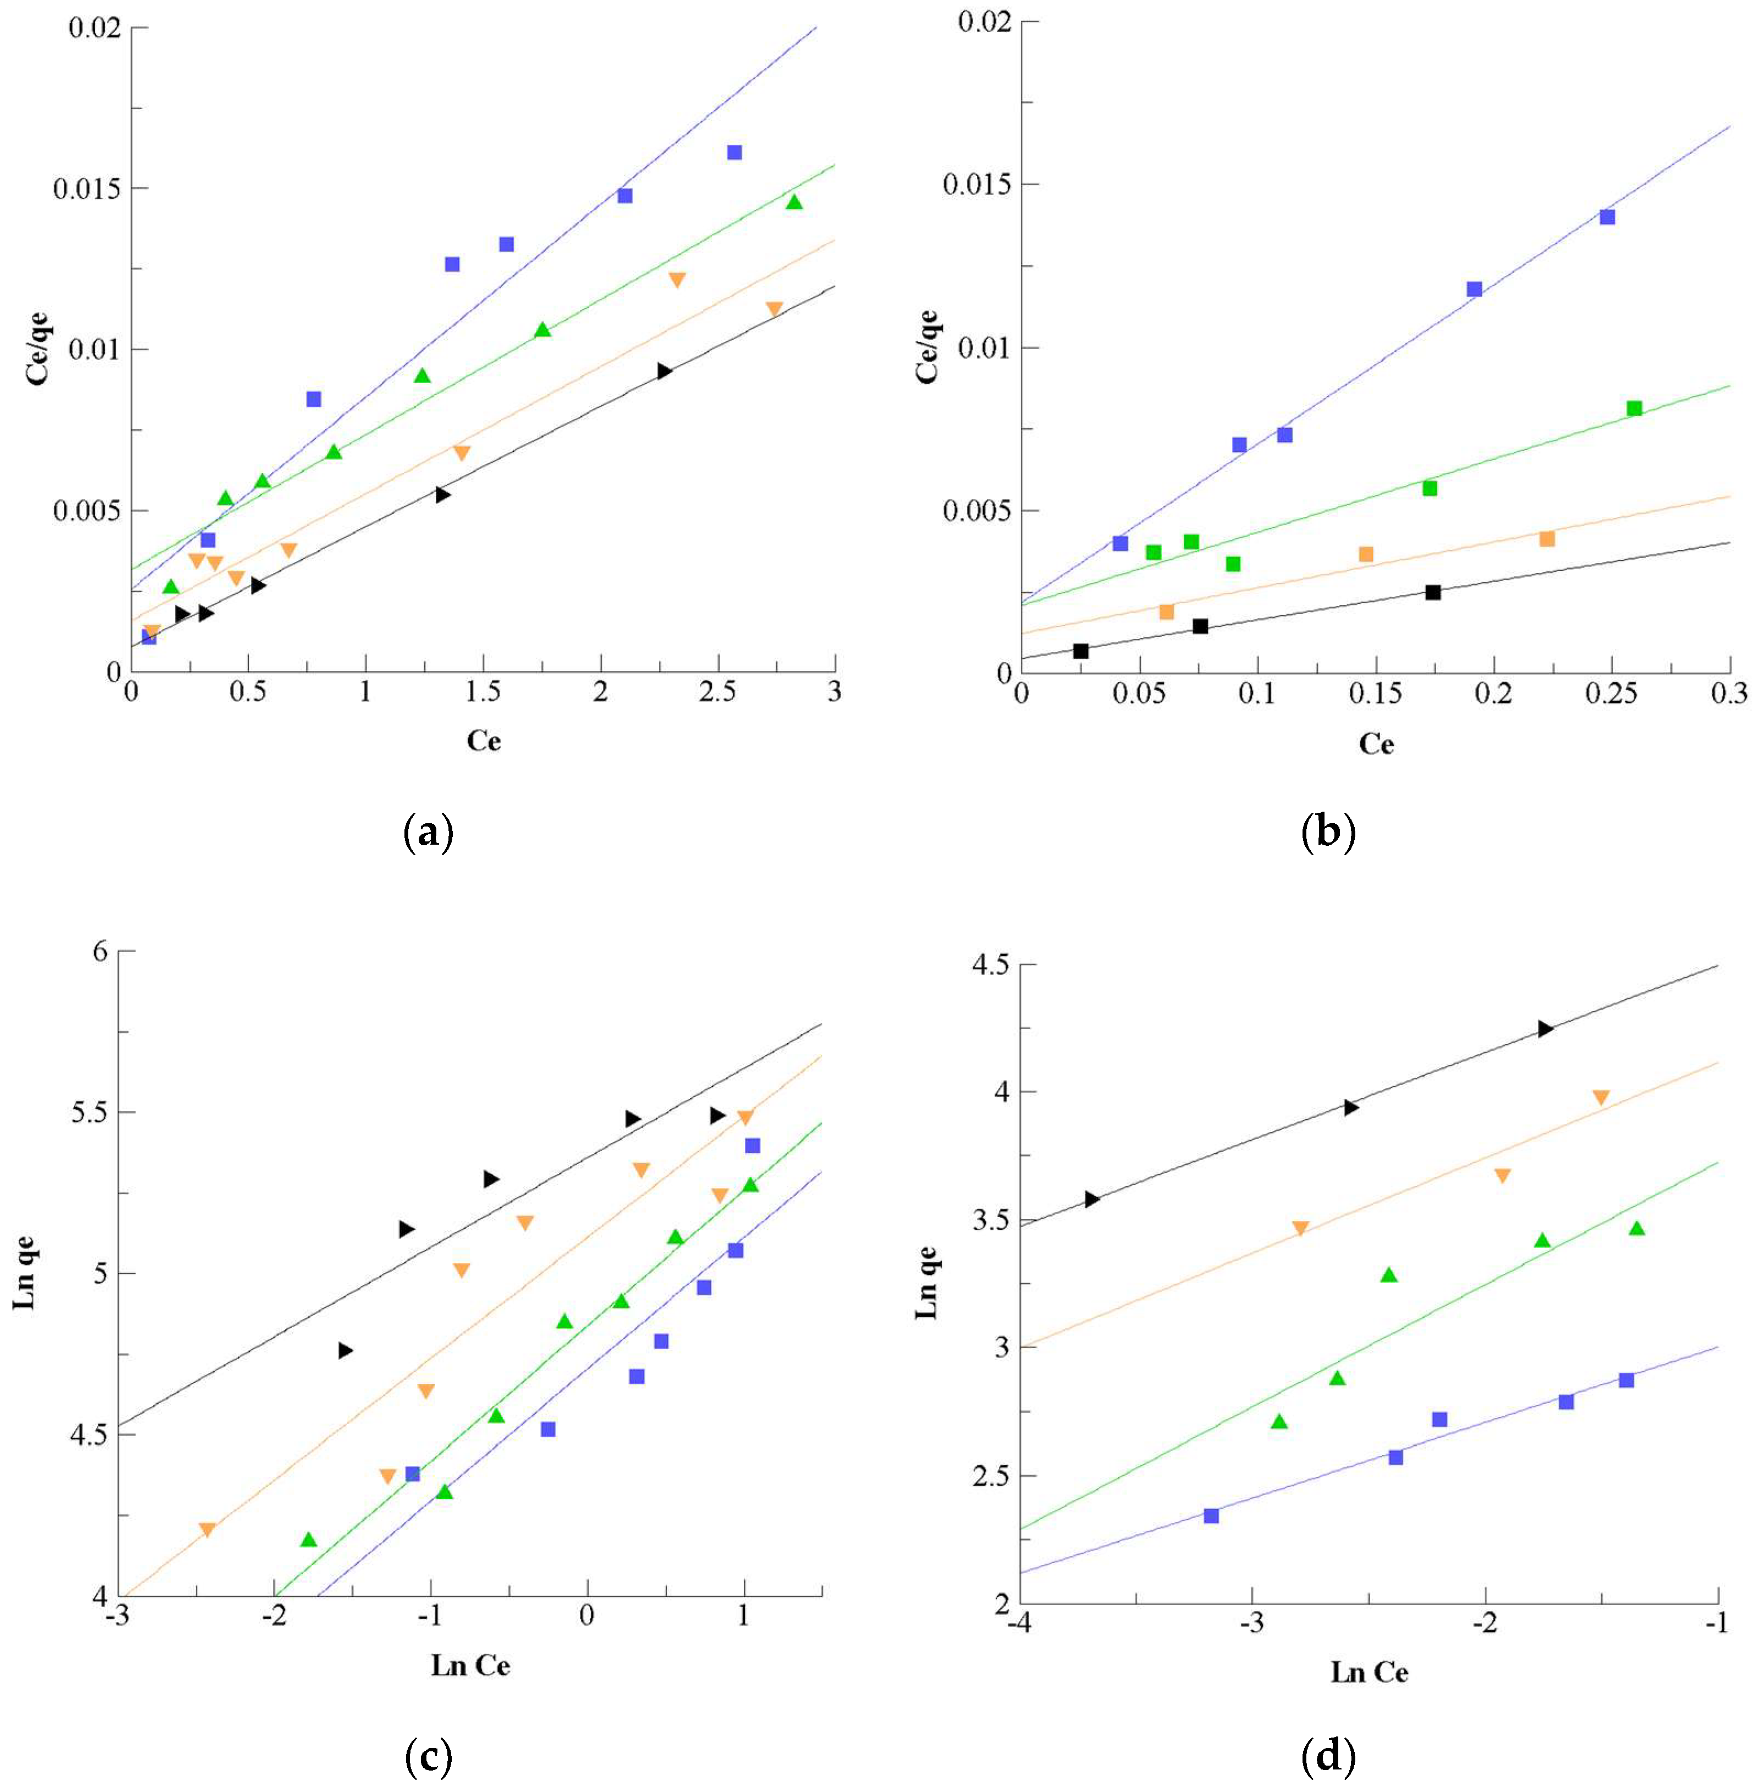
3.1.3. Adsorption Mechanism

The adsorption kinetics of sinigrin and gluconapin using PA312LOH resin (concentration of 20 g/L, 30 °C) were fitted using pseudo first order and pseudo second order models (Figure 9). The values of the correlation coefficients R² and the constant rates are given in the Table 4.
Results show that pseudo second order model describes better the adsorption kinetics for both sinigrin and gluconapin in comparison with the first order model. Moreover, the equilibrium adsorption capacity qe estimated for gluconapin using pseudo second order model is very similar to the experimental one (14.7 vs. 14.2 mg/g). Higher qe values were estimated for sinigrin using pseudo first and pseudo second order models (respectively 145.8 and 148.4 mg/g) in comparison to the experimental qe data (127.5 mg/g). This supposes that the equilibrium adsorption was not totally reached for sinigrin even after 120 min of adsorption. Constant rate K2 of gluconapin was higher than that of sinigrin. This confirms that the equilibrium adsorption of gluconapin was reached faster than that of sinigrin (40 min vs. 70–80 min).
The equation of Webber and Morris was used to identify the mechanism of diffusion. It can be seen that the plot of qt vs t0.5 (Figure 10) gives a curve with two linear sections for both sinigrin and gluconapin. The existence of such different sections supposes different adsorption mechanisms. The first linear section represents the solute adsorption on the adsorbent’s surface, while the second one represents the intra-particle diffusion, which is a limiting step for the adsorption process. Table 4 presents the respective constant rates Ki1 and Ki2 for each linear section. The value of Ki1 obtained for the first section is considerably higher than the value of Ki2 obtained for the second one for both sinigrin and gluconapin. Indeed, the adsorption of glucosinolates on the resin surface is a quick process with a high adsorption rate. Once saturation of the resin surface is reached, adsorbates move to the intern pores by diffusion, which is a slow process.

3.1.4. Glucosinolates Desorption Optimization

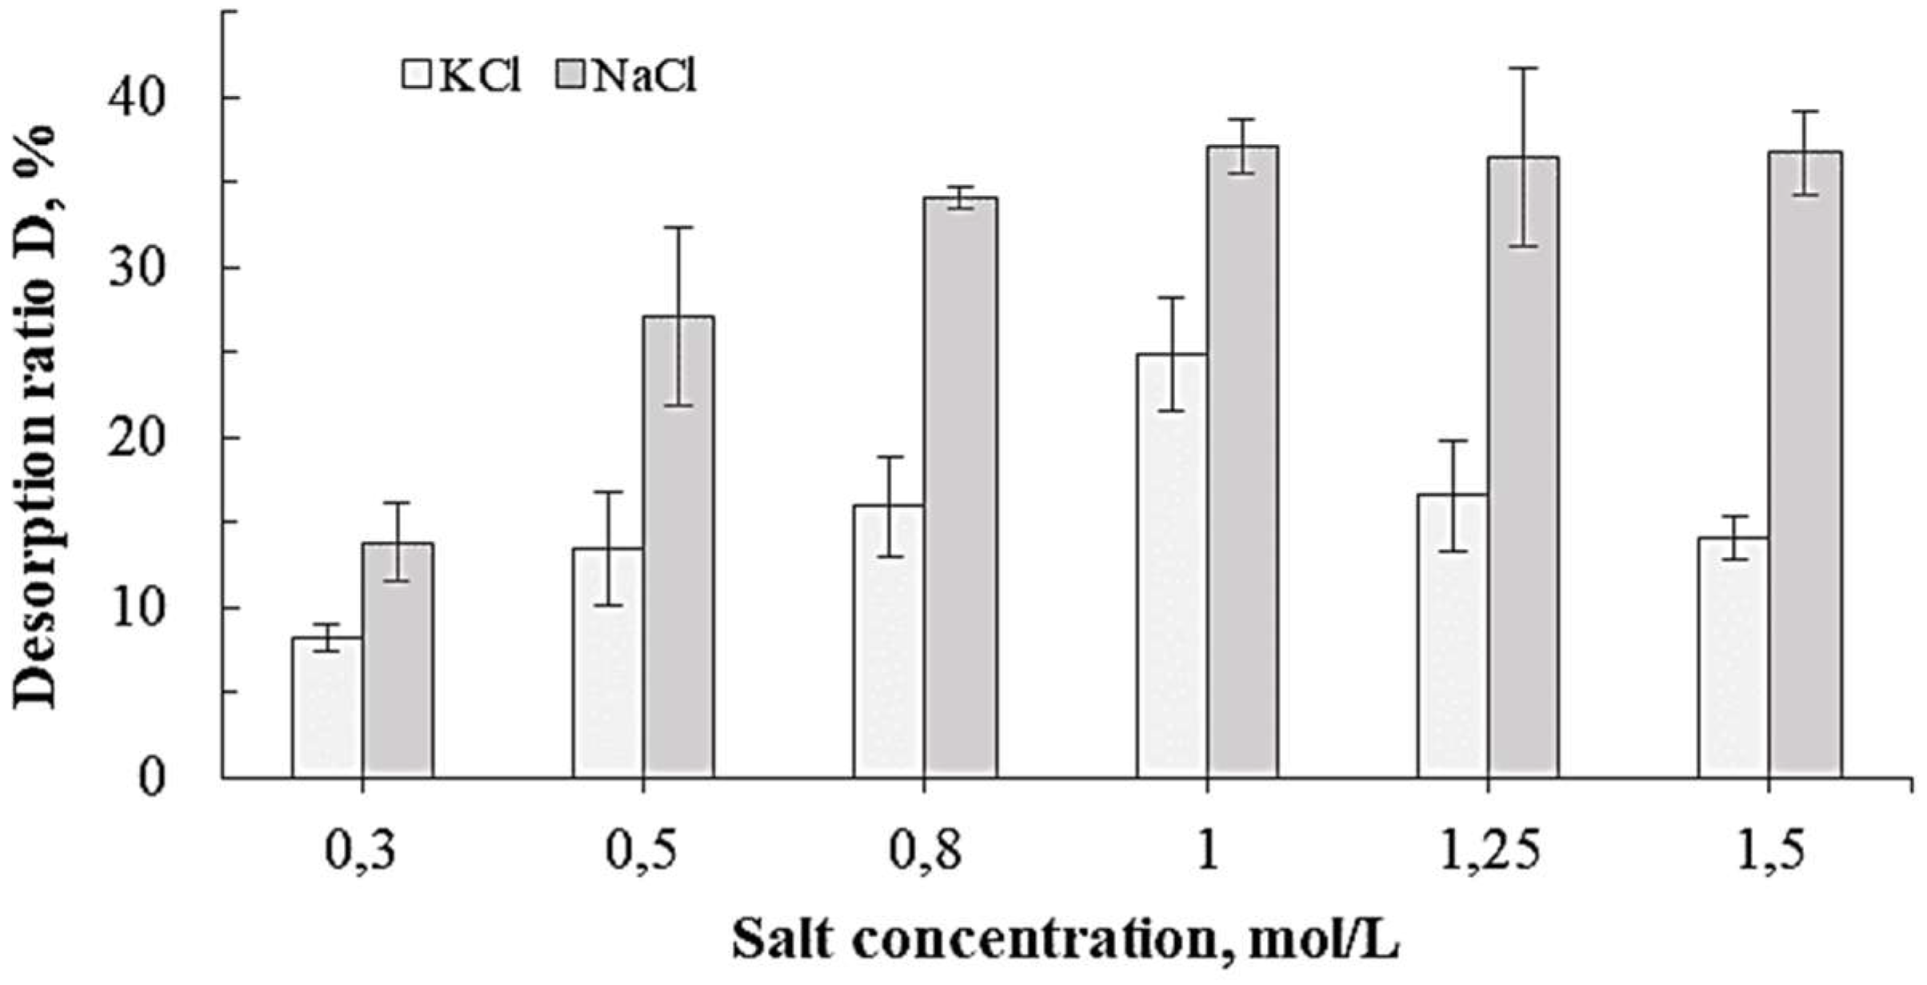
Influence of the Salt Concentration

KCl and NaCl were selected to perform the desorption in static mode based on their ability to solubilize glucosinolates. Indeed, glucosinolates can be easily dissolved in KCl or NaCl solutions to form ionic salts with K+ or Na+. The influence of salt concentration on the desorption of sinigrin in KCl and NaCl at 30 °C and 300 rpm for 90 min is presented in Figure 11. Results show that the desorption ratio of sinigrin increased with the increase of salt concentration up to a threshold value of about 1 mol/L. NaCl demonstrated better capacity of elution than KCl due to the higher ionic strength. However, the desorption ratio of sinigrin did not increase from its maximal value (37.7%) with NaCl concentration beyond the threshold value of 1 mol/L. Therefore, 1 mol/L NaCl solution was chosen for further desorption experiments.

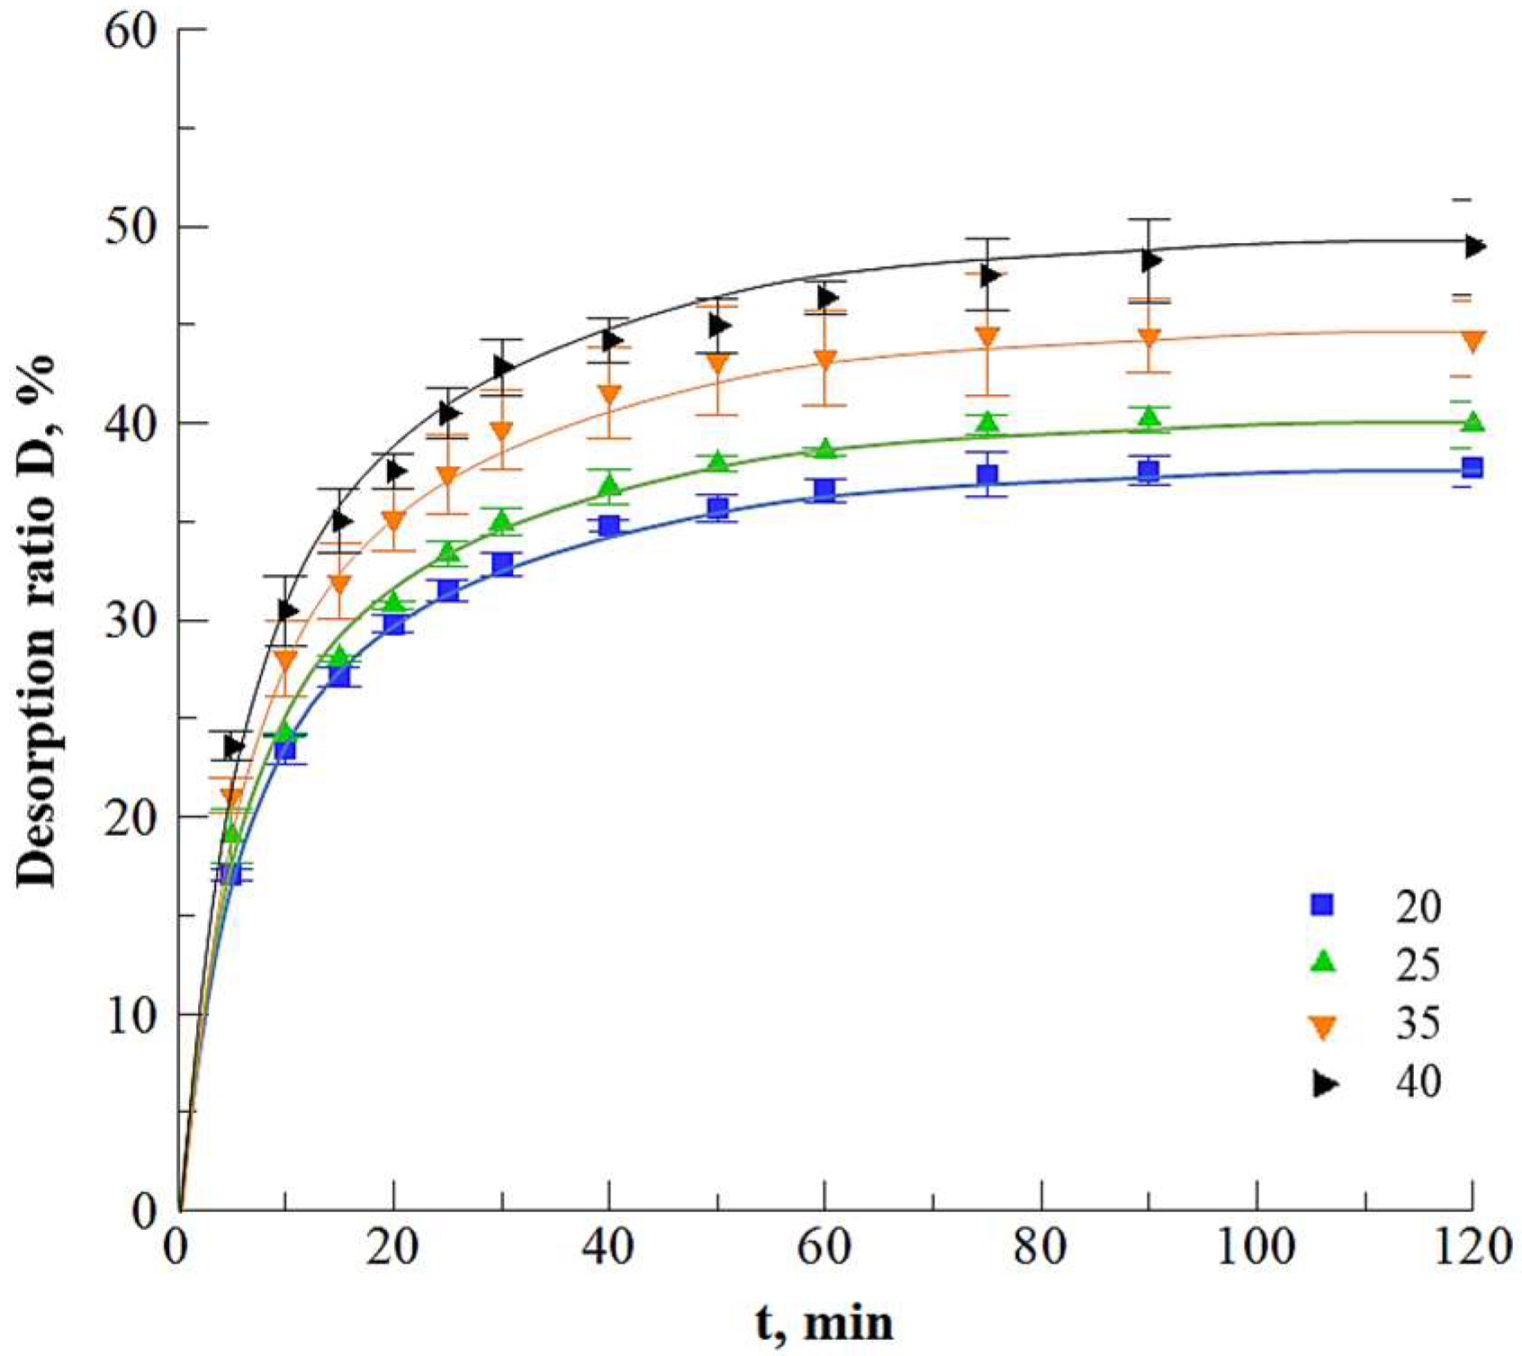
Kinetics of Desorption

Figure 12 presents the desorption kinetics of sinigrin in function of the volume of added eluent (mL/gresin) (using 1 mol/L NaCl solution). Data show that the desorption ratio increased rapidly at the beginning of the process before reaching a plateau after about 60 min. On the other hand, increasing the eluent volume from 20 to 50 mL/gresin allowed higher desorption ratio, increased from 37.7% to 50%. This is possibly due to the higher quantity of Cl- ions to be fixed on the resin matrix replacing the glucosinolates to attain the equilibrium state with a bigger volume of added eluent. The equilibrium reached after 60 min of desorption suggests a saturation of resin by operating in a static (batch) process.
This desorption ratio was overpassed by performing several times batch desorption in a consecutive way to maximize the sinigrin recovery (Figure 13). Resin was recovered by filtration after each step and washed with deionized water. The effect of eluent became negligible since the third desorption cycle. Operation with three desorption cycles allowed recovering 72.7% of sinigrin.
HPLC chromatogram of the juice after PA312LOH resin treatment (Figure 14) showed that the initial peaks of impurities have been considerably decreased and sinigrin was isolated. Juice purity Pr (Equation (7)) was increased from 43.05% to 79.63% for sinigrin after adsorption-desorption in a static mode. However, it is important to note that gluconapin was not detected in the eluted juice after purification. This could be explained by previous adsorption results, since gluconapin affinity with resin was higher than sinigrin affinity. Moreover, the initial low content of gluconapin in the extract complicated its detection in the eluted juice.

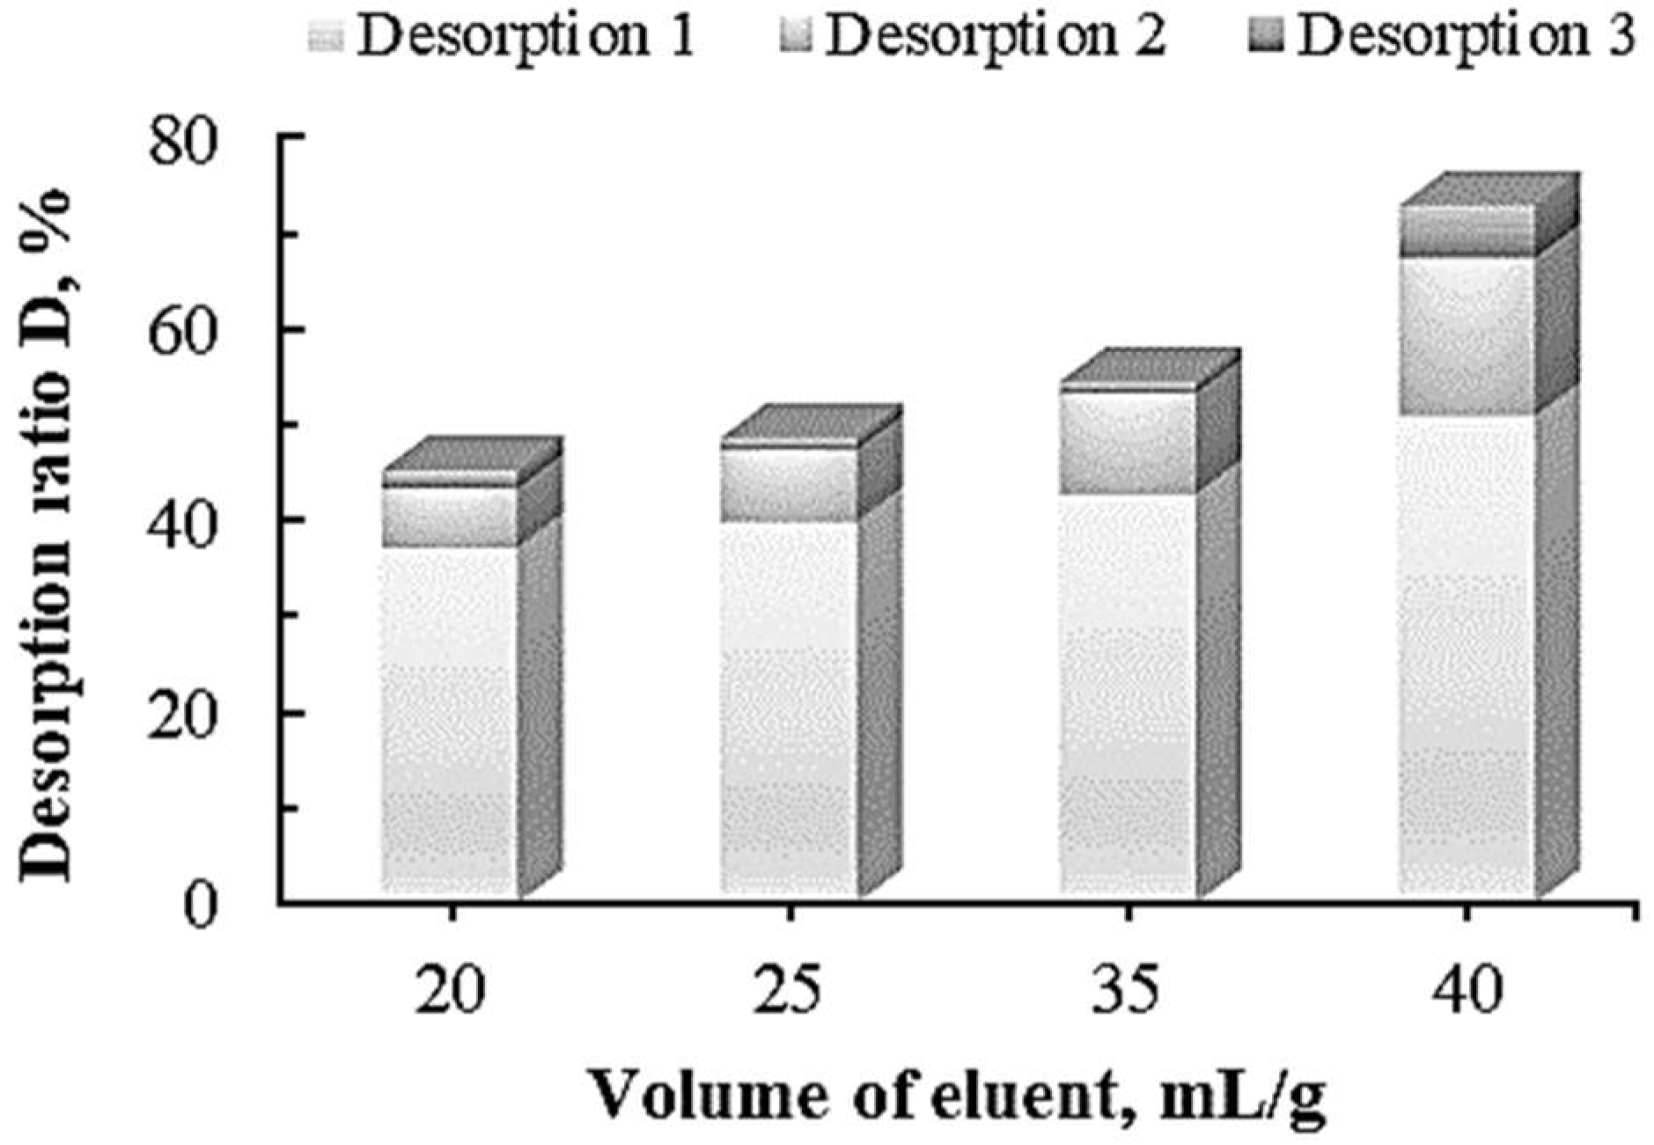
3.1.5. Resin Regeneration

NaOH was used to regenerate PA312LOH resin and to restore its initial exchange capacity. The influence of NaOH concentration and the liquid/solid ratio (mLNaOH/gresin) were studied. After regeneration, the resin was re-used for the adsorption of sinigrin. In all adsorption experiments, the temperature was maintained at 30 °C and the resin concentration was fixed at 40 g/L. The adsorption ratios obtained with the fresh (new) and the regenerated resins are presented in Figure 15. It can be observed that NaOH was efficient to regenerate the PA312LOH resin, even at a low concentration (2%) and low liquid/solid ratio (2 mL/g). For instance, resin regeneration with 2% NaOH aqueous solution permitted to attain a final (after 120 min) adsorption ratio of 96.6% with the regenerated resin versus 97.8% with the fresh one (Figure 15a). Therefore 2% NaOH concentration and 2 mL/g liquid/solid ratio were chosen as optimal parameters for resin regeneration. Moreover, desorption experiments performed with regenerated resin showed similar desorption ratios as for the fresh one, thus confirming the efficiency of the regeneration process.

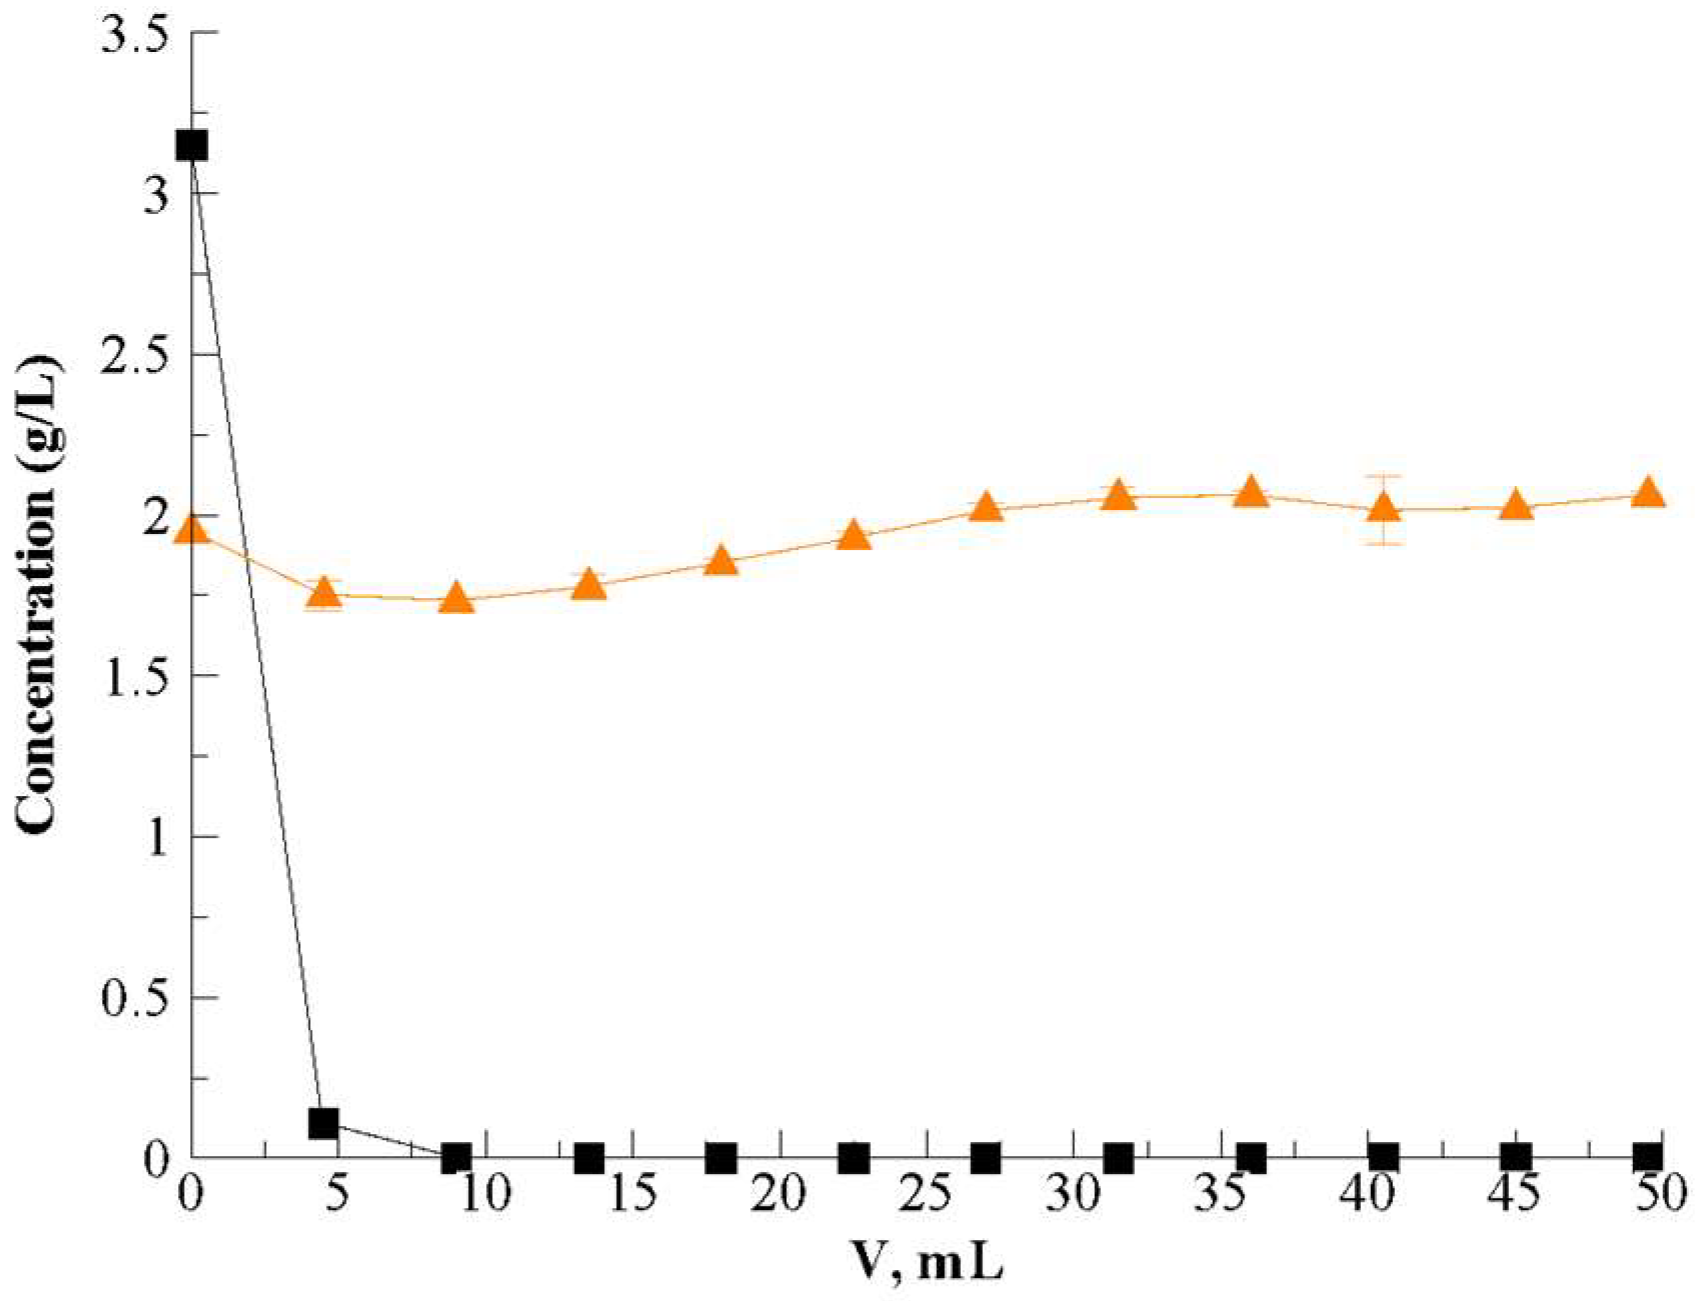
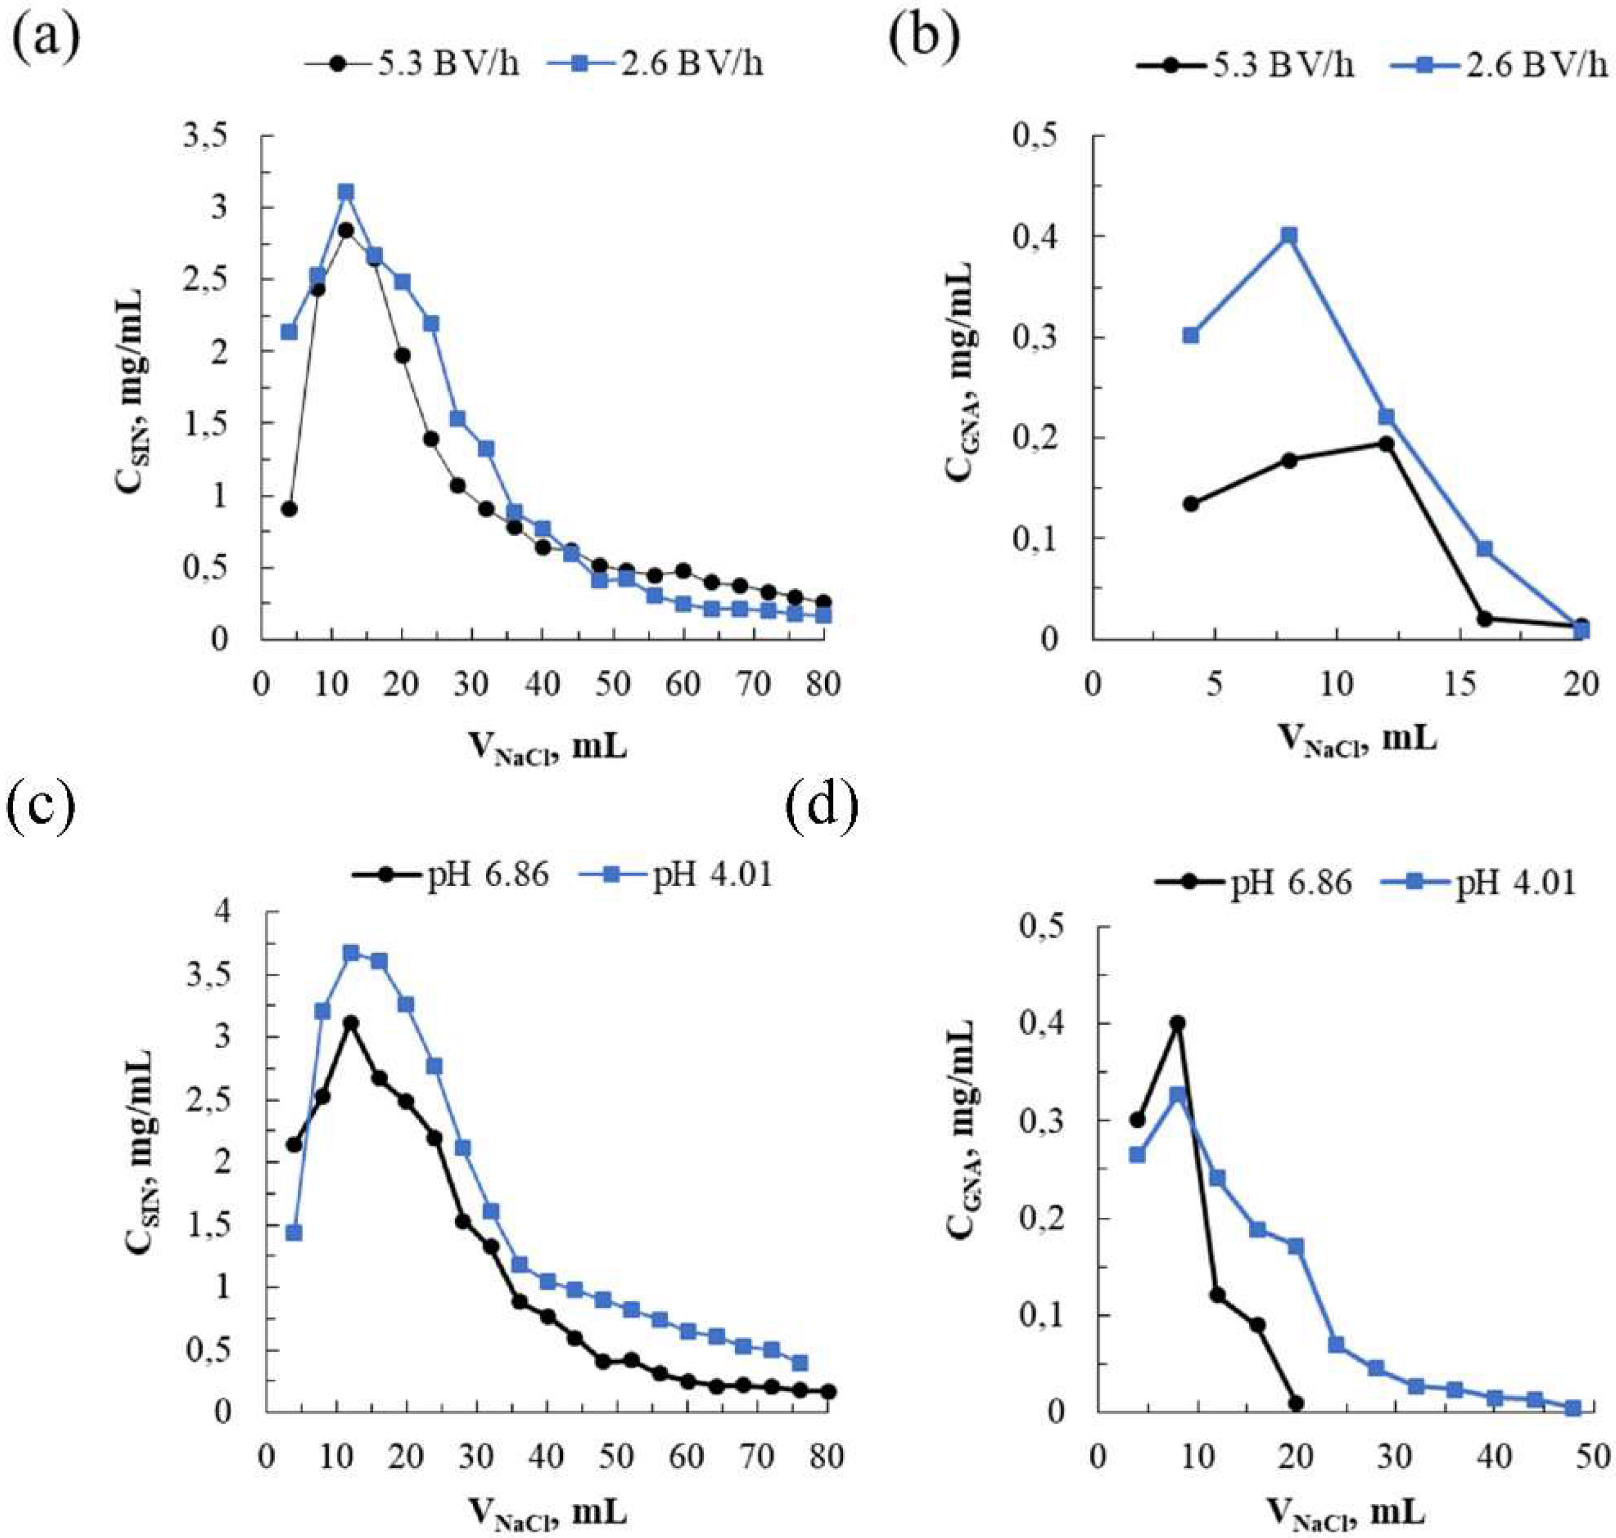
3.2. Dynamic (Continuous) Adsorption

The adsorption of 50 mL of juice on the packed column was performed at 5.3 BV/h and 30 °C. Analysis of the collected fractions showed that sinigrin was fully adsorbed on the bed resin (Figure 16) and separated from proteins that were fully recovered in the residual juice (no adsorption). Indeed, as we can see in Figure 16, the proteins concentration in the juice remained constant and equivalent to that of the crude juice (1.95 g/L).
Dynamic (continuous) desorption was then performed using 1 mol/L NaCl solution by varying the flow rate (5.3 and 2.6 BV/h) and the pH (6.86 and 4.01). Curves in Figure 17 show the impact of the flow rate and the pH on the desorption kinetics of glucosinolates (sinigrin and gluconapin) versus the volume of the NaCl solution pumped continuously through the column with a packed layer of PA312LOH. It was observed that the glucosinolates desorption rate in the eluate was increased from 40.4% to 49.3% for sinigrin and from 1.2% to 10.8% for gluconapin when the flow rate of NaCl solution (pH 6.86) was decreased from 5.3 to 2.6 BV/h. This can be attributed to the increase of the residence time in the column from 3 to 6 min with decreasing the flow rate from 5.3 to 2.6 BV/h. However, the recovery of sinigrin and gluconapin was considerably decreased in the portions of eluate beyond VNaCl = 40 mL and VNaCl = 20 mL, respectively (Figure 17a,b). Similarly to the static (batch) process, the gluconapin was less recovered than sinigrin. Increasing the eluent strength by modifying pH was then investigated. Decreasing the pH from 6.86 to 4.01 permitted us to increase the glucosinolates recovery from 49.3% to 64.5% for sinigrin and from 10.8% to 28% for gluconapin. This implies using eluate solutions with low pH to remove affinity between the resin matrix and glucosinolates. Other salts with theoretically better ionic strength, such as magnesium and calcium chloride, were not tested due to their toxicological aspects. Further analysis by comparing several strong anion resins for the adsorption and desorption of glucosinolates should be investigated in future. Low gluconapin recovery can be attributed to its strongly bound to the resin as compared to sinigrin. Their recovery can be improved by using much higher NaCl concentration for elution.

4. Conclusions

Separation and purification of sinigrin and gluconapin from crude aqueous extracts of brown mustard seeds (Brassica juncea) was studied in batch (static) and continuous (dynamic) modes using macroporous anion-exchange resins. Preliminary experiments showed that strongly basic resin PA312LOH has better affinity towards glucosinolates than the RELITE RAM1 weakly resin. Optimization experiments revealed that temperature increases the maximal adsorption capacity of both sinigrin and gluconapin on the resin PA312LOH. Modelling showed that the Freundlich model allows a good fitting of the experimental data. Using PA312LOH resin, proteins were not adsorbed, confirming the selectivity of separation. Optimization of the elution process was performed in static (batch) regime, and 72.9% of the isolated sinigrin was recovered thanks to NaCl aqueous solution (1 mol/L). The process was then validated in continuous (dynamic) mode with the recovery of 64.5% and 28% of sinigrin and gluconapin respectively. Analysis showed that the juice purity increased from 43.05% to 79.63%. Finally, resin was successfully regenerated using NaOH solution. It can be concluded that anion-exchange chromatography is a suitable and effective technique for glucosinolates purification.

Supplementary Materials

The following are available online at https://www.mdpi.com/article/10.3390/pr10020191/s1, Figure S1: Calibration curve etablished for sinigrin quantification.

Author Contributions

Experimental work, M.H. and E.S.; writing—review and editing, M.H., E.V. and H.M.; analysis, M.H.; project administration and funding acquisition, H.M. All authors have read and agreed to the published version of the manuscript.

Funding

This work is a research project (BRASSICA) funded by SAS PIVERT (Venette, France).

Institutional Review Board Statement

The study did not require ethical approval.

Informed Consent Statement

Not applicable.

Data Availability Statement

The study did not report any data.

Acknowledgments

We thank Jérôme Gervais and “Chambre d’Agriculture de la Côte-d’Or” (Bretenière, France) for providing seeds and DIAION Company for having provided us free samples of resins.

Conflicts of Interest

The authors declare no conflict of interest.

References

  1. Fahey, J.W.; Zalcmann, A.T.; Talalay, P. The chemical diversity and distribution of glucosinolates and isothiocyanates among plants. Phytochemistry 2001, 56, 5–51. [Google Scholar] [CrossRef]
  2. Holst, B.; Williamson, G. A critical review of the bioavailability of glucosinolates and related compounds. Nat. Prod. Rep. 2004, 21, 425–447. [Google Scholar] [CrossRef]
  3. Grubb, C.D.; Abel, S. Glucosinolate metabolism and its control. Trends Plant Sci. 2006, 11, 89–100. [Google Scholar] [CrossRef]
  4. Guerrero-Diaz, M.M.; Lacasa-Martínez, C.M.; Hernández-Piñera, A.; Martínez-Alarcón, V.; Lacasa-Plasencia, A. Evaluation of repeated bio disinfestation using Brassica carinata pellets to control Meloidogyne incognita in protected pepper crops. Span. J. Agric. Res. 2013, 11, 485–493. [Google Scholar] [CrossRef] [Green Version]
  5. Sotelo, T.; Lema, M.; Soengas, P.; Cartea, M.E.; Velasco, P. In vitro activity of Glucosinolates and their degradation products against Brassica-pathogenic bacteria and fungi. Appl. Environ. Microbiol. 2015, 81, 432–440. [Google Scholar] [CrossRef] [Green Version]
  6. Karyn, L.B. Glucosinolates. In Nutraceuticals: Efficacy, Safety and Toxicity, 2nd ed.; Ramesh, C.G., Rajiv, L., Ajay, S., Eds.; Elsevier: Boston, MA, USA, 2021; pp. 903–909. [Google Scholar]
  7. Sarwar, M.; Kirkegaard, J.A.; Wong, P.T.W.; Desmarchelier, J.M. Biofumigation potential of brassicas. Plant Soil. 1998, 201, 103–112. [Google Scholar] [CrossRef]
  8. Hebert, M.; Mhemdi, H.; Vorobiev, E. Dead-end ultrafiltration of rich glucosinolates juice extracted from mustard defatted meal: Effects of operating conditions on permeate quality and membrane fouling. Food Bioprod. Process. 2021, 128, 133–142. [Google Scholar] [CrossRef]
  9. Hebert, M. Nouvelles Approches Pour la Valorisation des Graines de Moutarde Riches en Glucosinolates dans un Concept de Bioraffinerie. Ph.D. Thesis, UTC, Compiègne, France, 2020. [Google Scholar]
  10. Bones, A.M.; Rossiter, J.T. The myrosinase-glucosinolate system, its organisation and biochemistry. Physiol. Plant. 1996, 97, 194–208. [Google Scholar] [CrossRef]
  11. Karcher, A.; Melouk, H.A.; El Rassi, Z. High-performance liquid phase separation of glycosides. 5. Determination of individual glucosinolates in cabbage and rapeseed by laser-induced fluorescence capillary electrophoresis via the enzymatically released isothiocyanate aglycon. J. Agric. Food Chem. 1999, 47, 4267–4274. [Google Scholar] [CrossRef] [PubMed]
  12. Zhou, J.; Qui, A.; Hu, J. Separation and purification of the main glucosinolates from rapeseeds. Chin. J. Chromatogr. 2005, 23, 411–414. [Google Scholar]
  13. Song, L.; Thornalley, P.J.; Iori, R. Purification of major glucosinolates from Brassicaceae seeds and preparation of isothiocyanates and amine metabolites. J. Sci. Food Agric. 2006, 86, 1271–1280. [Google Scholar] [CrossRef]
  14. Xie, Z.; Wang, R.; Wu, Y.; Yang, L.; Wang, Z.; Li, Y. An efficient method for separation and purification of glucosinolates stereoisomeres from radix isatidis. J. Liq. Chrom. Relat. Technol. 2012, 35, 153–161. [Google Scholar] [CrossRef]
  15. Fahey, J.W.; Wade, K.L.; Stephenson, K.K.; Chou, F.E. Separation and purification of glucosinolates from crude plant homogenates by high-speed counter-current chromatography. J. Chromatogr. A 2003, 996, 85–93. [Google Scholar] [CrossRef]
  16. Rochfort, S.; Caridi, D.; Stinton, M.; Trenerry, V.C.; Jones, R. The isolation and purification of glucoraphanin from broccoli seeds by solid phase extraction and preparative high performance liquid chromatography. J. Chromatogr. A 2006, 1120, 205–210. [Google Scholar] [CrossRef]
  17. Lee, I.; Boyce, M.C. Extraction and Purification of Glucoraphanin by Preparative High-Performance Liquid Chromatography. J. Chem. Educ. 2011, 88, 832–834. [Google Scholar] [CrossRef]
  18. Toribio, A.; Nuzillard, J.M.; Renault, J.H. Strong ion-exchange centrifugal partition chromatography as an efficient method for the large-scale purification of glucosinolates. J. Chromatogr. A 2007, 1170, 44–51. [Google Scholar] [CrossRef]
  19. Hamzaoui, M.; Hubert, J.; Reynaud, R.; Marchal, L.; Foucault, A.; Renault, J.H. Strong ion exchange in centrifugal partition extraction (SIX-CPE): Effect of partition cell design and dimensions on purification process efficiency. J. Chromatogr. A 2012, 1247, 18–25. [Google Scholar] [CrossRef] [PubMed]
  20. Liu, Y.L.; Sun, M. Ion exchange removal and resin regeneration to treat per- and polyfluoroalkyl ether acids and other emerging PFAS in drinking water. Water Res. 2021, 207, 117781. [Google Scholar] [CrossRef]
  21. Susanto, H.; Roihatin, A.; Widiasa, I.N. Production of colorless liquid sugar by ultrafiltration coupled with ion exchange. Food Bioprod. Process. 2016, 98, 11–20. [Google Scholar] [CrossRef]
  22. Kiefer, R.; Höll, W.H. Sorption of Heavy Metals onto Selective Ion-Exchange Resins with Aminophosphonate Functional Groups. Ind. Eng. Chem. Res. 2001, 40, 4570–4576. [Google Scholar] [CrossRef]
  23. Delmousse, G.; Poupinel, J.C. Purification and Stabilization of Fruit Juices by Ion Exchange Treatment. U.S. Patent US2667417A, 19 October 1951. [Google Scholar]
  24. Vera, E.; Dornier, M.; Ruales, J.; Vaillant, F.; Reynes, R.M. Comparison between different ion exchange resins for the deacidification of passion fruit juice. J. Food Eng. 2003, 57, 199–207. [Google Scholar] [CrossRef]
  25. Reynaud, E.; Duvat, C.; Baudouin, S.; Meurisse, J. Deacidified Cranberry Juice and the Process for Preparing the Same. U.S. Patent US20190216112A1, 14 June 2018. [Google Scholar]
  26. Elder, D.P. Pharmaceutical Applications of Ion-Exchange Resins. J. Chem. Educ. 2005, 82, 575. [Google Scholar] [CrossRef]
  27. Hebert, M.; Mhemdi, H.; Vorobiev, E. Selective and eco-friendly recovery of glucosinolates from mustard seeds (Brassica juncea) using process optimization and innovative pretreatment (high voltage electrical discharges). Food Bioprod. Process. 2020, 124, 11–23. [Google Scholar] [CrossRef]
  28. Treybal, R.E. Mass Transfer Operation; Tata McGraw Hill: Singapore, 1981. [Google Scholar]
  29. Kajjumba, G.W.; Emik, S.; Ongen, A.; Ozcan, H.K.; Aydin, S. Modelling of Adsorption Kinetic Processes—Errors, Theory and Application; IntechOpen Limited: London, UK, 2018. [Google Scholar]
  30. Wang, T.; Liang, H.; Yuan, Q. Separation and Purification of Sinigrin and Gluconapin from Defatted Indian Mustard Seed Meals by Macroporous Anion Exchange Resin and Medium Pressure Liquid Chromatography. Sep. Sci. Technol. 2014, 49, 1838–1847. [Google Scholar] [CrossRef]
  31. Wang, T.; Liang, H.; Yuan, Q. Separation of sinigrin from Indian mustard (Brassica juncea L.) seed using macroporous ion-exchange resin. Korean J. Chem. Eng. 2012, 29, 396–403. [Google Scholar] [CrossRef]
Figure 1. Chemical structure of (A) sinigrin and (B) gluconapin.
Processes 10 00191 g001
Figure 2. HPLC chromatogram (229 nm) of raw juice. The retention times of sinigrin (1) and gluconapin (2) are 5.3 and 6.9 min respectively.
Processes 10 00191 g002
Figure 3. Static adsorption kinetics of sinigrin (a1,a2) and gluconapin (b1,b2) using strongly (PA312LOH) and weakly basic resin (RELITE RAM1) with various solid-liquid ratio (gresin/Ljuice) at 30 °C and 300 rpm.
Processes 10 00191 g003
Figure 4. Impact of the resin type on the final adsorption capacity of sinigrin and gluconapin.
Processes 10 00191 g004
Figure 5. FTIR spectra of (1) standard of sinigrin (2) new PA312LOH resin before its use (3) resin after adsorption (4) resin after desorption.
Processes 10 00191 g005
Figure 6. Illustration of sinigrin adsorption and desorption mechanisms using strongly basic anion-exchange resin PA312LOH.
Processes 10 00191 g006
Figure 7. Impact of temperature and PA312LOH resin concentration on the adsorption of (a) sinigrin and (b) gluconapin at 300 rpm.
Processes 10 00191 g007
Figure 8. Application of Langmuir and Freundlich models to experimental glucosinolates adsorption (PA312LOH resin) data at (■) 20 °C, (▲) 30 °C, (▼) 40 °C and (►) 60 °C: (a) application of Langmuir model for sinigrin adsorption data; (b) application of Langmuir model for gluconapin adsorption data; (c) application of Freundlich model for sinigrin adsorption data and (d) application of Freundlich model for gluconapin adsorption data.
Processes 10 00191 g008
Figure 9. Modelling of (■) sinigrin and (▲) gluconapin kinetics adsorption with PA312LOH resin (resin concentration 20 g/L, 30 °C) using (a) pseudo first order model and (b) pseudo second order model.
Processes 10 00191 g009
Figure 10. Application of Webber and Morris equation to the adsorption data of (a) sinigrin and (b) gluconapin using PA312LOH resin (resin concentration 20 g/L, 30 °C). The experimental points are represented by the symbols “” and “”.
Processes 10 00191 g010
Figure 11. Influence of salt concentration on the desorption ratio of sinigrin with KCl and NaCl solutions at 30 °C and 300 rpm for 90 min (static mode of desorption).
Processes 10 00191 g011
Figure 12. Desorption kinetics of sinigrin with various volumes of eluent in the range 20–40 mL/gresin using 1 M NaCl (30 °C, 300 rpm).
Processes 10 00191 g012
Figure 13. Desorption ratio of sinigrin after several desorption cycles using 1.0 NaCl and various liquid-solid ratios at 30 °C.
Processes 10 00191 g013
Figure 14. HPLC chromatogram of glucosinolates (1. sinigrin; 2. gluconapin) in the juice before and after the purification treatment with PA312LOH resin.
Processes 10 00191 g014
Figure 15. Adsorption ratio of sinigrin for different adsorption durations after the PA312LOH resin regeneration by NaOH solutions. (a) Experiments with variable NaOH concentrations and fixed liquid/solid ratio of 8 mLNaOH/gresin; (b) for variable liquid/solid ratios and fixed NaOH concentration of 2%.
Processes 10 00191 g015
Figure 16. Concentration of () sinigrin and () proteins in the juice during the dynamic adsorption at 5.3 BV/h and 30 °C.
Processes 10 00191 g016
Figure 17. Evolution of sinigrin (a,c) and gluconapin (b,d) concentration during the desorption process versus the volume of NaCl solution pumped continuously through the column with layer of PA312LOH resin at different flow rates (a,b) and pH (c,d).
Processes 10 00191 g017
Table 1. Physical properties of the macroporous ion-exchange resins used.
ParameterPA312LOHRELITE RAM1
Polymeric matrixStyrèneStyrène-DVB
Functional groupQuaternary amineTertiary amine
Density (g/mL)1.11.03–1.05
Exchange capacity (eq/L)0.91.5
Particle diameter (mm)0.450.7
Moisture content (%)43–5550–58
Table 2. Temkin parameters estimated by fitting sinigrin adsorption experimental adsorption data at various temperatures in the range 20–60 °C.
T (°C)20304060
Q (J/mol)32.5741.8245.5955.21
KT (mL/g)2.528.7121.3174.77
0.9310.9900.9300.932
Table 3. Langmuir and Freundlich adsorption parameters of sinigrin and gluconapin using PA312LOH resin at different temperatures in the range 20–60 °C.
20 °C30 °C40 °C60 °C
SinigrinLangmuir model
0.9290.9030.9530.997
q0 (mg/g)167.2194.2261.1268.1
KL2.352.042.004.88
RL0.110.120.120.05
Freundlich model
0.8660.9730.8730.833
KF109.9124.0165.7212.4
1/n0.230.480.380.28
GluconapinLangmuir model
0.9940.940.9140.989
q0 (mg/g)20.544.671.484.8
KL22.3411.3810.7225.16
RL0.110.200.200.10
Freundlich model
0.9630.8170.910.999
KF27.166.789.1125.9
1/n0.290.480.370.34
Table 4. Kinetic parameters for the adsorption of glucosinolates with PA312LOH resin.
Kinetic ParametersSinigrinGluconapin
Pseudo first order
0.9210.936
qe (mg/g)145.88.63
K1·10−2 (min−1)4.1910.68
Pseudo second order
0.9850.998
qe (mg/g)148.414.7
K2·10−2 (g/mg.min)0.102.51
qe experimental (mg/g)127.514.2
Intra-particle diffusion
R1²0.9670.926
Ki1 (mg/g.min−0.5)11.603.29
C116.030.27
R2²0.8210.665
Ki2 (mg/g.min−0.5)2.480.104
C279.8613.3
Publisher’s Note: MDPI stays neutral with regard to jurisdictional claims in published maps and institutional affiliations.

