Article

Energy Analysis on Wheat Yield of Mongolian Agriculture

1
Institute of Agricultural Economics and Development, Chinese Academy of Agricultural Sciences, Beijing 100081, China
2
Department Vegetation Ecology and Plant Economic, Botanic Garden and Research Institute, Mongolian Academy of Science, Ulaanbaatar 13330, Mongolia
*
Author to whom correspondence should be addressed.
Processes 2022, 10(2), 190; https://doi.org/10.3390/pr10020190
Submission received: 14 December 2021 / Revised: 6 January 2022 / Accepted: 11 January 2022 / Published: 18 January 2022

Abstract

:
Agricultural policies should be aimed at enhancing production per unit area and help to reduce the cultivated area. To that end, it is critical to conserve soil fertility, promote ecological agriculture, employ climate change adaptation technology, significantly enhance irrigated agriculture, and decrease agricultural production risks. Sustainable agricultural production requires optimized land usage, increased energy efficiency, reduced use of fossil fuels, and minimized environmental consequences. Energy has been used in agriculture in a dramatically increased manner, and the agri-food chain now accounts for 30% of the total global energy use. Energy analysis quantifies the amount of energy used in agricultural production, so it may be used to optimize energy consumption and boost energy efficiency, further propelling the sustainable development of agriculture. Recently, the Mongolian government has expressed concerns about how to realize food sustainability and self-sufficiency in wheat production and agriculture, while also maintaining environmental sustainability. However, there is a substantial study gap between agriculture and energy analysis in Mongolia. This study investigated energy consumption and the effects of energy inputs and energy types on the agricultural production of Mongolia from 2005 to 2018. The output was calculated based on the annual wheat equivalent for the 14 major provinces as a whole. The output level is given as a function of human labor, machinery, electricity, diesel fuel, fertilizers, pesticides, irrigation water, and seed energy, and the yield and different energy inputs are determined using the ordinary least squares of the Cobb–Douglas function. Total energy input grew from 2359.50 MJ ha−1 in 2005 to 3047.61 MJ ha−1 in 2018, while total output energy increased from 2312.08 MJ ha−1 to 4562.56 MJ ha−1. During this period, the energy use efficiency (input–output ratio), energy productivity, and net energy of wheat production were studied. The fertilizer inputs were statistically significant. The contribution of nitrogen, diesel, and irrigation water towards the production level was 3.52, 3.09, and 2.33, respectively. As a result, the data indicated that non-renewable, direct, and indirect energy sources all had a positive impact on the output level. Furthermore, non-renewable energy in Mongolian agriculture has been used in a significantly increased manner.

1. Introduction

With the growth of the population, agriculture has developed, especially the production of various crops. However, the supply of arable land and environment is limited. Because of these limitations, humans face significant challenges regarding how to provide sufficient food supplies for large-scale production. Long-term energy usage in agri-food systems is unsustainable [1]. The sustainable agriculture movement originated from several reform movements in the United States, Canada, and Western Europe to address concerns about the impact of agriculture, such as the depletion of non-renewable resources, soil degradation, the health and environmental effects of agricultural chemicals, inequity, declining rural communities, loss of traditional agrarian values, food quality, farmworker safety, declining self-sufficiency, and a decreasing number of farmers. These concerns were related to “conventional agriculture, which was deemed unsustainable” [2]. The term “conventional agriculture” is used to define and justify many agricultural processes. Conventional agriculture is characterized as “capital-intensive, large-scale, highly automated one with monoculture, extensive use of chemical fertilizers, herbicides, and pesticides, as well as intense animal husbandry” [3,4].
Terms used to describe the various farming types include organic farming, biological agriculture, alternative agriculture, ecological agriculture, low-input agriculture, biodynamic agriculture, regenerative agriculture, permaculture, and agroecology [3,4,5,6].
Agricultural sustainability is one of the highest priorities in all countries, whether they are developed or developing countries [7].
The food system now utilizes 30% of the world’s available energy, of which more than 70% is used outside the farm gate, and contributes more than 20% of global greenhouse gas (GHG) emissions (around 31%, if the land-use change is included). At the same time, around one-third of the food we produce is lost or wasted. Furthermore, current food systems are significantly reliant on fossil fuels. It is predicted that there will be considerable and simultaneous increases in the demand for water, energy, and food over the next few decades.
Such increases will result in reduced and degraded natural resources, as well as further climate change issues [1]. The agri-food industry is both an energy consumer and a potential energy generator. While ensuring full access to modern energy services along agri-food chains should be the top priority, this should be achieved by improving energy efficiency and gradually increasing the use of renewable energy in order to decouple the development from the current high reliance on fossil fuels. These issues are addressed by the FAO’s Energy-Smart Food for People and Climate Programme.
The combination of energy efficiency and increased usage of renewable energy will reduce agriculture’s dependence on fossil fuels and reduce the sector’s GHG emissions. This research aimed to evaluate the energy inputs required for wheat yield and to compare the energy output–input ratio.
Mongolia is one of the most coal-dependent developing members of the Asian Development Bank (ADB), and its energy sector is the major contributor to its greenhouse gas emissions, accounting for almost two-thirds of the total emissions, according to James Lynch, Director General of ADB’s East Asia Department (EARD). “In order to decarbonize Mongolia’s energy sector, the government wants to increase the share of renewable energy, particularly wind and solar energy, and Mongolia has a lot of potential in these aspects” [8]. The total wind and solar power in the country is expected to reach 2600 GW of installed capacity or 5457 terawatt-hours of renewable electricity output per year. The amount is sufficient to meet the country’s energy needs (about 1.2 GW as of 2018). Moreover, with appropriate transmission infrastructure, it can even meet the energy needs of Northeast Asia. As stated in the State Policy on Energy from 2015 to 2030, the government aims for renewable energy to account for 20% of the total installed capacity by 2023 and 30% by 2030.
“For various reasons, the country’s abundant renewable energy resources have yet to be fully utilized,” says Sujata Gupta, Director of the Asian Development Bank’s Sustainable Infrastructure Division in the East Asia Department. “One of the difficulties is the unpredictability of renewable energy supply and the lack of regulatory reserve or flexible generation” [9].
The use and management of various forms of energy in irrigated crop production systems are affected by many factors, such as the farming community’s socioeconomic conditions, the size of the farmers’ holdings, the physical condition of the systems, the availability of the various factors of production, the mode of irrigation, agronomic practices, transportation, and processing. The production of wheat yield systems is not only desired from an economical perspective, but it is also detrimental to the environment. The significance of energy shortages and environmental challenges requires a comprehensive investigation, but due to time and financial constraints, it is difficult to examine all of these broad themes in just one study. The energy used by gravity flow in the study area is not within the scope of this study, and farmers do not know how much water they consume. Central Mongolia is famous for its high wheat yield and intensive agricultural production. Different types and sources of energy used in the wheat farming system must be properly defined; otherwise, the study will become very complicated because there are different types of energy, such as direct, indirect, and embodied energy, as well as physical, chemical, and biological energy. As a result, the study only focuses on determining how many MJ of energy are spent at the farm level to create one MJ of wheat-based input.
After mining, agriculture is the second leading pillar of the Mongolian economy [10]. In particular, wheat and grain are important staple crops in Mongolia’s agricultural productions [11]. As an outcome, the Mongolian government implemented a number of agricultural projects to increase the food production in the study area to meet people’s food needs and to drive economic development. Monitoring wheat-growing areas is thus critical for developing regional food security strategies.
One of the most important projects is the third agricultural land restoration project, named “Atar”. This initiative aims to accelerate agriculture on Mongolia’s fertile land by providing legally and economically favorable agricultural circumstances, and gradually providing people with safe products (thereby reducing the dependency on imports) [12]. Nonetheless, we continue to rely on imported crops for crop production, for example wheat, flour, potatoes, vegetables, and fruits.
In 2017, the total sown area of Mongolia was 524.3 thousand hectares. Wheat accounts for about 75% of the total sown area, and potatoes, vegetables, and other crops account for the remaining 25% [13]. Wheat output was 231.4 thousand tons—a twofold decline from the same period the previous year, and a 42% decrease from the five-year average [14].
Furthermore, the national average yield for 2017 was an estimated 0.6 t ha−1, down from 1.34 t ha−1 in 2016. The reduced production was caused by meteorological conditions similar to drought. The previous year’s protracted period of extreme dry weather, coupled with abnormal high temperatures, affected wheat crops throughout important growth phases, such as heading and flowering [15]. In 2017, wheat imports reached 13.6 thousand tons—10 times less than in 2016. Crop output has grown since the third land rehabilitation project in 2008. Despite a 0.75-fold increase in domestic wheat output, Mongolia still imports a large amount of wheat [8]. In a study in Mongolia in 2017, Natsagdorj et al. [16] used remote sensing data to set up the soil moisture index in Mongolia and compare it to the plant index. In the study, the moisture index for April–August 1982–2002 was calculated based on the EMT+VS model. The model calculates the precipitation and potential evaporation, and uses the precise multispectral data during the phenological stages of wheat cultivation. Amar and Robert [14] examined the factors behind the total function of wheat import demand in Mongolia from 1997 to 2017 based on a double log-linear regression model. In its sustainable development vision for 2050, the Mongolian government focuses on national policies in the field of agricultural sustainable development. It is necessary to implement strategic objectives so as to achieve sustainable development in the field of crop production, such as the efficient use of land resources, improving soil fertility, reform in the seed supply system, expanding irrigation farming, and introducing advanced techniques and methodologies that are adaptable to climate change [17]. Considering the limited natural resources and the impact of alternative energy sources on environmental and human health, energy usage patterns in agriculture need to be studied [18].
Similarly, Mongolia’s agricultural sector often focuses on how to achieve a high level of food security, while providing enough income for food producers [7]. Modern agricultural systems involve agriculture sustainability and can be divided into three dimensions: economy, society, and environment. Each dimension has its own sustainability indicators [19]. The environmental dimension has an energy balance indicator. Farm energy balance, measured in energy units, can be calculated using an input–output focus. The higher the value of this indicator, the more sustainable the farm is from an environmental perspective. Improving self-sufficiency in the production of strategic crops (wheat, barley, potatoes, and vegetables) is one of the objectives for Mongolian policymakers [20]. Currently, Mongolia mainly satisfies its need for these crops by importing them. For economic and social reasons, it is necessary to increase national production and self-sufficiency. Since the advent of mechanization, chemical fertilizers, high-yielding crops, and pesticides, Mongolia’s agricultural production model has developed significantly, resulting in major changes in crop energy flows and an excessive dependence on fossil fuel. As a result, it is important to analyze energy consumption patterns and energy efficiency in alternative production systems [21]. There are few energy flow studies in Mongolia and other developing countries because the research area of agricultural energy use has drawn less attention from the public [22,23]. This research aimed to determine the relationship between wheat yield and input–output energy efficiency. The current study examined the energy input–output of Mongolian agriculture’s wheat yield based on the data from 2005 to 2018. Furthermore, this study investigated the ratio of energy input and output, energy use efficiency, net energy, and energy use for various sources, such as renewable, non-renewable, direct, and indirect sources [24].
Mongolian officials have recently expressed concern about how to achieve food sustainability and self-sufficiency in wheat production and other agricultural needs, while remaining environmentally considerate. Nonetheless, there is a substantial study gap between Mongolian agriculture and energy studies. As a result, this study aimed to define the objective and scope of energy analysis on agricultural production systems, analyze input and output characteristics, allocate energy equivalents, and quantify energy consumption indicators. Because of our survey of agricultural energy use in manufacturing, it is essential to develop more efficient production processes. Various agricultural production activities, such as cultivation, harvesting, and post-harvest logistics, use energy either directly or indirectly. The data interpretation can help policymakers, farmers, and manufacturers improve energy efficiency and the long-term profitability of agricultural production.

2. Materials and Methods

Mongolia is located in East Asia, between latitudes 41° and 52° N and longitudes 87° and 102° E (Figure 1). Mongolia has a total of 21 provinces, and the study was completed in 14 main wheat harvesting provinces. These provinces are located in the western (Zavkhan, Khovd, Uvs), west-central (Orkhon, Uvurkhangai, Bulgan, Arkhangai, Khuvsgul), central (Tuv, Selenge, Darkhan-uul), and eastern (Dornod, Sukhbaatar, Khentii) parts of Mongolia (Figure 1). The remaining seven provinces are located in the south and belong to the Gobi desert and semi-desert areas.
Table 1 was used to calculate the inputs used in wheat production (manpower, machinery, diesel, pesticides, chemical fertilizers, irrigation water, electricity, and seeds) and to calculate the energy equivalent in the study. The amounts of the inputs were calculated per hectare, and then multiplied by the coefficient of energy equivalents coefficients given in MJ per unit [25].
For growth and development, energy forms in agriculture can be classified as direct and indirect, and renewable or non-renewable energies [26]. Indirect energy includes chemical fertilizers, pesticides, seeds, and machinery. Direct energy includes human labor, diesel fuel, electricity, and water for irrigation. Non-renewable energy includes chemical fertilizers, pesticides, machinery, electricity, and diesel fuel, whereas renewable energy includes human labor, seeds, and water for irrigation [27].

2.1. Data Sources

The data used in this study were based on annual data from 2005 to 2018, as well as secondary data obtained from various sources [13,19,28]. The data on agricultural human labor, electricity consumption, and total wheat yield in each province were gathered from the publications of the Mongolian State Institute of Statistics [13]. Human labor in agriculture was calculated using the assumption that each person works 210 days per year for 8 h per day [28]. Individual farmers provided information on the equipment used, wheat use allocation, depreciation schedules, and so on. The following formula was used to calculate the annual energy of machinery per hectare (for machinery energy) [28]:
M e = g × e t × C a
where Me is the energy of machinery (MJ ha−1), g means the machine weight (kg), e refers to the energy conversion coefficient constant, taking 64.8 MJ kg−1, t is each machine’s economic life of usage (h), and Ca is the capacity of effective field (ha h−1), calculated as:
C a = ( S × W × E f ) / 10
where S means the machine’s work speed (km h−1), W indicates the machine width (m), and Ef refers to the field efficiency capacity. The amount of diesel fuel used per hectare was calculated as 10 L [19]. The average nitrogen, phosphorus, and potassium use per hectare for conventional farmers was 40.40, 38.07, and 39.39 kg, respectively [19]. The average sowing rate for conventional farmers was 152.05 kg per hectare, while for organic farmers it was 151.71 kg per hectare. In addition to the energy contained in one gram of wheat, a supplemental 25% of energy was added to illustrate the effort involved in producing, handling, transporting, and packaging certified seed [19]. Electricity is mainly used in wheat production for seed cleaners and repairs. Wheat needs 34.46 kilowatt hours of electricity per hectare [13].

2.2. Calculation Method

The following formulas [27] show the calculations based on the energy input–output amount, energy use efficiency (EUE), energy productivity (EP), specific energy (SE), and net energy (NE):
E U E = E n e r g y   o u t p u t   ( MJ   ha 1 ) E n e r g y   i n p u t   ( MJ   ha 1 )
E P = W h e a t   y i e l d   ( kg   ha - 1 ) E n e r g y   i n p u t   ( MJ   ha 1 )
S E = E n e r g y   i n p u t   ( MJ   ha - 1 ) W h e a t   y i e l d   ( kg   ha - 1 )
N E = E n e r g y   o u t p u t   ( MJ   ha - 1 ) E n e r g y   i n p u t   ( MJ   ha - 1 )
The Cobb–Douglas production function a form of production function widely used in economics and econometrics to represent the technological relationship between the number of two or more inputs (particularly physical capital and labor) and the amount of output that can be produced by those inputs. It is used to establish the optimal fitness relations between the yield and various energy inputs [29]. The Cobb–Douglas production function is expressed in the general Formula (7) and then simplified to Formula (8), because crop production is zero when the energy input is zero [26]:
ln Y t = b 0 + i = 1 n b i ln ( h i t ) + e t
where b0 is the constant, bi denotes coefficients, and et is an error term with a mean of 0 and a constant variance s2:
ln Y t = i = 1 n b i ln ( h i t ) + e t
Formula (8) would be exposed in Formula (9), and where Yt is the output, lnhn = (h1, h2, ... , hn) is a vector of input variables affecting output such as fertilizer, diesel fuel, or electricity, and et is the error term:
ln Y t = b 1 ln h s e e d + b 2 ln h d i e s e l + b 3 ln h e l e c t r i c i t y + b 4 ln h f e r t i l i z e r s + b 5 ln h h u m a n l a b o r + b 6 ln h m a c h i n e r y + b 7 ln h p e s t i c i d e + b 8 ln h w a t e r + e t
Moreover, we considered different energy forms as renewable or non-renewable, and as direct or indirect. As a functional form, the Cobb–Douglas production function is selected and specified in Formula (11):
ln Y t = f 1 ln D E + f 2 ln I D E + e t
ln Y t = m 1 ln R E + m 2 ln N R E + e t
where renewable and non-renewable refer to renewable and non-renewable energy types, and direct and indirect energy [30]. Using the marginal physical productivity (MPP) technique, the study provided a sensitivity analysis of input energy on wheat yield based on the response coefficients of the inputs [31]. A factor’s MPP shows the amount of variance modified by a unit change in the factor input question, while keeping all other factors at their geometric mean. MPP was calculated using Formula (12) based on this method [32]:
M P P x j = g e o m e t r i c   m e a n   o f   o u t p u t g e o m e t r i c   m e a n   o f   i n p u t s × a j
where geometric mean (inputs) is expressed in each input per hectare. Scales of operation are modifications in output caused by the proportional change of all inputs in production (in which all inputs increase with a constant coefficient). The total of the elasticity derived in the form of regression coefficients is represented in the Cobb–Douglas production function. If the sum of the coefficients is greater than one, then
i = 1 n a i > 1 ,
If the latter parameter is less than unity, it can be concluded that there are increasing returns to scale.
i = 1 n a i < 1 ,
The decreasing returns to scale are then indicated; and if the outcome is unity,
i = 1 n a i = 1 ,
It demonstrates that the constant returns to scale [33].
All estimations were carried out using Stata12 software [34], and basic information on inputs, energy, and wheat yields was input into Excel spreadsheets.

3. Results and Discussion

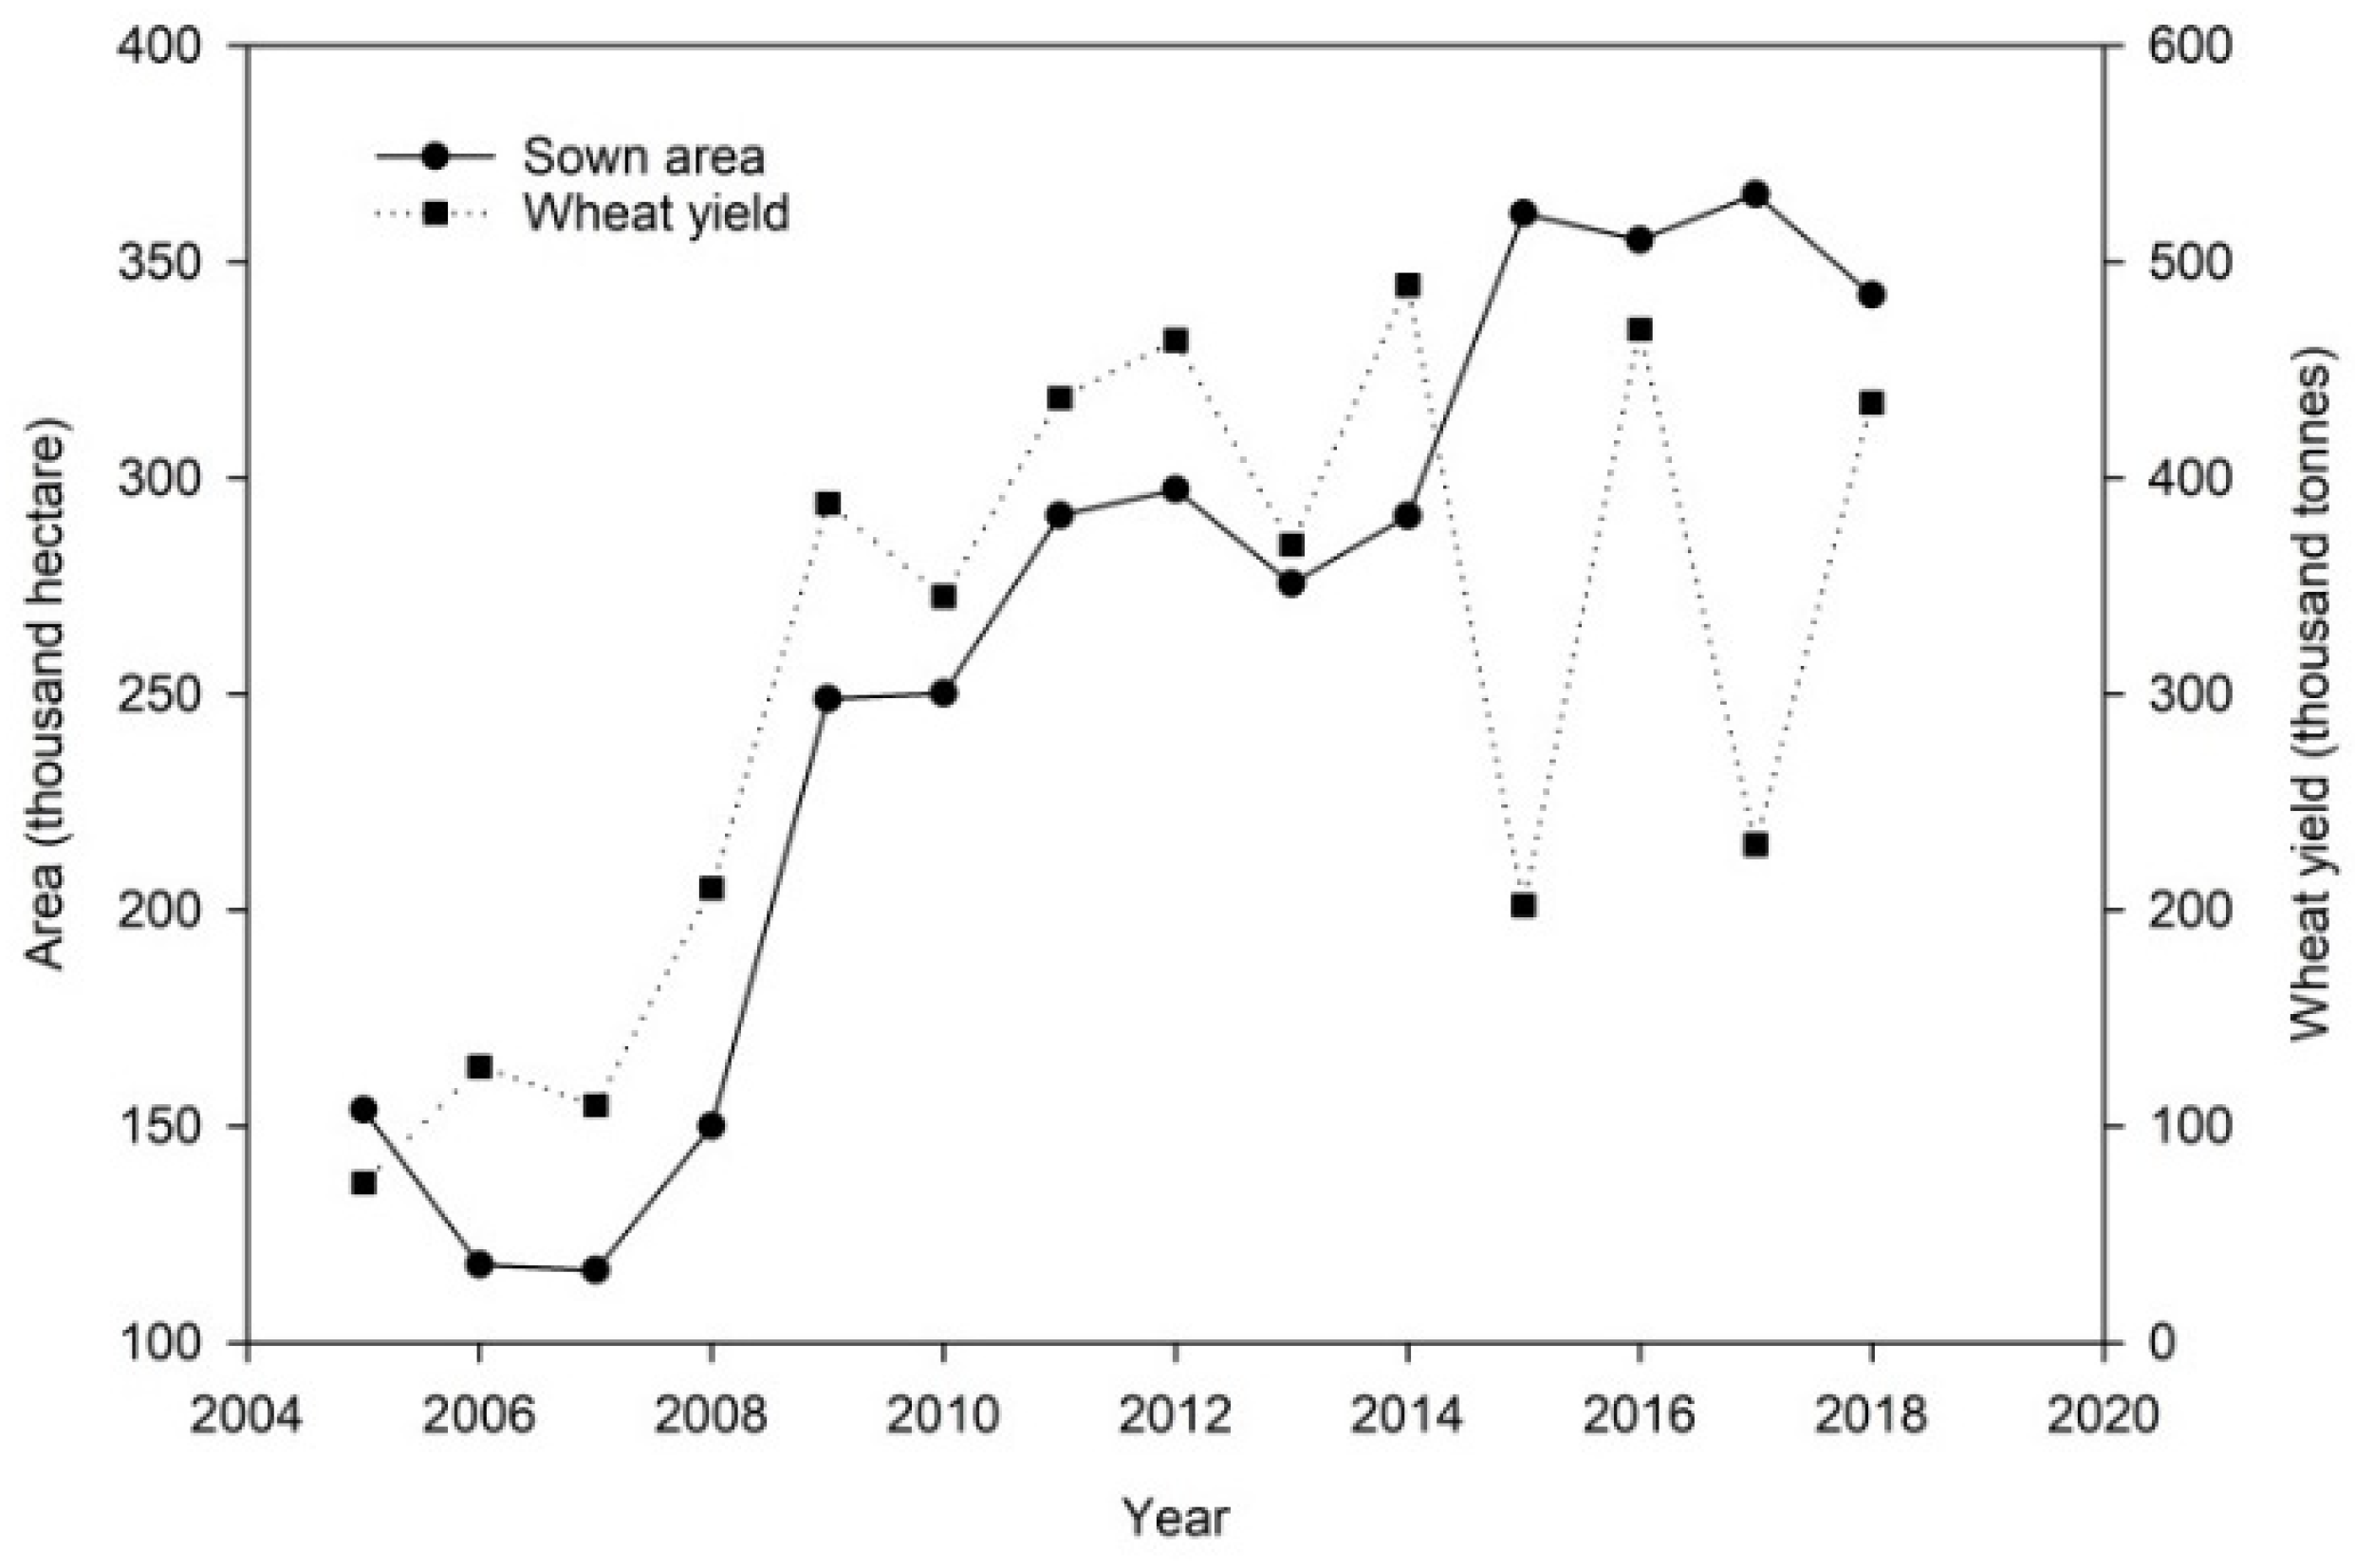
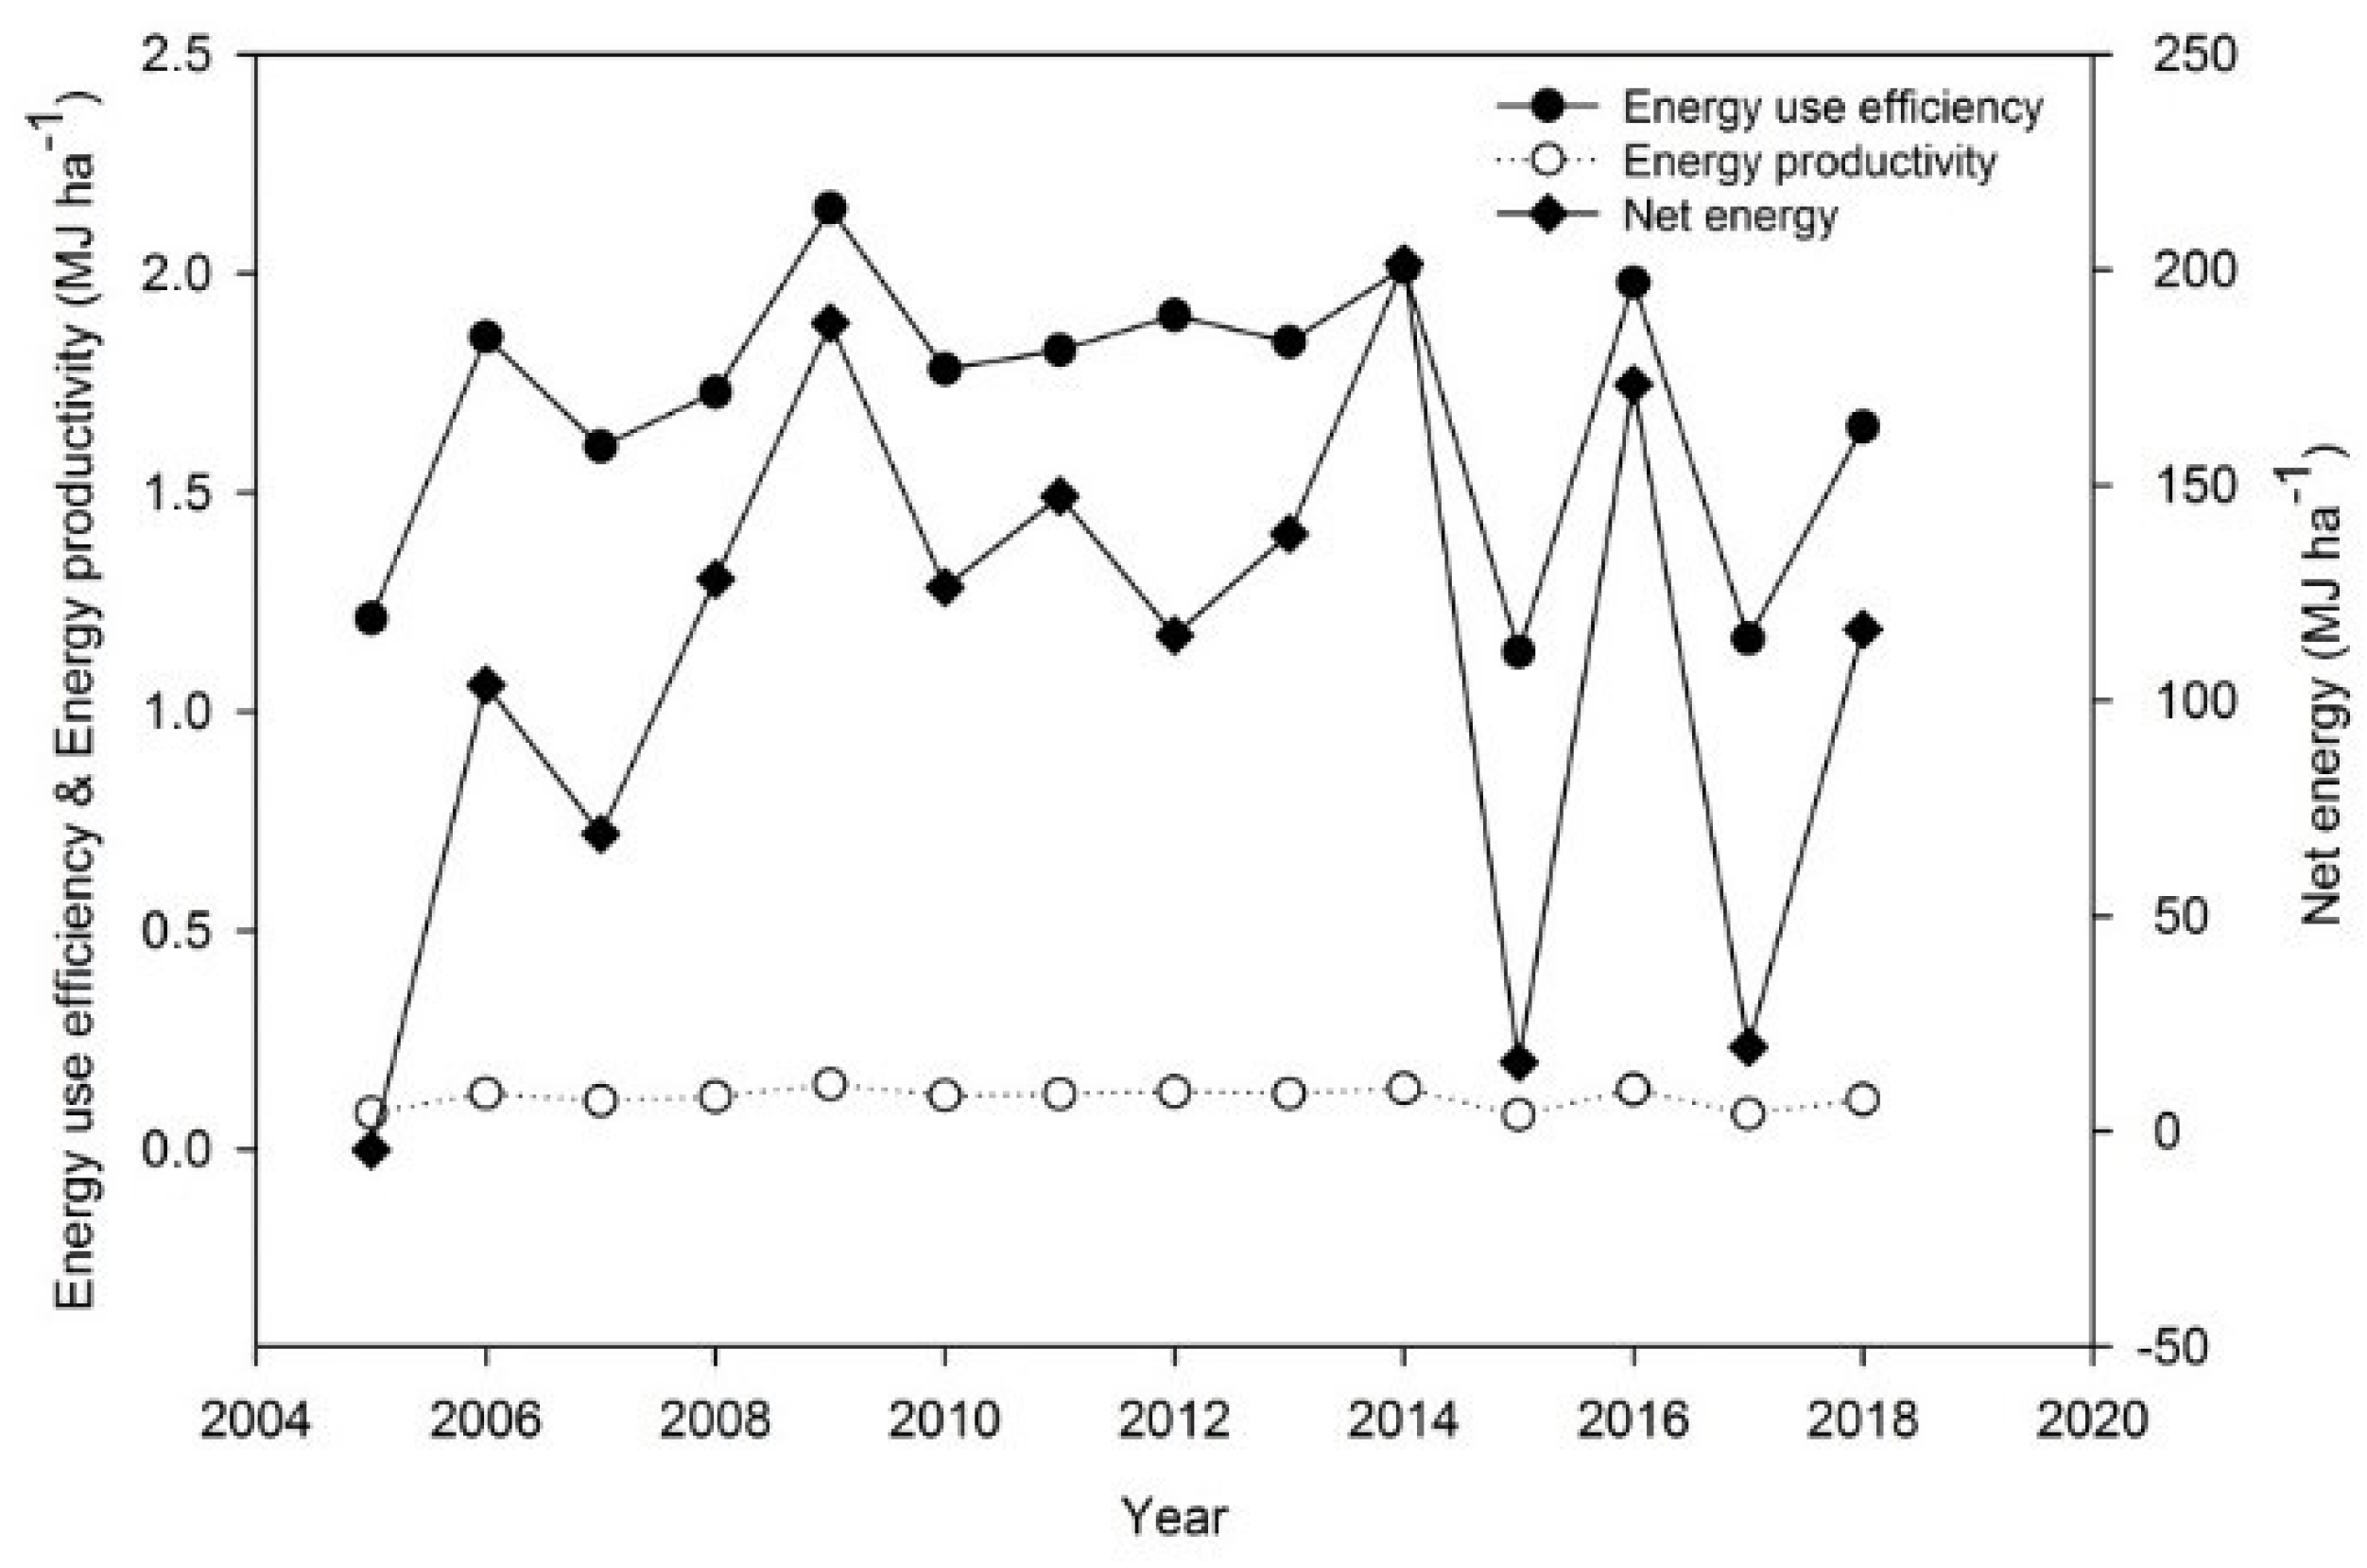
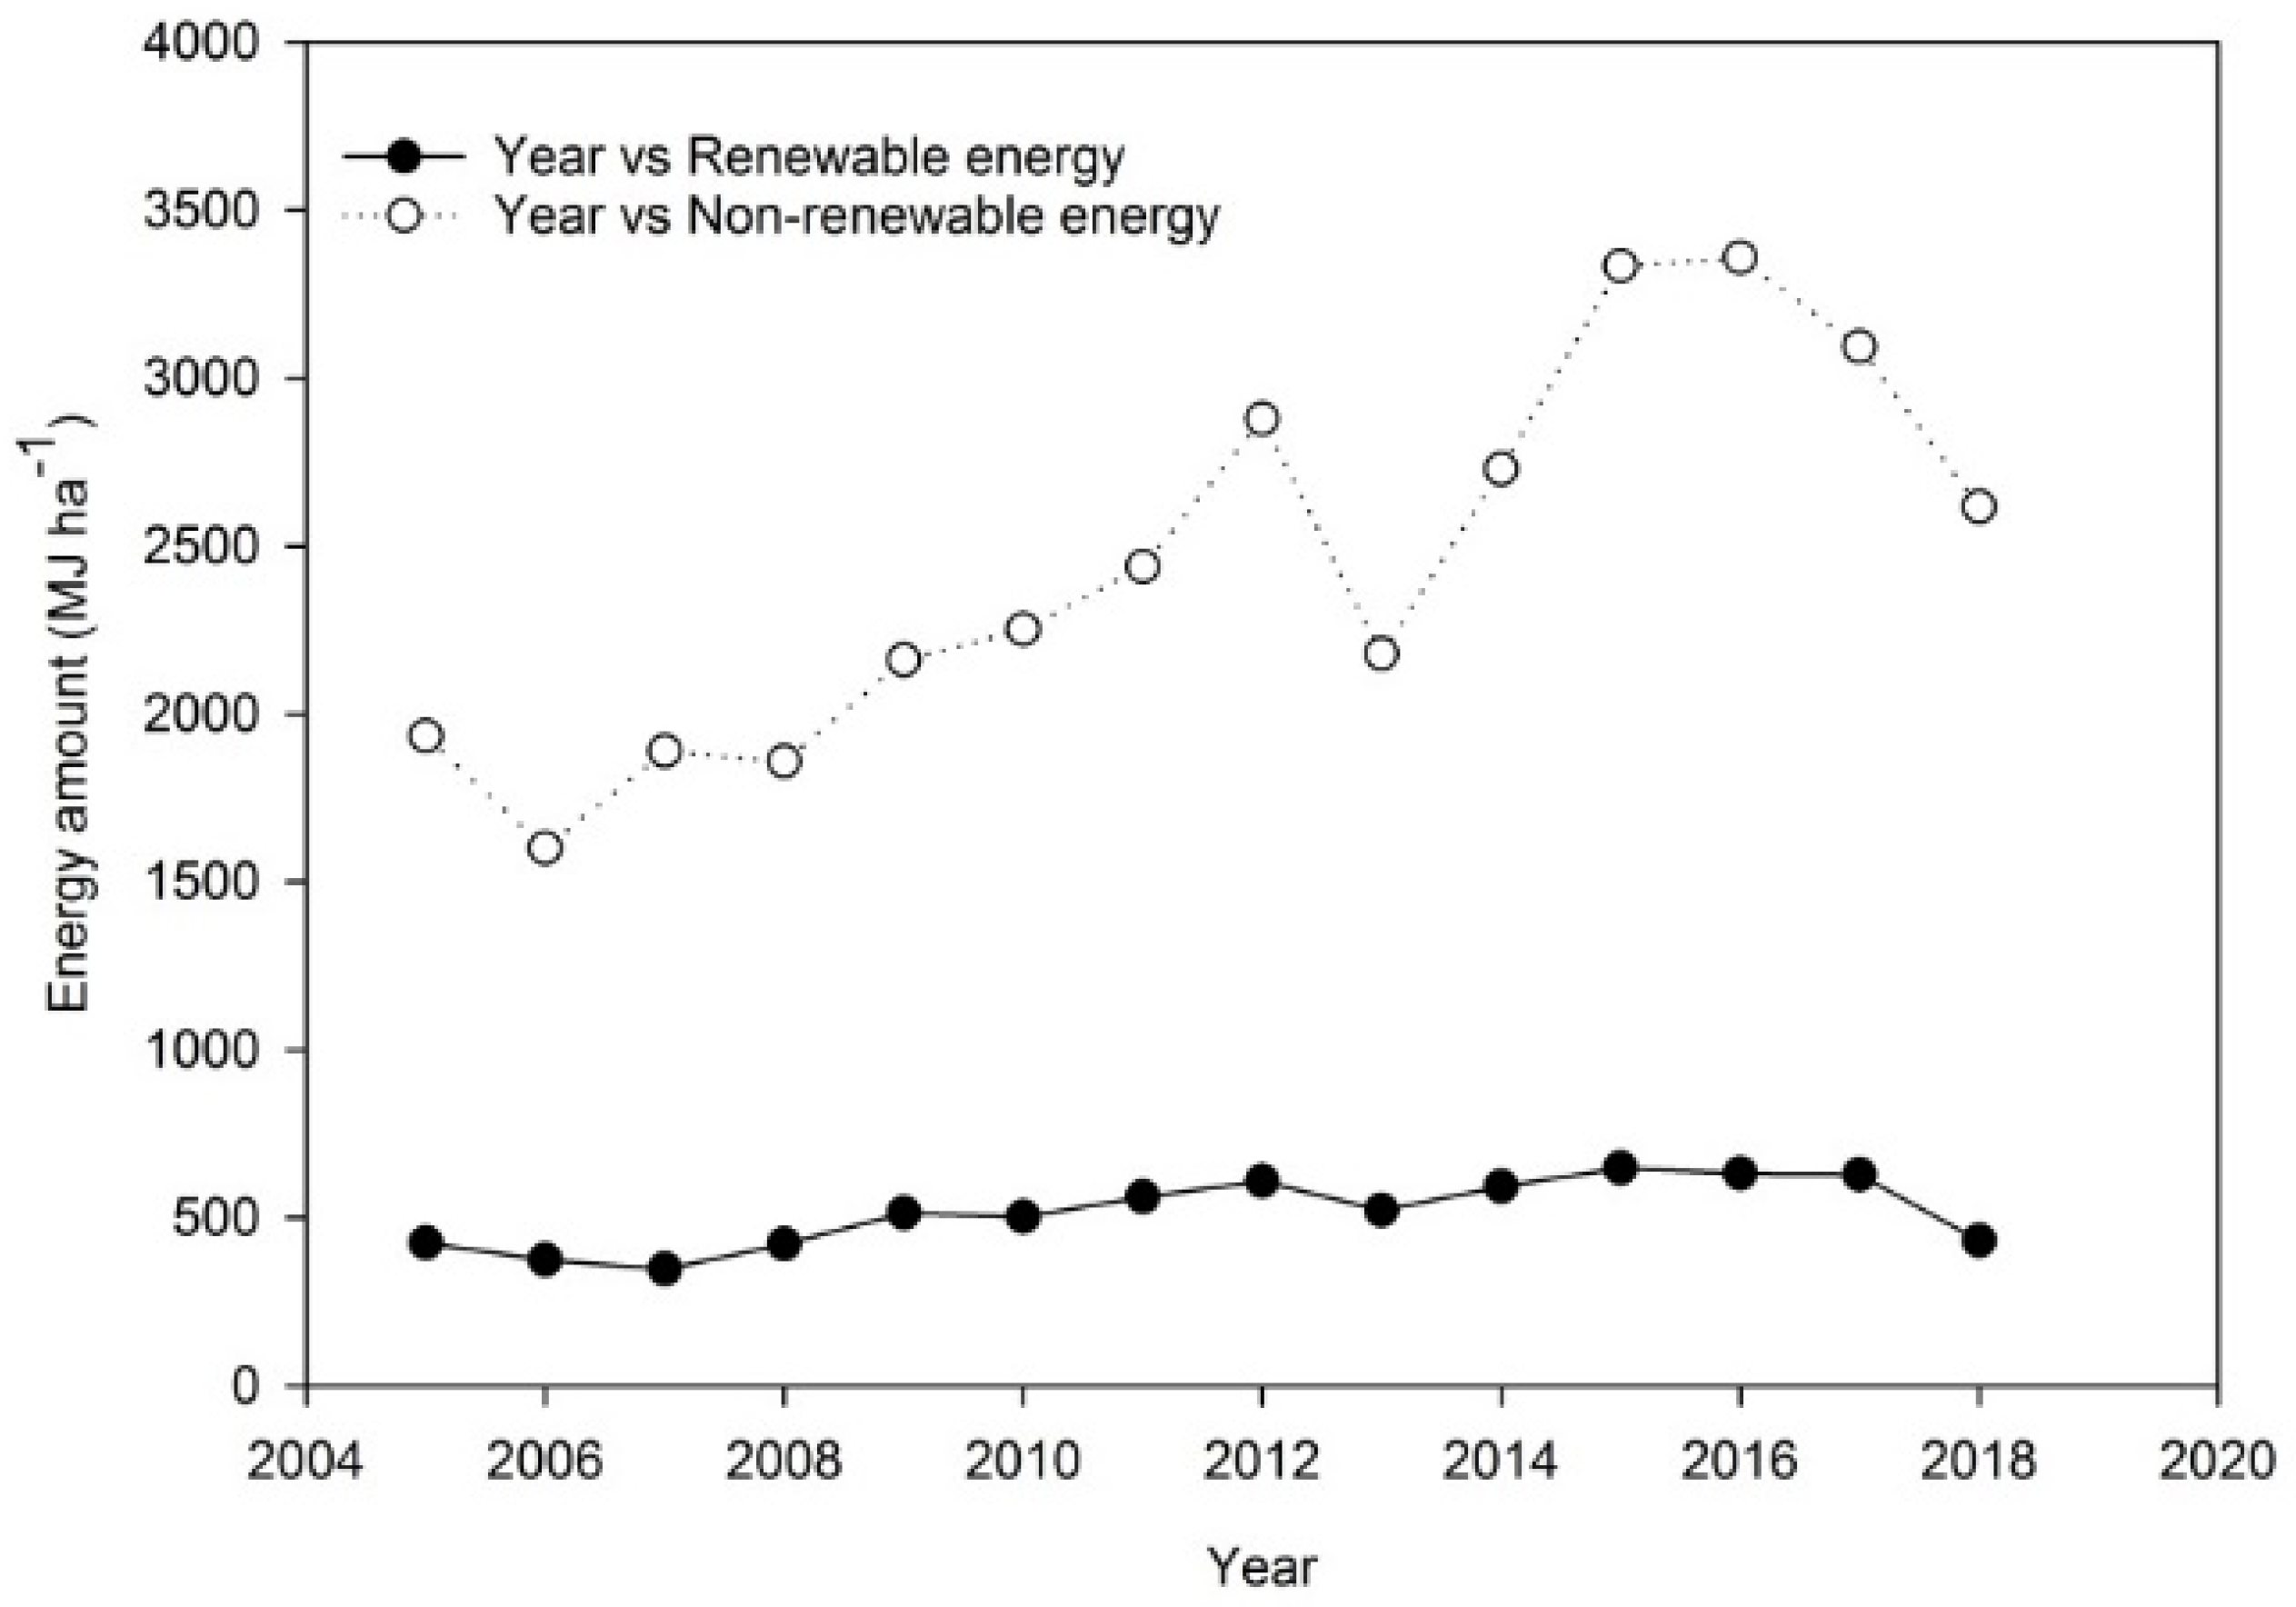
3.1. Energy Use for Wheat Production

As shown in Figure 2, in 2014, an all-time high of 489.29 thousand tons of wheat were registered, based on the average of 1.3 tons per hectare. However, the total wheat yield was 230.36 thousand tons in 2017, which is a two-fold decrease from the previous year’s yield. Due to the implementation of the national agricultural production support project by the Mongolian government, the wheat sowing area gradually increased from 2013 to 2018, increasing the number of hectares 1.2 times (Figure 2).
Wheat output and production in Mongolia’s agricultural sector changed dramatically from 2005 to 2018. The total energy inputs used in agriculture increased over the inspection period from 2359.50 MJ ha−1 to 3047.61 MJ ha−1, and the greatest energy input was 3989.75 MJ ha−1 in 2016, with the lowest reaching 1973.70 MJ ha−1 in 2006, as shown in Table 2. The results revealed that the highest energy input in 2005 was diesel fuel with 445.06 MJ ha−1, but in 2018, phosphate energy was the highest with 777.43 MJ ha−1. The lowest energy input from seed energy was 30.63 MJ ha−1 in 2005, but in 2018, human labor energy was the lowest at 35.83 MJ ha−1, as shown in Table 2.
We found that Yildiz [35] obtained similar results in terms of the energy input and output of wheat yield, emphasizing that the average value of the total energy input was 35,737.13 MJ ha−1, and then the maximum energy consumption of diesel fuel was 44.61%, chemical fertilizers were 23.54%, irrigation water was 10.58%, seed was 10.11%, and machinery was 9.86% in the Samsun Province in Turkey. Furthermore, Sara et al. [36] calculated the total energy input of wheat yield to be 34,430.97 MJ ha−1. In terms of the energy inputs, chemical fertilizers were most used, accounting for 45.56%, followed by diesel fuel at 20.22%, and electricity at 7.9% in Pakistan.
We found that the total output energy increased from 2312.08 MJ ha−1 in 2005, to 4562.56 MJ ha−1 in 2018. The total wheat yield per hectare in 2005 was 159.67 kg ha−1, increasing to 315.09 kg ha−1 in 2018. It shows an increase in wheat yield of almost 1.9 times from 2005 to 2018 (Table 2). Yildiz [35] asserted that the total energy output of wheat yield was found to be 3987.72 kg ha−1, but the total energy output per hectare was 84,427.33 MJ ha−6. However, according to Sara et al. [36], the total energy output of the wheat yield was 3712.85 kg ha−1 and was expressed as 48,267.05 MJ ha−1.
Figure 2 depicts the energy consumption efficiency, specific energy, energy productivity, and net energy of wheat production. During 2005–2018, the average energy consumption efficiency (input–output energy ratio) rose dramatically from 0.98 to 1.50. This indicates that the quantity of wheat energy per unit of energy input has risen. Wheat’s energy productivity rose from 0.68 kg MJ−1 in 2005 to 1.03 kg MJ−1 in 2018, which indicated an increase in production per unit of energy. In 2005, net energy production was mostly negative, at −47.4 MJ ha−1, but in subsequent years, it has increased to 1515.0 MJ ha−1 (Figure 3). Sara et al. [36] in Pakistan discovered that the main computed energy indices, such as energy consumption efficiency, energy productivity, and net energy, were similar to our findings. For example, the energy consumption efficiency was calculated at 1.40 and the energy productivity was 0.10 kg ha−1, resulting in an average energy productivity of wheat yield of 0.85 in Mongolia, which is higher than the results in some other nations. The energy consumption efficiency in Iran was determined by Nabavi-Pelesaraei [37] to be 3.51, more than twice our figure.
In order to better understand the direction of agricultural energy usage, it is important to analyze the tendency of energy types. Mongolia’s agricultural usage of renewable and non-renewable energy sources was also studied for this purpose. As shown in Figure 4, Mongolian agriculture relied on non-renewable energy sources during the study period. Furthermore, this dependence was found to increase, as the use of non-renewable energy increased from 51.6% to 82%. However, renewable energy use decreased slightly [38]. Likewise, according to Sara et al. [36], non-renewable energy and renewable energy accounted for 70% and 30% of the total energy consumption in Pakistan, respectively. Fertilizer and diesel were the main sources of wheat production in Pakistan, just like Iran and Turkey [26].
During the study period, direct energy use decreased from 48% to 30.2%, while indirect energy use rose from 52% to 69.8% (Figure 4). In Turkey, indirect energy use was 44.43% and direct energy use was higher at 55.57%, based on the calculations of Yildiz [35]. However, according to Sara et al.’s [36] study in Pakistan, the results were the same: indirect energy accounted for 65% and direct energy 35% of the energy use. Similarly, various researchers found that the contribution rate of indirect energy (82.35%) to wheat production was higher than that of direct energy (17.65%) in Iran [24].

3.2. The Econometric Results for Energy Use

One of the main objectives of this study was to examine the relationship between total energy output and input. The Cobb–Douglas production function was calculated using the ordinary least square estimation method. One of the properties of this production function is elasticity, which is represented by the calculated coefficients. The Cobb–Douglas production function also sets a priori limitations on input substitution patterns. All of the inputs’ elasticity of substitution must be equal to unity. Formula (9) demonstrates the usage of ordinary least squares estimation (the results are provided in Table 3). As this study employed time series data, autocorrelation may be an issue and should be evaluated using the Durbin–Watson test. Formulas (9)–(11) determined Durbin–Watson values of 1.65, 1.71, and 1.79, indicating that there was no autocorrelation in the estimated models at the 5% significance level. For Formulas (9)–(11), R2 values of 0.496, 0.406, and 0.407 were obtained, showing that these models explain about 32% of the variability in the total wheat production. As shown in Table 3, machinery, diesel fuel, nitrogen fertilizer, and irrigation water all had a statistically significant effect on the wheat yield at the 1% level. The results show that a 1% increase in nitrogen fertilizer energy input resulted in a 4.45% increase in these conditions. Diesel fuel had 3.52% elasticity, irrigation water had 3.09% elasticity, and machinery had 2.33% elasticity (Table 3). According to the research on wheat production in Turkey, the Durbin–Watson value calculated at the time of input, and then the seed energy had statistical significance. The elasticity of the total physical energy was estimated to be 0.24, indicating that an increase of 10% of the total physical energy would increase the total grain equivalent by 2.4% [26].
The sensitivity of the energy inputs was examined based on the MPP values from Formula (12), and the results showed that machinery, diesel fuel, potassium fertilizer, and water energy all had significant MPP values. According to the results in Table 3, more MJ for each machinery energy input would result in an increase of 0.19 MJ, and diesel fuel, potassium fertilizer, and water for irrigation energy were found to be at 1.69, 0.27, and 0.77, respectively. A negative MPP value indicates that additional units of input contribute to production, i.e., less output with more input.
Table 3 displays the regression findings for Formulas (10) and (11). The findings demonstrated that all types of energy input, whether direct, indirect, renewable, or non-renewable, had a significant impact on the 1% level. Direct, indirect, and non-renewable energy all had a greater influence on production yield. Direct, indirect, renewable, and non-renewable MPP values were 1.03, 1.42, 0.16, and 3.50, respectively. The impact of renewable, non-renewable, and direct and indirect energy on output was investigated, and the non-renewable energy variable showed expected symbols and statistical significance, with an elasticity value of 0.18 in Turkish wheat production [26], which was consistent with our findings. On the other hand, in terms of the direct and indirect energy on the output level, the regression findings indicated that both parameters were positively statistically significant. Our results showed that the elasticity estimates of direct and indirect energy were 0.24 and 0.19, respectively. These elasticity metrics indicated that the yearly wheat output equivalent was not proportional to the changes of these energy forms.

4. Conclusions

There is considerable agreement on the need for sustainability and its attractiveness as an agricultural aim. However, in Mongolia, its commitment as a criterion for directing agriculture as it adapts to change has not been fulfilled. The characteristics need to be described before the concept of sustainability to bring about changes is defined. Literal conceptions of sustainability refer to the abilities of future sustainable development, including quantitative, comprehensive criteria for its definition. Our study findings make up for some of the gaps between sustainable agriculture and energy analysis; in the future, the analysis of greenhouse gas emissions, renewable energy, and non-renewable energy may provide more recommendations for the Mongolian government’s official activities.
After 1990, the agricultural area essentially leveled off. Total energy intake more than quadrupled between 2005 and 2018. As a consequence of the input intensity of fertilizer (particularly nitrogen, which increased over 1.75-fold during that time period), power, and diesel fuel, Mongolian agriculture has grown more input-intensive. Increased fertilizer usage is currently restrained by environmental and energy limits (in developed nations). In 1999, agricultural energy use ranked third place among major industrial consumers in the United States [7]. Based on the present study, observations can be made. The total energy inputs used in agriculture showed a slight increase from 2359.50 MJ ha−1 to 3047.61 MJ ha−1. During this 13-year period, the total energy output also increased from 2312.08 MJ ha−1 to 4562.56 MJ ha−1, which is a two-fold increase. Even if the increase in energy input can be observed, it still fluctuates for some years.
The econometric estimation results showed that machinery, diesel fuel, nitrogen fertilizer, and irrigation water energy had statistical significance on wheat yield at the 1% level. Diesel fuel had 3.52% elasticity, irrigation water had 3.09% elasticity, and machinery had 2.33% elasticity. Direct, indirect, and non-renewable energies had more impact on the output energy of wheat production. The MPP values of direct, indirect, renewable, and non-renewable energies were 20.56, −20.31, 2.57, and 11.90, respectively. All of these indicators show that there has been a significant rise in energy use in Mongolian agriculture during the last 13 years.
Reducing diesel fuel consumption and fertilizer use, particularly nitrogen use, is critical for energy savings. Direct and local marketing maximizes producers’ revenues while lowering the amount of energy required for transporting items [39]. It is feasible to boost agricultural output by raising the partial productivity of energy inputs and reducing the reliance on non-renewable energy sources, which pose major environmental problems. Thus, the government should take obligatory measures to provide more environment-friendly energy patterns in Mongolian agriculture.
Energy analysis may be the most practical approach in regular economic analysis [40]. This will help us with long-term, national-level planning, rather than just acting as a guide for daily decision making.
The higher total energy input of traditional farmers is mainly due to their use of nitrogen fertilizer. Although it is commonly known that nitrogen fertilizer enhances crop yields, it is also important to remember that crop yield performance is influenced by a variety of factors, including soil conditions, weather, and seed type. Fertilizer is just one of these factors. In the future, we will use this research to measure agricultural energy use throughout Mongolia. Mongolia’s agricultural development depends on this study. To conclude, we recommend that, instead of increasing business for limited environmental supply or moving to low value areas, it is better to reduce business costs.
(1)
Utilize innovative and technological machinery and equipment (which may have a higher price than old machinery, but will reduce diesel fuel use and save working hours).
(2)
Make use of newly tested seeds (disease resistance and drought tolerance have to be high).
(3)
Expand the use of green manures (leverage the high number of livestock).
(4)
Reduce the need for chemical fertilizer. It is feasible to boost agricultural output by increasing renewable energy inputs; authorities should focus on ensuring environmentally sustainable energy usage in Mongolian agriculture.

Author Contributions

Conceptualization, L.B. and Y.W.; data curation, L.B., S.I. and W.W.; methodology, L.B. and Y.W.; software, L.B.; writing—original draft, L.B.; writing—review and editing, L.B., S.I., W.W. and Y.W. All authors have read and agreed to the published version of the manuscript.

Funding

This study was supported by “Agricultural Science and Technology Innovation Project” of Chinese Academy of Agricultural Sciences (grant number: ASTIP-IAED-21-07).

Informed Consent Statement

Not applicable.

Data Availability Statement

The datasets analyzed during the current study are available from the corresponding author on reasonable request.

Acknowledgments

We would like to thank the Public Welfare Basic Scientific Research Expenses, the Ministry of Finance of China, and the project “Study on Sustainable Utilization of Agricultural Resources—Evaluation of Agricultural Sustainability and Optimization of Agricultural Input Structure” for their kind research support.

Conflicts of Interest

The authors declare that they have no known competing financial interests or personal relationships that could have appeared to influence the work reported in this paper.

References

  1. FAO. The Water-Energy-Food Nexus—A New Approach in Support of Food Security and Sustainable Agriculture; FAO: Rome, Italy, 2014; Available online: www.fao.org/nr/water/docs/fao_nexus_concept_web.pdf (accessed on 15 October 2021).
  2. Dalhberg, K.A. Sustainable agriculture-fad or harbinger? Bioscience 1991, 41, 337–340. [Google Scholar] [CrossRef]
  3. Knorr, D.; Watkins, T.R. Alterations in Food Production; Van Nostrand Reinhold: New York, NY, USA, 1984. [Google Scholar]
  4. Bidwell, O.W. Where do we stand on sustainable agriculture? J. Soil Water Conserv. 1986, 41, 317–320. [Google Scholar]
  5. Carter, H.O. Agricultural sustainability: An overview and research assessment. Calif. Agric. 1989, 43, 16–18, 37. [Google Scholar]
  6. Macrae, R.J.; Hill, S.B.; Mehuys, G.R.; Henning, J. Agricultural science and sustainable agriculture, a review of the existing scientific barriers to sustainable food production and potential solutions. Biol. Agric. Hortic. 1989, 6, 173–219. [Google Scholar] [CrossRef]
  7. Kuesters, J.; Lammel, J. Investigation of the energy efficiency of the production of winter wheat and sugar beet in Europe. Eur. J. Agron. 1999, 11, 35–43. [Google Scholar] [CrossRef]
  8. Nergui, D.; Ganbaatar, S. The Chronicle for Farmers of Mongolian Agriculture; Munkhiin Useg Press: Ulaanbaatar, Mongolia, 2009. [Google Scholar]
  9. Asian Development Bank. Unlocking Mongolia’s Rich Renewable Energy Potential; The Asian Development Bank (ADB): Ulaanbaatar, Mongolia, 2020; Available online: https://www.adb.org/news/features/unlocking-mongolias-rich-renewable-energy-potential (accessed on 22 April 2020).
  10. Amar, U.; Robert, M. Estimating Armington elasticities for wheat in Mongolia. Sustain. Dev. Agric. Econ. 2018, 9, 90–92. [Google Scholar]
  11. Mongolian Food Supply Law. National Legal Information Center. 1995. Available online: www.legalinfo.mn (accessed on 13 December 2021).
  12. Ministry of Food and Agriculture. Third ‘Atar’ Campaign. Report of National Program on Development Arable Land; UB Print Press: Ulaanbaatar, Mongolia, 2009. [Google Scholar]
  13. National Statistics of Agriculture. Mongolian National Statistical Information Service. 2019. Available online: www.1212.mn/stat.asp (accessed on 16 March 2021).
  14. Amar, U.; Robert, M. Import demand analysis for wheat in Mongolia. Econ. Work. Cap. 2019, 3, 92–95. [Google Scholar]
  15. FAO. Food and Agricuture Organization of the United Nations. Available online: www.fao.org (accessed on 13 December 2021).
  16. Natsagdorj, E.; Renchin, T.; Kappas, M.; Tseveen, B.; Dari, C.; Tsend, O.; Duger, U.O. An integrated methodology for soil moisture analysis using multispectral data in Mongolia. Geo-Spat. Inf. Sci. 2017, 21, 46–55. [Google Scholar] [CrossRef] [Green Version]
  17. Eren, Y. A study on utilization period of tractors in Turkey. In Proceedings of the 13th National Agricultural Mechanization Congress, Konya, Turkey, 30 May–15 June 1991; pp. 514–519. [Google Scholar]
  18. Canakci, M.; Akinci, I. Energy use pattern analysis of greenhouse vegetable production. Energy 2006, 31, 1243–1256. [Google Scholar] [CrossRef]
  19. Bekei, A. The Economic of Mongolian Agriculture; MULS Press: Ulaanbaatar, Mongolia, 2018. [Google Scholar]
  20. Punsaldulam, B. History of Mongolian Agriculture 1959–2019; Munkhiin Useg Press: Ulaanbaatar, Mongolia, 2020. [Google Scholar]
  21. Celling, C.E.; Parmenter, K.E. Energy efficiency in fertilizer production and use. In Efficient Use and Conservation of Energy 8 Encyclopedia of Life Support Systems; Cellings, C.W., Ed.; Eolss Publishers: Oxford, UK, 2004; pp. 123–136. [Google Scholar]
  22. Esengun, K.; Erdal, G.; Gunduz, O.; Erdal, H. An economic analysis and energy use in stake-tomato production in Tokat province of Turkey. Renew. Energy 2007, 32, 1873–1881. [Google Scholar] [CrossRef]
  23. Yilmaz, I.; Akcaoz, H.; Ozkan, B.B. An analysis of energy use and input costs for cotton production in Turkey. Renew. Energy 2005, 30, 145–155. [Google Scholar] [CrossRef]
  24. Mohammadi, A.; Tabatabaeefar, A.; Shahin, S.H.; Rafiee, S.H.; Keyhani, A. Energy use and economical analysis of potato production in Iran case study: Ardabil province. Energy Convers. Manag. 2008, 49, 3566–3570. [Google Scholar] [CrossRef]
  25. Singh, H.; Mishra, D.; Nahar, N.M. Energy use pattern in production agriculture of typical village in arid zone, India-part I. Energy Convers. Manag. 2002, 43, 2275–2286. [Google Scholar] [CrossRef]
  26. Hatirli, S.A.; Ozkan, B.; Fert, C. An econometric analysis of energy input-output in Turkish agriculture. Renew. Sustain. Energy Rev. 2005, 9, 608–623. [Google Scholar] [CrossRef]
  27. Singh, S.; Singh, S.; Pannu, C.J.S.; Singh, J. Energy input and yield relations for wheat in different agro-climatic zones of the Punjab. Appl. Energy 1999, 63, 287–298. [Google Scholar] [CrossRef]
  28. Ozkan, B.; Akcoaz, H.; Fert, C. Energy input-output analysis in Turkish agriculture. Renew. Energy 2004, 29, 39–51. [Google Scholar] [CrossRef]
  29. Rafiee, S.; Mousavi Avval, S.H.; Mohammadi, A. Modeling and sensitivity analysis of energy inputs for apple production in Iran. Energy 2010, 35, 3301–3306. [Google Scholar] [CrossRef]
  30. Heidari, S.A.; Omid, M. Energy use patterns and econometric models of major greenhouse vegetable productions in Iran. Energy 2011, 36, 220–225. [Google Scholar] [CrossRef]
  31. Samavatean, N.; Rafiee, S.; Mobli, H.; Mohammadi, A. An analysis of energy use and relation between energy inputs and yield, costs and income of garlic production in Iran. Renew. Energy 2011, 36, 1808–1813. [Google Scholar] [CrossRef]
  32. Nguyen, T.L.T.; Gheewala, S.H.; Garivait, S. Energy balance and GHG-abatement cost of cassava utilization for fuel ethanol in Thailand. Energy Policy 2007, 35, 4585–4596. [Google Scholar] [CrossRef]
  33. Mobtaker, H.G.; Akram, A.; Keyhani, A. Energy use and sensitivity analysis of energy inputs for alfalfa production in Iran. Energy Sustain. Dev. 2012, 16, 84–89. [Google Scholar] [CrossRef]
  34. Stata User’s Guide Release 13; Stata Corporation: College Station, TX, USA, 2013.
  35. Yildiz, T. An Input-Output Energy Analysis of Wheat Production in Çarşamba District of Samsun Province. J. Agric. Fac. Gaziosmanpasa Univ. 2016, 33, 10–20. [Google Scholar] [CrossRef]
  36. Ilahi, S.; Wu, Y.; Raza, M.A.A.; Wei, W.; Imran, M.; Bayasgalankhuu, L. Optimization Approach for Improving Energy Efficiency and Evaluation of Greenhouse Gas Emission of Wheat Crop using Data Envelopment Analysis. Sustainability 2019, 11, 3409. [Google Scholar] [CrossRef] [Green Version]
  37. Nabavi-Pelesaraei, A.; Hosseinzadeh-Bandbafha, H.; Qasemi-Kordkheili, P.M.; Kouchaki-Penchah, H.; Riahi-Dorcheh, F. Applying optimization techniques to improve of energy effiency and GHG (greenhouse gas) emissions of wheat production. Energy 2016, 103, 672–678. [Google Scholar] [CrossRef]
  38. Shrestha, D.S. Energy Use Efficiency Indicator for Agriculture. 1998. Available online: http://www.usask.ca/agriculture/caedac/PDF/mcrae.PDF (accessed on 10 August 2010).
  39. Bayasgalan, S.; Bolortsetseg, B.; Dagvadorj, D.; Natsagdorj, L. The impact of climate change on spring wheat yield in Mongolia and its adaptability. In Adapting to Climate Change; Smith, J.B., Springer: New York, NY, USA, 1996; pp. 164–173. [Google Scholar] [CrossRef]
  40. Xie, W.; Zhang, R.; Zeng, D.; Shi, K.; Zhong, S. Strictly dissipative stabilization of multiple-memory Markov jump systems with general transition rates: A novel event-triggered control strategy. Int. J. Robust Nonlinear Control 2020, 30, 1956–1978. [Google Scholar] [CrossRef]
Figure 1. Location of the studied provinces on the map of Mongolia. Notice: Mongolia consists of 21 provinces, but only 14 maps of special agricultural provinces exist; desert and desert steppe provinces are omitted.
Processes 10 00190 g001
Figure 2. From 2005 to 2018, Mongolia’s wheat yield and wheat planted area both increased. (On the y-axis, the wheat sown area is shown in thousands of hectares and the harvested wheat yield in thousand tons; on the x-axis, the years are from 2005 to 2018. The black dots represent the sown area, and the black squares represent the wheat yield).
Processes 10 00190 g002
Figure 3. Energy efficiency, productivity, and net energy of wheat output in Mongolian agriculture from 2005 to 2018. (Energy efficiency and productivity are provided on the y-axis, and net energy on the second y-axis, expressed as MJ per hectare; the x-axis represents the years from 2005 to 2018).
Processes 10 00190 g003
Figure 4. Renewable and non-renewable energy usage of wheat yield from 2005 to 2018 (the y-axis represents the renewable and non-renewable energy values expressed as MJ per hectare; the x-axis provides the years from 2005 to 2018).
Processes 10 00190 g004
Table 1. Energy equivalents for various input–output in agricultural production. Note: the input unit of wheat yield is per hectare, and the energy equivalent used is MJ per hectare with references.
Inputs (Per Hectare)UnitEnergy Equivalents (MJ)Reference
Human laborh1.96[1,2,3]
Machinerykg64.8[4]
Diesel fuelL47.8[4,5]
Pesticidekg101.2[4,6]
Nitrogen (N)kg66.14[4,6,7]
Phosphate (P2O5)kg12.44[4,6,7]
Potassium (K2O)kg11.15[7,9]
Water for irrigationm31.02[10]
ElectricitykW·h−111.93[11]
Seedkg20.10[2]
Output
Wheat yieldkg14.48[3]
Table 2. Estimated input–output energy variables from 2005 to 2018. (From 2005 to 2018, when calculating the output of wheat yield, inputs are individually calculated as an energy form).
YearsHuman Labor
(MJ ha−1)
Machinery Energy
(MJ ha−1)
Electricity Energy
(MJ ha−1)
Diesel Fuel Energy
(MJ ha−1)
Nitrogen Fertilizer Energy
(MJ ha−1)
Phosphate Fertilizer Energy
(MJ ha−1)
Potassium Fertilizer Energy
(MJ ha−1)
Pesticide Energy
(MJ ha−1)
Water for Irrigation Energy
(MJ ha−1)
Seed Energy
(MJ ha−1)
Total Input Energy
(MJ ha−1)
Output Energy
(MJ ha−1)
2005160.8042.92292.04445.06405.99300.09399.1049.33233.5130.632359.502312.08
2006159.9953.35286.41474.44273.94259.38203.9347.66193.2921.261973.703217.10
2007147.4653.21273.42547.89416.42275.47286.2637.15179.1619.912236.413133.74
2008176.7044.06338.28470.61398.40308.88247.2251.28212.8831.512279.883947.13
2009202.2847.33441.80339.32521.51301.46443.7665.84273.9337.212674.485301.67
2010180.5954.15400.16391.23641.41351.80357.7755.80288.9632.602754.514523.95
2011198.4261.82442.71452.19574.90389.58470.5646.37328.6434.542999.764916.04
2012201.7065.98480.40579.78662.89550.69488.3950.12368.3438.713487.054984.01
2013170.5499.455418.37452.3389.33396.19372.8949.81316.9334.322700.264504.28
2014181.12123.83483.45594.2502.67515.40448.9060.40372.6539.163321.846141.88
2015202.86111.79532.34631.62723.18767.87509.5156.81392.9751.573980.564204.65
2016183.89126.56504.49544.57835.60859.04427.2360.80383.4664.073989.746417.05
2017194.62121.59556.59519.43495.79768.599572.1758.42382.5050.843720.583974.89
201835.83128.4037.77497.25577.97777.42537.3660.20349.6645.703047.604562.56
Table 3. Econometric estimation results of energy inputs in wheat.
Endogenous Variable: Wheat Yield
Exogenous VariablesCoefficientt-RatioMPP
Formula (9): ln Y t = b 1 ln h 1 + b 2 ln h 2 + b 3 ln h 3 + b 4 ln h 4 + b 5 ln h 5 + b 6 ln h 6 + b 7 ln h 7 + b 8 ln h 8 + e t
Constant4.0123.76 **
Human labor−0.02−0.31 ns−0.09
Machinery0.082.33 **0.19
Diesel fuel0.133.52 **1.69
Pesticide0.031.51 ns0.03
Nitrogen (N)0.164.45 **2.31
Phosphate (P2O5)−0.01−0.17 ns−0.06
Potassium (K2O)0.020.64 ns0.27
Water for irrigation0.113.09 **0.77
Electricity0.040.92 ns0.49
Seed0.031.13 ns0.03
Durbin-Watson1.65
R20.49
Formula (10): ln Y t = f 1 ln D E + f 2 ln I D E + e t
Constant3.1613.32
Direct energy0.244.04 **1.03
Indirect energy0.295.25 **1.42
Durbin-Watson1.71
R20.41
Formula (11): ln Y t = m 1 ln R E + m 2 ln N R E + e t
Constant2.9810.5
Renewable energy0.101.73 ns0.16
Non-Renewable energy0.455.61 **3.50
Durbin-Watson1.79
R20.41
Notes. The variables are mean n ± standard deviation, with ** denoting p < 0.01, and the Durbin–Watson multiple range test result.
Publisher’s Note: MDPI stays neutral with regard to jurisdictional claims in published maps and institutional affiliations.

