Article

Vapor–Liquid Equilibria of Quaternary Systems of Interest for the Supercritical Antisolvent Process

by
Roberta Campardelli
1,
Stefania Mottola
2 and
Iolanda De Marco
2,3,*
1
Department of Civil, Chemical and Environmental Engineering (DICCA), University of Genoa, Via Opera Pia 15, 16145 Genova, Italy
2
Department of Industrial Engineering, University of Salerno, Via Giovanni Paolo II, 132, Fisciano, 84084 Salerno, Italy
3
Research Centre for Biomaterials BIONAM, University of Salerno, Via Giovanni Paolo II, 132, Fisciano, 84084 Salerno, Italy
*
Author to whom correspondence should be addressed.
Processes 2022, 10(12), 2544; https://doi.org/10.3390/pr10122544
Submission received: 30 October 2022 / Revised: 16 November 2022 / Accepted: 28 November 2022 / Published: 30 November 2022
(This article belongs to the Special Issue Biochemical Processes for Sustainability)

Abstract

:
In the Supercritical Antisolvent process (SAS), the thermodynamic behavior of complex multicomponent systems can influence the particles’ morphology. However, due to the limited thermodynamic data for multicomponent systems, the effect of solutes is often neglected, and the system is considered as pseudo-binary. It has been demonstrated that the presence of a solute can significantly influence the thermodynamic behavior of the system. In particular, when the SAS process is adopted for the production of drug/polymer coprecipitated microparticles, the effect of both the drug and the polymer in the solvent/CO2 mixture should be considered. In this work, the effect of polyvinylpyrrolidone (PVP), used as the carrier, and of the liposoluble vitamins menadione (MEN) and α-tocopherol (TOC), as model drugs, was investigated as a deviation from the fundamental thermodynamic behavior of the DMSO/CO2 binary system. Vapor–liquid equilibria (VLE) were evaluated at 313 K, with a PVP concentration in the organic solution equal to 20 mg/mL. The effect of the presence of PVP, MEN, and TOC on DMSO/CO2 VLE at 313 K was studied; furthermore, the effect of PVP/MEN and PVP/TOC, at a polymer/drug ratio of 5/1 and 3/1, was determined. Moreover, SAS precipitation experiments were performed at the same polymer/drug ratios using a pressure of 90 bar. Thermodynamic studies revealed significant changes in phase behavior for DMSO/CO2/PVP/TOC and DMSO/CO2/PVP/MEN systems compared to the binary DMSO/CO2 system. From the analysis of the effect of the presence of a single compound on the binary system VLE, it was noted that PVP slightly affected the thermodynamic behavior of the system. In contrast, these effects were more evident for the DMSO/CO2/TOC and DMSO/CO2/MEN systems. SAS precipitation experiments produced PVP/MEN and PVP/TOC microparticles, and the obtained morphology was justified considering the quaternary systems VLE.

1. Introduction

Supercritical antisolvent (SAS) precipitation is a successful micronization technique [1,2,3,4]. In this process, the solute to be micronized has to be soluble in the organic solvent but insoluble in the mixture formed by the supercritical fluid (generally carbon dioxide) and by the organic solvent. Therefore, when the supercritical fluid is added to the organic solution, the solute precipitates due to supersaturation; for this reason, it is possible to state that supercritical carbon dioxide (scCO2) plays the role of antisolvent [2]. The SAS process is a valid alternative to the classic liquid antisolvent processes. The main advantages of this process are that the solvent and the antisolvent can be separated by a simple depressurization, avoiding further separation processes. Moreover, the SAS process is fast thanks to the high diffusivities of scCO2, about two orders of magnitude higher than those of liquids solvents. Therefore, an adequate control of the particle size distribution (PSD) is also possible.
A wide range of materials has been processed using the SAS process, and various particle morphologies have been observed [5,6]. Applications of SAS include the precipitation of explosives, pharmaceutical compounds, pigments, superconductor precursors, and polymers [2,7,8,9,10,11]. Coprecipitation of drugs and polymers has also been investigated [12,13,14,15,16]. Interesting particle morphologies have been observed by varying the operating conditions: microparticles (MP), nanoparticles (NP), and expanded microparticles (EMP), but also fibers, crystals, and interconnected networks. The theoretical basis for experimental observations has been extensively discussed in the literature. However, the overall process is a complex interaction between several phenomena involving jet hydrodynamics, mass transfer, nucleation kinetics, and phase equilibria [5,17].
The SAS process is particularly complex, and it is therefore possible to fully understand it only if all the phenomena involved are taken into consideration: the hydrodynamics of jet break-up when in contact with the supercritical fluid, the mass transfer between a single droplet and the surrounding environment, the possible phase behavior that a solvent–solute–antisolvent system can reach, and the nucleation kinetics inside the droplet. These will all be valuable steps in developing a comprehensive model and a better understanding of the SAS process [18].
A generalized and simplified descriptive model was developed by Reverchon and De Marco [19]. This model assumes that due to the rapid mass transfer that characterizes supercritical fluids-related processes, quasi-equilibrium conditions can be reached quickly, even in continuous processes. Therefore, the morphology and size of the SAS precipitated particles can be substantially correlated to the high-pressure vapor–liquid equilibria (VLE) of the binary system (liquid+supercritical fluid). In particular, generalizing the observed results: (a) nanoparticle production can be expected when precipitation occurs from a supercritical phase, i.e., when the operating point is located well above the mixture critical point (MCP) of the system under study; (b) expanded microparticles can be expected when precipitation occurs from a gaseous subcritical phase, i.e., when the operating point is below the MCP; (c) microparticles are obtained in the immediate vicinity of the MCP; and (d) crystalline particles are typically obtained from a liquid phase.
This approach can be a quick and easy method to determine the operating conditions of a SAS experiment to obtain the desired particle morphology. It is based on pseudo-binary diagrams, obtained by neglecting the equilibria involving the third component (the solute) and therefore assuming that the solute does not modify the binary system high-pressure vapor–liquid behavior. However, substantial modifications in binary VLE can occur in some cases due to the presence of the solute.
In a previous paper, it has been shown that the thermodynamic behavior of a solvent/CO2/solute ternary system can be studied using the static synthetic method. This method is based on the visual observation of the phase separation for mixtures of known compositions. Typical results are a set of phase boundaries of the P-x diagram. Using this method, the effect of the presence of a solute in a mixture is considered to be a modification of the solvent/CO2 pseudo-binary system. For a solvent/CO2/solute ternary diagram, it was observed that the simplest modification of the VLE that can occur is a shift of the MCP towards higher pressures, but substantial modifications of the shape of the binary VLE curves can also be obtained [20]. Quaternary systems have also been studied, considering the use of a solvent mixture to induce the precipitation of specific solutes in the desired morphology [6,21]. In this case, the description of the phase behavior is even more complicated due to the presence of more than one solvent or the solute [22]. Furthermore, it was demonstrated that the morphologies obtained with SAS were successfully correlated with the VLE obtained experimentally considering the presence of the solute. Therefore, the hypothesis, commonly used in the literature, that the solute does not affect the VLE is not always a valid claim and can induce errors in determining the correct SAS operating conditions.
From these first exploratory investigations, it seems even more necessary to obtain more data on the thermodynamic behavior of the systems of interest for the SAS process. Considering that the recent application of the SAS process is for the production of coprecipitated particles, as evidenced by the numerous articles published in this field, a quaternary system has been considered in this work. Polyvinylpyrrolidone (PVP) was selected as the model polymer because it is one of the most successful polymers used to obtain coprecipitated microparticles through the SAS process. As model drugs, α-tocopherol (TOC) and menadione (MEN), liposoluble vitamins, were used. Dimethylsulfoxide (DMSO) was the solvent selected because it is the most used solvent in the SAS process.
To investigate the modifications induced by the polymer and the vitamin in the solvent/CO2 mixture, VLE measurements using a static synthetic method for the quaternary systems DMSO/CO2/PVP/TOC and DMSO/CO2/PVP/MEN were performed. Subsequently, targeted PVP/TOC and PVP/MEN SAS coprecipitation experiments were performed, in which the operating conditions were selected considering the results obtained during the previous investigation.

2. Materials and Methods

2.1. Materials

Polyvinylpyrrolidone (PVP, MW = 10 kg/mol), menadione (MEN), and α-tocopherol (TOC) were provided by Sigma-Aldrich (Milan, Italy), whereas DMSO was purchased by Carlo Erba. CO2 (purity 99.9%) was purchased from Morlando group s.r.l. (Naples, Italy).

2.2. Methods

2.2.1. VLE Equipment and Procedure

The VLE equipment (NWA, Lorrach, Germany) used for this experimental work, shown in Figure 1a, consists of a variable volume cell in stainless-steel (AISI316) equipped with two sapphire windows that allow the observation of the sample during measurements. The internal volume of the cell can be varied from 60 to 30 cm3 with a precision of 0.05 cm3 through a piston connected to a hydraulic pressurization system. Thin band heaters heat the cell, and the thermal control of this band is guaranteed by a PID controller (Watlow, mod. 305, Toledo, OH, USA). The pressure is measured with a pressure digital gauge manometer (Parker, Minneapolis, MN, USA), whereas the temperature inside the cell is measured using a NiCr-Ni thermocouple (accuracy 0.1 K). In the cell, a speed stirrer is present in order to assure the mixing and to allow for the achievement of phase equilibrium. Depressurization is obtained through a micrometric valve (MV, Hoke, mod. 1315G4Y, Spartanburg, SC, USA). During a typical experiment, the cell is charged with a known amount of liquid sample that varies in the range 1–15 mL; then, the cell is pressurized with CO2 up to the experimental pressure and is heated up to the experimental temperature. The approach to an equilibrium state is reached with the aid of continuous stirring for 20 min. Once the operating pressure and temperature are reached, the stirrer is switched off and the complete phase separation is awaited. At this point, it is possible to observe how many phases are visible in the cell. If it is possible to visualize a separation between the phases, the pressure has to be increased: for this purpose, CO2 can be added by fixing the cell volume, or the cell volume can be reduced without changing the amount of loaded CO2. When the system reaches equilibrium again, a new observation is required. This procedure is repeated until it is possible to observe a unique phase inside the cell. In particular, it is possible to detect the bubble point curve (when the vapor phase disappears) or the dew point curve (when the liquid phase disappears), operating at a constant temperature [23]. The amount of the liquid phase is known for each experiment. In contrast, at the end of the test, using the Bender equation the amount of CO2 is calculated considering the final values of the temperature, the pressure, and the volume of the cell [24]. In this way, the molar fraction corresponding to the transition from two phases to a single phase can be calculated considering a given pressure and temperature. VLE experiments were performed in triplicate, and the points shown are the average of the three points. The difference between the various points at each condition was less than 2%, and therefore the bar with the standard deviation was not reported.

2.2.2. SAS Apparatus and Procedure

The laboratory SAS plant is sketched in Figure 1b. It is mainly constituted by a cylindrical reactor (PC) with a 500 cm3 internal volume used as the precipitation chamber. The carbon dioxide and the liquid solution are delivered by two pumps (P1 and P2, respectively). The liquid solution is injected into the precipitation chamber through a stainless-steel nozzle of 100 μm diameter. The CO2 is pre-cooled through a refrigerating bath (RB) (FL300, Julabo, Seelbach, Germany) and then delivered to the chamber. The pressure in the PC is regulated by a micrometric valve (MV) and measured by a test gauge manometer (M). The operating temperature inside the chamber is ensured by a proportional integral derivative (PID) controller connected with heating bands. A steel filter, characterized by 0.1 μm diameter pores, is located at the bottom of the PC to collect the precipitated powders and permit the CO2–solvent mixture to pass through. Then, the liquid solvent is recovered in a second collection vessel (LS), whose pressure (approximately 24 bar) is regulated by a back-pressure valve (BPV). The flow rate of CO2 and its total quantity delivered are measured by a rotameter (R).
During a typical SAS experiment, the CO2 is delivered to the precipitation chamber until the desired pressure is reached; therefore, the CO2 flow rate is stabilized by regulating the micrometric valve downstream of the precipitator. Then, the pure solvent is sent through the nozzle to the precipitation vessel. When a quasi-steady state composition of solvent and antisolvent is realized inside the chamber, the solution constituted by the organic solvent and the solute is injected at a flow rate equal to 1 mL/min. After these steps, supercritical CO2 continues to flow (at 30 g/min) to eliminate the solvent residues; at the end of this washing step, P1 pump is switched off to stop the carbon dioxide flow rate, and the precipitation chamber is depressurized down to atmospheric pressure. In this work, SAS precipitation experiments were performed at a pressure of 90 bar and a temperature of 313 K [2].

2.3. Analytical Methods

Samples of the precipitated powder are then recovered from the precipitation chamber to be analyzed using a Field Emission Scanning Electron Microscope (FESEM, mod. LEO 1525, Carl Zeiss SMT AG, Oberkochen, Germany). The powders are made conductive (and, therefore, analyzable through the microscope) through a metallization step with gold realized through a sputter coater (mod. 108 A, Agar Scientific, Stansted, UK).

3. Results

3.1. Thermodynamic Analysis of the DMSO/CO2/PVP, DMSO/CO2/MEN, and DMSO/CO2/TOC Ternary Systems

The behavior of the DMSO/CO2 binary system has already been studied in the literature [25,26,27]. After carrying out tests on that binary system to verify the reliability of the experimental method, some tests were carried out on the DMSO/CO2/PVP ternary system. Indeed, the thermodynamic aspect of the process is one of the most influencing factors on the powders’ morphology and particle size distribution, and in the literature, there are very few examples of this system phase equilibria.
The starting solution used for the experiments had a concentration of 20 mg/mL of PVP; the experiments were carried out at a temperature of 313 K. The results obtained are shown in Figure 2. It can be observed that for solutions consisting of DMSO/PVP at the temperature of 313 K, the shape of the hole remains unchanged compared to the DMSO/CO2 one, characterized by a simple type I equilibrium, according to the classification of van Konynenburg and Scott [28]. Therefore, the behavior of the thermodynamic mixture is similar to that of the pure solvent. In particular, by comparing the VLE of the DMSO/CO2/PVP mixture at 313 K with that of the DMSO/CO2 binary system of Figure 2, a substantial overlap between the curves can be observed. This means that the presence of PVP does not modify the binary mixture VLE. The MCP for the system containing PVP is 90.2 bar with an XCO2 of 0.97.
The miscibility hole of the DMSO/CO2/MEN system was experimentally determined to verify the effect of the presence of the vitamin. The solution was prepared by adding to DMSO an amount of MEN corresponding to the amount that would have guaranteed a 3/1 PVP/MEN ratio (but without adding the PVP itself).
The data obtained are reported in Table 1; from the graph of Figure 3, it can be seen that the MCP, which was at 90.2 bar in the presence of PVP, rises to 162.1 bar.
Comparing the DMSO/CO2 system with the DMSO/CO2/MEN system, it is clear that the vitamin causes the modification of the VLE, while the DMSO/CO2/PVP and DMSO/CO2 curves have an overlap.
Similarly, some tests were carried out for the DMSO/CO2/TOC system to verify the effect of the vitamin alone. The data obtained are reported in Table 2, and from the graph of Figure 4, it can be seen that the MCP, also in this case, from 90.2 bar (in the presence of PVP), rises to 121.1 bar.

3.2. Thermodynamic Analysis of DMSO/CO2/PVP/Vitamin Quaternary Systems

To evaluate the VLE of the quaternary systems, first, a solution of PVP/DMSO at a concentration of 20 mg/mL was prepared; then, an amount of the chosen vitamin (MEN or TOC) necessary to have a PVP/vitamin ratio of 5/1 and 3/1 was added to that solution.
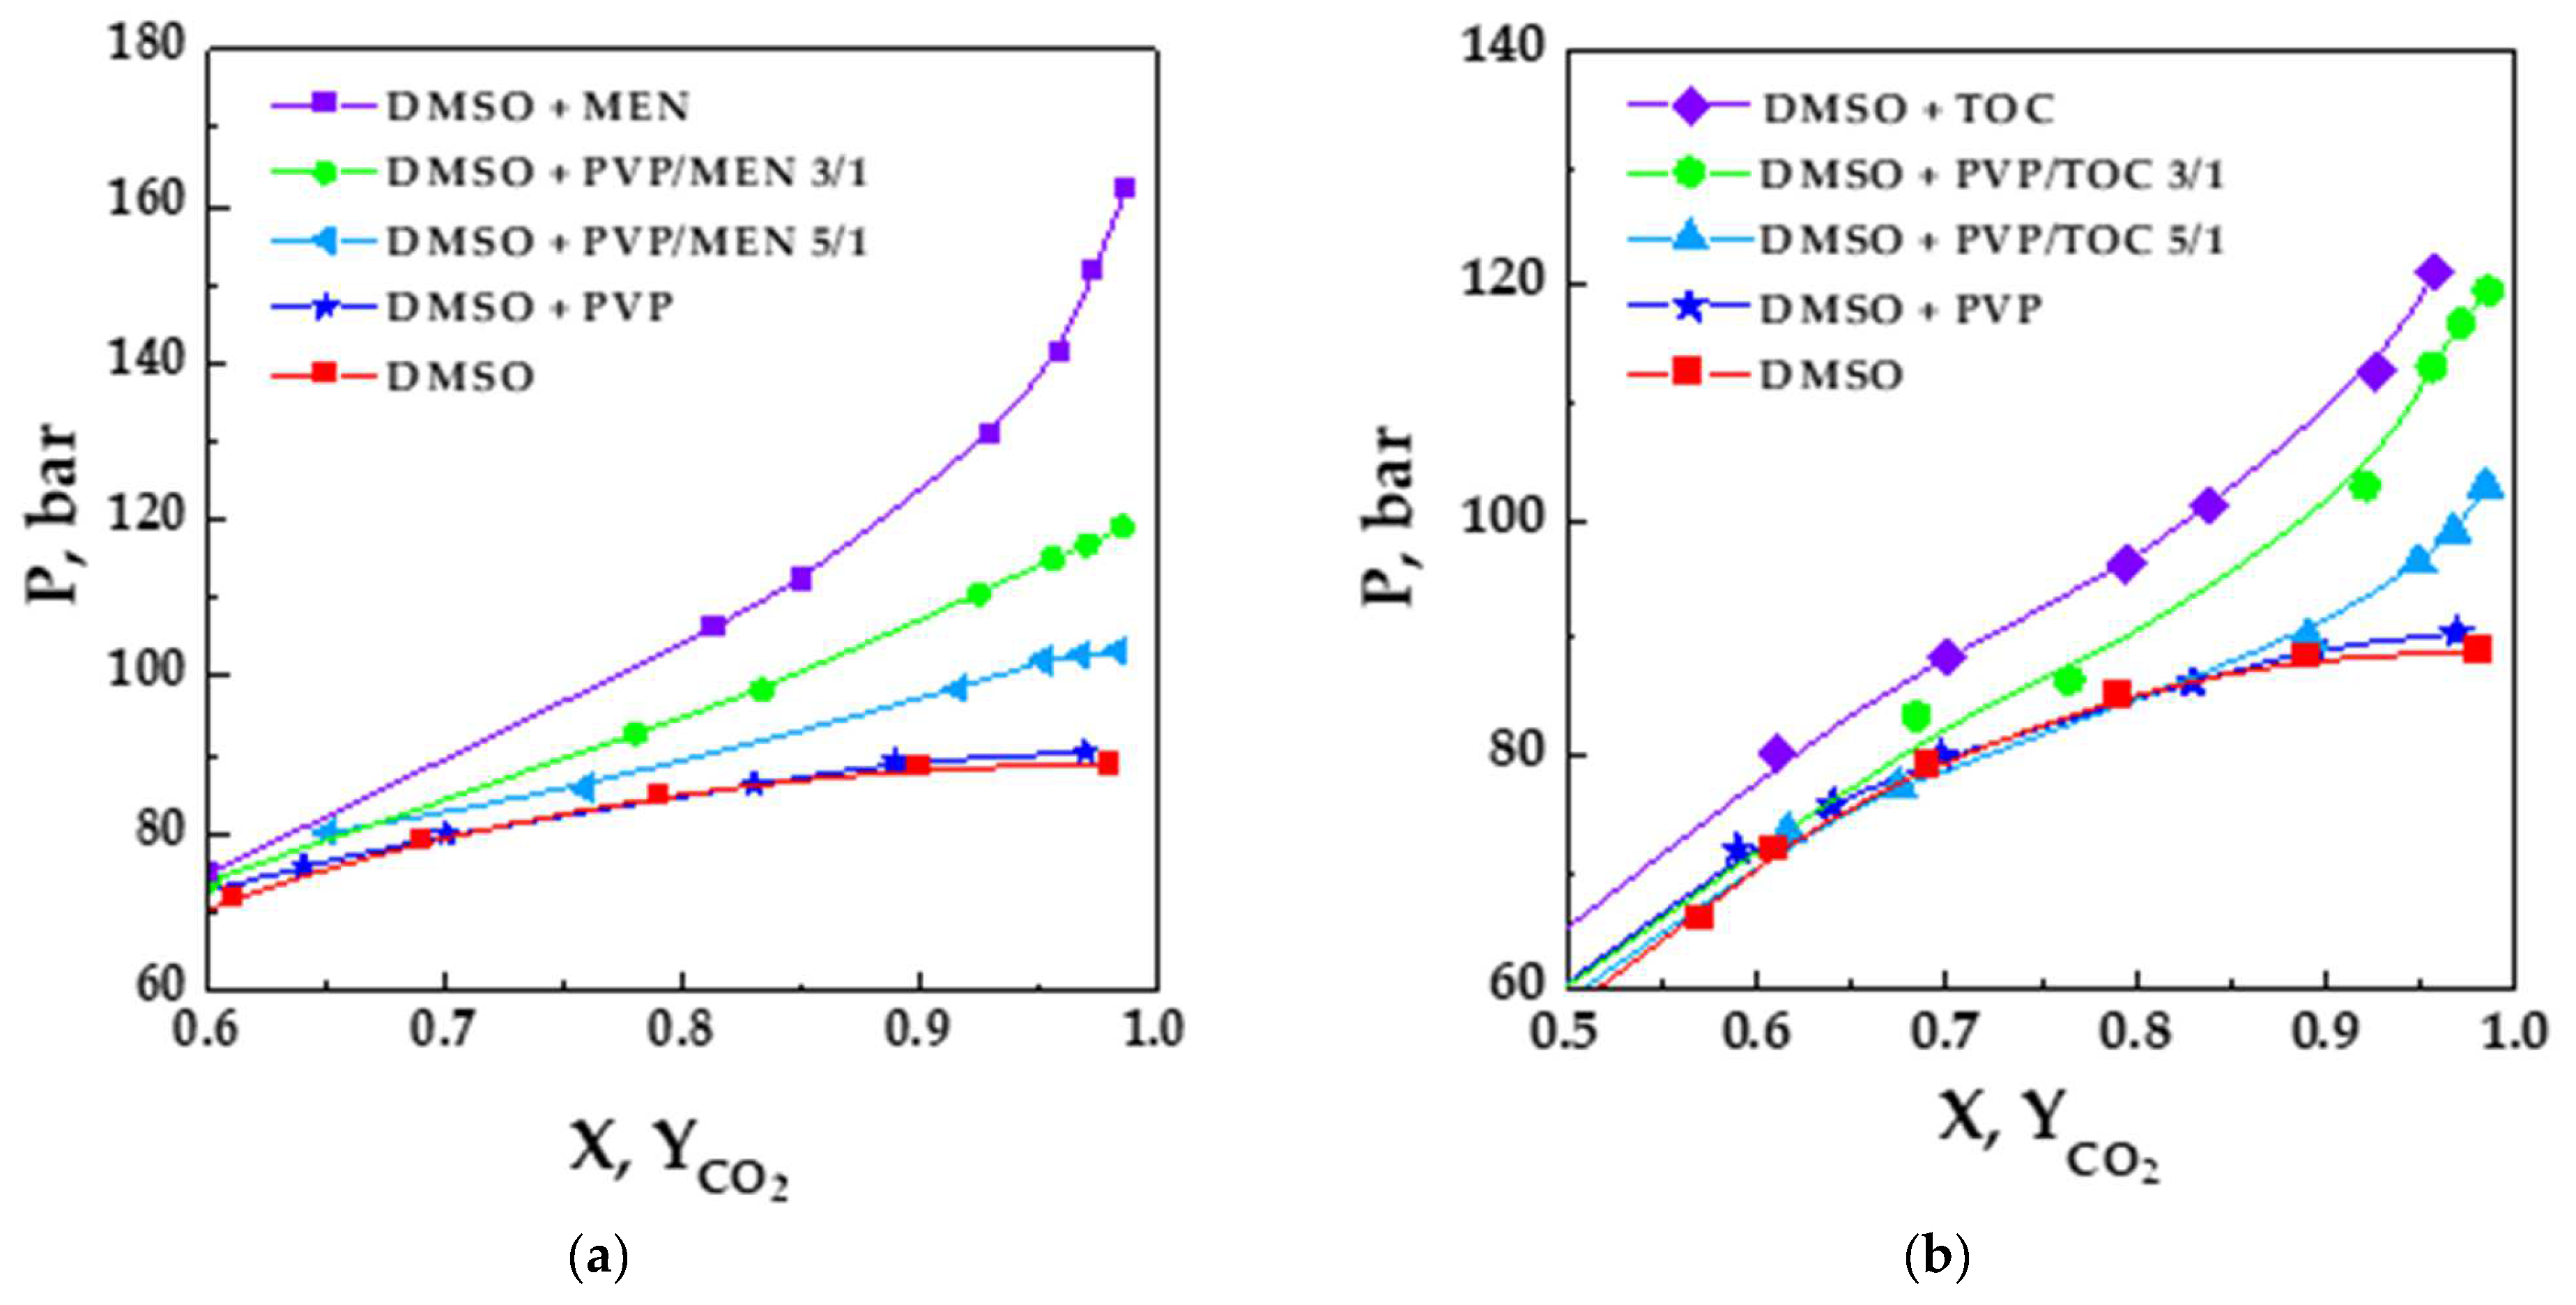
The quaternary system of interest was studied as a pseudo-binary system, and the molar concentrations were evaluated on a solute-free basis. This expedient allows for the representation of a quaternary system on a P/x diagram instead of requiring the use of a more complex graph. The systems were studied at a temperature of 313 K. The experimental data obtained are shown in Figure 5a for MEN and Figure 5b for TOC; the quaternary curves are compared with the curve of the DMSO/CO2 binary system.
From the comparison of the equilibria reported in Figure 5a,b, it can be seen that the presence of the vitamin at a PVP/vitamin ratio of 5/1 and a temperature of 313 K produces a deviation of the mixture critical point at a slightly higher-pressure value. MCP is at 103.3 bar and XCO2 equal to 0.98 for the 5/1 PVP/MEN system and at 102.9 bar and XCO2 equal to 0.98 for the 5/1 PVP/TOC system. Therefore, in both cases, the MCP pressure is higher than the one of the system containing only PVP.
Therefore, the effect of the presence of the vitamin was evaluated at a higher concentration; in particular, the polymer/vitamin ratio was fixed at 3/1, whereas the temperature was unchanged.
The obtained equilibrium curves are represented in Figure 5a,b for a comparison with the curves previously obtained; it can be seen that the increase of the vitamin concentration causes a further shift of the mixture critical point. Indeed, the critical point is located at 119.1 bar and at a mole fraction of 0.99 for the PVP/MEN system and at 119.6 bar and at the mole fraction of 0.99 for the PVP/TOC system. These values are significantly higher than the values obtained in the case of the system with the PVP alone and with PVP/vitamin ratio equal to 5/1 but lower with respect to the values found for DMSO/MEN and DMSO/TOC system. The quaternary mixture exhibits intermediate behavior among the observed behavior of DMS/PVP and DMSO/MEN or DMSO/TOC systems; this behavior is sensitive to the amount of vitamin with respect to the polymer and vice versa.

4. SAS Precipitation Experiment of PVP/Vitamin

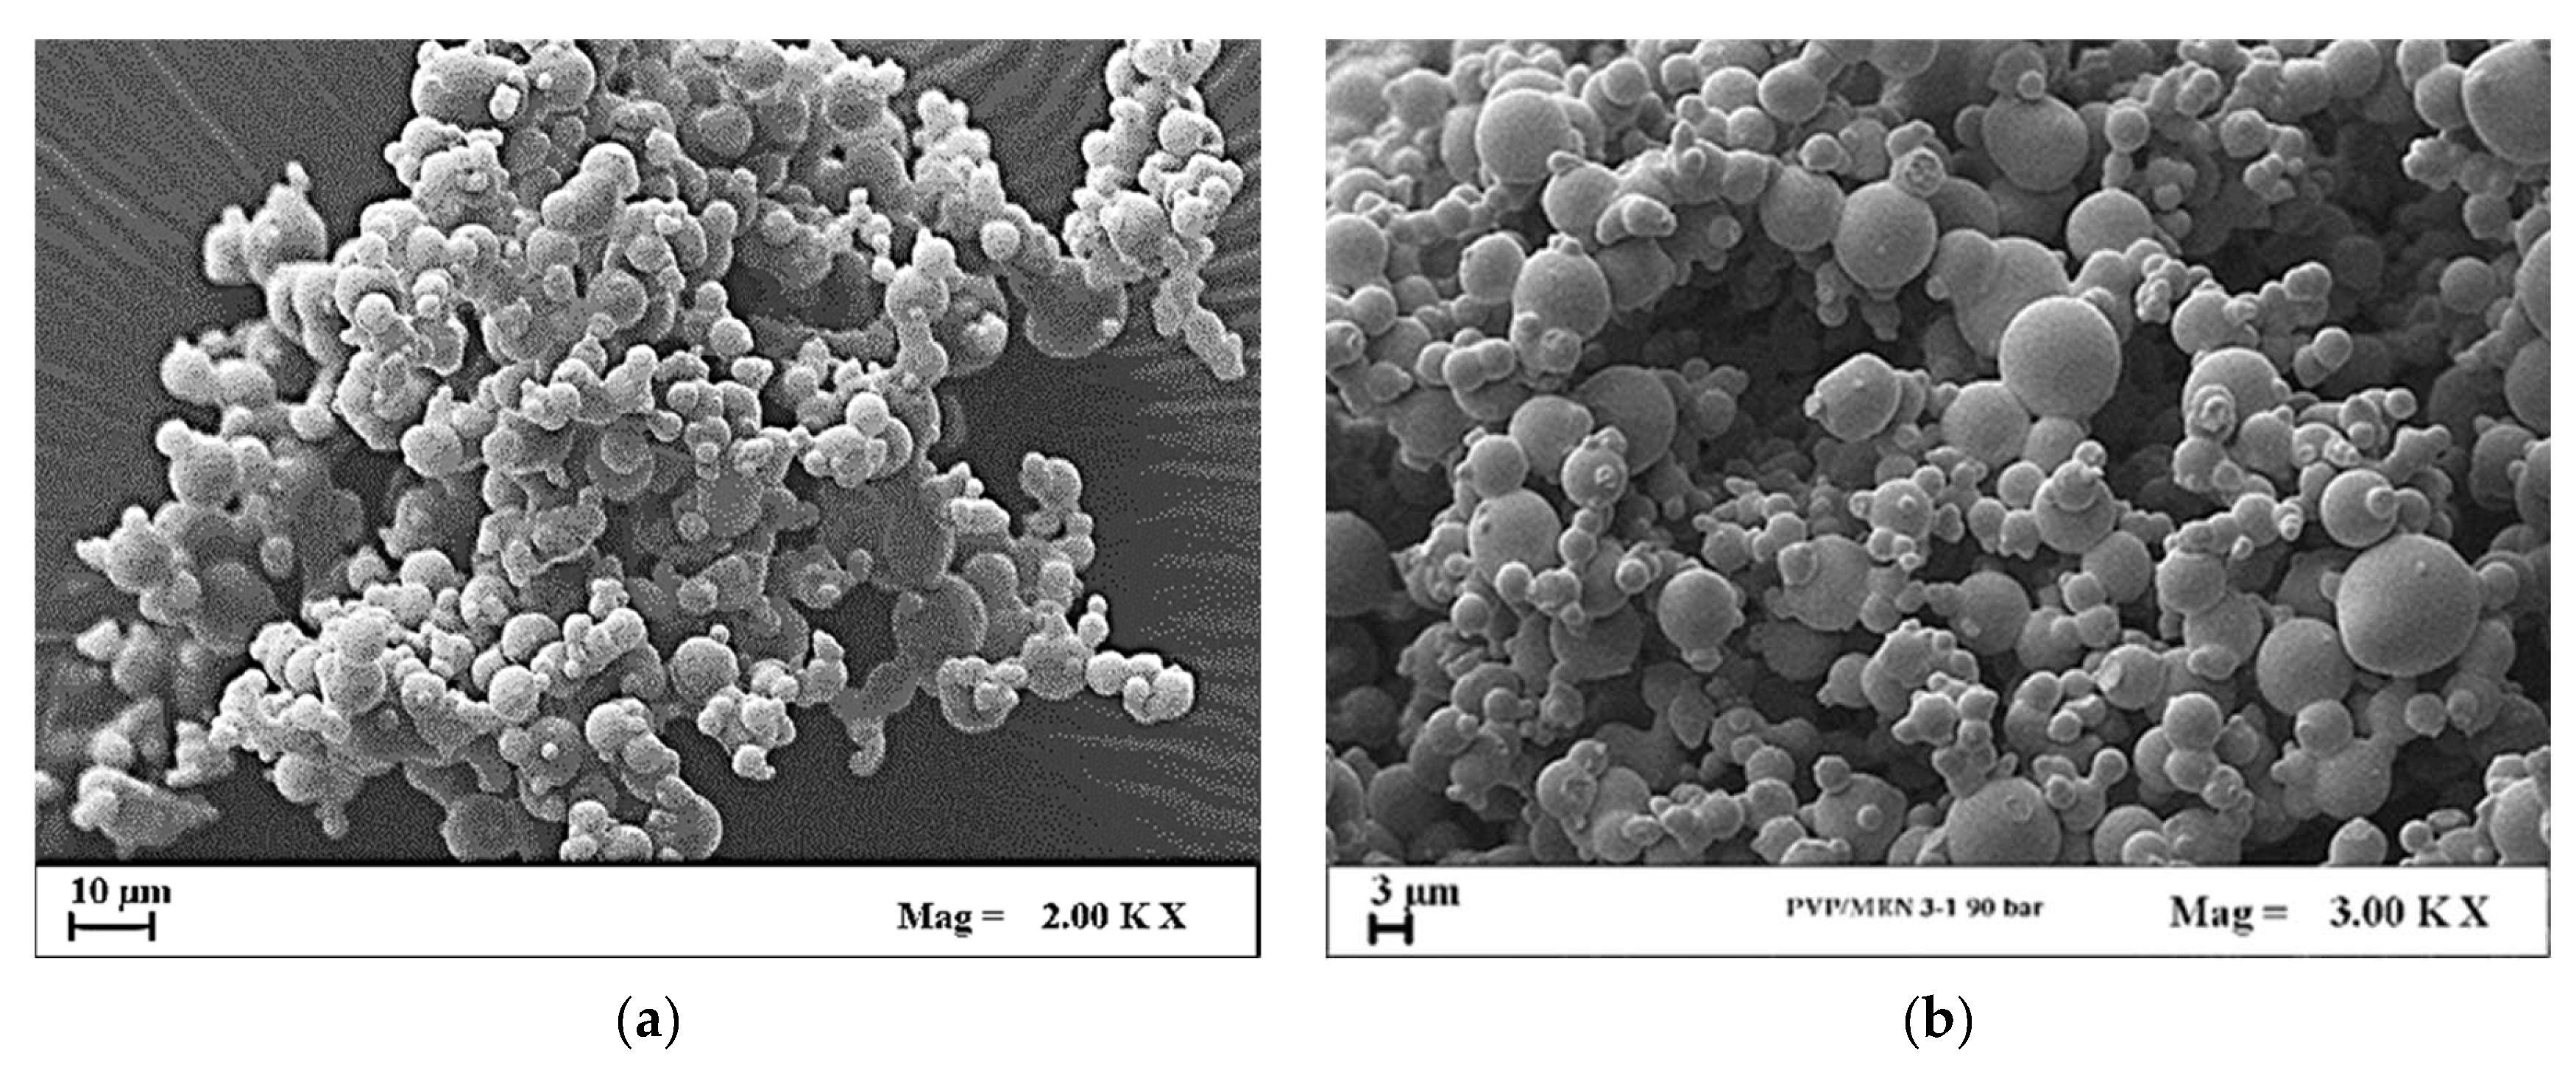
PVP-Vitamin SAS precipitation experiments were performed at 90 bar, 313 K, and XCO2 = 0.97, fixing a total concentration of 20 mg/mL, with the aim of confirming/emphasizing the hypothesis that the morphology and the particle size distribution are closely related to the complex systems VLE.
From the FESEM images, reported in Figure 6 and Figure 7 for PVP/MEN and PVP/TOC, respectively, it can be observed that the micrometric particles obtained are spherical and non-coalescing. According to the SAS theory, considering the DMSO/CO2 binary system, in both cases, the operating point is beyond the mixture critical point, so one would expect to obtain sub-microparticles [19]. On the other hand, considering the VLE determined for the quaternary system, it appears clear that the operating point is far from the mixture critical point both in the case of the 3/1 ratio and the 5/1 ratio.
These results confirmed the data obtained for the quaternary system studied.

5. Conclusions

In this work, the results obtained confirmed the importance of determining the VLE of complex (ternary or quaternary) systems. Indeed, from the analysis of the presence of a single compound in the binary system, it was noted that the presence of PVP slightly affected the thermodynamic behavior of the binary system. In contrast, the effects of the presence of the vitamins were more evident (DMSO/CO2/TOC and DMSO/CO2/MEN systems). The evaluation of the VLE of the quaternary systems revealed significant changes in the phase behaviors both for DMSO/CO2/PVP/TOC and DMSO/CO2/PVP/MEN systems with respect to the binary system solvent/CO2. The morphologies of the particles obtained during the SAS process were successfully correlated with the VLE experimentally obtained. In conclusion, determining the VLE of complex systems is essential to select the right operating conditions in advance. Using these conditions, it is possible to obtain a targeted mean particle size and a specific particle morphology.

Author Contributions

Conceptualization, R.C. and I.D.M.; methodology, R.C., S.M. and I.D.M.; validation, R.C. and I.D.M.; investigation, R.C.; resources, I.D.M.; data curation, S.M.; writing—original draft preparation, S.M.; writing—review and editing, R.C. and I.D.M.; supervision, R.C. and I.D.M.; and project administration, R.C. and I.D.M. All authors have read and agreed to the published version of the manuscript.

Funding

This research received no external funding.

Institutional Review Board Statement

Not applicable.

Informed Consent Statement

Not applicable.

Conflicts of Interest

The authors declare no conflict of interest.

Abbreviations

DMSOdimethylsulfoxide
EMPexpanded microparticles
FESEMfield emission scanning electron microscope
MCPmixture critical point
MENmenadione
MPmicroparticles
NPnanoparticles
PSDparticle size distribution
PVPpolyvinylpirrolidone
SASsupercritical antisolvent process
scCO2supercritical carbon dioxide
TOCα-tocopherol
VLEvapor liquid equilibria

References

  1. Franco, P.; Sacco, O.; De Marco, I.; Vaiano, V. Zinc oxide nanoparticles obtained by supercritical antisolvent precipitation for the photocatalytic degradation of crystal violet dye. Catalysts 2019, 9, 346. [Google Scholar] [CrossRef] [Green Version]
  2. Franco, P.; De Marco, I. Supercritical Antisolvent Process for Pharmaceutical Applications: A Review. Processes 2020, 8, 938. [Google Scholar] [CrossRef]
  3. Machmudah, S.; Winardi, S.; Wahyudiono; Kanda, H.; Goto, M. Formation of Fine Particles from Curcumin/PVP by the Supercritical Antisolvent Process with a Coaxial Nozzle. ACS Omega 2020, 5, 6705–6714. [Google Scholar] [CrossRef] [Green Version]
  4. Vallejo, R.; Gonzalez-Valdivieso, J.; Santos, M.; Rodriguez-Rojo, S.; Arias, F.J. Production of elastin-like recombinamer-based nanoparticles for docetaxel encapsulation and use as smart drug-delivery systems using a supercritical anti-solvent process. J. Ind. Eng. Chem. 2021, 93, 361–374. [Google Scholar] [CrossRef]
  5. Lengsfeld, C.S.; Delplanque, J.P.; Barocas, V.H.; Randolph, T.W. Mechanism Governing Microparticle Morphology during Precipitation by a Compressed Antisolvent: Atomization vs Nucleation and Growth. J. Phys. Chem. B 2000, 104, 2725–2735. [Google Scholar] [CrossRef]
  6. De Marco, I.; Prosapio, V.; Cice, F.; Reverchon, E. Use of solvent mixtures in supercritical antisolvent process to modify precipitates morphology: Cellulose acetate microparticles. J. Supercrit. Fluids 2013, 83, 153–160. [Google Scholar] [CrossRef]
  7. Yeo, S.D.; Kiran, E. Formation of polymer particles with supercritical fluids: A review. J. Supercrit. Fluids 2005, 34, 287–308. [Google Scholar] [CrossRef]
  8. Byrappa, K.; Ohara, S.; Adschiri, T. Nanoparticles synthesis using supercritical fluid technology—Towards biomedical applications. Adv. Drug Deliv. Rev. 2008, 60, 299–327. [Google Scholar] [CrossRef]
  9. Martín, A.; Cocero, M.J. Micronization processes with supercritical fluids: Fundamentals and mechanisms. Adv. Drug Deliv. Rev. 2008, 60, 339–350. [Google Scholar] [CrossRef]
  10. Sinha, B.; Müller, R.H.; Möschwitzer, J.P. Bottom-up approaches for preparing drug nanocrystals: Formulations and factors affecting particle size. Int. J. Pharm. 2013, 453, 126–141. [Google Scholar] [CrossRef]
  11. Gil-Ramírez, A.; Rodriguez-Meizoso, I. Purification of Natural Products by Selective Precipitation Using Supercritical/Gas Antisolvent Techniques (SAS/GAS). Sep. Purif. Rev. 2021, 50, 32–52. [Google Scholar] [CrossRef]
  12. Ozkan, G.; Franco, P.; Capanoglu, E.; De Marco, I. PVP/flavonoid coprecipitation by supercritical antisolvent process. Chem. Eng. Process. 2019, 146, 1–10. [Google Scholar] [CrossRef]
  13. Uzun, I.N.; Sipahigil, O.; Dinçer, S. Coprecipitation of Cefuroxime Axetil-PVP composite microparticles by batch supercritical antisolvent process. J. Supercrit. Fluids 2011, 55, 1059–1069. [Google Scholar] [CrossRef]
  14. Matos, R.L.; Lu, T.; Prosapio, V.; McConville, C.; Leeke, G.; Ingram, A. Coprecipitation of curcumin/PVP with enhanced dissolution properties by the supercritical antisolvent process. J. CO2 Util. 2019, 30, 48–62. [Google Scholar] [CrossRef]
  15. Taki, S.; Badens, E.; Charbit, G. Controlled release system formed by supercritical anti-solvent coprecipitation of a herbicide and a biodegradable polymer. J. Supercrit. Fluids 2001, 21, 61–70. [Google Scholar] [CrossRef]
  16. Montes, A.; Gordillo, M.D.; Pereyra, C.; Martínez de la Ossa, E.J. Polymer and ampicillin co-precipitation by supercritical antisolvent process. J. Supercrit. Fluids 2012, 63, 92–98. [Google Scholar] [CrossRef]
  17. Reverchon, E.; Torino, E.; Dowy, S.; Braeuer, A.; Leipertz, A. Interactions of phase equilibria, jet fluid dynamics and mass transfer during supercritical antisolvent micronization. Chem. Eng. J. 2010, 156, 446–458. [Google Scholar] [CrossRef]
  18. Werling, J.O.; Debenedetti, P.G. Numerical modeling of mass transfer in the supercritical antisolvent process. J. Supercrit. Fluids 1999, 16, 167–181. [Google Scholar] [CrossRef]
  19. Reverchon, E.; De Marco, I. Mechanisms controlling supercritical antisolvent precipitate morphology. Chem. Eng. J. 2011, 169, 358–370. [Google Scholar] [CrossRef]
  20. Campardelli, R.; Reverchon, E.; De Marco, I. Dependence of SAS particle morphologies on the ternary phase equilibria. J. Supercrit. Fluids 2017, 130, 273–281. [Google Scholar] [CrossRef]
  21. Rossmann, M.; Braeuer, A.; Dowy, S.; Gallinger, T.G.; Leipertz, A.; Schluecker, E. Solute solubility as criterion for the appearance of amorphous particle precipitation or crystallization in the supercritical antisolvent (SAS) process. J. Supercrit. Fluids 2012, 66, 350–358. [Google Scholar] [CrossRef]
  22. Campardelli, R.; Reverchon, E.; De Marco, I. PVP microparticles precipitation from acetone-ethanol mixtures using SAS process: Effect of phase behavior. J. Supercrit. Fluids 2019, 143, 321–329. [Google Scholar] [CrossRef]
  23. Vitu, S.; Jaubert, J.N.; Pauly, J.; Daridon, J.L.; Barth, D. Phase equilibria measurements of CO2 + methyl cyclopentane and CO2 + isopropyl cyclohexane binary mixtures at elevated pressures. J. Supercrit. Fluids 2008, 44, 155–163. [Google Scholar] [CrossRef]
  24. Bender, E. Equation of state exactly representing the phase behaviors of pure substances. In Proceedings of the 5th Symposium on Thermophysical Properties, Boston, MA, USA, 30 September–2 October 1970; ASME: New York, NY, USA, 1970; pp. 227–235. [Google Scholar]
  25. Rajasingam, R.; Lioe, L.; Pham, Q.T.; Lucien, F.P. Solubility of carbon dioxide in dimethylsulfoxide and N-methyl-2- pyrrolidone at elevated pressure. J. Supercrit. Fluids 2004, 31, 227–234. [Google Scholar] [CrossRef]
  26. Andreatta, A.E.; Florusse, L.J.; Bottini, S.B.; Peters, C.J. Phase equilibria of dimethyl sulfoxide (DMSO) + carbon dioxide, and DMSO + carbon dioxide + water mixtures. J. Supercrit. Fluids 2007, 42, 60–68. [Google Scholar] [CrossRef]
  27. Vega Gonzalez, A.; Tufeu, R.; Subra, P. High-pressure vapor-liquid equilibrium for the binary systems carbon dioxide + dimethyl sulfoxide and carbon dioxide + dichloromethane. J. Chem. Eng. Data 2002, 47, 492–495. [Google Scholar] [CrossRef]
  28. Van Konynenburg, P.; Scott, R. Critical lines and phase equilibria in binary van der Waals mixtures. Philos. Trans. R. Soc. London. Ser. A Math. Phys. Sci. 1980, 298, 495–540. [Google Scholar]
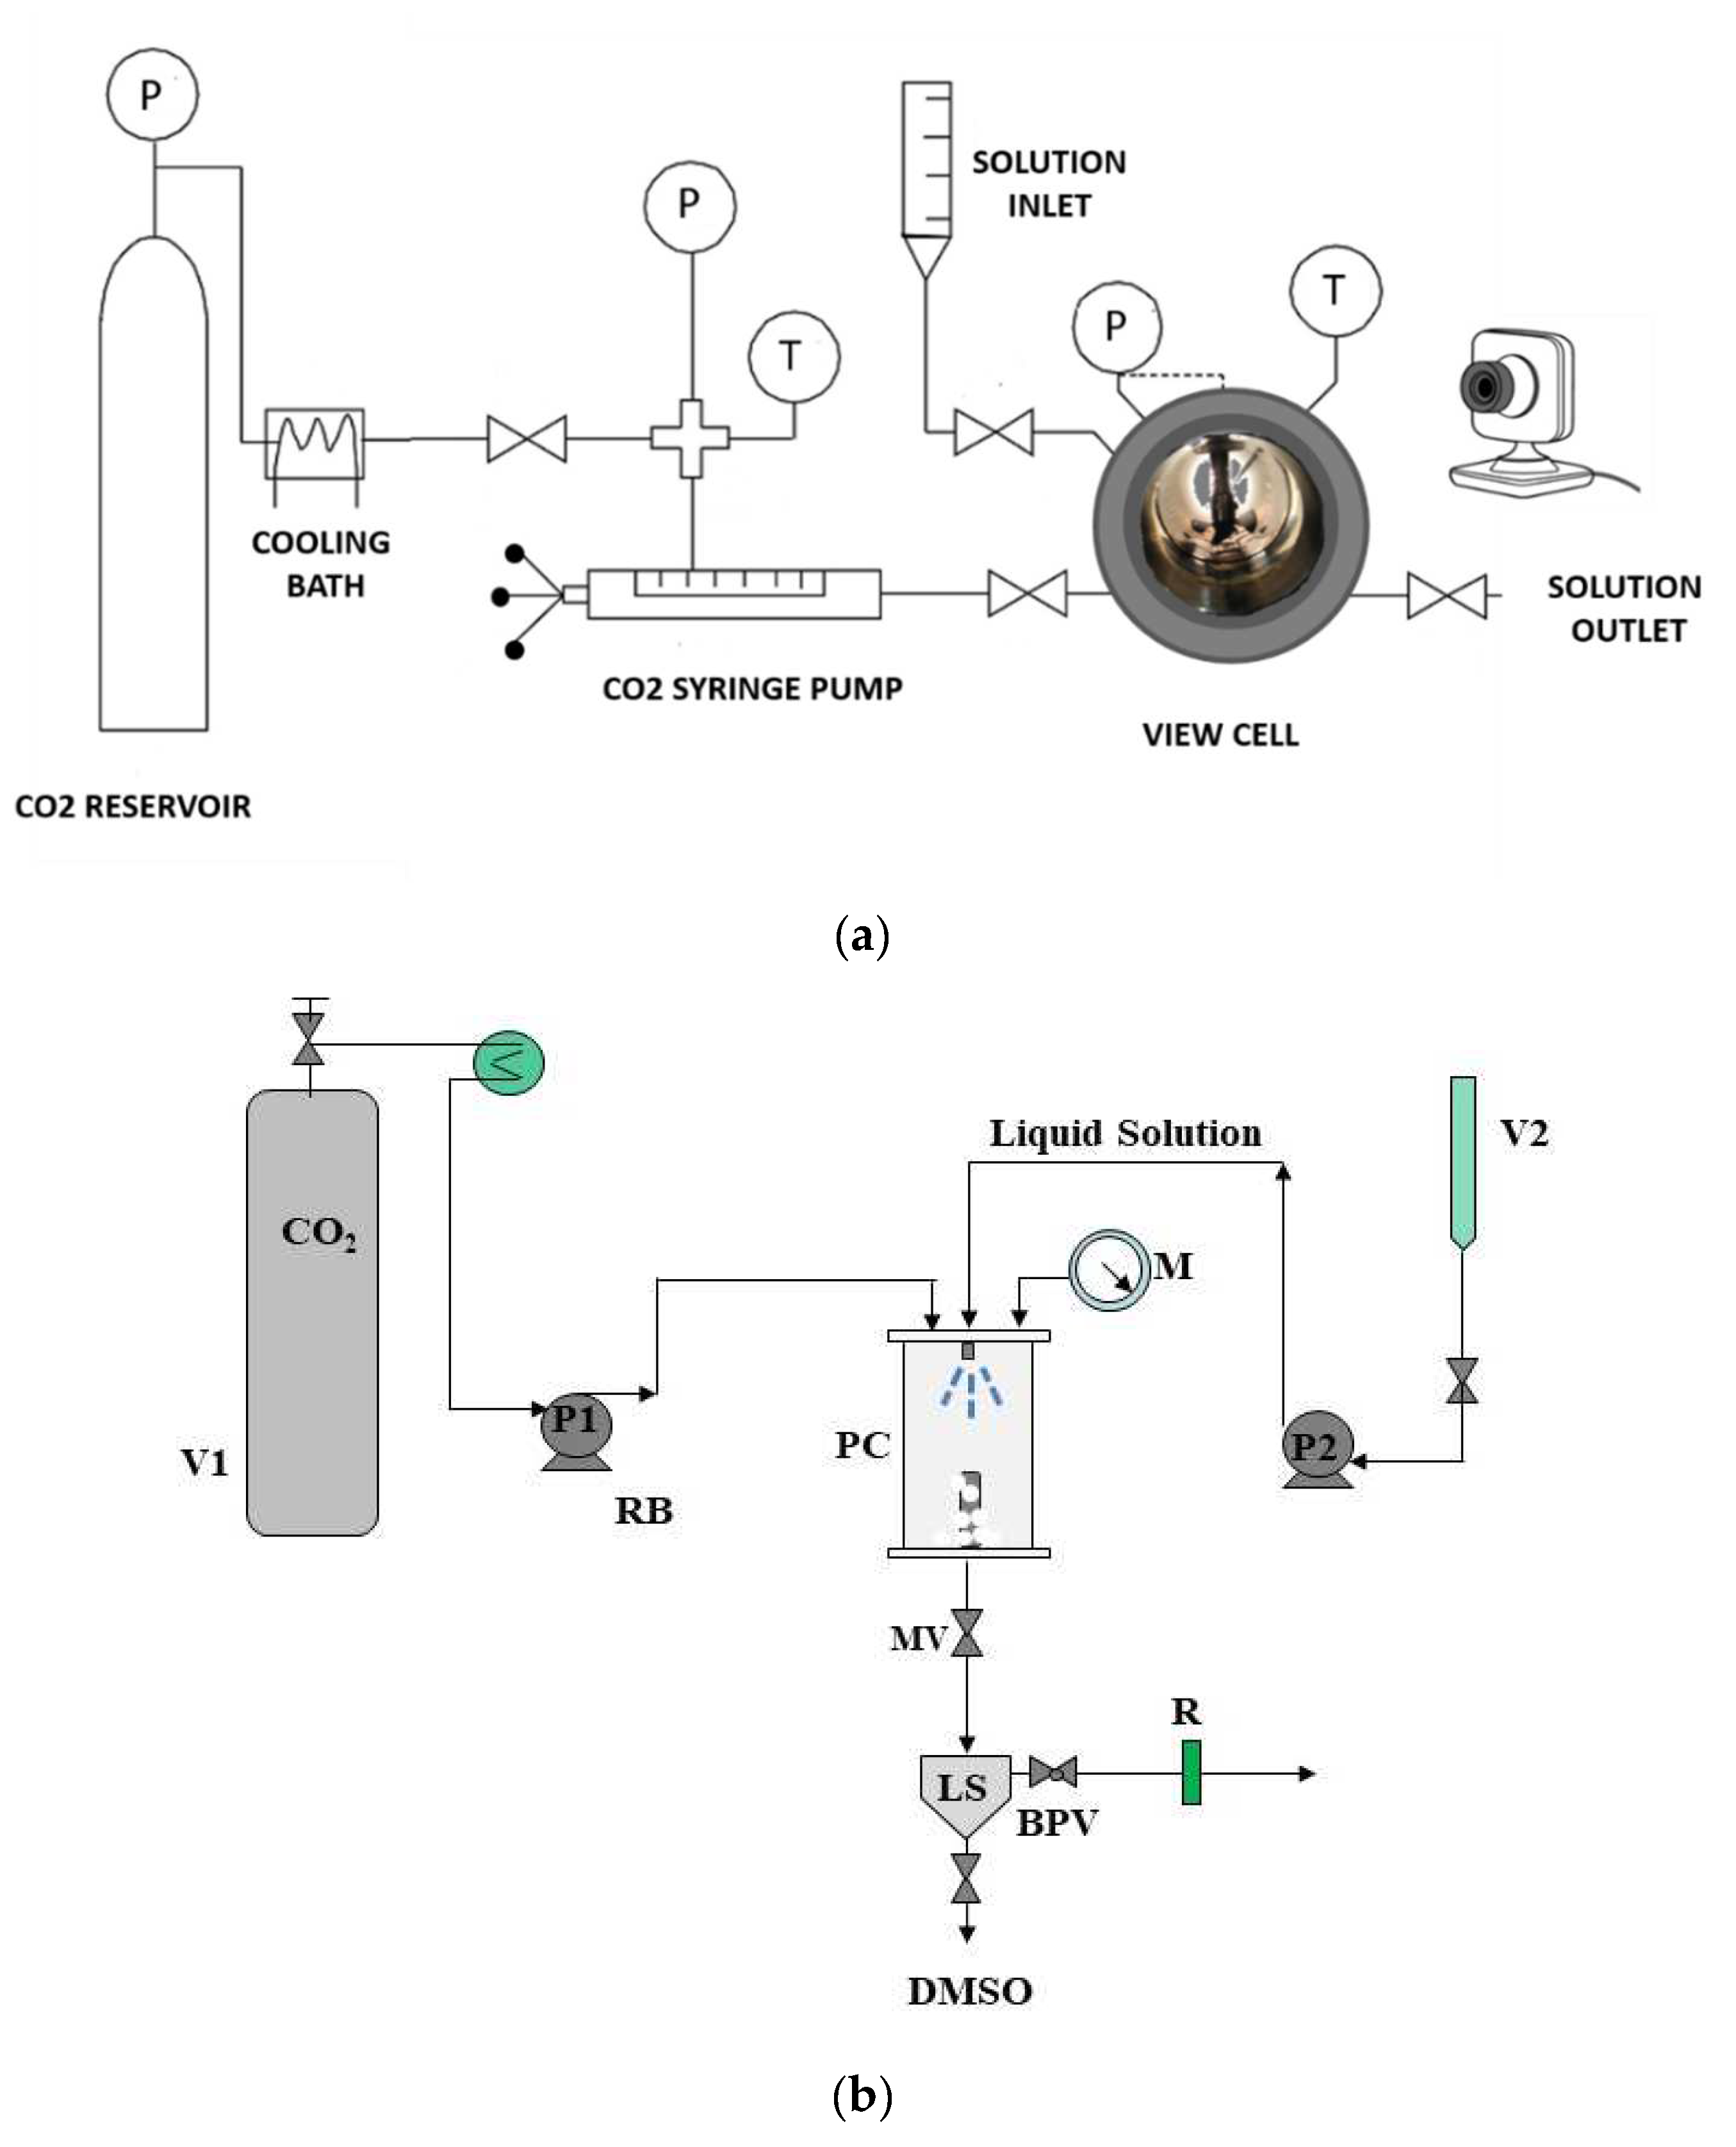
Figure 1. (a) View cell equipment; (b) SAS apparatus. BPV: back-pressure valve; LS: liquid separator; M: manometer; MV: micrometric valve; P1 and P2: pumps; PC: precipitation chamber; R: rotameter; and V1 and V2: storage vessels.
Processes 10 02544 g001
Figure 2. Comparison P-x diagram between DMSO/CO2 system and DMSO/CO2/PVP mixture at a temperature of 313 K.
Processes 10 02544 g002
Figure 3. Comparison in a P-x diagram between DMSO/CO2/MEN system and pure DMSO at a temperature of 313 K.
Processes 10 02544 g003
Figure 4. Comparison in a P-x diagram between DMSO/CO2/TOC system and pure DMSO at a temperature of 313 K.
Processes 10 02544 g004
Figure 5. Comparison in a P-x diagram between the DMSO/CO2 system and the ternary and quaternary systems at a temperature of 313 K for MEN (a) and TOC (b).
Processes 10 02544 g005
Figure 6. FESEM images of coprecipitated PVP/MEN particles at a 5/1 (a) and 3/1 (b) ratio, at 90 bar and 313 K.
Processes 10 02544 g006
Figure 7. FESEM images of coprecipitated PVP/TOC particles at a 5/1 (a) and 3/1 (b) ratio, at 90 bar and 313 K.
Processes 10 02544 g007
Table 1. Experimental data for DMSO/CO2/MEN system at 313 K.
XCO2P, Bar
DMSO
0.9888.8
0.9088.4
0.7985.0
0.6979.1
0.6172.0
0.5766.0
DMSO/MEN
0.99162.1
0.97151.6
0.93130.6
0.85112.3
0.81106.1
0.6075
Table 2. Experimental data for DMSO/CO2/TOC system at 313 K.
XCO2P, Bar
DMSO
0.9888.8
0.9088.4
0.7985.0
0.6979.1
0.6172.0
0.5766.0
DMSO/TOC
0.96121.1
0.93112.8
0.84101.3
0.7996.3
0.7088.3
0.6180.2
Publisher’s Note: MDPI stays neutral with regard to jurisdictional claims in published maps and institutional affiliations.