Article

Machine Learning-Based Approach for Modeling the Nanofluid Flow in a Solar Thermal Panel in the Presence of Phase Change Materials

by
Saeed Alqaed
1,
Jawed Mustafa
1,*,
Fahad Awjah Almehmadi
2,
Mathkar A. Alharthi
3,
Mohsen Sharifpur
4,5,* and
Goshtasp Cheraghian
6,7,*
1
Mechanical Engineering Department, College of Engineering, Najran University, P.O. Box 1988, Najran 61441, Saudi Arabia
2
Department of Applied Mechanical Engineering, College of Applied Engineering, Muzahimiyah Branch, King Saud University, P.O. Box 800, Riyadh 11421, Saudi Arabia
3
Department of Chemical Engineering, College of Engineering at Yanbu, Taibah University, P.O. Box 4050, Yanbu Al-Bahr 41911, Saudi Arabia
4
Department of Mechanical and Aeronautical Engineering, University of Pretoria, Pretoria 0002, South Africa
5
Department of Medical Research, China Medical University Hospital, China Medical University, Taichung 404, Taiwan
6
Institut für Chemie and IRIS Adlershof, Humboldt-Universität zu Berlin, 12489 Berlin, Germany
7
Department of Chemistry, King’s College London, London WC2R 2LS, UK
*
Authors to whom correspondence should be addressed.
Processes 2022, 10(11), 2291; https://doi.org/10.3390/pr10112291
Submission received: 1 October 2022 / Revised: 19 October 2022 / Accepted: 30 October 2022 / Published: 4 November 2022
(This article belongs to the Section Materials Processes)

Abstract

:
Considering the importance of environmental protection and renewable energy resources, particularly solar energy, the present study investigates the temperature control of a solar panel using a nanofluid (NFD) flow with eco-friendly nanoparticles (NPs) and a phase change material (PCM). The PCM was used under the solar panel, and the NFD flowed through pipes within the PCM. A number of straight fins (three fins) were exploited on the pipes, and the output flow temperature, heat transfer (HTR) coefficient, and melted PCM volume fraction were measured for different pipe diameters (D_Pipe) from 4 mm to 8 mm at various time points (from 0 to 100 min). Additionally, with the use of artificial intelligence and machine learning, the best conditions for obtaining the lowest panel temperature and the highest output NFD temperature at the lowest pressure drop have been determined. While the porosity approach was used to model the PCM melt front, a two-phase mixture was used to simulate NFD flow. It was discovered that the solar panel temperature and output temperature both increased considerably between t = 0 and t = 10 min before beginning to rise at varying rates, depending on the D_Pipe. The HTR coefficient increased over time, showing similar behavior to the panel temperature. The entire PCM melted within a short time for D_Pipes of 4 and 6 mm, while a large fraction of the PCM remained un-melted for a long time for a D_Pipe of 8 mm. An increase in D_Pipe, particularly from 4 to 6 mm, reduced the maximum and average panel temperatures, leading to a lower output flow temperature. Furthermore, the increased D_Pipe reduced the HTR coefficient, with the PCM remaining un-melted for a longer time under the panel.

1. Introduction

Today, many countries are struggling with climate change and its consequent environmental impacts. Precipitation reduction and widespread droughts, floods, and hurricanes result from climate change. Global warming is a major explanation for such changes, and massive efforts are required to avoid further temperature increases across the world [1,2,3,4]. The excessive emission of CO2 after the Industrial Revolution has led to climate change and global warming. Industrial and residential energy accounts for a significant portion of CO2 emissions [5,6,7,8,9]. The replacement of traditional energy resources with renewable, clean energy could substantially help reduce CO2 emissions [10,11,12,13]. Today, attention has been paid to the topic of HTR [14,15]. Specifically, solar energy has been of great interest to researchers, and many researchers assume solar energy to be an effective substitute for traditional energy resources [16,17,18,19]. Solar panels can be employed to harvest solar energy [20,21,22,23,24]. Solar thermal panels can be more effective for solar energy harvesting since they can generate hot water and can maximize panel efficiency [25,26,27,28,29]. Several researchers studied solar thermal panels [30,31,32,33,34]. By using a thermosyphon–heat pipe combination with water-cooling jackets beneath the PV modules to absorb extra heat from the solar cells, Moradgholi et al. [35] devised a photovoltaic thermal (PVT) system. They reported a 26% reduction in the PV cell temperature. Nizatik et al. [36] employed water spraying to cool PV modules (in the front, in the back, and both in the front and back) in outdoor settings in Croatia. It was found that water spraying in the front, back, and both front and back reduced the solar module temperature by 42.8%, 58.9%, and 60.7%, respectively.
NFDs have been widely employed in thermal devices [37,38,39,40,41]. A NFD is made up of base fluid with NPs. Research has shown that NFDs significantly enhance HTR [42,43,44,45,46]. Jingio et al. [47] theoretically studied the performance of Fe2O3 NFDs as an optical filter on a silicon PV panel. The optimal volume fraction of Fe2O3 NPs for the NFD with a base fluid mixture of 50% water and 50% ethylene glycol was found to be 5 × 10⁻⁴%. A passive cooling method was suggested by Chandereskar et al. [48] to cool PV modules. On the back of the PV modules, a cotton wick and several NFDs made up the system. The tests were carried out in the climate of an Indian city in April. It was found that the use of a cotton wick and water, a cotton wick and a CuO/water NFD, and a cotton wick and an Al2O3/water NFD led to 30%, 11%, and 17% temperature reductions, respectively.
Today, it is necessary to protect the environment for future generations. Environmental deterioration in the past decades has led to significant climate change and the extinction of some species [49,50,51,52]. The destruction of the environment would destroy human life [53,54,55]. Hence, environmental revival is important for countries and the United Nations (UN). Substantial CO2 emissions pose a serious threat to human life. The use of clean and renewable energy in place of fossil fuels to reduce CO2 emissions is an effective approach to environmental protection. Solar energy could be a promising alternative for future energy generation as it is simple, renewable, and non-polluting. The use of phase change material can also help with the efficiency of heating devices [56,57,58,59,60]. In this work, a NFD containing eco-friendly NPs and a phase change material (PCM) at the same time is used to adjust the temperature of a solar panel. It was presumed that the NFD was a two-phase system. The PCM and a number of pipes with fins were employed under the solar panel to control its temperature. This study assumed a transient system and analyzed the effects of D_Pipe on the panel temperature, output NFD temperature, and melted PCM volume fraction. It should be noted that eco-friendly NPs were fabricated through tea leaf extracts to implement an even more eco-friendly solar system. In summary, the use of eco-friendly NFD in the PV-thermal panel, the use of PCM in the system, and the examination of the impact of changing the tube diameter on the outputs can be considered innovations of the present work.

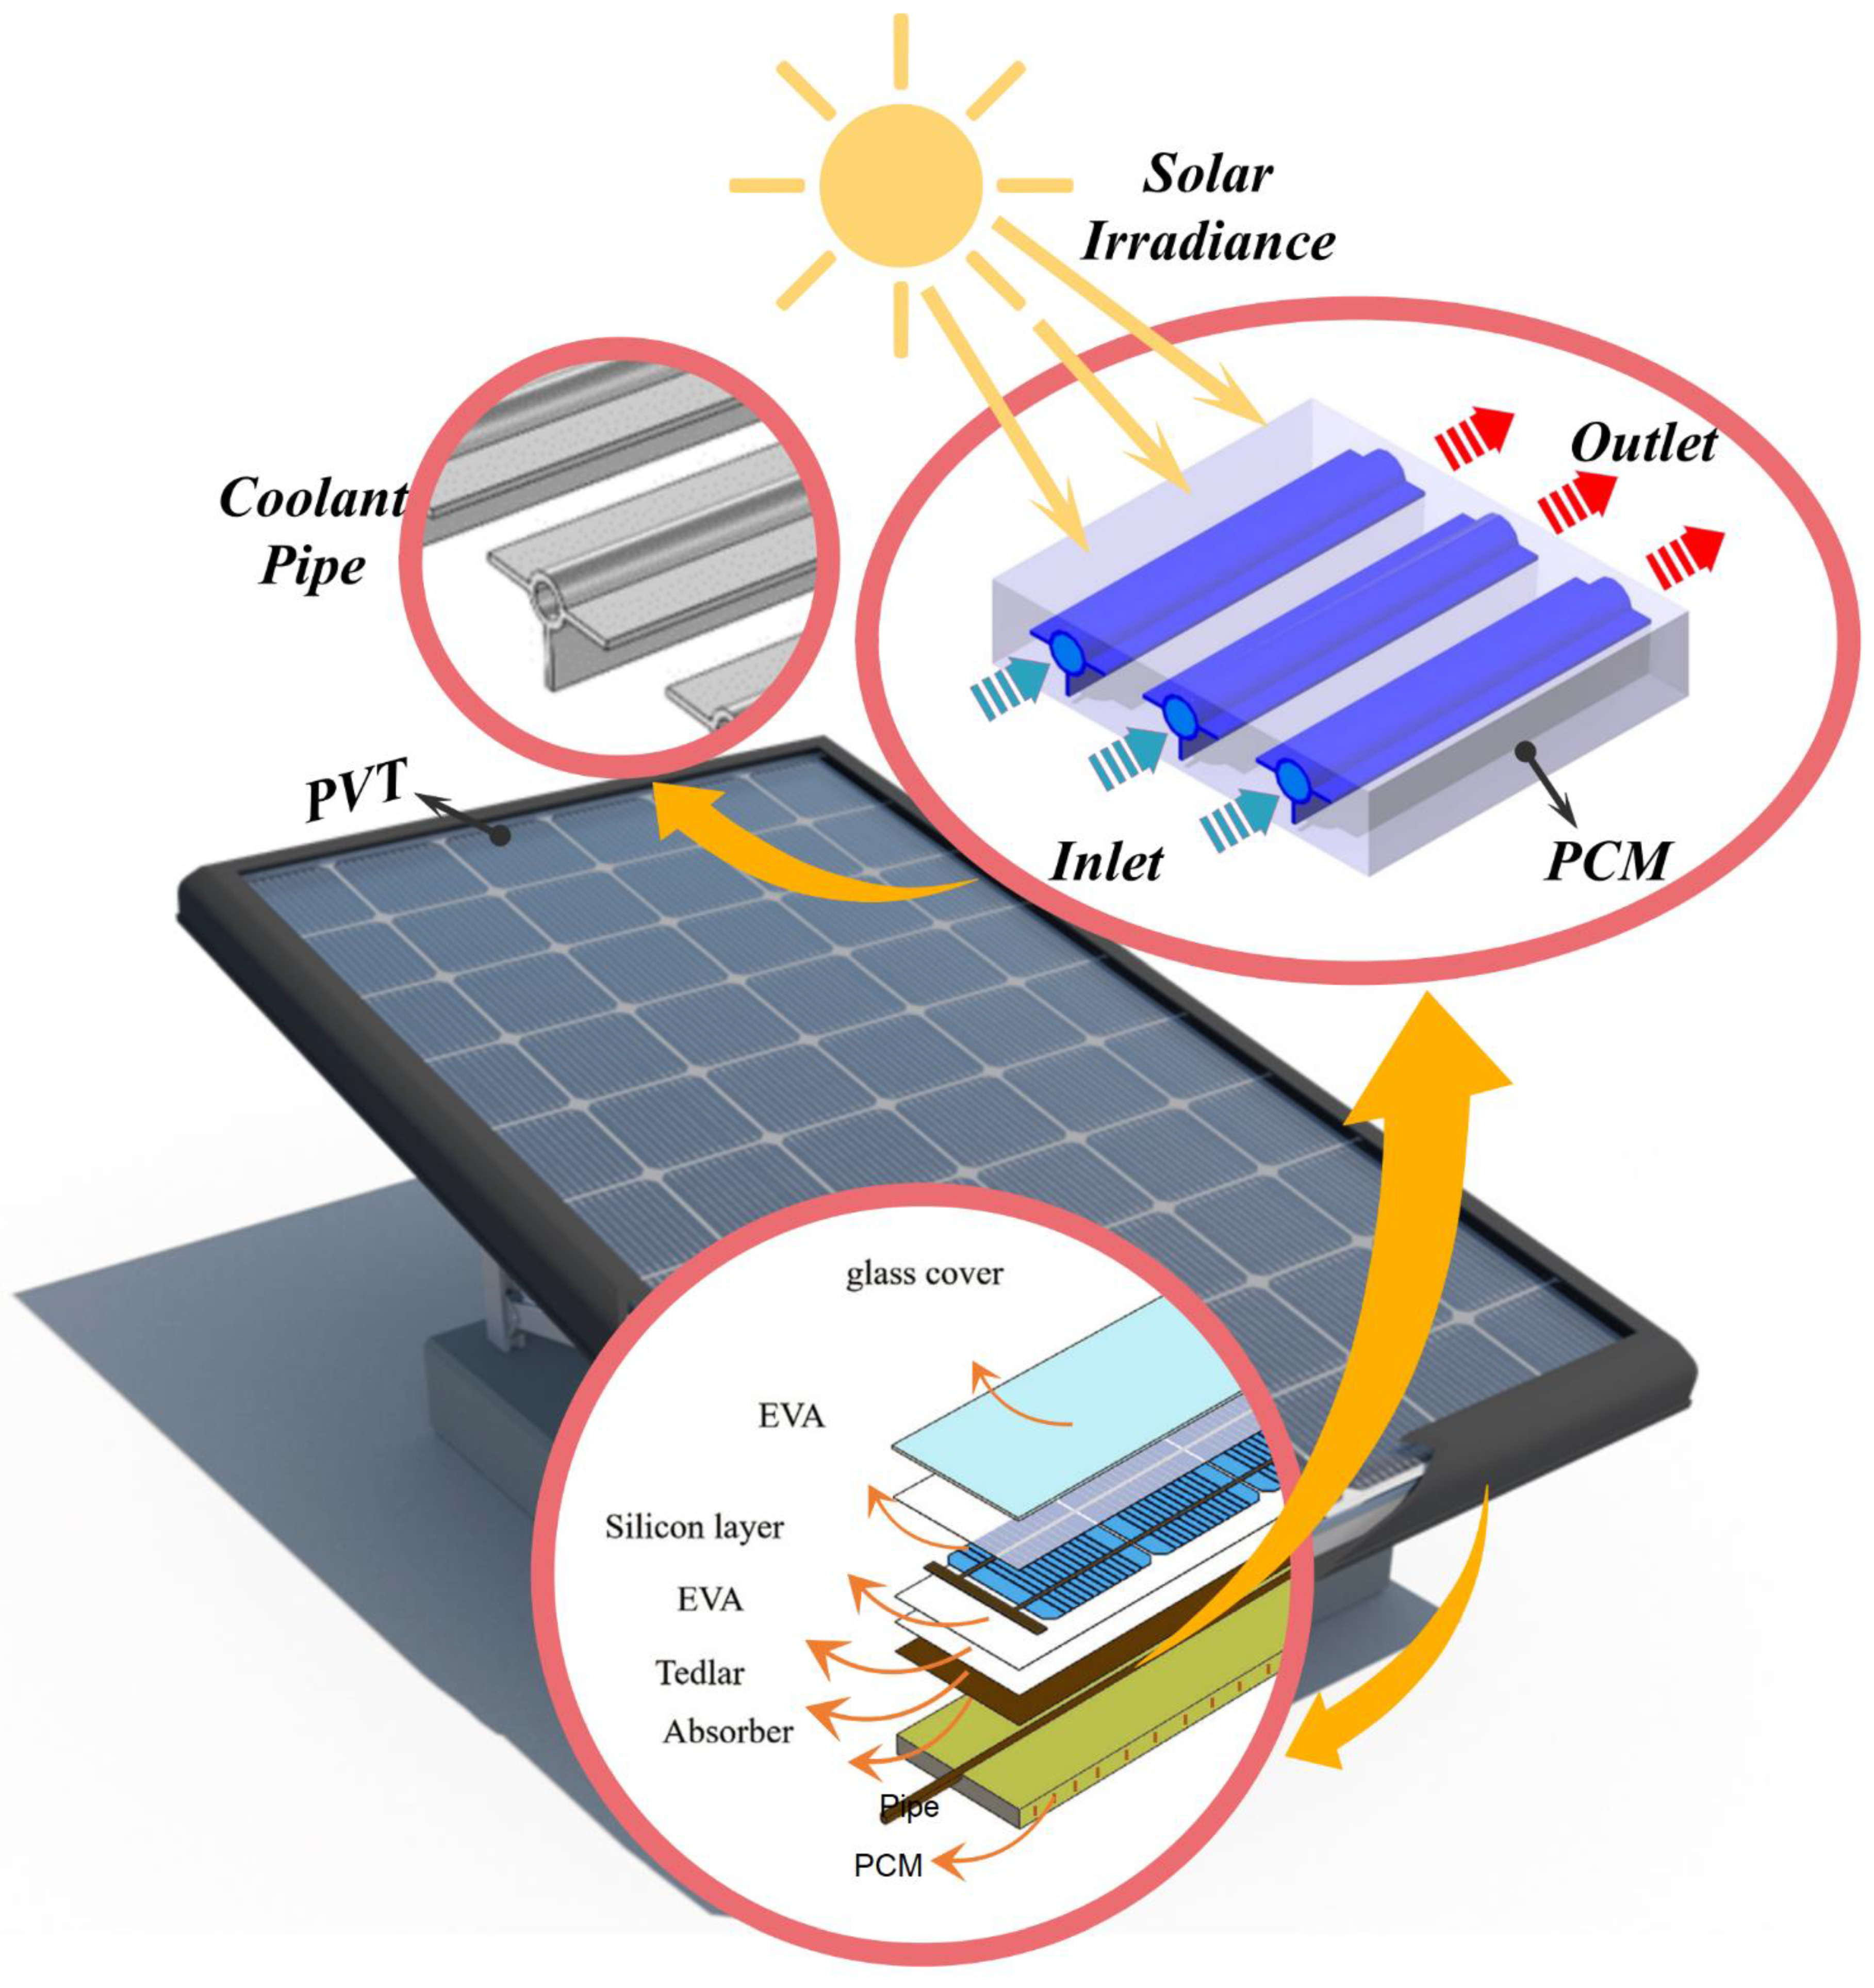
2. Problem Statement

The system consisted of a solar panel with a size of 54 × 67 cm, under which a PCM of the same size was employed. Three pipes with a laminar NFD flow at a velocity of 1 mm/s were used within the PCM. Three straight rectangular copper fins were used on the pipes. As mentioned, the eco-friendly NPs were fabricated using tea leaf extracts. The D_Pipe varied from 4 to 8 mm. The solar panel received a constant 850 W/m2 solar heat flow for 100 min. The system’s schematic is shown in Figure 1.

3. Governing Equations

3.1. NFD

The governing equations of an incompressible NFD for a two-phase mixture are written as follows [61]:
Conservation of mass
. ( ρ m v m ) = 0
Conservation of momentum
. ( ρ m v m . v m ) = P m + . ( μ m v m ) + . ( k = 1 n φ k ρ k v d r , k v d r , k )
Conservation of energy
. ( k = 1 n φ k ρ k c p , k v k T ) = . ( k m T )
where v and P denote the velocity and pressure, respectively. Furthermore, ρ is the density, μ is the viscosity, T is the temperature, k is the conductivity, c p is the specific heat capacity, and subscription m represents the mixture. The average mixture velocity, density, viscosity, and volume fraction are given by the following:
v m = k = 1 n φ k ρ k v k ρ m
ρ m = k = 1 n φ k ρ k
μ m = k = 1 n φ k μ k
. ( φ p ρ p v m ) = . ( φ p ρ p v d r , p )  
The drift velocity of eco-friendly NPs is written as follows:
v d r , k = v p f i = 1 n φ k ρ k ρ m v f k
The slip velocity is defined as follows:
v p f = v p v f
v p f = ρ p d p 2 ( ρ p ρ m ) 18 μ f f drag ρ p a
f drag = [ 1 + 0.15 R e p 0.687 ,   R e p 1000                 0.0183 R e p 0.687 ,   R e p > 1000
where p and f refer to eco-friendly NPs and the base fluid, respectively. The gravitational acceleration is defined as follows:
a = g ( v m . ) v m
Table 1 reports the basic properties of the base fluid and eco-friendly NPs.

3.2. PCM

The governing equations of the PCM are written as follows:
ρ t + ( ρ U ) = 0
t ( ρ U ) + ( ρ U U ) = p + ρ g + τ ¯ ¯ + F
( ρ H ) t + ( ρ U   H ) = ( K H ) + S
The function β is defined as follows [62]:
β k = { β = O                                       i f                                   T < T s o l i d u s                 β = 1                                       i f               T > T L i q u i d u s β = T T s o l i d u s T L i q u i d u s   T s o l i d u s                                   i f                         T L i q u i d u s < T < T s o l i d u s  
The β-function represents the phase change of the PCM [62]. The specific heat capacity of the system is obtained as follows:
C P ( S y s t e m ) = C P ( n p c m ) + L × D ( T )
Paraffin wax was used as the PCM with a conductivity of 0.365 W/m.K, a latent heat of 202.1 J/g, and a melting point of 27.7 °C [63].

4. Numerical Method, Grid Study, and Validation

By discretizing the equations, the finite element approach was used to address the PCM melting and NFD flow problems [64]. The two-phase mixing technique was utilized to simulate the flow. The enthalpy method was used to resolve the PCM melt front. The optimal conditions for having a panel with the lowest temperature and having a NFD at the output with the highest temperature and the lowest pressure drop in the solar system were investigated using machine learning in order to more thoroughly examine the effect of parameters on the outputs. Design Expert software was used for this purpose. The domain was meshed using hexagonal pieces, as shown in Figure 2.
Finer meshes were used in areas with larger temperature gradients. The sensitivity of the output to the number of meshes was analyzed. Table 2 shows the output flow temperature at different numbers of meshes and for a D_Pipe of 6 mm. The ideal grid for the simulations was chosen, which has a total of 1,145,000 components.
The proposed model was validated by simulating the NFD flow through a helical pipe [65]. Two-phase NFD mixture maximization was employed. Table 3 compares the enhancement of the HTR coefficient by the proposed method and that by the method of Bizhaem and Abbasi (65) for a D_Pipe of 50 and three volume fractions at Reynolds numbers of 200 and 500.

5. Results and Discussion

The effect of a change in the diameter of the tube, ranging from 4 to 8 mm, on the temperature of the panel and changes in the volume fraction of a PCM within 100 min are examined in this section. In all cases, the value of the NFD flow rate at the inlet is constant and the number of fins is three. Additionally, the temperature of the NFD at the inlet is considered to be constant. It is noteworthy that the NFD flow in the tubes improves HTR due to the higher thermal conductivity of NFDs compared to normal fluids. Since it has been proven by many researchers, changes in the volume percentage of NPs are not considered in the present work and the volume percentage of NPs is assumed to be 1%.
Figure 3 shows the temperature contour in a vertical cross section of the middle portion of the panel at t = 30, 60, and 90 min for D_Pipes of 4, 6, and 8 mm. In general, the temperature of the panel somewhat increased over time, particularly for a diameter of 4 mm. Due to the poor NFD flow in pipes with a diameter of 4 mm, the PCM melted within a short time, with the temperatures of both the PCM and panel rising at the same time. An increase in the D_Pipe to 8 mm better controlled the temperature of the panel and reduced the temperature increase; the colder part of the pipe covered a larger area of the PCM, and the top of the pipe and the solar panel had higher temperatures. The PCM temperature was controlled thanks to the higher flow rate via the 8 mm pipe, with a greater percentage of the PCM staying un melted.
For widths of 4, 6, and 8 mm throughout the course of 100 min, Figure 4 shows the average panel temperature. The panel temperature with a fixed solar heat flux (irradiance) increased from t = 0 to t = 100 s, particularly during the first ten minutes. The temperature of the panel rose as a result of sun radiation. The panel temperature was lowered using the PCM and NFD flow. The highest and lowest panel temperatures occurred for pipe sizes of 4 and 8 mm, respectively. A smaller D_Pipe led to a higher panel temperature. Furthermore, the PCM was effective in panel temperature control, and it could control the temperature of the panel as long as it remained un-melted. The PCM also allows for providing hot water during periods when irradiance is poor.
The highest panel temperature for D Pipes of 4, 6, and 8 mm is shown in Figure 5 as a function of time. The D Pipe influenced the maximum panel temperature, and as the D Pipe increased, the maximum temperature fell. In particular, an increase in the diameter from 4 to 6 mm dramatically decreased the maximum temperature of the panel. The maximum panel temperature increased over time due to solar radiation exposure. The heat was stored in the form of latent heat in the PCM or discharged by the NFD so that the panel temperature would not increase. The maximum panel temperature was very high for a D_Pipe of 4 mm due to the poor NFD flow and faster PCM melting. For a diameter of 8 mm, however, the stronger flow and un-melted PCM kept the maximum panel flow low for a longer time. The fluid flow under the solar panel was used to reduce its temperature. The HTR between the fluid flow and the panel caused the temperature of the panel to decrease and the temperature of the fluid to increase. A fluid with a greater thermal conductivity might increase the amount of heat it transfers to the panel. Therefore, a NFD was utilized instead of normal fluids to improve HTR and to ultimately reduce the panel temperature.
Figure 6 shows the velocity profile for pipes with diameters of 4, 6, and 8 mm in a horizontal cross section of the center of a panel. An underdeveloped flow regime was present at the pipe wall when the NFD entered the channel at a constant speed. However, the flow profile developed within a short distance. For a larger diameter, due to the larger pipe cross-sectional area and fixed input velocity, the NFD flowed through the pipe at a greater rate and absorbed and discharged more heat. However, for smaller D_Pipes, the fluid had fewer collisions with the wall in the middle of the pipe, leading to a lower output temperature.
Figure 7 displays the temperature contours for D Pipes of 4, 6, and 8 mm for the horizontal cross section of the middle area of the panel. The cold NFD flowed into the pipe at a constant temperature and experienced an increase in temperature through the pipe due to collisions with the pipe wall. The pipe absorbed heat from the surrounding PCM. The PCM underwent a temperature increase upon contact with the solar panel under solar irradiation. The PCM temperature was low until it began melting, increasing the pipe temperature. Hence, the output temperature was higher for a diameter of 4 mm than for 6 and 8 mm. Furthermore, for a diameter of 8 mm, the flow had a high velocity and fewer collisions with the pipe wall in the middle of the pipe. Thus, the flow temperature remained low in more of the pipe since the heat would take longer to reach the middle of the pipe.
Figure 8 depicts the output flow temperature for D_Pipes of 4, 6, and 8 over time. The output temperature is a critical parameter for electrical efficiency improvement. It is dependent on the panel temperature, and a higher panel temperature leads to a higher output temperature. Given the constant solar heat flux on the solar panel, the output temperature was higher for lower D_Pipes. At larger flow rates, the flow had fewer collisions with the pipe wall in the middle of the pipe, resulting in less HTR to the NFD. Furthermore, for smaller D_Pipes, the PCM melted within a shorter time and the flow collided with the PCM at a higher temperature, increasing the flow temperature. As a result, the output temperature was higher for lower D_Pipes, and the temperature of the NFD continued to increase for a longer time.
Figure 9 plots the HTR coefficient for pipes with diameters of 4, 6, and 8 mm over time. HTR between the pipe and PCM was found to be strongly dependent on the diameter, and an increase in the D_Pipe decreased the HTR coefficient. The HTR coefficient between the pipe and PCM changes incrementally for a longer time and was smaller for larger D_Pipes. A change in the PCM temperature substantially influenced the amount of HTR; an increase in the PCM temperature increased the temperature difference between the pipe and PCM, increasing the amount of HTR. In addition, the increased diameter enlarged the HTR surface area. As can be seen, the increased surface area reduced the overall HTR coefficient due to the integration of local HTR coefficients, and the HTR coefficient experienced a smaller increase with the increase in diameter due to the larger surface areas. Furthermore, the rapid melting and, therefore, temperature increase in the PCM increased the amount of HTR between the PCM and pipe. For a D_Pipe of 4 mm, the PCM melted and experienced an increased temperature within a shorter time, leading to a larger HTR coefficient.
Figure 10 illustrates the PCM melting contour of the horizontal cross section of the middle portion of the panel for piper diameters of 4, 6, and 8 mm. As can be seen, D_Pipe had a strong effect on PCM melting; an increase in the diameter reduced the melted PCM fraction. For a diameter of 4 mm, the PCM melted entirely in 10 min. Only a very tiny proportion of the PCM remained un melted for a diameter of 6 mm, particularly in the area of the center pipe and its fins. For a diameter of 8 mm, on the other hand, the PCM remained un-melted, except for some areas under the panel and areas heated by solar radiation. The increased flow rate for a diameter of 8 mm increased the amount of HTR from the solar panel to the flow, leading to lower heat absorption into the PCM and melt fraction. Hence, a larger fraction of the PCM remained un-melted for a D_Pipe of 8 mm.
Figure 11 depicts the PCM melting contour for the middle portion of panels with pipes with diameters of 4, 6, and 8 mm. D_Pipe had a significant effect on the PCM melting time. The PCM melted entirely for a diameter of 4 mm, with the phase change process being completed. A significant portion of the PCM melted for a D Pipe of 6 mm, and the PCM only remained solid around the central pipe. For a diameter of 8 mm, however, the PCM remained mostly un-melted; it melted only in areas where the panel was exposed to solar radiation. The dependence of the melted PCM fraction on the diameter is explained by the flow rate; the flow rate was greater for larger D_Pipes, improving HTR from the panel to the NFD.
The melted PCM volume % for D Pipes of 4, 6, and 8 mm is shown with time in Figure 12. Solar radiation increases the panel temperature, reducing its electrical efficiency. The PCM and NFD flow were exploited under the panel to reduce its temperature and to enhance its electrical efficiency. A significant portion of the PCM melted quickly since there wasn’t much of it used. A large NFD flow rate could discharge a significant portion of the heat from the solar panel. However, the heat would remain in the panel at poor flow rates. For a D_Pipe of 8 mm, the flow rate through the pipe was larger, discharging a greater amount of heat. For diameters of 4 and 6 mm, however, the flow discharged only a small portion of the heat, with a major portion of the heat remaining in the solar panel and increasing the panel temperature. The solid PCM absorbs the heat from the panel, melts into a liquid-like form, and begins to increase in temperature once it has completely melted. For a diameter of 8 mm, however, the melted PCM volume fraction never exceeded 50% due to the strong NFD flow through the pipe. Finally, with the investigations conducted using an artificial intelligence method, it was seen that the best conditions for the solar system to have the lowest panel temperature, the highest NFD output temperature, and the lowest pressure drop in the pipes were a 8 mm pipe diameter and a 350 Reynolds number.

6. Conclusions

This paper evaluated the temperature control of a solar panel using NFD flow and PCM. Eco-friendly NPs fabricated from tea leaf extracts were employed to develop the NFD. A two-phase mixture was adopted to simulate the NFD flow, while the PCM melt front was simulated using the enthalpy method. The PCM made use of a number of pipes with straight fins. Over the course of 100 min, the system was examined for D Pipes of 4, 6, and 8 mm. The application of an eco-friendly NFD and a PCM simultaneously in the solar panel and the evaluation of this system by changing the tube diameter are the novelties of the present work. The results can be summarized as follows:
(1)
The maximum and average panel temperatures dramatically increased from t = 0 to t = 10 min and then increased at a large or small rate, depending on the diameter.
(2)
An increase in the diameter, particularly from 4 to 6 mm, reduced the maximum and average panel temperatures. However, the increased diameter raised the melted PCM volume fraction.
(3)
An increase in D_Pipe reduced the output flow temperature and the amount of HTR between the pipes and PCM.
(4)
The output temperature and the amount of HTR between the pipe and PCM were found to be dependent on time and increased over time depending on D_Pipe.
(5)
The panel had significantly lower temperatures in areas in contact with the pipes than in the other areas.
Finally, suggestions for future works are presented based on the present simulations:
  • This study can be performed for a different number of fins and for various fin shapes at different flow rates.
  • The effect of using different PCMs and different NFDs on the outputs should be examined.
  • The influence of using a PV-thermal panel during the night should also be evaluated in the absence of radiation.
  • The impact of radiation changes on the outputs should be investigated at different hours of the day.

Author Contributions

Data curation, J.M.; Investigation, J.M.; Methodology, F.A.A. and M.A.A.; Project administration, M.A.A. and M.S.; Resources, G.C.; Writing—original draft, S.A.; Writing—review & editing, M.S. and G.C. All authors have read and agreed to the published version of the manuscript.

Funding

The authors are thankful to the Deanship of Scientific Research at Najran University for funding this work under the Research Groups Funding program grant code (NU/RG/SERC/11/9).

Data Availability Statement

Not applicable.

Conflicts of Interest

The authors declare no conflict of interest.

References

  1. Vahidinia, F.; Khorasanizadeh, H.; Aghaei, A. Comparative energy, exergy and CO2 emission evaluations of a LS-2 parabolic trough solar collector using Al2O3/SiO2-Syltherm 800 hybrid nanofluid. Energy Convers. Manag. 2021, 245, 114596. [Google Scholar] [CrossRef]
  2. Zaman, Q.; Wang, Z.; Zaman, S.; Rasool, S.F. Investigating the nexus between education expenditure, female employers, renewable energy consumption and CO2 emission: Evidence from China. J. Clean. Prod. 2021, 312, 127824. [Google Scholar] [CrossRef]
  3. Ali, Q.A.; Khayyam, U.; Nazar, U. Energy production and CO2 emissions: The case of coal fired power plants under China Pakistan economic corridor. J. Clean. Prod. 2021, 281, 124974. [Google Scholar] [CrossRef]
  4. Guo, Z.; Yang, J.; Tan, Z.; Tian, X.; Wang, Q. Numerical study on gravity-driven granular flow around tube out-wall: Effect of tube inclination on the heat transfer. Int. J. Heat Mass Transf. 2021, 174, 121296. [Google Scholar] [CrossRef]
  5. Paradis, P.-L.; Rousse, D.R.; Lamarche, L.; Nesreddine, H. A hybrid PV/T solar evaporator using CO2: Numerical heat transfer model and simulation results. Sol. Energy 2018, 170, 1118–1129. [Google Scholar] [CrossRef]
  6. Zhang, X.; Tang, Y.; Zhang, F.; Lee, C.-S. A Novel Aluminum–Graphite Dual-Ion Battery. Adv. Energy Mater. 2016, 6, 1502588. [Google Scholar] [CrossRef] [Green Version]
  7. Yang, L.; Dai, Q.; Liu, L.; Shao, D.; Luo, K.; Jamil, S. Rapid sintering method for highly conductive Li7La3Zr2O12 ceramic electrolyte. Ceram. Int. 2020, 46, 10917–10924. [Google Scholar] [CrossRef]
  8. Xu, Y.; Chen, X.; Zhang, H.; Yang, F.; Tong, L.; Yang, Y. Online identification of battery model parameters and joint state of charge and state of health estimation using dual particle filter algorithms. Int. J. Energy Res. 2022, 46, 19615–19652. [Google Scholar] [CrossRef]
  9. Li, L.; Zhang, D.; Deng, J.; Gou, Y.; Fang, J.; Cui, H. Carbon-based materials for fast charging lithium-ion batteries. Carbon 2021, 183, 721–734. [Google Scholar] [CrossRef]
  10. Said, Z.; Ghodbane, M.; Tiwari, A.K.; Ali, H.M.; Boumeddane, B.; Ali, Z.M. 4E (Energy, Exergy, Economic, and Environment) examination of a small LFR solar water heater: An experimental and numerical study. Case Stud. Therm. Eng. 2021, 27, 101277. [Google Scholar] [CrossRef]
  11. Usman, M.; Ali, M.; Rashid Tu Ali, H.M.; Frey, G. Towards zero energy solar households—A model-based simulation and optimization analysis for a humid subtropical climate. Sustain. Energy Technol. Assess. 2021, 48, 101574. [Google Scholar] [CrossRef]
  12. Huang, K.; Su, B.; Li, T.; Ke, H.; Lin, M.; Wang, Q. Numerical simulation of the mixing behaviour of hot and cold fluids in the rectangular T-junction with/without an impeller. Appl. Therm. Eng. 2022, 204, 117942. [Google Scholar] [CrossRef]
  13. Yang, J.; Liu, H.; Ma, K.; Yang, B.; Guerrero, J.M. An Optimization Strategy of Price and Conversion Factor Considering the Coupling of Electricity and Gas Based on Three-Stage Game. IEEE Trans. Autom. Sci. Eng. 2022, 1, 1–14. [Google Scholar] [CrossRef]
  14. Yang, M.; Li, C.; Zhang, Y.; Wang, Y.; Li, B.; Jia, D. Research on microscale skull grinding temperature field under different cooling conditions. Appl. Therm. Eng. 2017, 126, 525–537. [Google Scholar] [CrossRef]
  15. Zhang, G.; Zhang, Z.; Sun, M.; Yu, Y.; Wang, J.; Cai, S. The Influence of the Temperature on the Dynamic Behaviors of Magnetorheological Gel. Adv. Eng. Mater. 2022, 24, 2101680. [Google Scholar] [CrossRef]
  16. Alqaed, S.; Mustafa, J.; Sharifpur, M.; Cheragain, G. Using nanoparticles in solar collector to enhance solar-assisted hot process stream usefulness. Sustain. Energy Technol. Assess. 2022, 52, 101992. [Google Scholar] [CrossRef]
  17. Aghakhani, S.; Afrand, M.; Karimipour, A.; Kalbasi, R.; Mehdi Razzaghi, M. Numerical and experimental study of thermal efficiency of a spiral flat plate solar collector by changing the spiral diameter, flow rate, and pipe diameter. Sustain. Energy Technol. Assess. 2022, 53, 102353. [Google Scholar] [CrossRef]
  18. Bhatti, M.M.; Öztop, H.F.; Ellahi, R.; Sarris, I.E.; Doranehgard, M.H. Insight into the investigation of diamond (C) and Silica (SiO2) nanoparticles suspended in water-based hybrid nanofluid with application in solar collector. J. Mol. Liq. 2022, 357, 119134. [Google Scholar] [CrossRef]
  19. Aghakhani, S.; Afrand, M. Experimental study of the effect of simultaneous application of the air- and water-cooled flow on efficiency in a Photovoltaic thermal solar collector with porous plates. Appl. Therm. Eng. 2022, 217, 119161. [Google Scholar] [CrossRef]
  20. Tian, M.-W.; Khetib, Y.; Yan, S.-R.; Rawa, M.; Sharifpur, M.; Cheraghian, G. Energy, exergy and economics study of a solar/thermal panel cooled by nanofluid. Case Stud. Therm. Eng. 2021, 28, 101481. [Google Scholar] [CrossRef]
  21. Ejaz, A.; Babar, H.; Ali, H.M.; Jamil, F.; Janjua, M.M.; Fattah, I.M.R. Concentrated photovoltaics as light harvesters: Outlook, recent progress, and challenges. Sustain. Energy Technol. Assess. 2021, 46, 101199. [Google Scholar] [CrossRef]
  22. Navakrishnan, S.; Vengadesan, E.; Senthil, R.; Dhanalakshmi, S. An experimental study on simultaneous electricity and heat production from solar PV with thermal energy storage. Energy Convers. Manag. 2021, 245, 114614. [Google Scholar] [CrossRef]
  23. Khodadadi, M.; Ali Farshad, S.; Ebrahimpour, Z.; Sheikholeslami, M. Thermal performance of nanofluid with employing of NEPCM in a PVT-LFR system. Sustain. Energy Technol. Assess. 2021, 47, 101340. [Google Scholar] [CrossRef]
  24. Aghakhani, S.; Afrand, M.; Karimipour, A.; Kalbasi, R.; Mehdi Razzaghi, M. Numerical study of the cooling effect of a PVT on its thermal and electrical efficiency using a Cu tube of different diameters and lengths. Sustain. Energy Technol. Assess. 2022, 52, 102044. [Google Scholar] [CrossRef]
  25. Ali, H.M. Recent advancements in PV cooling and efficiency enhancement integrating phase change materials based systems—A comprehensive review. Sol. Energy 2020, 197, 163–198. [Google Scholar] [CrossRef]
  26. Kılkış, B. Development of a composite PVT panel with PCM embodiment, TEG modules, flat-plate solar collector, and thermally pulsing heat pipes. Sol. Energy 2020, 200, 89–107. [Google Scholar] [CrossRef]
  27. Kazemian, A.; Taheri, A.; Sardarabadi, A.; Ma, T.; Passandideh-Fard, M.; Peng, J. Energy, exergy and environmental analysis of glazed and unglazed PVT system integrated with phase change material: An experimental approach. Sol. Energy 2020, 201, 178–189. [Google Scholar] [CrossRef]
  28. Kazem, H.A.; Al-Waeli, A.H.A.; Chaichan, M.T.; Al-Waeli, K.H.; Al-Aasam, A.B.; Sopian, K. Evaluation and comparison of different flow configurations PVT systems in Oman: A numerical and experimental investigation. Sol. Energy 2020, 208, 58–88. [Google Scholar] [CrossRef]
  29. Hissouf, M.; Feddaoui Mb Najim, M.; Charef, A. Numerical study of a covered Photovoltaic-Thermal Collector (PVT) enhancement using nanofluids. Sol. Energy 2020, 199, 115–127. [Google Scholar] [CrossRef]
  30. Aberoumand, S.; Ghamari, S.; Shabani, B. Energy and exergy analysis of a photovoltaic thermal (PV/T) system using nanofluids: An experimental study. Sol. Energy 2018, 165, 167–177. [Google Scholar] [CrossRef]
  31. Gupta, V.S.; Singh, D.B.; Mishra, R.K.; Sharma, S.K.; Tiwari, G.N. Development of characteristic equations for PVT-CPC active solar distillation system. Desalination 2018, 445, 266–279. [Google Scholar] [CrossRef]
  32. Fan, W.; Kokogiannakis, G.; Ma, Z. A multi-objective design optimisation strategy for hybrid photovoltaic thermal collector (PVT)-solar air heater (SAH) systems with fins. Sol. Energy 2018, 163, 315–328. [Google Scholar] [CrossRef]
  33. Saini, V.; Tripathi, R.; Tiwari, G.N.; Al-Helal, I.M. Electrical and thermal energy assessment of series connected N partially covered photovoltaic thermal (PVT)-compound parabolic concentrator (CPC) collector for different solar cell materials. Appl. Therm. Eng. 2018, 128, 1611–1623. [Google Scholar] [CrossRef]
  34. Herrando, M.; Ramos, A.; Freeman, J.; Zabalza, I.; Markides, C.N. Technoeconomic modelling and optimisation of solar combined heat and power systems based on flat-box PVT collectors for domestic applications. Energy Convers. Manag. 2018, 175, 67–85. [Google Scholar] [CrossRef]
  35. Moradgholi, M.; Nowee, S.M.; Abrishamchi, I. Application of heat pipe in an experimental investigation on a novel photovoltaic/thermal (PV/T) system. Sol. Energy 2014, 107, 82–88. [Google Scholar] [CrossRef]
  36. Nižetić, S.; Čoko, D.; Yadav, A.; Grubišić-Čabo, F. Water spray cooling technique applied on a photovoltaic panel: The performance response. Energy Convers. Manag. 2016, 108, 287–296. [Google Scholar] [CrossRef]
  37. Izadi, M.; El Haj Assad, M. Chapter 15—Use of nanofluids in solar energy systems. In Design and Performance Optimization of Renewable Energy Systems; Assad, M.E.H., Rosen, M.A., Eds.; Academic Press: Cambridge, MA, USA, 2021; pp. 221–250. [Google Scholar]
  38. El Haj Assad, M.; Alhuyi Nazari, M. Chapter 3—Heat exchangers and nanofluids. In Design and Performance Optimization of Renewable Energy Systems; Assad, M.E.H., Rosen, M.A., Eds.; Academic Press: Cambridge, MA, USA, 2021; pp. 33–42. [Google Scholar]
  39. Mustafa, J.; Alqaed, S.; Kalbasi, R. Challenging of using CuO nanoparticles in a flat plate solar collector- Energy saving in a solar-assisted hot process stream. J. Taiwan Inst. Chem. Eng. 2021, 124, 258–265. [Google Scholar] [CrossRef]
  40. Xiong, Q.; Altnji, S.; Tayebi, T.; Izadi, M.; Hajjar, A.; Sundén, B. A comprehensive review on the application of hybrid nanofluids in solar energy collectors. Sustain. Energy Technol. Assess. 2021, 47, 101341. [Google Scholar] [CrossRef]
  41. Cui, X.; Li, C.; Zhang, Y.; Said, Z.; Debnath, S.; Sharma, S. Grindability of titanium alloy using cryogenic nanolubricant minimum quantity lubrication. J. Manuf. Process. 2022, 80, 273–286. [Google Scholar] [CrossRef]
  42. Soltani, S.; Kasaeian, A.; Sarrafha, H.; Wen, D. An experimental investigation of a hybrid photovoltaic/thermoelectric system with nanofluid application. Sol. Energy 2017, 155, 1033–1043. [Google Scholar] [CrossRef]
  43. Kaloudis, E.; Papanicolaou, E.; Belessiotis, V. Numerical simulations of a parabolic trough solar collector with nanofluid using a two-phase model. Renew. Energy 2016, 97, 218–229. [Google Scholar] [CrossRef]
  44. Hassani, S.; Saidur, R.; Mekhilef, S.; Taylor, R.A. Environmental and exergy benefit of nanofluid-based hybrid PV/T systems. Energy Convers. Manag. 2016, 123, 431–444. [Google Scholar] [CrossRef]
  45. Li, Q.; Cai, X.; Liu, T.; Jia, M.; Wu, Q.; Zhou, H. Gate-tuned graphene meta-devices for dynamically controlling terahertz wavefronts. Nanophotonics 2022, 11, 2085–2096. [Google Scholar] [CrossRef]
  46. Wang, X.; Li, C.; Zhang, Y.; Ali, H.M.; Sharma, S.; Li, R. Tribology of enhanced turning using biolubricants: A comparative assessment. Tribol. Int. 2022, 174, 107766. [Google Scholar] [CrossRef]
  47. Jin, J.; Jing, D. A novel liquid optical filter based on magnetic electrolyte nanofluids for hybrid photovoltaic/thermal solar collector application. Sol. Energy 2017, 155, 51–61. [Google Scholar] [CrossRef]
  48. Chandrasekar, M.; Suresh, S.; Senthilkumar, T.; Ganesh Karthikeyan, M. Passive cooling of standalone flat PV module with cotton wick structures. Energy Convers. Manag. 2013, 71, 43–50. [Google Scholar] [CrossRef]
  49. Alqaed, S.; Mustafa, J.; Almehmadi, F.A. The effect of using phase change materials in a solar wall on the number of times of air conditioning per hour during day and night in different thicknesses of the solar wall. J. Build. Eng. 2022, 51, 104227. [Google Scholar] [CrossRef]
  50. Mustafa, J.; Alqaed, S.; Sharifpur, M. Incorporating nano-scale material in solar system to reduce domestic hot water energy demand. Sustain. Energy Technol. Assess. 2022, 49, 101735. [Google Scholar] [CrossRef]
  51. Mustafa, J.; Alqaed, S.; Almehmadi, F.A.; Jamil, B. Development and comparison of parametric models to predict global solar radiation: A case study for the southern region of Saudi Arabia. J. Therm. Anal. Calorim. 2022, 147, 9559–9589. [Google Scholar] [CrossRef]
  52. Mustafa, J.; Alqaed, S.; Sharifpur, M. Numerical study on performance of double-fluid parabolic trough solar collector occupied with hybrid non-Newtonian nanofluids: Investigation of effects of helical absorber tube using deep learning. Eng. Anal. Bound. Elem. 2022, 140, 562–580. [Google Scholar] [CrossRef]
  53. Pordanjani, A.H.; Aghakhani, S.; Afrand, M.; Sharifpur, M.; Meyer, J.P.; Xu, H. Nanofluids: Physical phenomena, applications in thermal systems and the environment effects—A critical review. J. Clean. Prod. 2021, 320, 128573. [Google Scholar] [CrossRef]
  54. Hajatzadeh Pordanjani, A.; Aghakhani, S.; Afrand, M.; Mahmoudi, B.; Mahian, O.; Wongwises, S. An updated review on application of nanofluids in heat exchangers for saving energy. Energy Convers. Manag. 2019, 198, 111886. [Google Scholar] [CrossRef]
  55. Jia, D.; Zhang, Y.; Li, C.; Yang, M.; Gao, T.; Said, Z. Lubrication-enhanced mechanisms of titanium alloy grinding using lecithin biolubricant. Tribol. Int. 2022, 169, 107461. [Google Scholar] [CrossRef]
  56. Yang, M.; Li, C.; Zhang, Y.; Jia, D.; Zhang, X.; Hou, Y. Maximum undeformed equivalent chip thickness for ductile-brittle transition of zirconia ceramics under different lubrication conditions. Int. J. Mach. Tools Manuf. 2017, 122, 55–65. [Google Scholar] [CrossRef]
  57. Cui, W.; Si, T.; Li, X.; Li, X.; Lu, L.; Ma, T. Heat transfer analysis of phase change material composited with metal foam-fin hybrid structure in inclination container by numerical simulation and artificial neural network. Energy Rep. 2022, 8, 10203–10218. [Google Scholar] [CrossRef]
  58. Cui, W.; Li, X.; Li, X.; Si, T.; Lu, L.; Ma, T. Thermal performance of modified melamine foam/graphene/paraffin wax composite phase change materials for solar-thermal energy conversion and storage. J. Clean. Prod. 2022, 367, 133031. [Google Scholar] [CrossRef]
  59. Aghakhani, S.; Ghaffarkhah, A.; Arjmand, M.; Karimi, N.; Afrand, M. Phase change materials: Agents towards energy performance improvement in inclined, vertical, and horizontal walls of residential buildings. J. Build. Eng. 2022, 56, 104656. [Google Scholar] [CrossRef]
  60. Kumar, R.; Ranjan, N.; Kumar, V.; Kumar, R.; Chohan, J.S.; Yadav, A. Characterization of Friction Stir-Welded Polylactic Acid/Aluminum Composite Primed through Fused Filament Fabrication. J. Mater. Eng. Perform. 2022, 31, 2391–2409. [Google Scholar] [CrossRef]
  61. Moraveji, M.K.; Ardehali, R.M. CFD modeling (comparing single and two-phase approaches) on thermal performance of Al2O3/water nanofluid in mini-channel heat sink. Int. Commun. Heat Mass Transf. 2013, 44, 157–164. [Google Scholar] [CrossRef]
  62. Arasu, A.V.; Mujumdar, A.S. Numerical study on melting of paraffin wax with Al2O3 in a square enclosure. Int. Commun. Heat Mass Transf. 2012, 39, 8–16. [Google Scholar] [CrossRef]
  63. Li, M. A nano-graphite/paraffin phase change material with high thermal conductivity. Appl. Energy 2013, 106, 25–30. [Google Scholar] [CrossRef]
  64. Zhang, G.; Chen, J.; Zhang, Z.; Sun, M.; Yu, Y.; Wang, J. Analysis of magnetorheological clutch with double cup-shaped gap excited by Halbach array based on finite element method and experiment. Smart Mater. Struct. 2022, 31, 075008. [Google Scholar] [CrossRef]
  65. Bizhaem, H.K.; Abbassi, A. Numerical study on heat transfer and entropy generation of developing laminar nanofluid flow in helical tube using two-phase mixture model. Adv. Powder Technol. 2017, 28, 2110–2125. [Google Scholar] [CrossRef]
Figure 1. Schematic of the system with PCM and NFD flow pipe.
Processes 10 02291 g001
Figure 2. Meshed domain with hexagonal elements.
Processes 10 02291 g002
Figure 3. The temperature profile for pipes with diameters of 4, 6, and 8 mm at time intervals of 30, 60, and 90 min.
Processes 10 02291 g003aProcesses 10 02291 g003b
Figure 4. The average panel temperature for diameters of 4, 6, and 8 mm for 100 min.
Processes 10 02291 g004
Figure 5. The maximum panel temperature for D_Pipes of 4, 6, and 8 mm over time.
Processes 10 02291 g005
Figure 6. The velocity contour of the horizontal cross section of the middle portion of the panel for D_Pipes of 4, 6, and 8 mm.
Processes 10 02291 g006aProcesses 10 02291 g006b
Figure 7. The temperature contours of the horizontal cross section of the middle portion of the panel for D_Pipes of 4, 6, and 8 mm.
Processes 10 02291 g007aProcesses 10 02291 g007b
Figure 8. The output flow temperature for D_Pipes of 4, 6, and 8 over time.
Processes 10 02291 g008
Figure 9. The HTR coefficient on the pipes with diameters of 4, 6, and 8 mm over time.
Processes 10 02291 g009
Figure 10. The PCM melting contour of the horizontal cross section of the middle portion of the panel for pipe diameters of 4, 6, and 8 mm.
Processes 10 02291 g010
Figure 11. The PCM melting contour for the middle portion of panels with pipes with diameters of 4, 6, and 8 mm.
Processes 10 02291 g011
Figure 12. The volume percentage of PCM that has melted for D Pipes that are 4, 6, and 8 mm in time.
Processes 10 02291 g012
Table 1. The basic properties of the base fluid and eco-friendly NPs [62].
c p   ( J / k g · K ) k   ( W / m · K ) μ   ( k g / m · s ) ρ   ( k g / m 3 )
EG2430.80.25320.01411088
Ag 235429-10,500
Water41790.6130.001997.1
Table 2. Output flow temperature for a D_Pipe of 6 mm.
Element Number911,0001,027,0001,145,0001,283,000
T-out300.41300.68300.80300.81
Table 3. Proposed model versus the method of Bizhaem and Abbasi [65].
φ 1%2%3%
Re = 200
Bizhaem and Abbassi (65)22.8629.1733.48
Present study22.1928.7832.89
Re = 500
Bizhaem and Abbassi (65)7.9313.9218.53
Present study7.5913.1218.09
Publisher’s Note: MDPI stays neutral with regard to jurisdictional claims in published maps and institutional affiliations.

