
Evolution of Gas-Liquid Two-Phase Flow in an M-Shaped Jumper and the Resultant Flow-Induced Vibration Response


Abstract
:1. Introduction
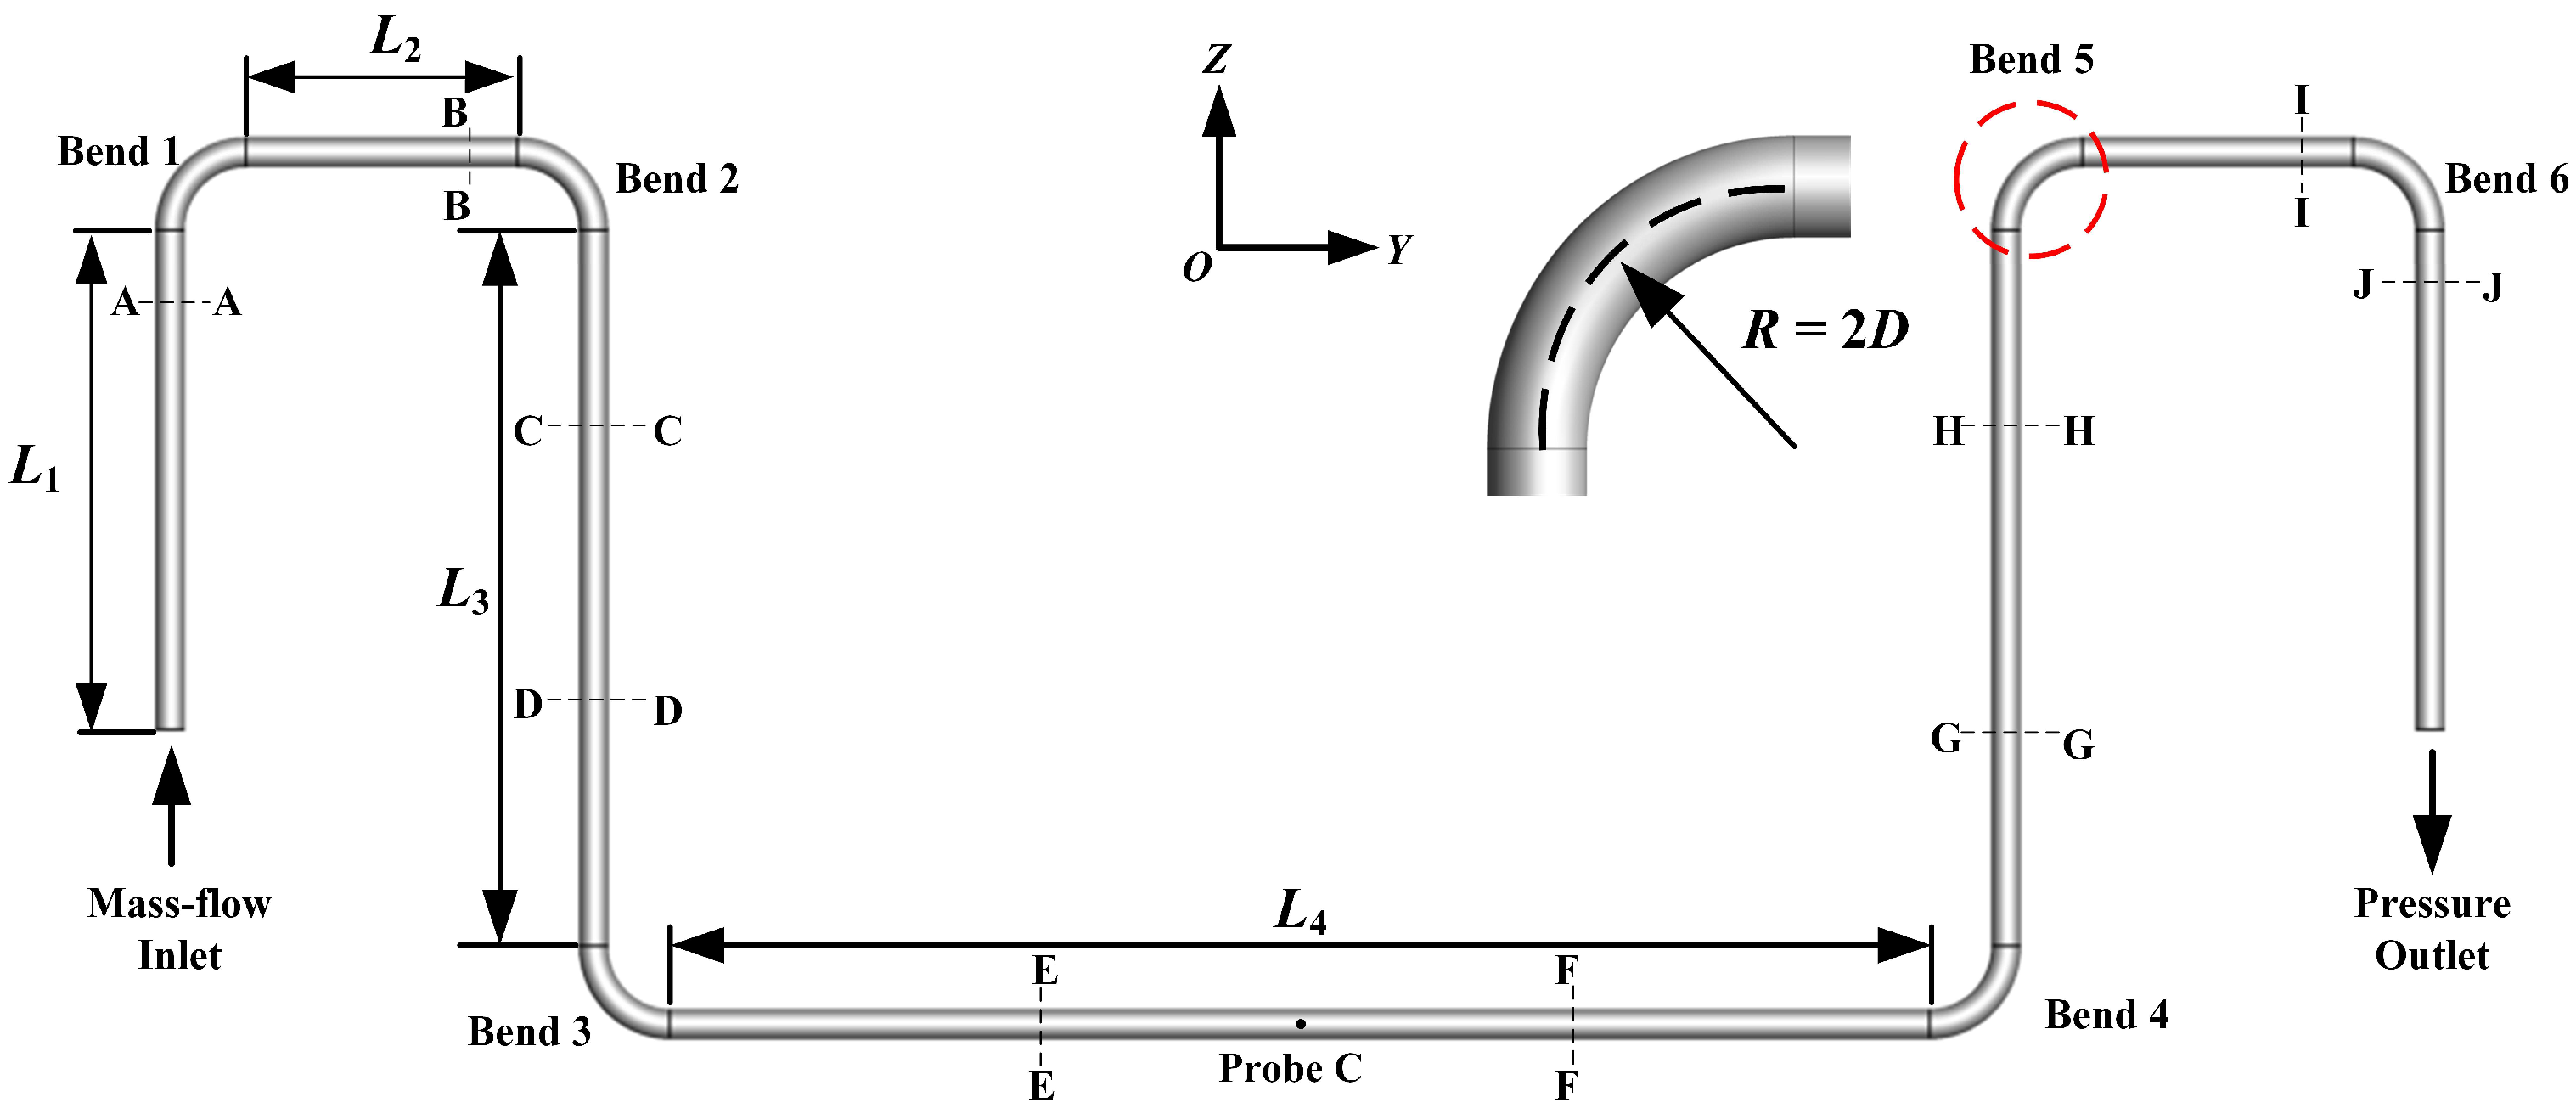
2. Problem Description
3. Mathematical Model
3.1. Governing Equations
3.2. Meshing and Dependence Check
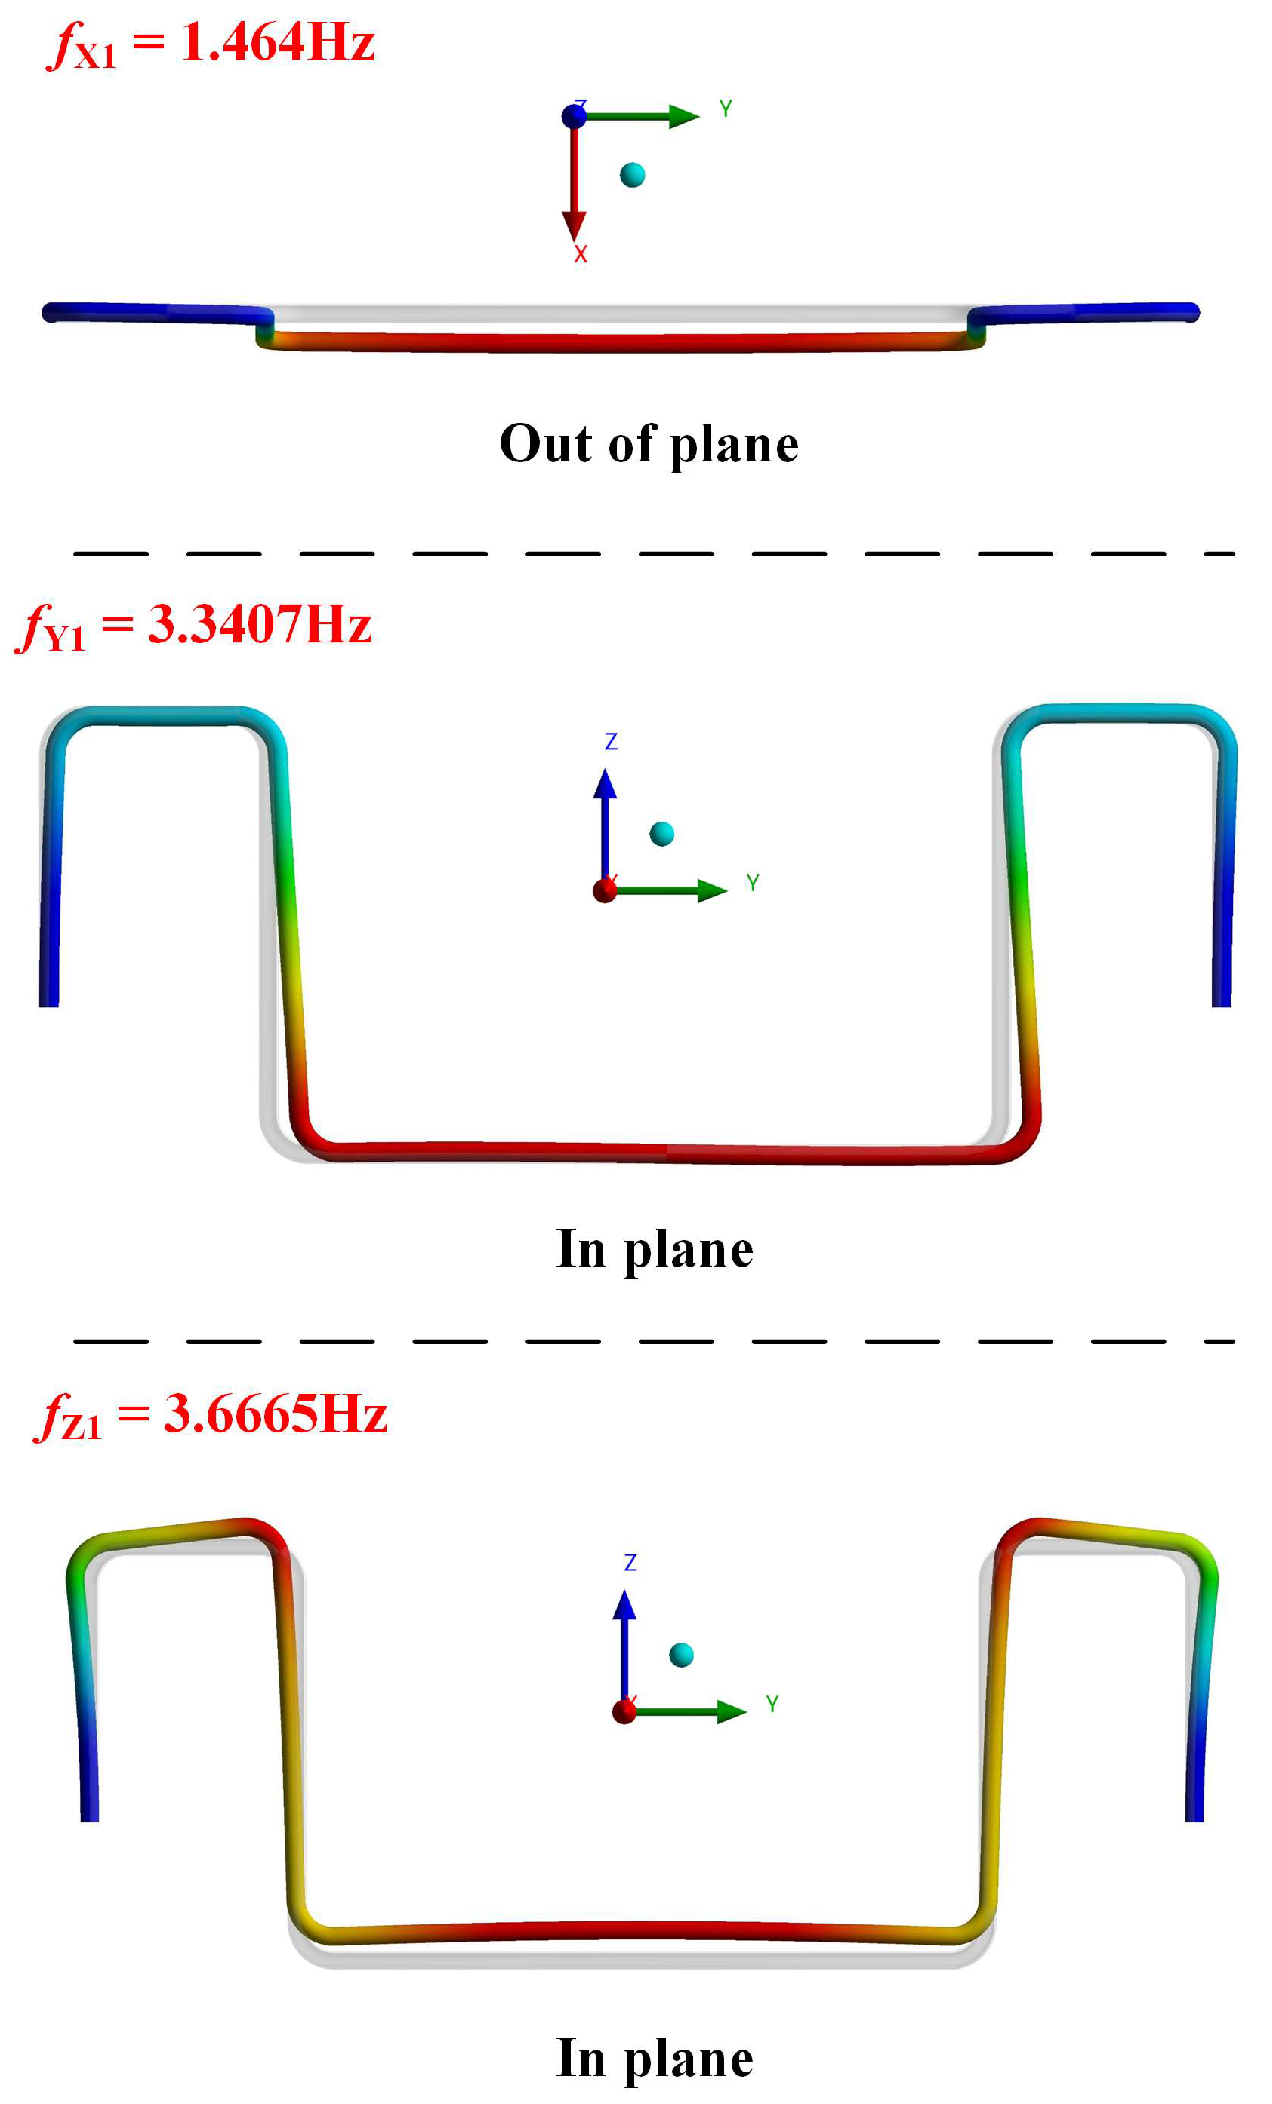
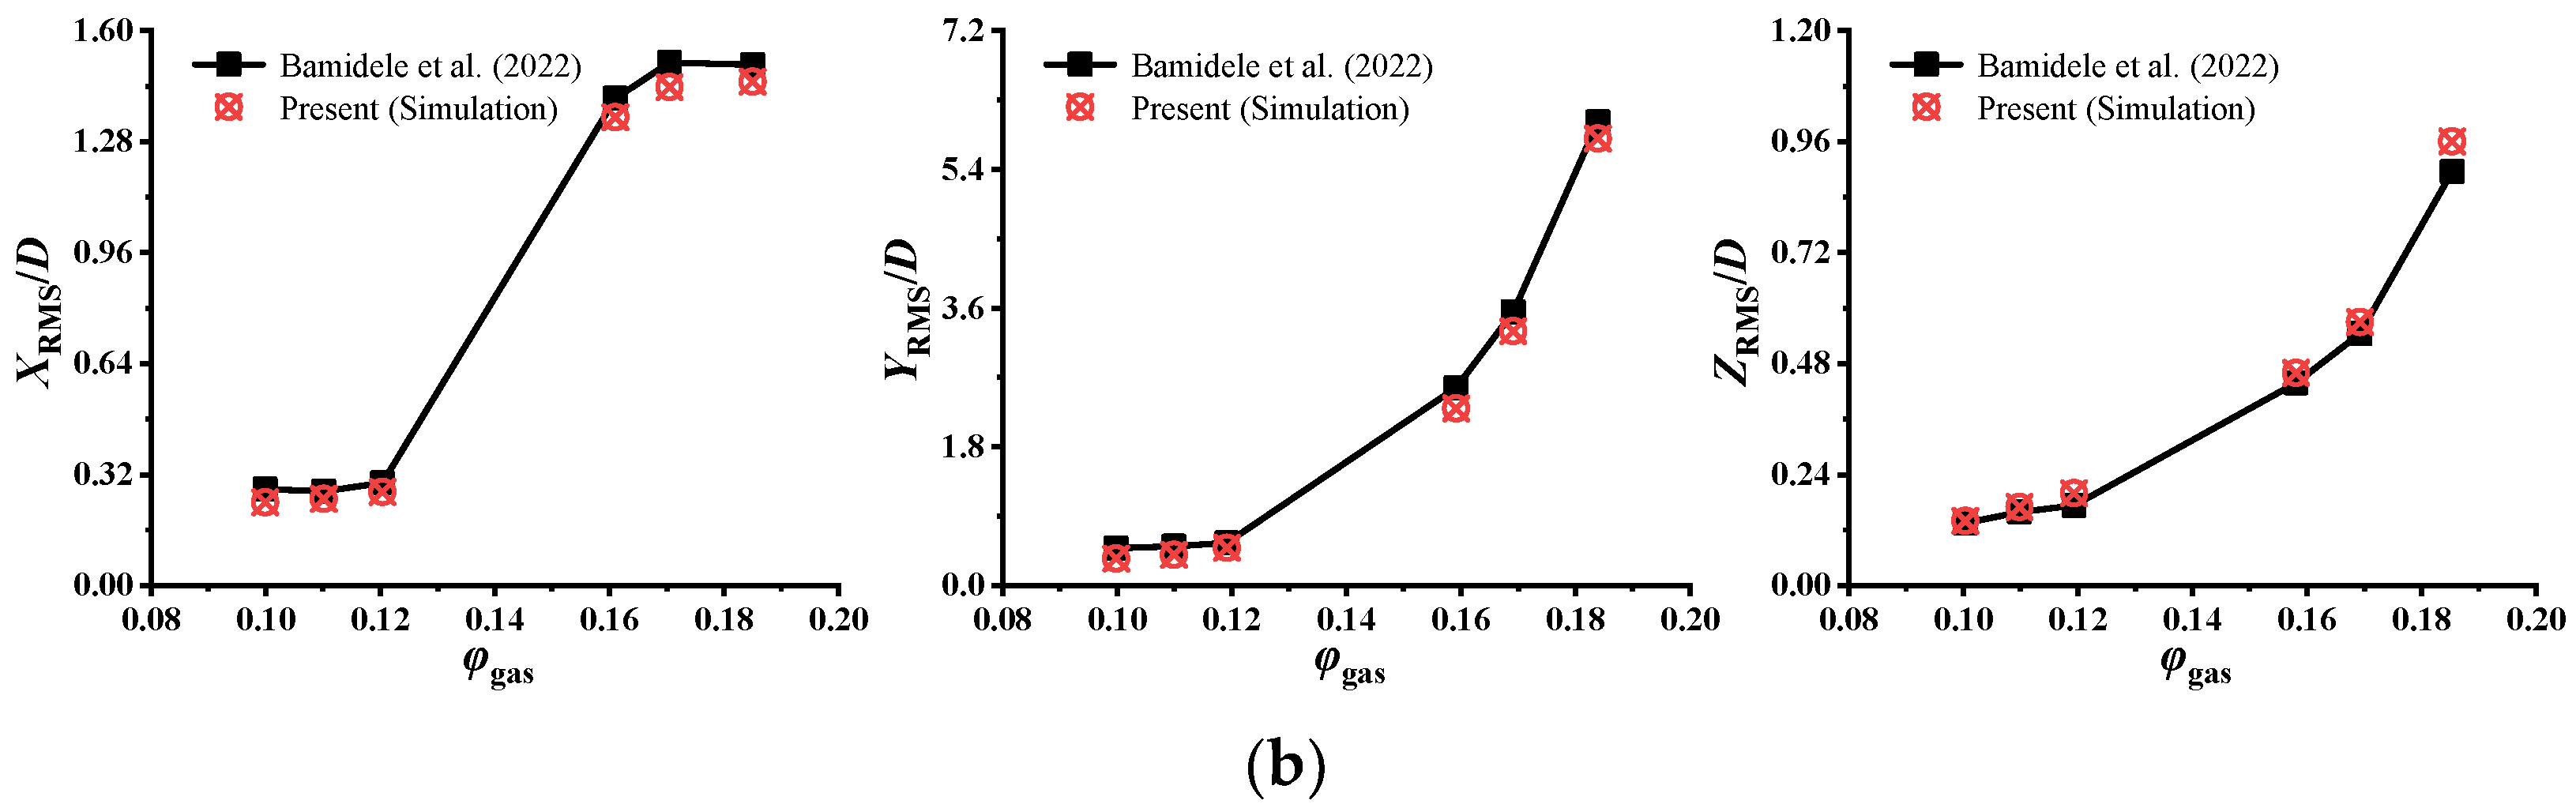
3.3. Modal Analysis and Numerical Validation
4. Results and Discussion
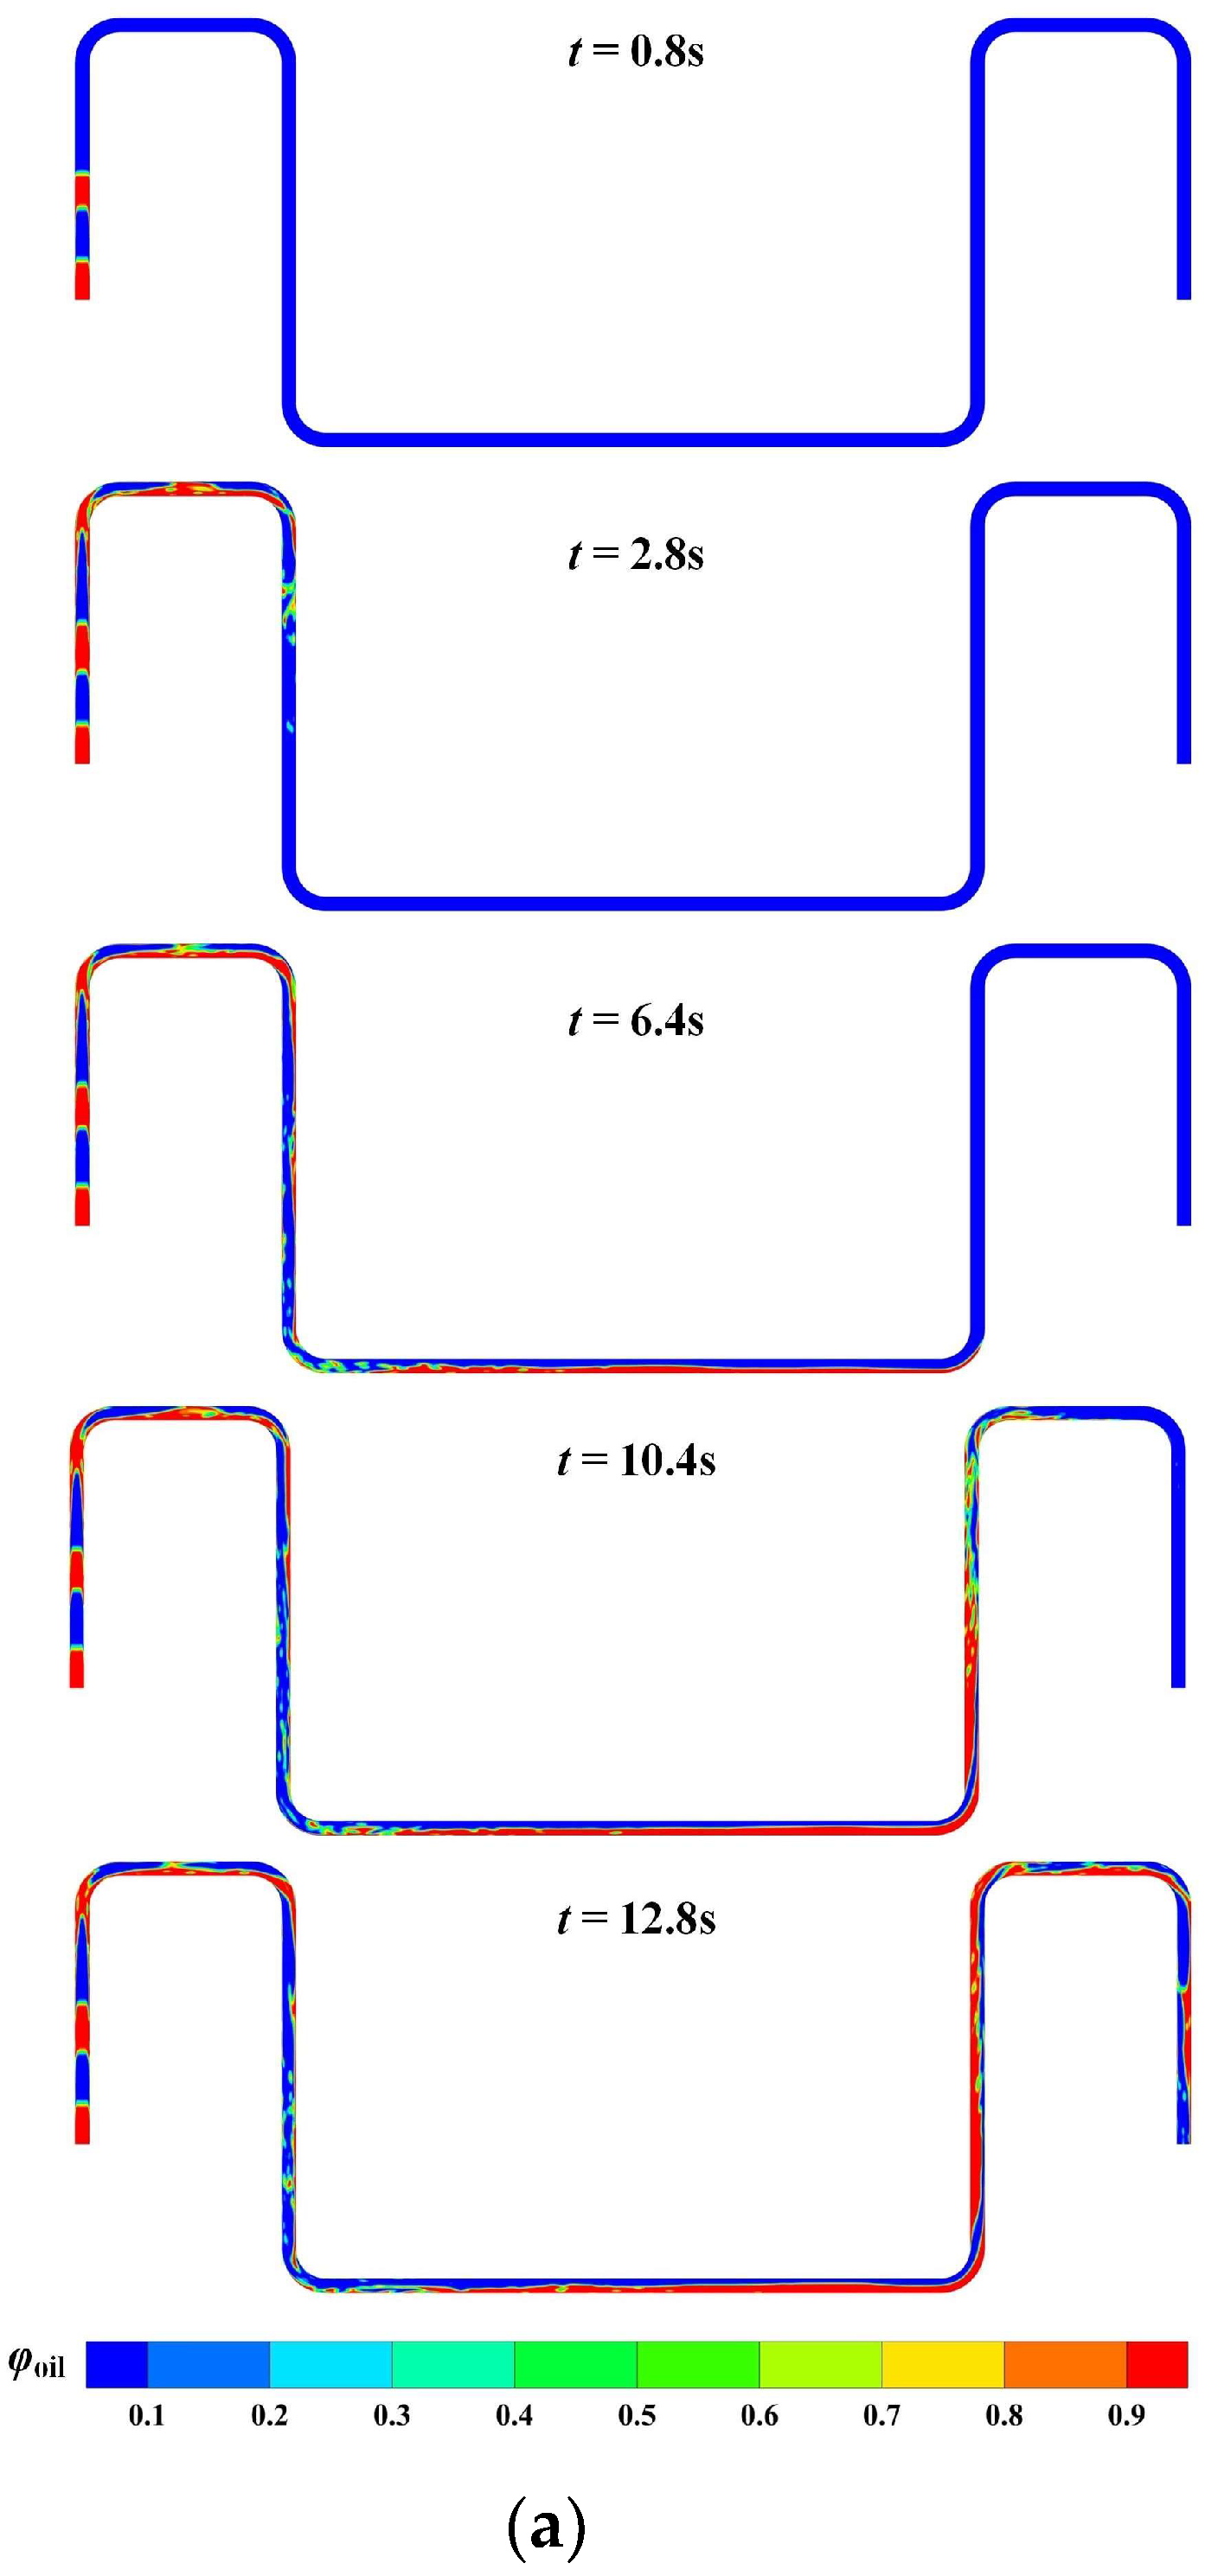
4.1. Flow Evolution in the Static Jumper and Flow-Induced Force
4.2. Flow-Induced Vibration and Its Influence on Flow Evolution
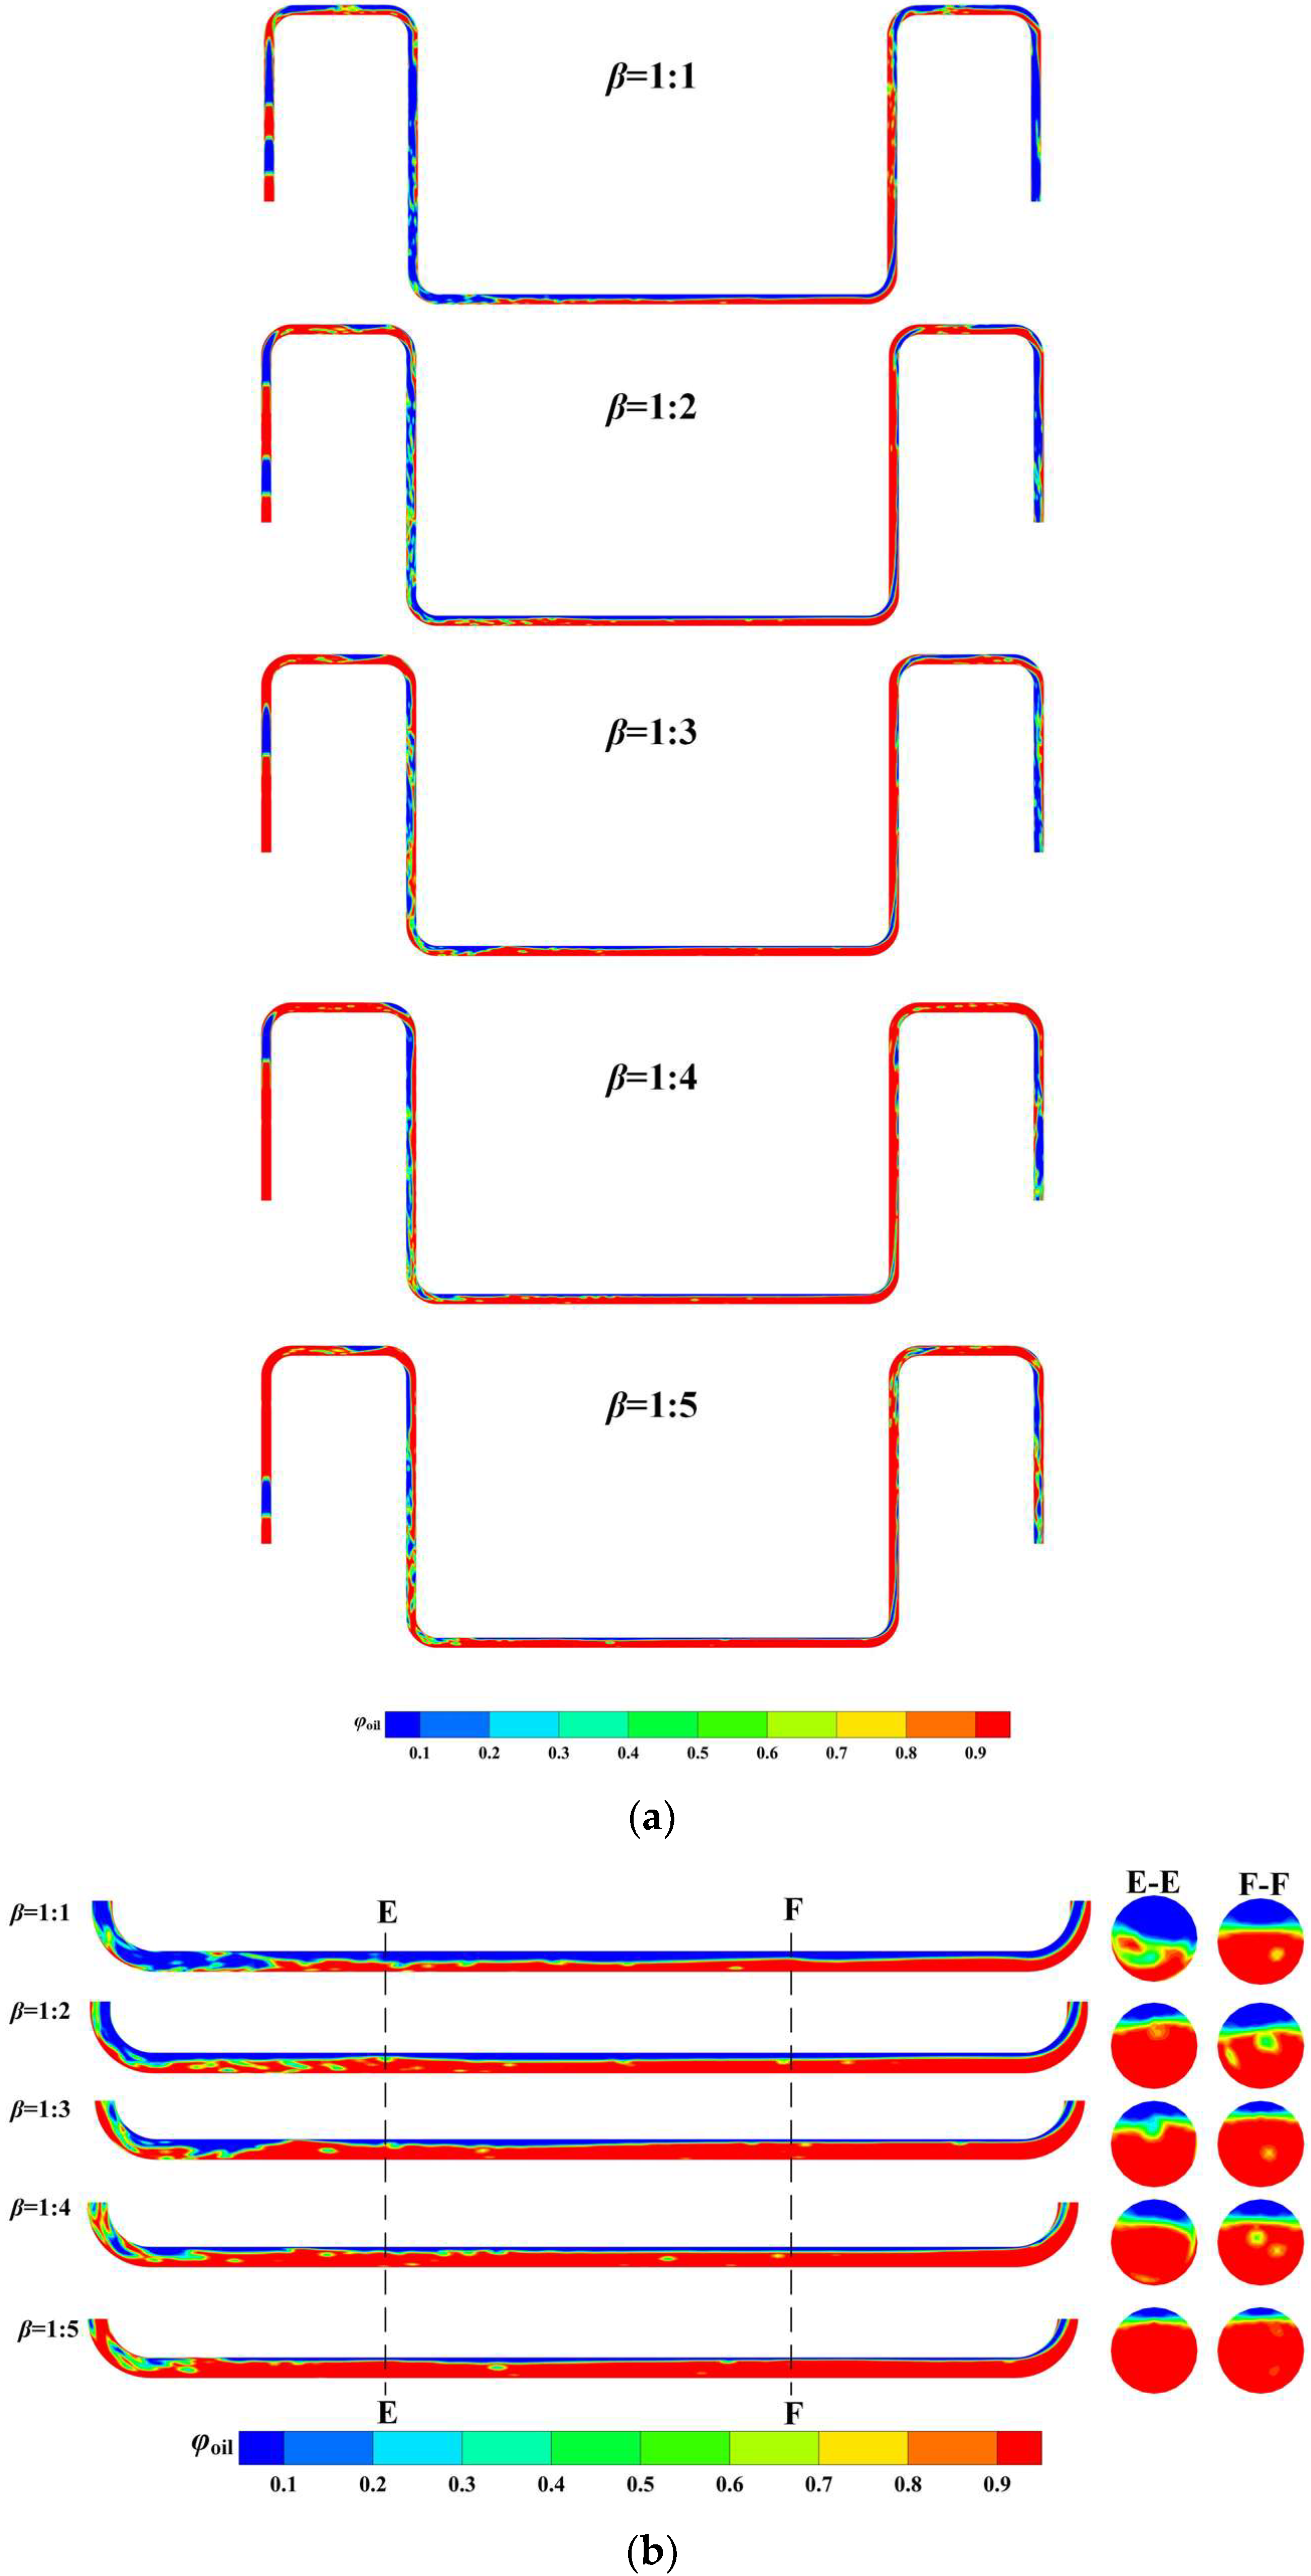
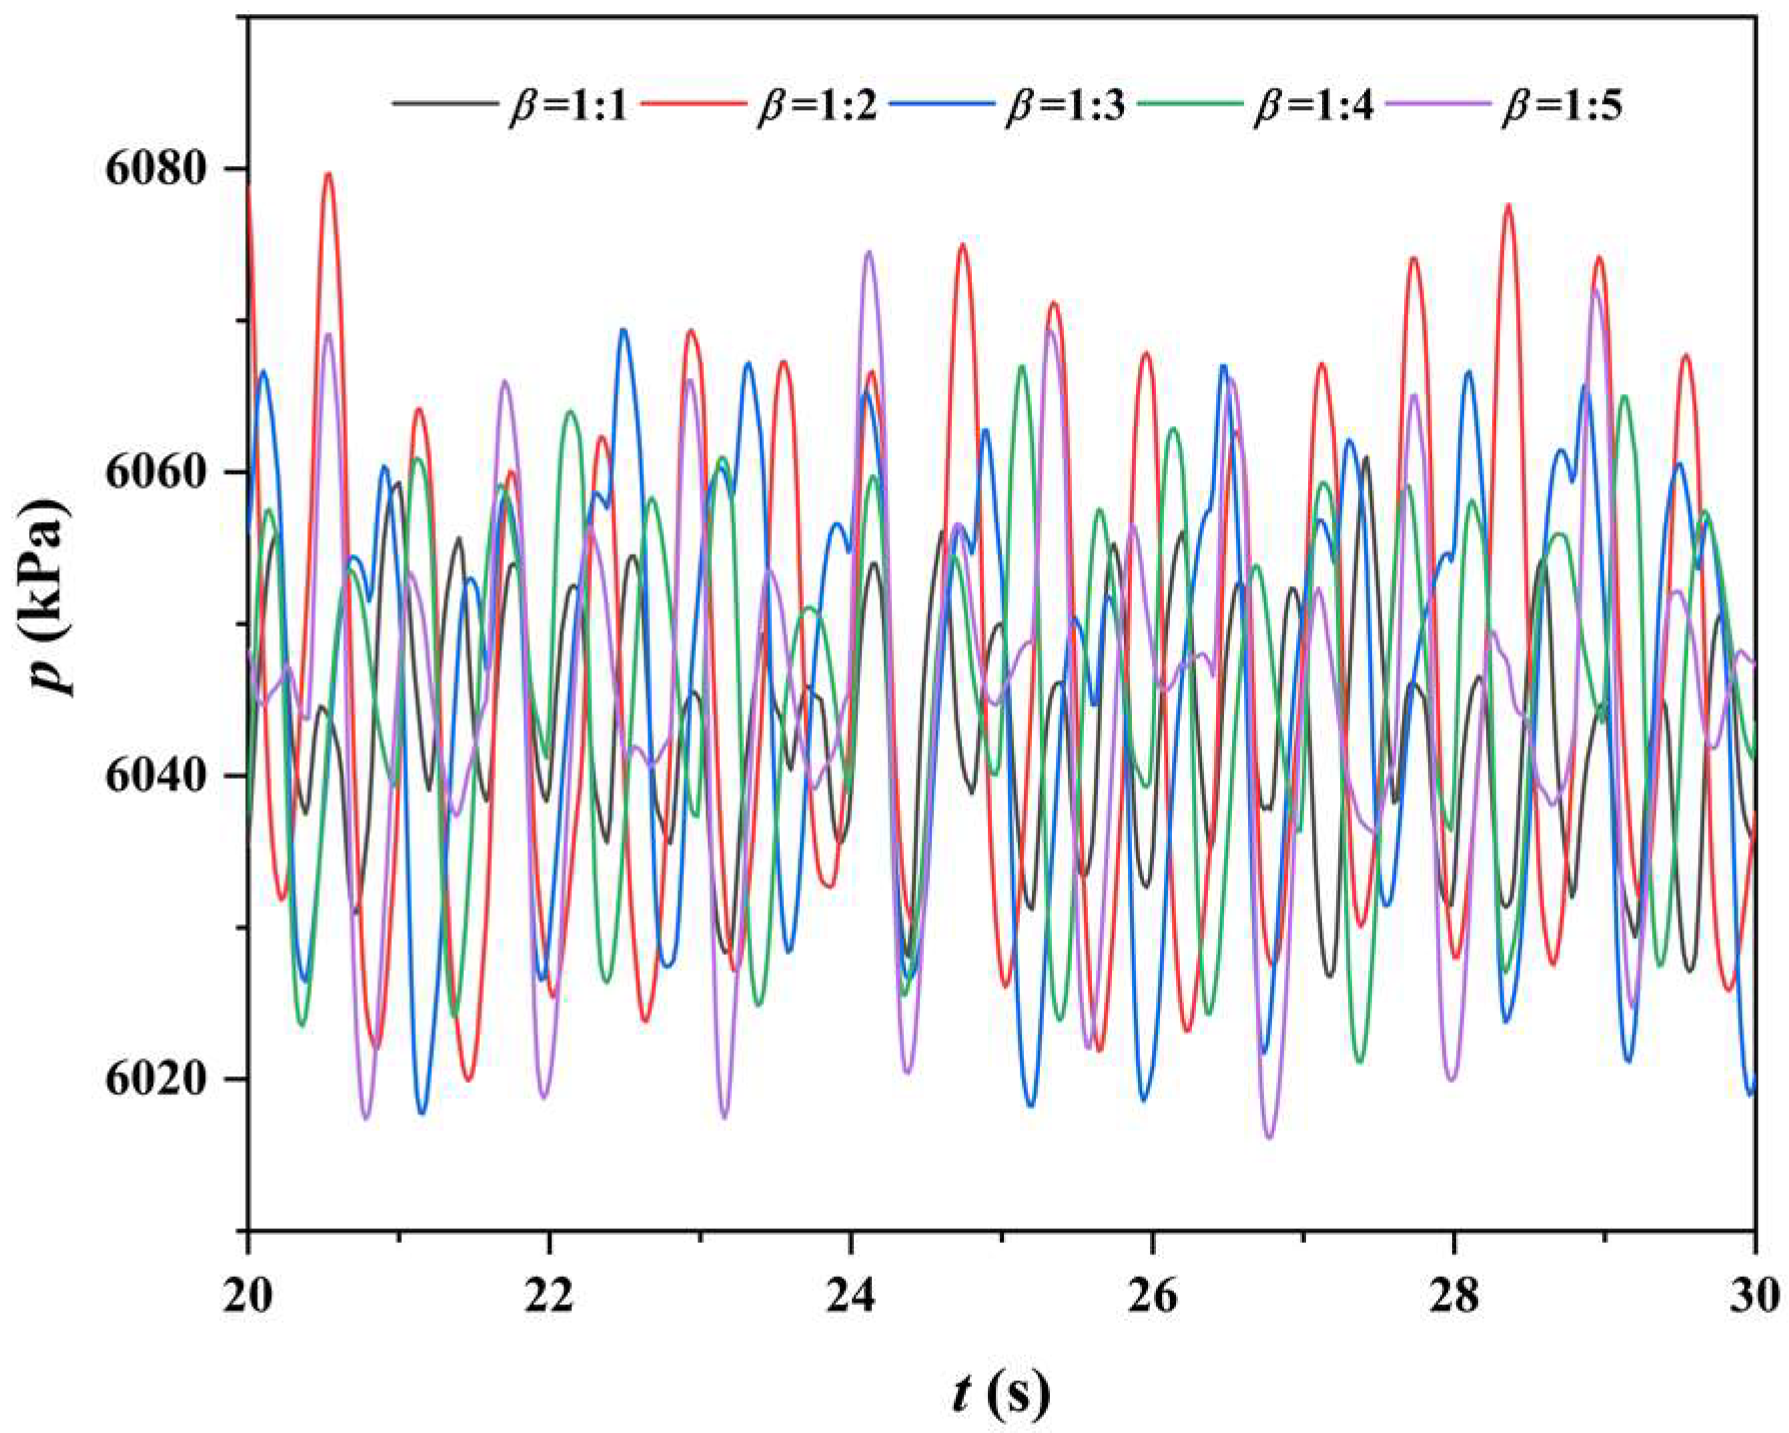
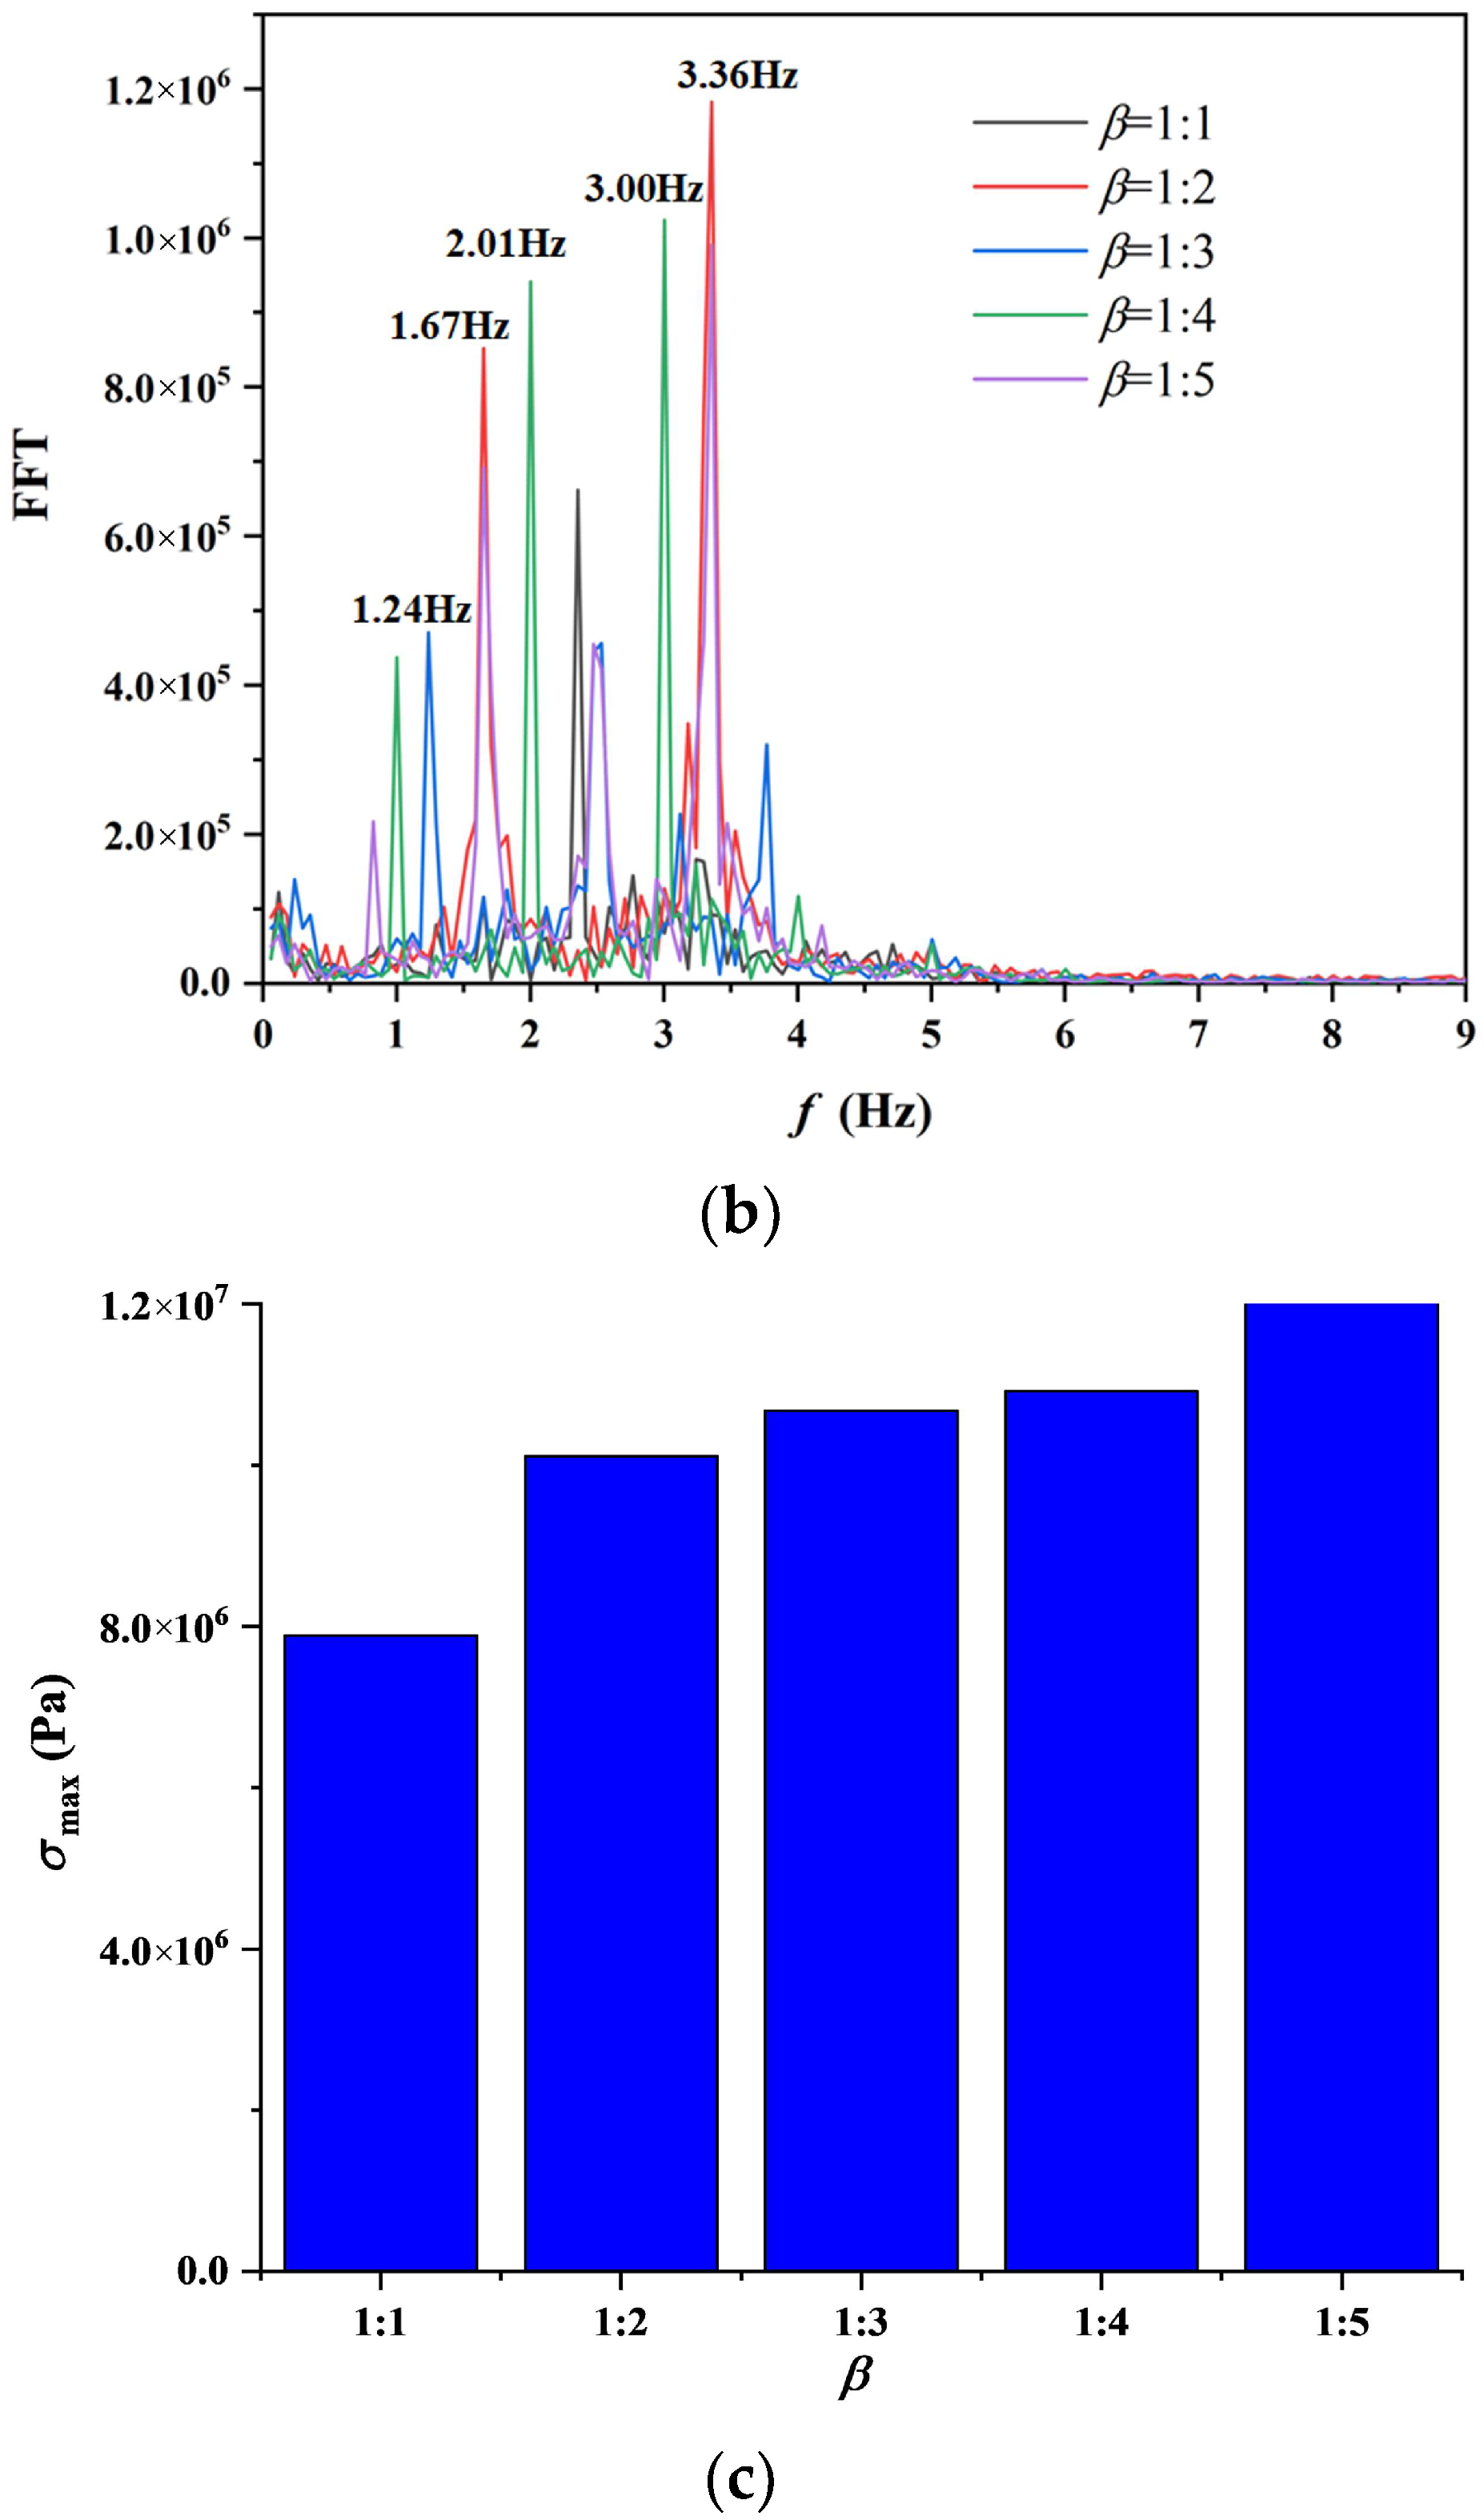
4.3. Effect of Gas-Liquid Ratio
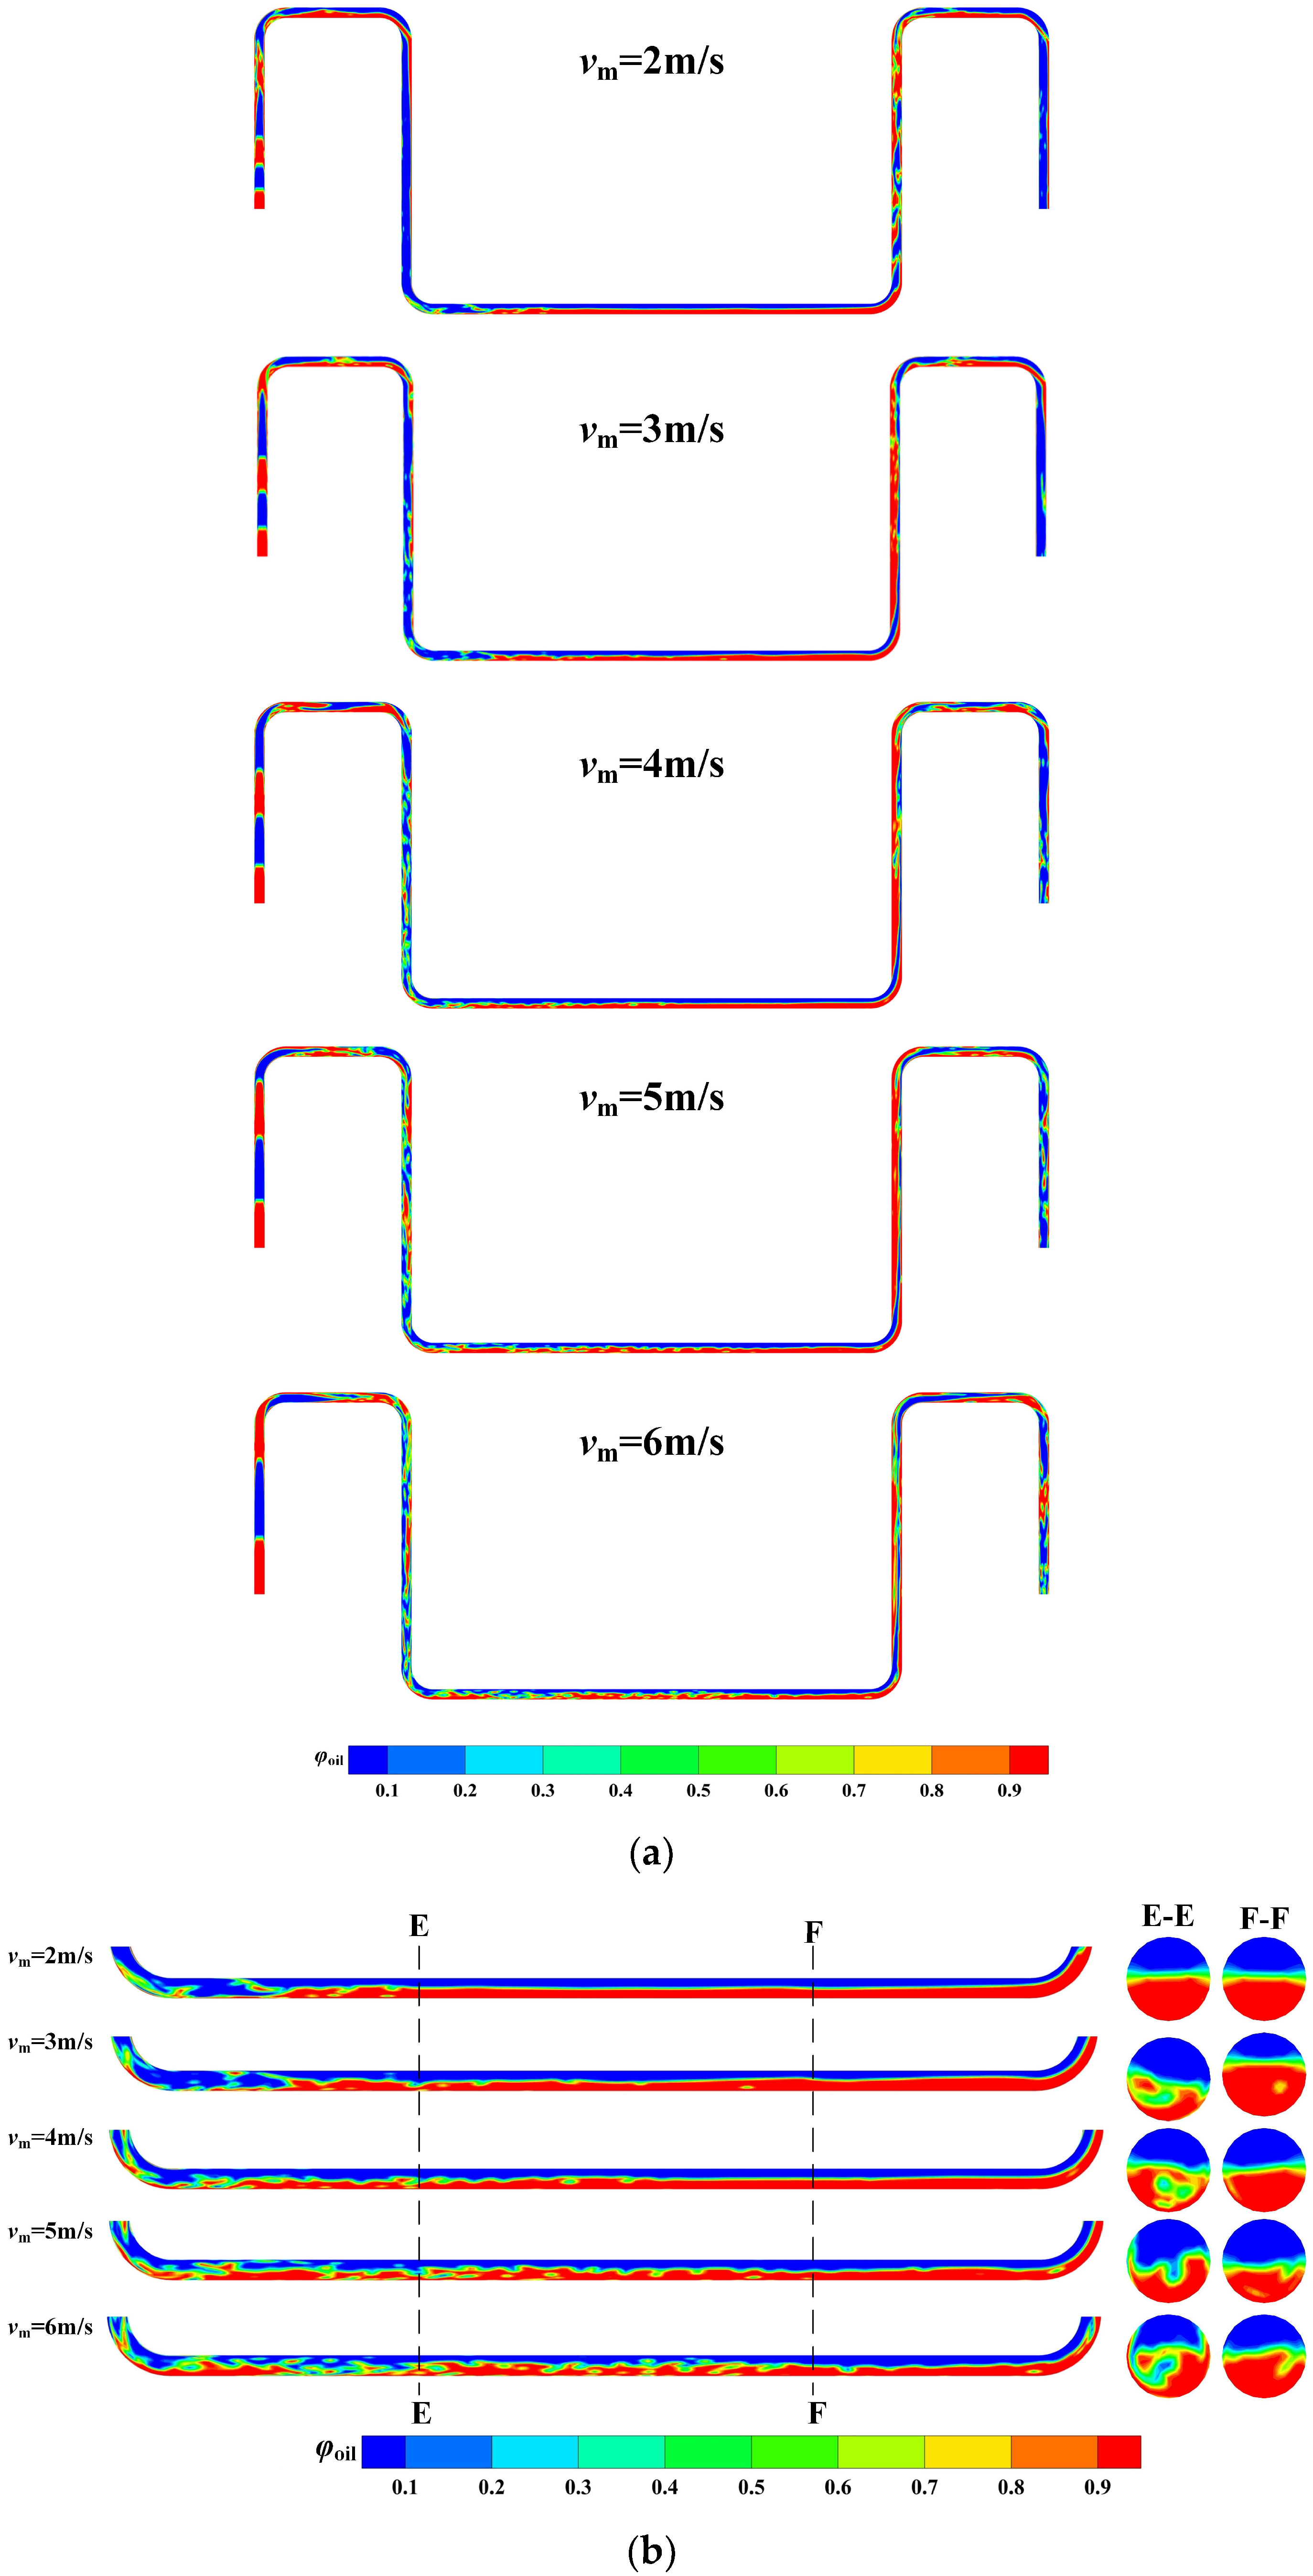
4.4. Effect of Inflow Mixture Velocity
5. Conclusions
- (1)
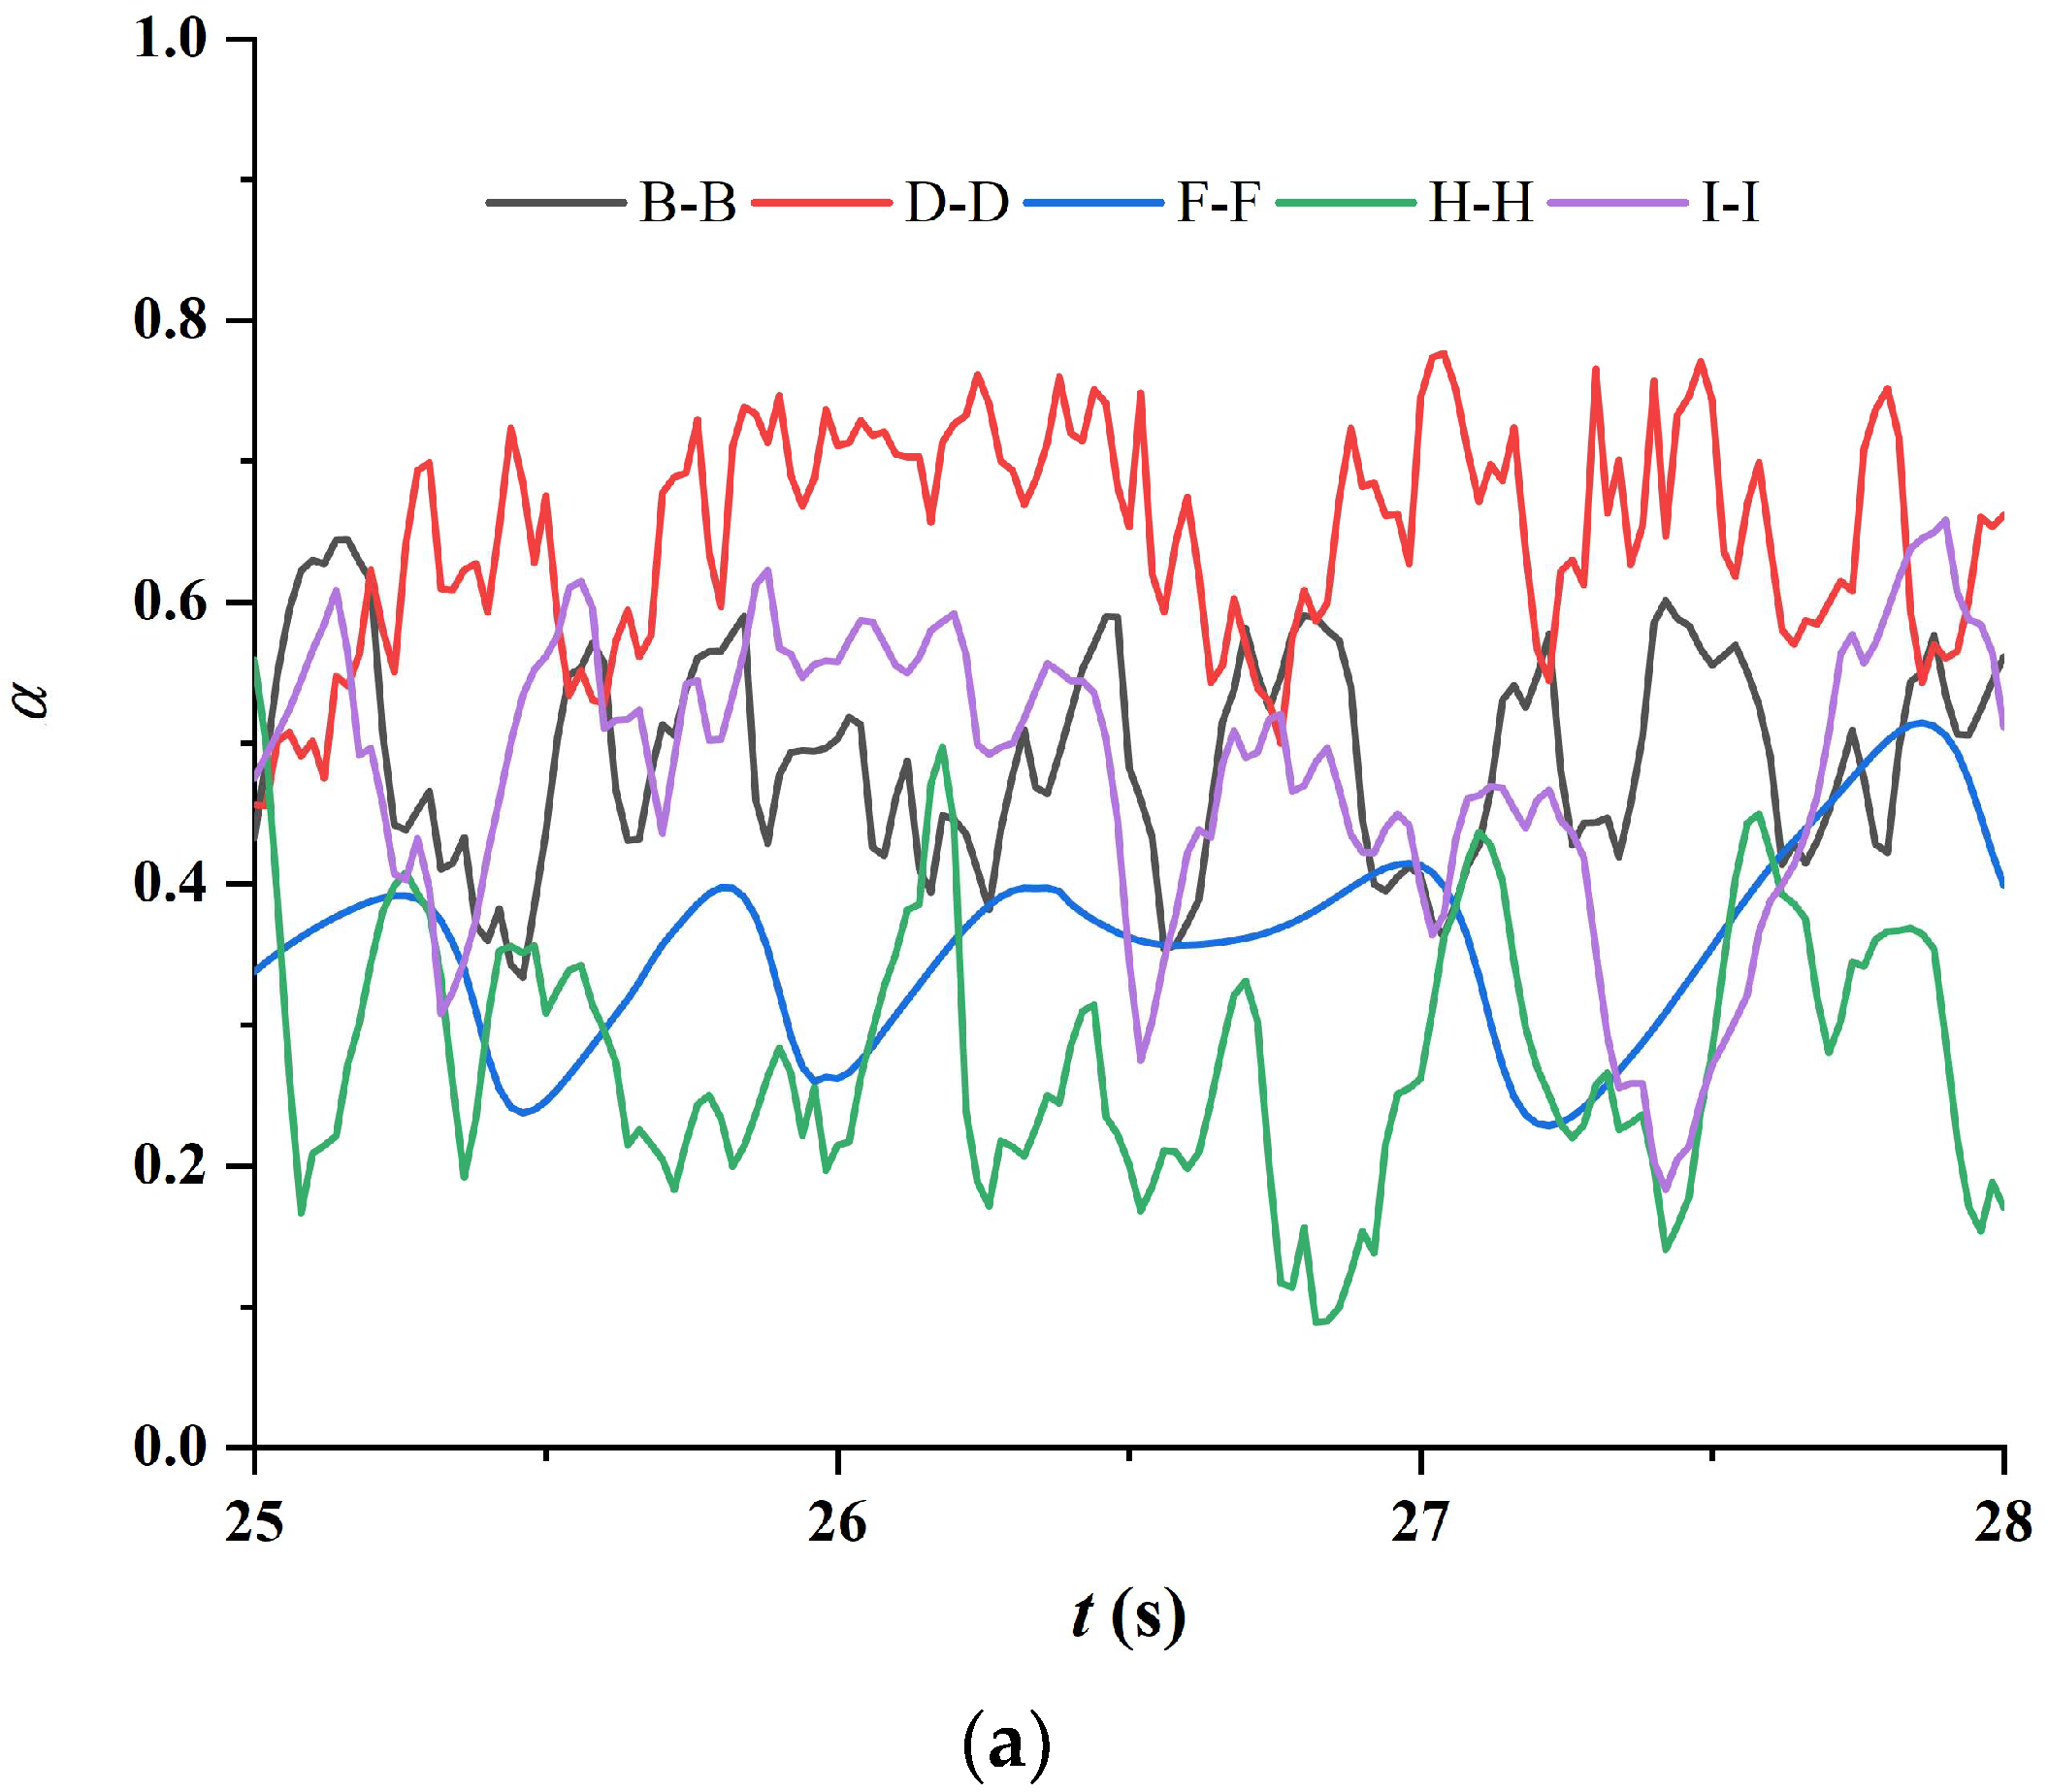
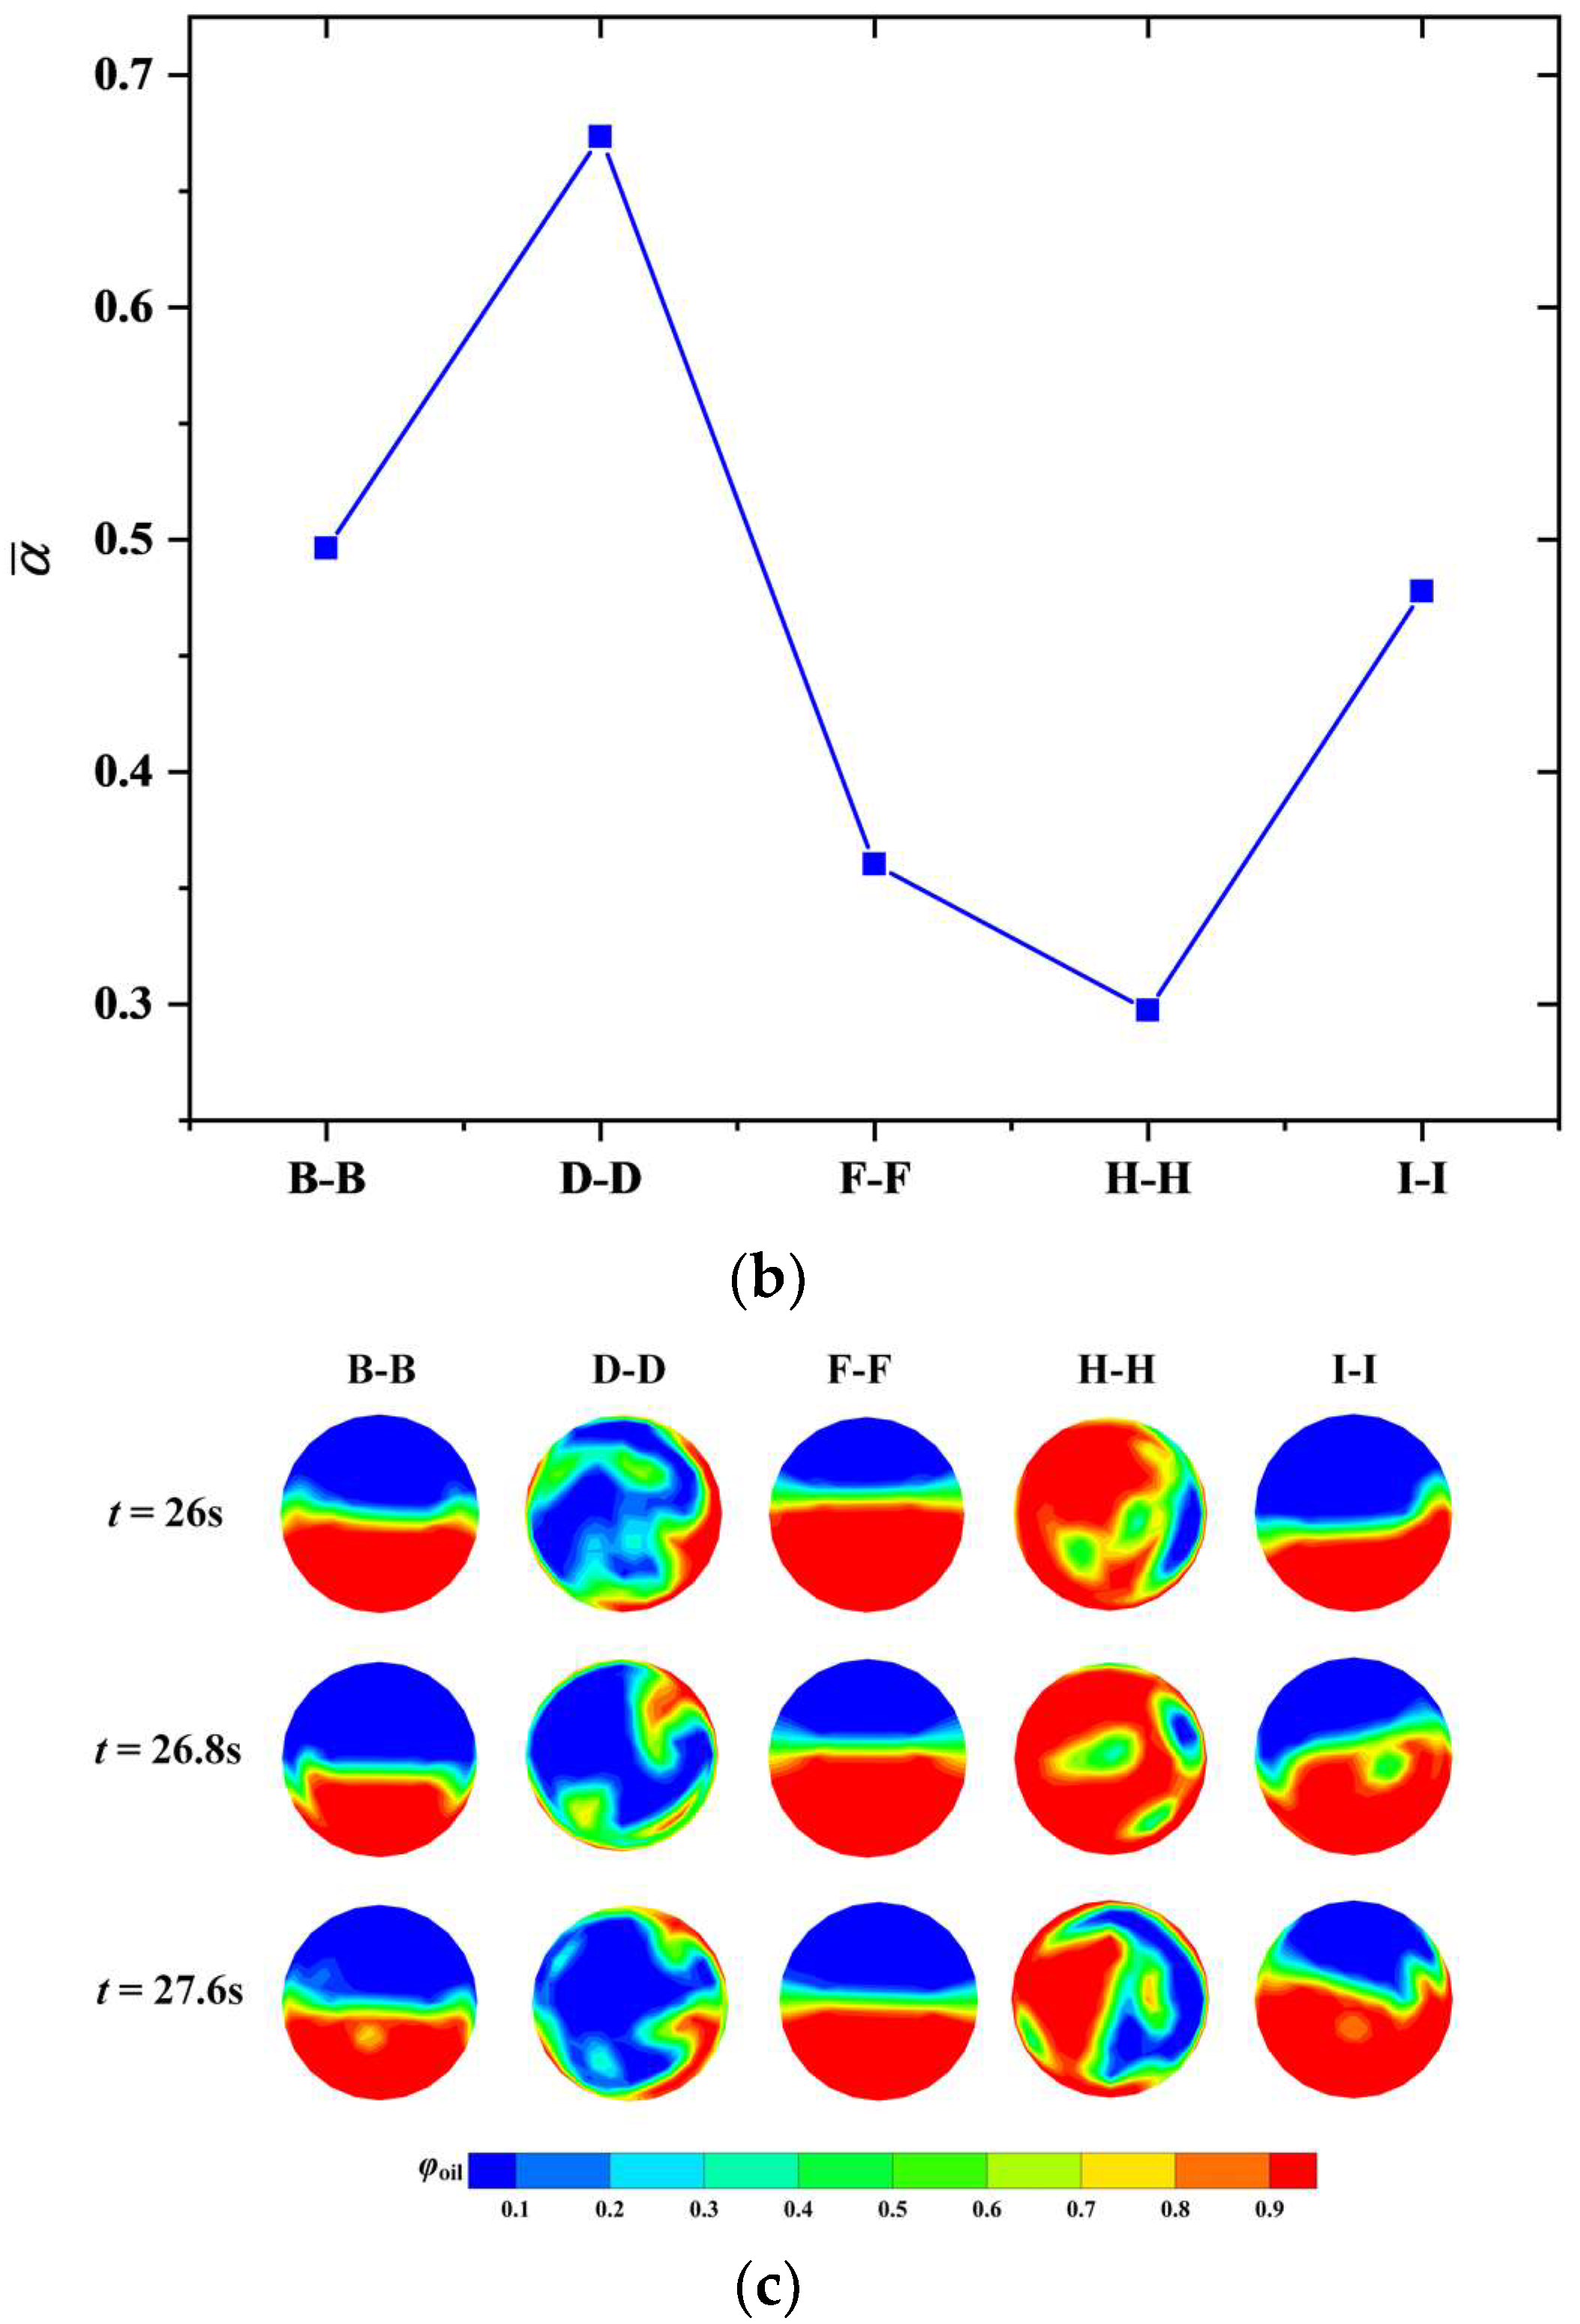
- The flow regime experiences a distinct adjustment after each turn of flow direction due mainly to the combination of centrifugal force, inertia force, gravity force and buoyant force. In the standard case (β = 1:1 and vm = 3 m/s), the flow pattern successively presents slug flow, wavy flow, imperfect annular flow, stratified flow, churn flow, wavy flow and imperfect annular flow in the pipe sections along the jumper. Although the flow regime in a specific cross-section has no variation, the gas void fraction fluctuates periodically, suggesting the disturbance of the gas-liquid interface. The gas-liquid mixture development is significantly altered by changing either the gas-liquid ratio or the mixture velocity. With reducing β or increasing vm, the pattern evolves from annular flow to churn flow or aerated slug flow in the downward tubes. In contrast, the corresponding regime in the right upward tube shifts from churn flow to bubbly or annular flow as a result of stabilization. The small-amplitude oscillation of order of 10−3D does not alter the flow pattern in pipe segments but stabilizes the mixture flow in the middle span and the subsequent upward tube.
- (2)
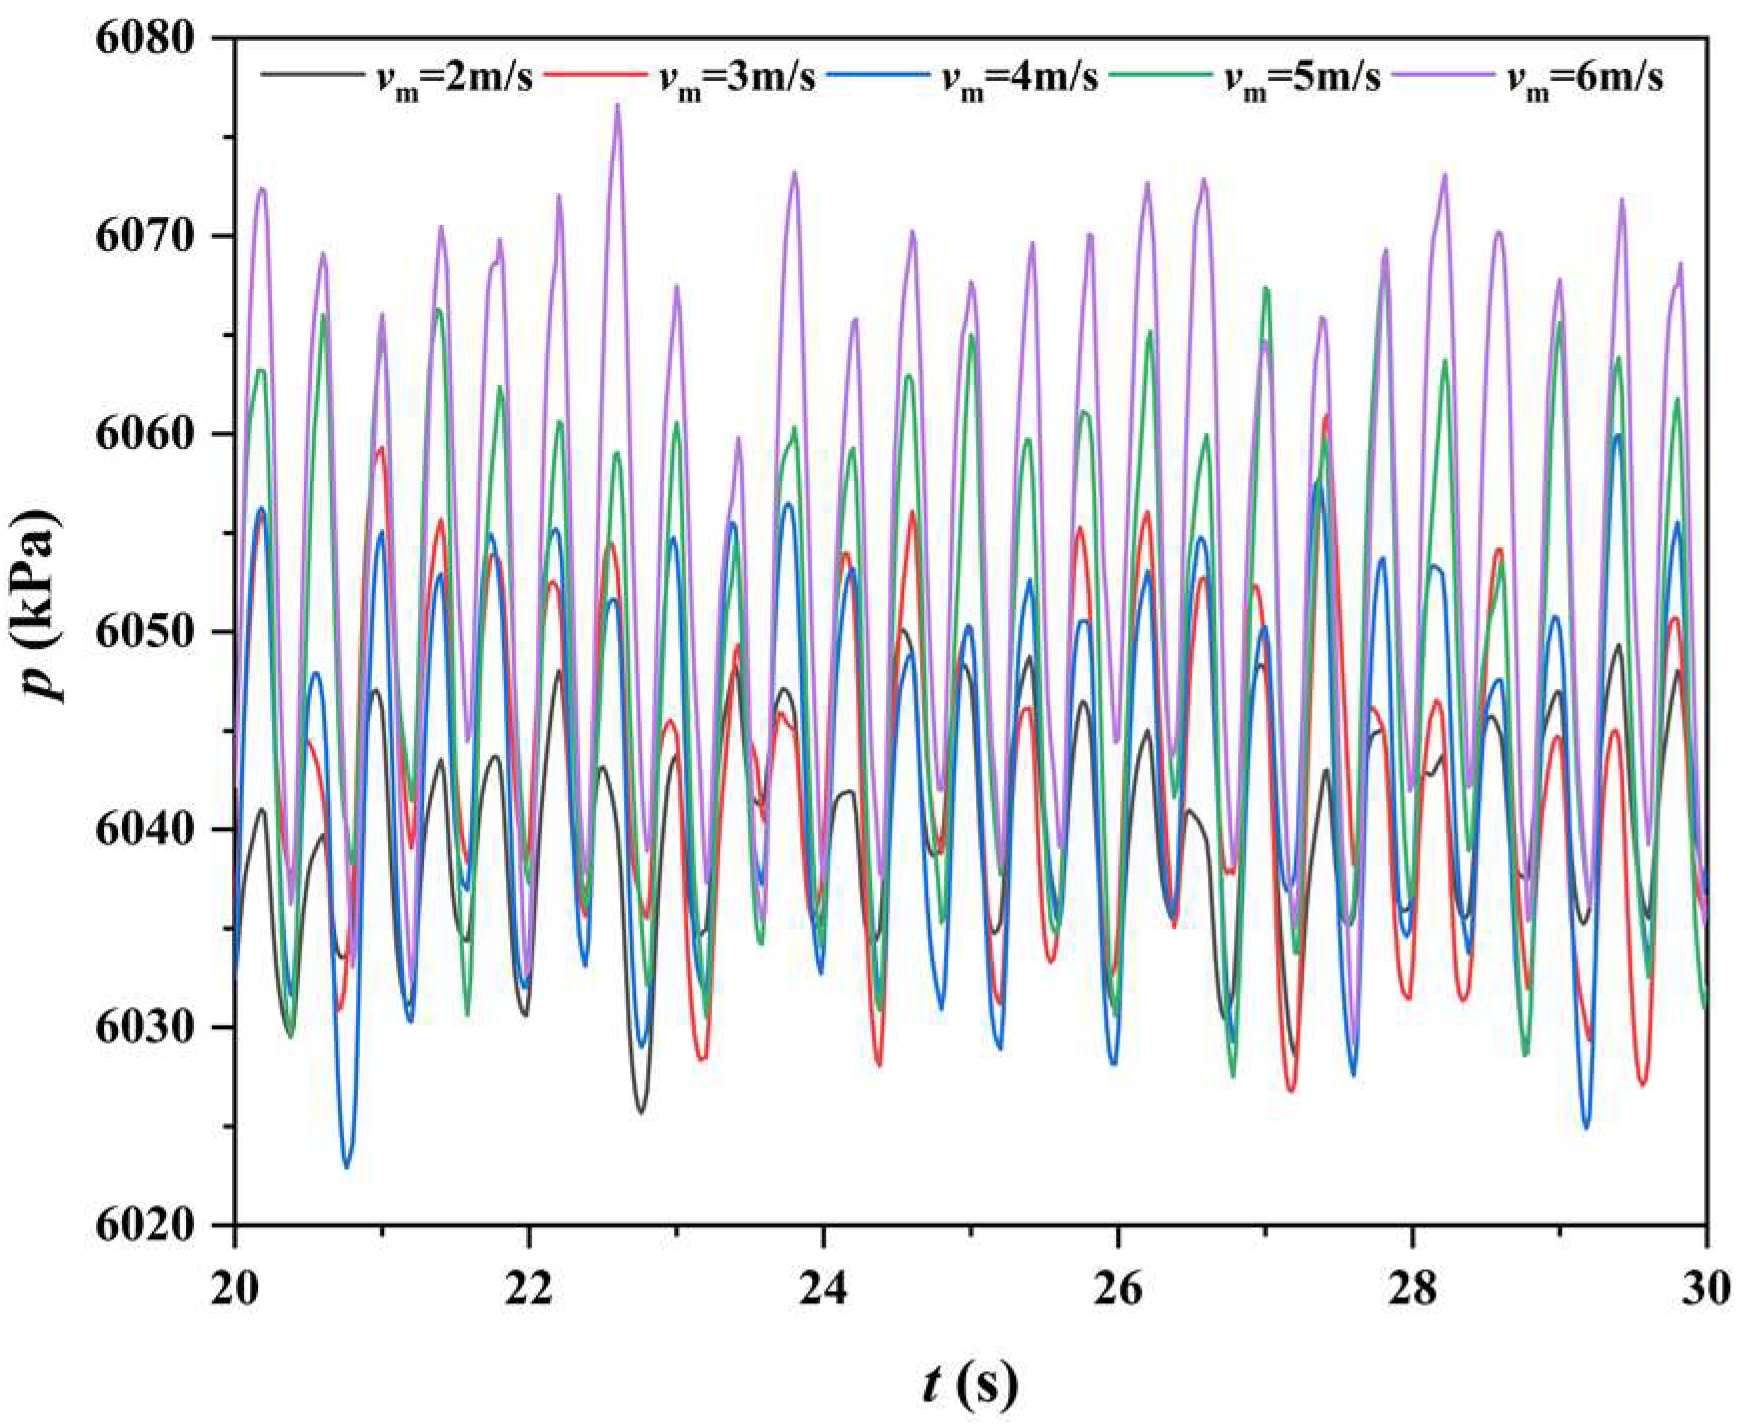
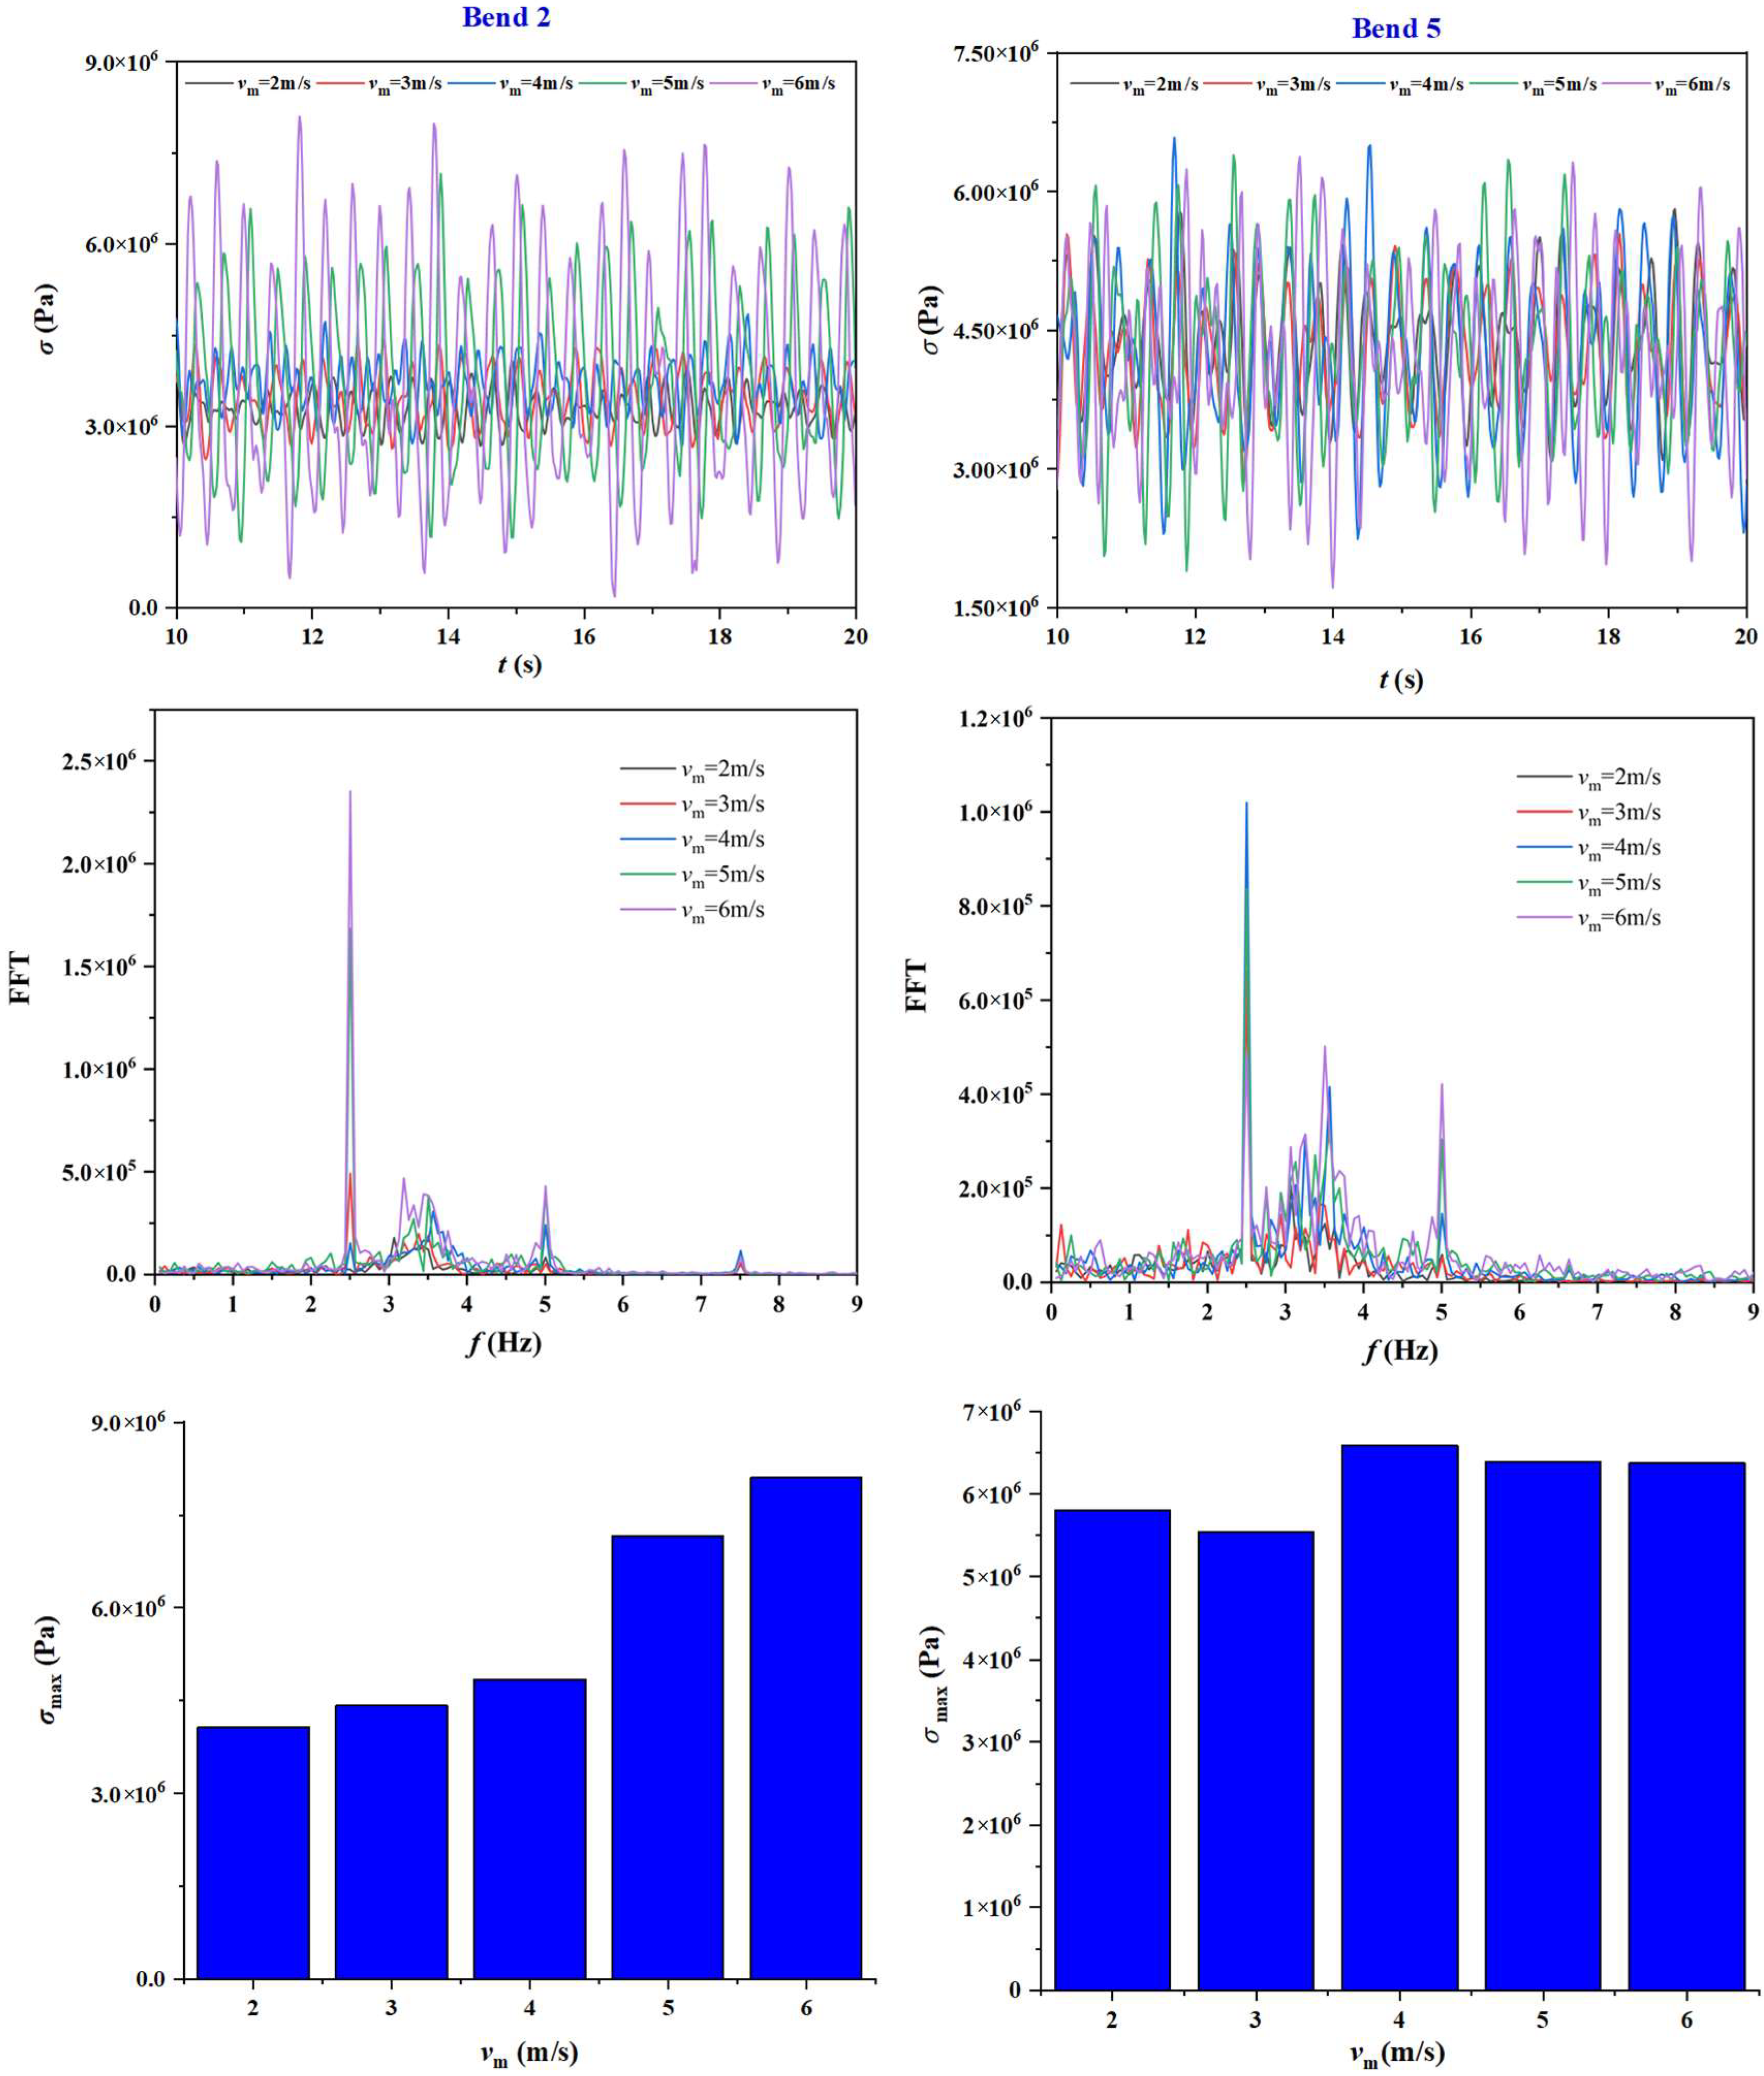
- The pressure stresses acting on six bends fluctuate in multiple frequencies due to the occurrence of flow pattern transition and multi-frequency fluctuation of gas void fraction. Nevertheless, the dominant frequency of pressure fluctuation is approximately equal to the inflow slug frequency, indicating the close correlation between them. The flow evolution along the jumper introduces other secondary frequencies with increased allocated energy along the flow path. As a result of falling liquid impact, the third bend bears the maximum pressure stress. As β reduces from 1:1 to 1:5, the pressure acting on the third bend is augmented, which is also observed with the increase of vm from 2 m/s to 6 m/s. In contrast, the bends close to both ends undergo larger structural stresses. The disturbance introduced by the pattern transition from churn flow to wavy flow contributes to the maximum fluctuation amplitude of structural stress of the fifth bend. The structural stress of this bend is amplified with the reduction of β, while presents a non-monotonic variation with vm due to the flow evolution.
- (3)
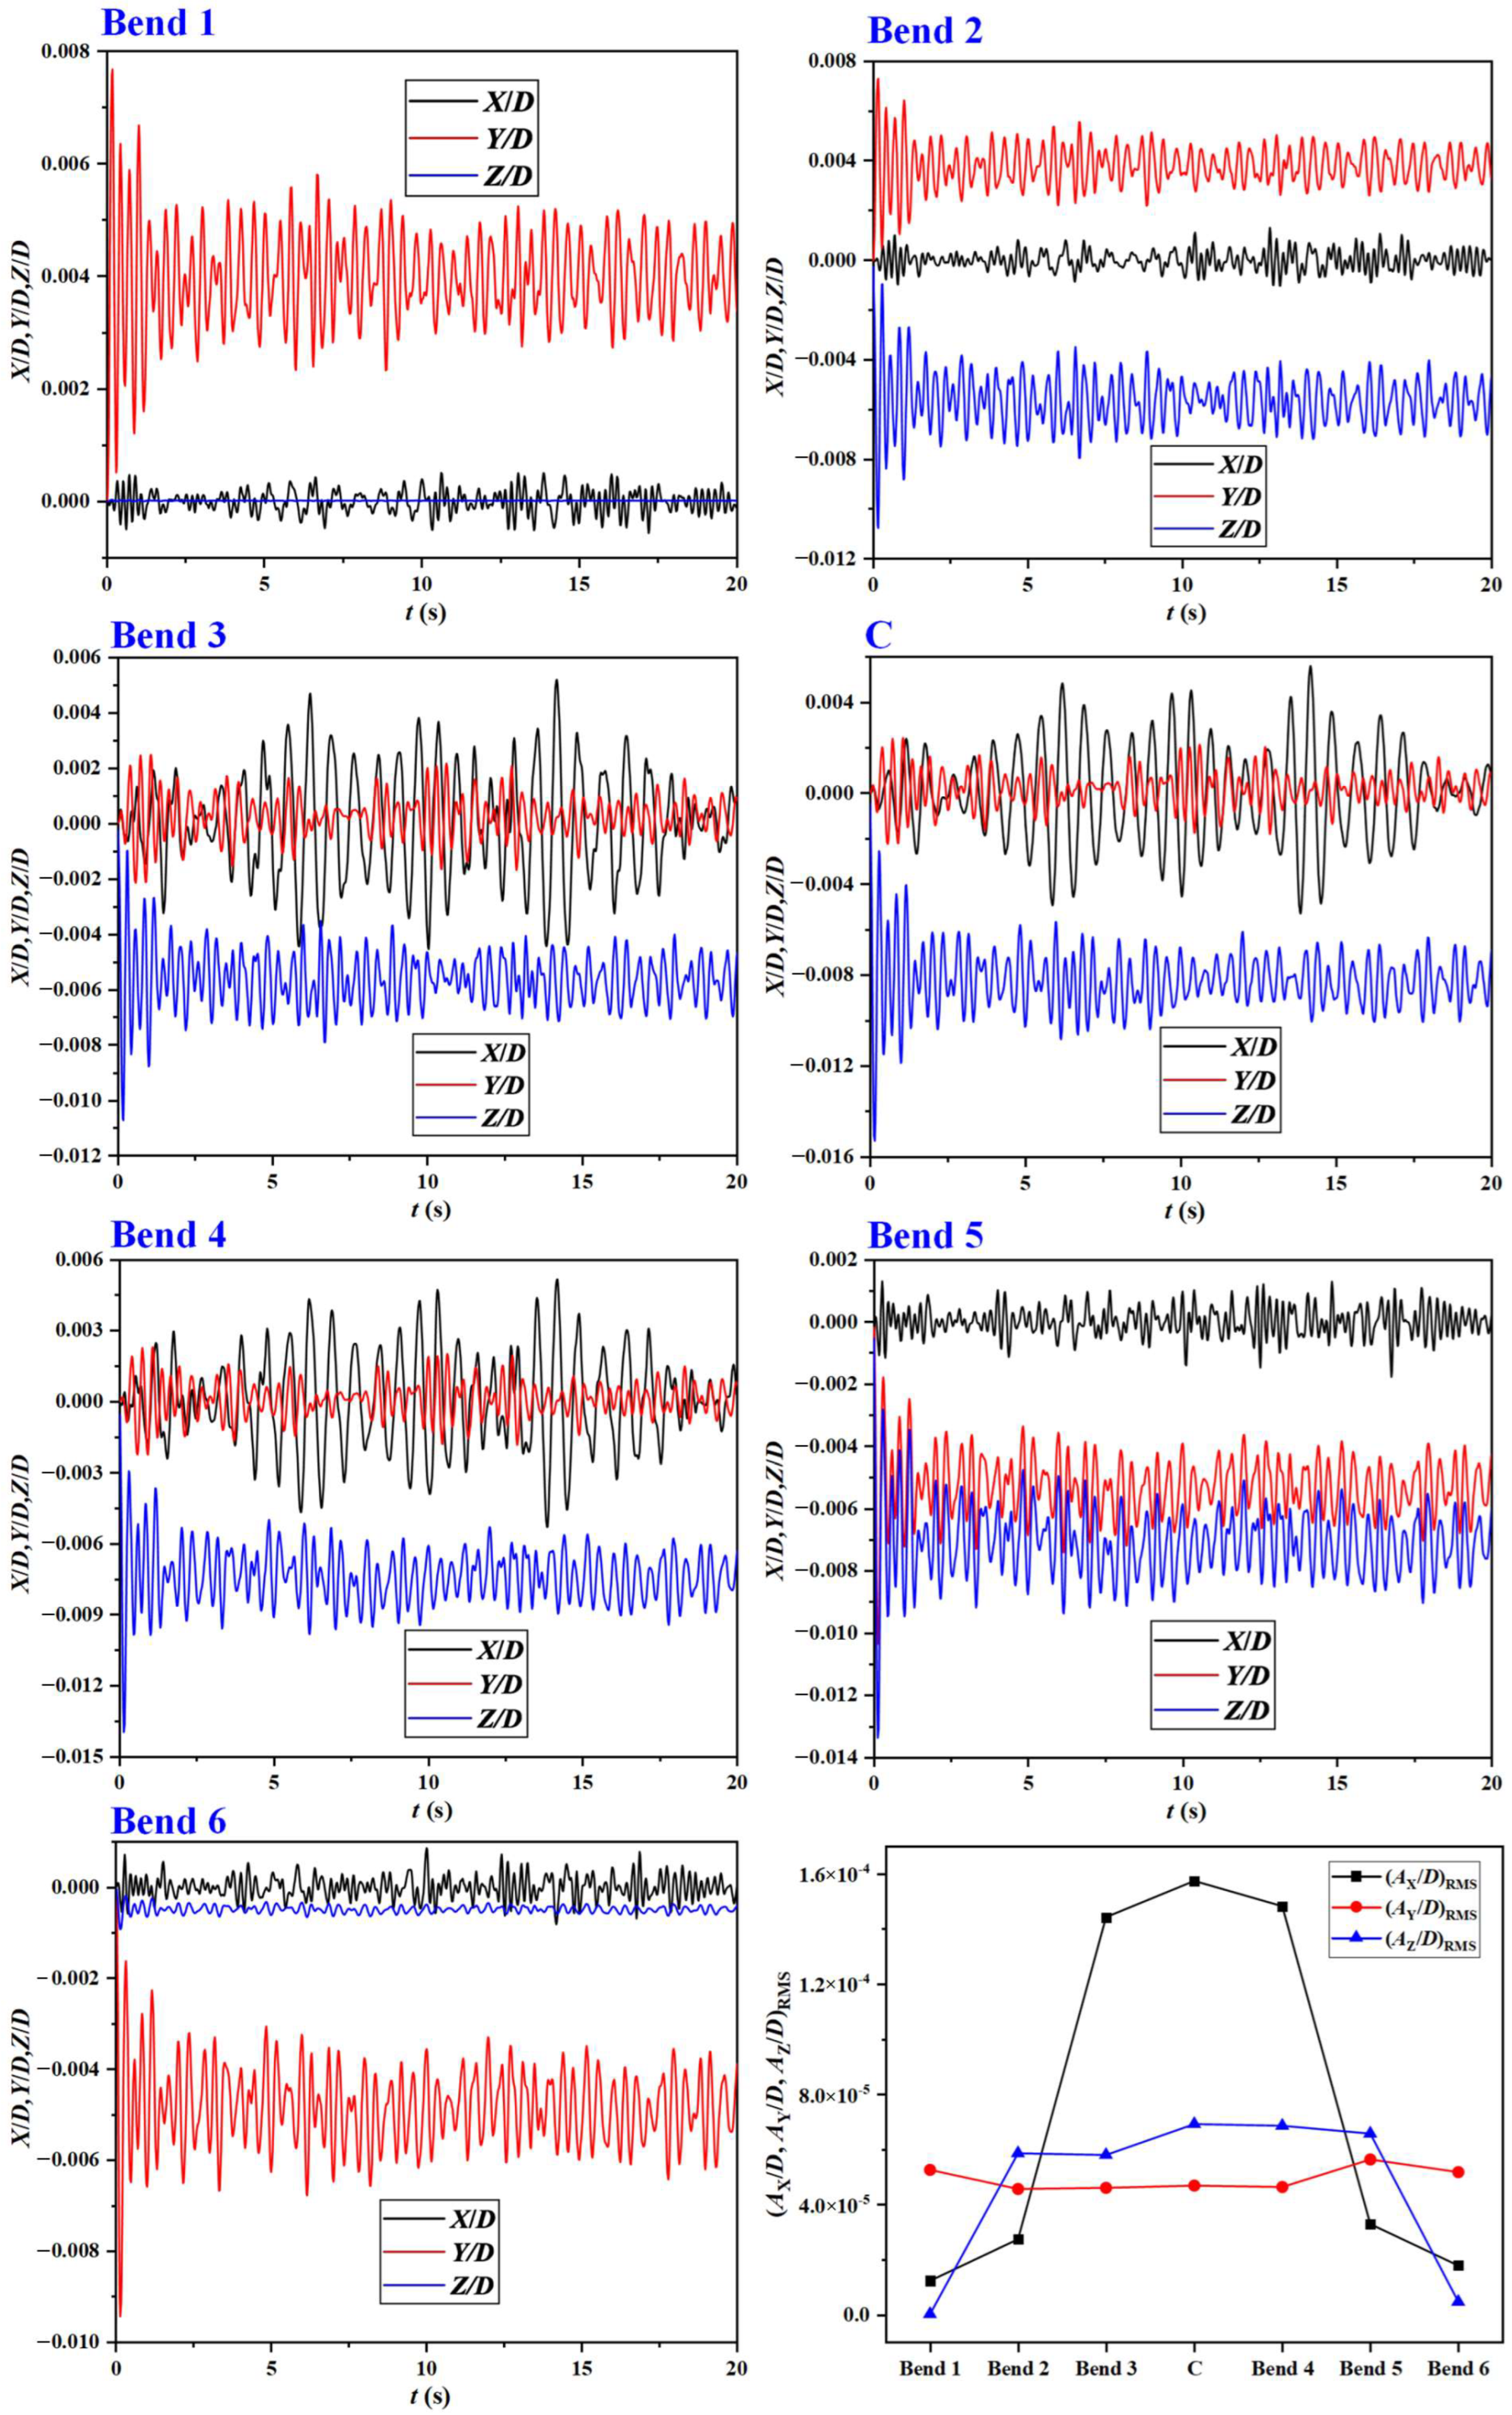
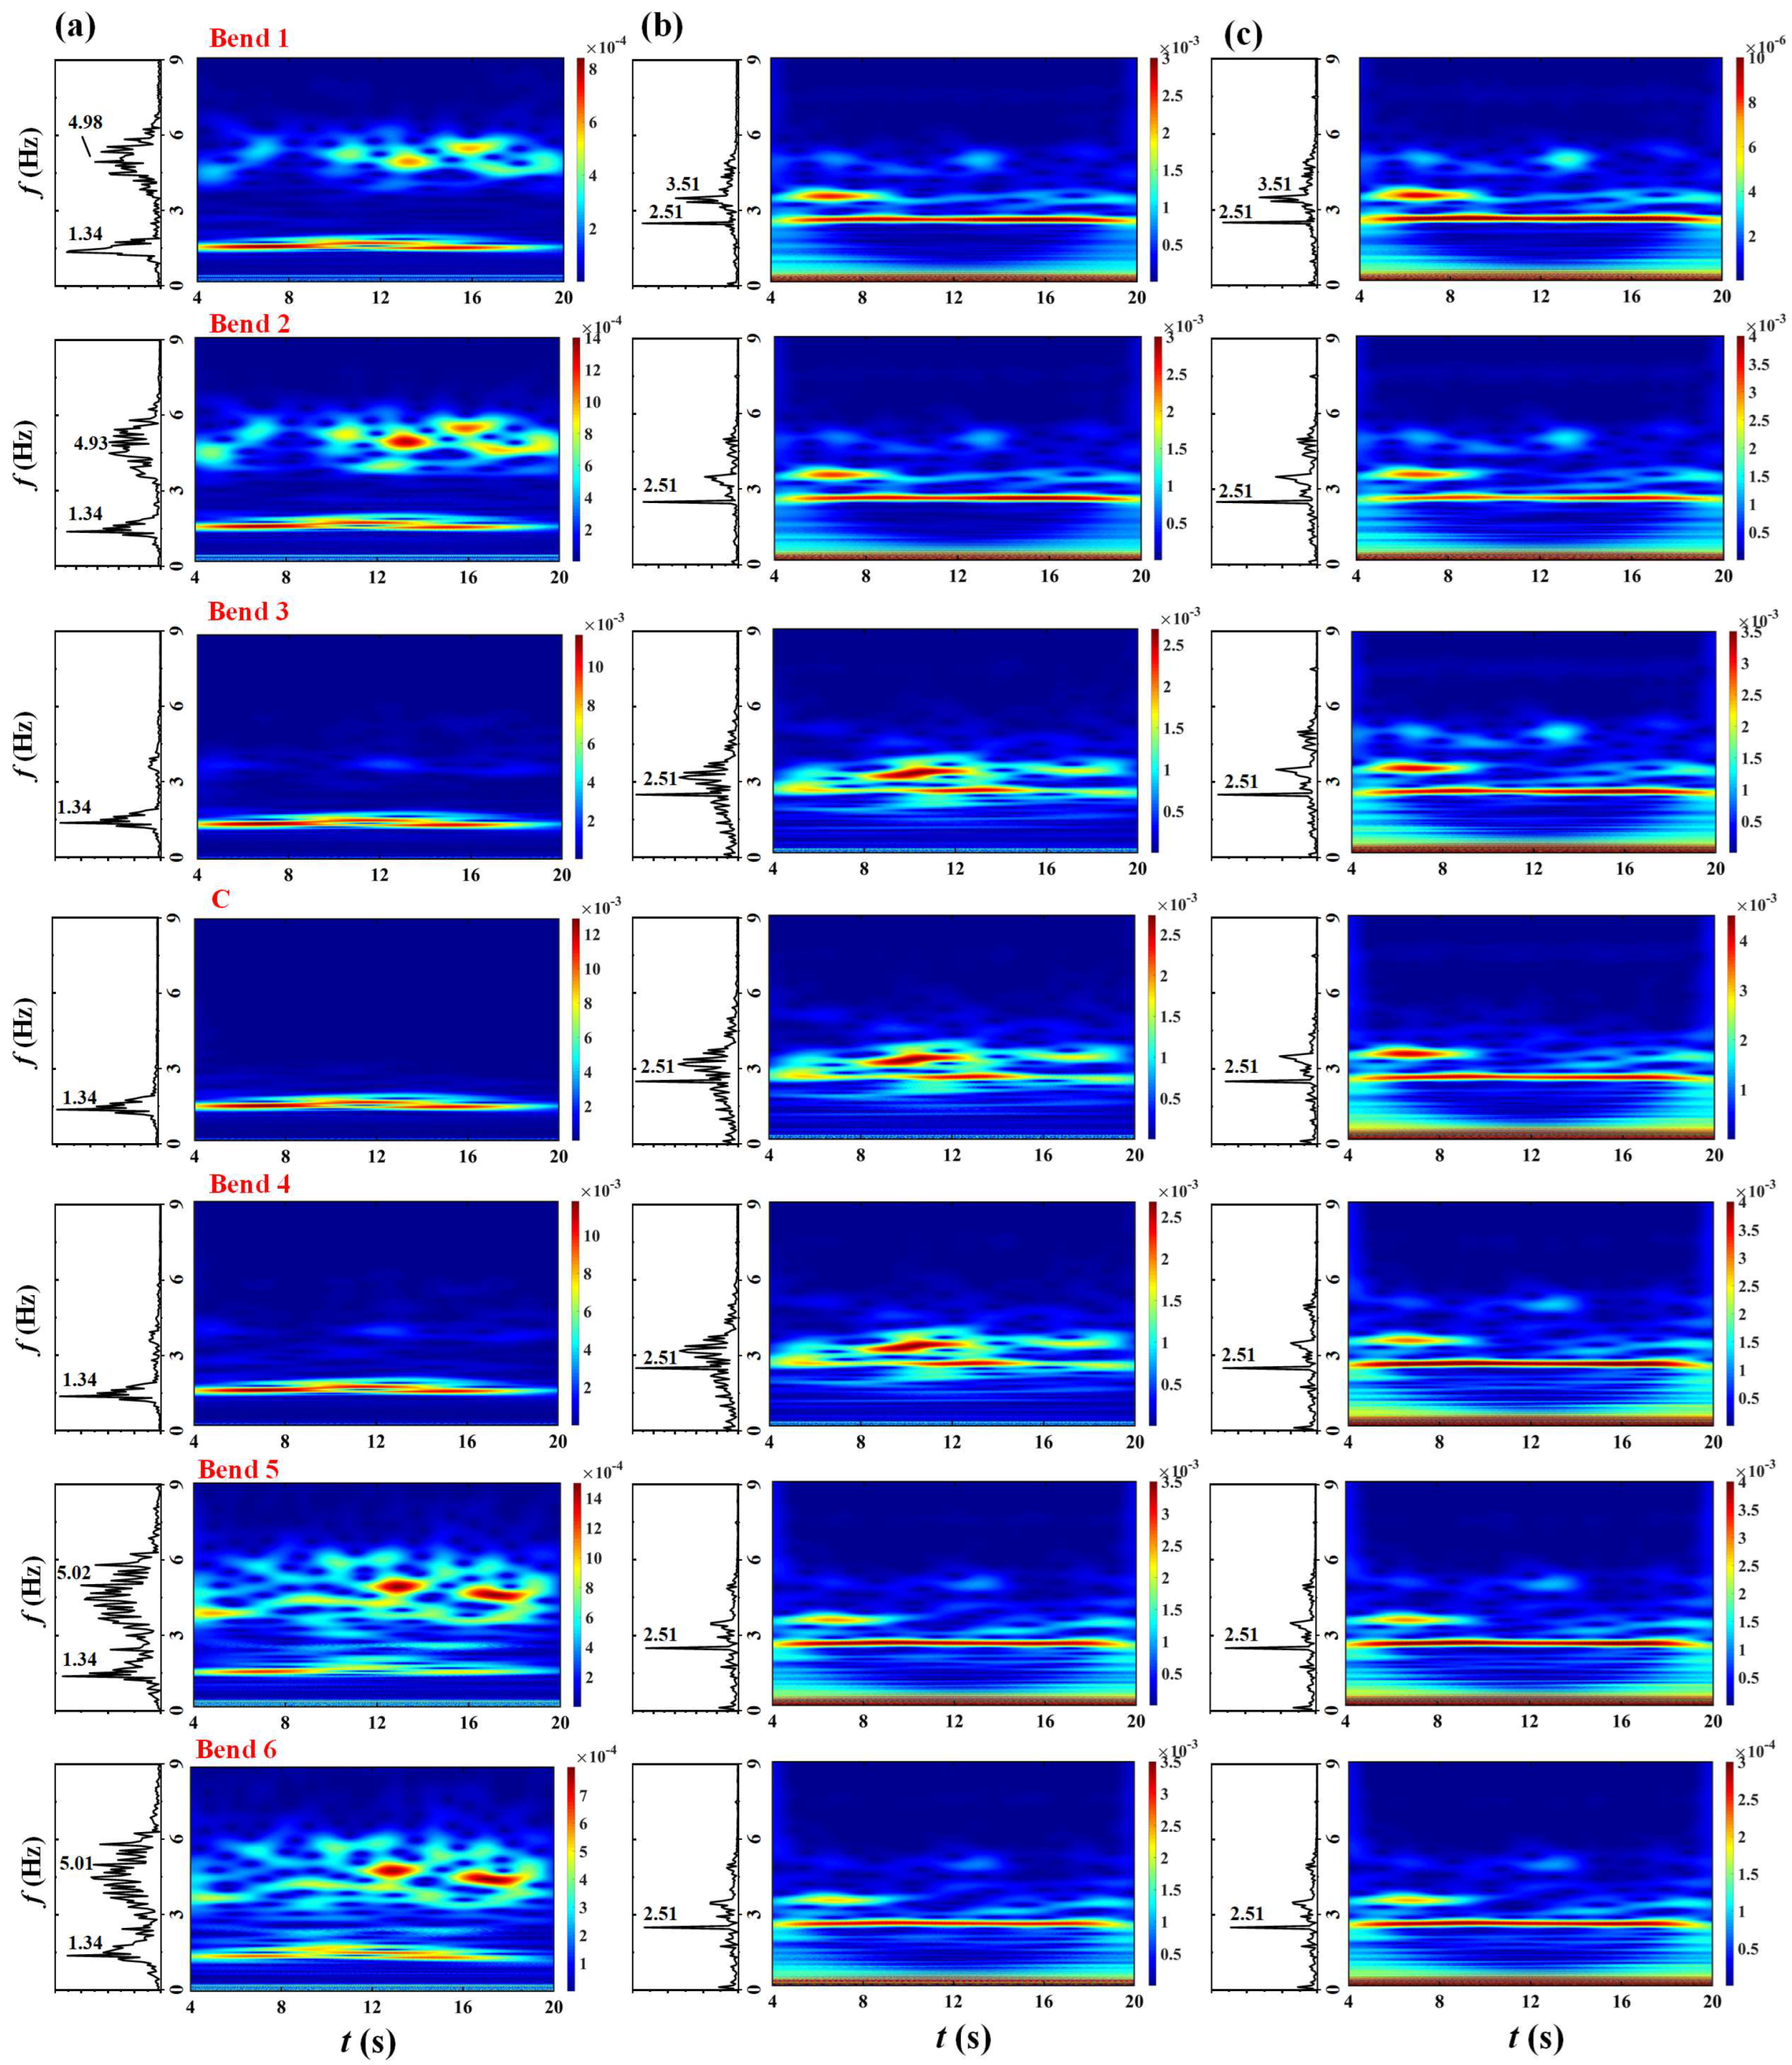
- Both the in-plane and out-of-plane responses of the jumper exhibit spatial-temporal variation characteristics. Due to the end constraints, the bends close to both ends experience negligible displacements in the vertical and out-of-plane directions. However, the horizontal displacements are identifiable for the two bends but in the opposite offset directions. The oscillation becomes prominent in the middle span and the connected bends. Furthermore, the out-of-plane response is more vigorous than the in-plane vibration. The largest out-of-plane amplitude as well as the maximum downward displacement occur at the midspan of the jumper, attributed to the concentrated energy at a single frequency close to the fundamental natural frequency. The in-plane response is dominated by the inflow slug frequency, owing to the occurrence of flow turns in the jumper plane. As β reduces, the out-of-plane response of the midspan of the jumper is suppressed while the in-plane response is enhanced. Moreover, the multi-frequency competition becomes more intense in the jumper plane. By contrary, both the in-plane and out-of-plane oscillations are enhanced with increasing vm.
Author Contributions
Funding
Data Availability Statement
Acknowledgments
Conflicts of Interest
References
- Sun, L.; Kang, Y. Installation strength analysis of subsea flowline jumpers. J. Mar. Sci. Appl. 2015, 14, 316–326. [Google Scholar] [CrossRef]
- Zhu, H.J.; Gao, Y.; Zhao, H.L. Coupling vibration response of a curved flexible riser under the combination of internal slug flow and external shear current. J. Fluids Struct. 2019, 91, 102724. [Google Scholar] [CrossRef]
- Zhu, H.J.; Hu, J.; Gao, Y.; Zhao, H.L.; Xu, W.H. Spatial-temporal mode transition in vortex-induced vibration of catenary flexible riser. J. Fluid Struct. 2021, 102, 103234. [Google Scholar] [CrossRef]
- Lu, Y.; Liang, C.; Manzano-Ruiz, J.J.; Janardhanan, K.; Perng, Y. Flow-Induced Vibration in Subsea Jumper Subject to Downstream Slug and Ocean Current. J. Offshore Mech. Arct. Eng. 2016, 138, 021302. [Google Scholar] [CrossRef]
- Van der Heijden, B.; Smienk, H.; Metrikine, A.V. Fatigue analysis of subsea jumpers due to slug flow. In Proceedings of the 33rd International Conference on Ocean, Offshore and Arctic Engineering, San Francisco, CA, USA, 8–13 June 2014. [Google Scholar]
- Tamunodienye, I.; Zhu, H.J.; Srinil, N. 3-D numerical simulations of liquid-gas flow development in subsea jumper with variable flow rates. In Proceedings of the 2020 International Conference on Ships and Offshore Structures, Glasgow, UK, 1–4 September 2020. [Google Scholar]
- Al-Ruhaimani, F.; Pereyra, E.; Sarica, C.; Al-Safran, E.; Chung, S.; Torres, C. A study on the effect of high liquid viscosity on slug flow characteristics in upward vertical flow. J. Petrol. Sci. Eng. 2018, 161, 128–146. [Google Scholar] [CrossRef]
- Babakhani Dehkordi, P.; Colombo, L.P.M.; Mohammadian, E.; Arnone, D.; Azdarpou, A.; Sotgia, G. Study of viscous oil-water-gas slug flow in a horizontal pipe. J. Petrol. Sci. Eng. 2019, 178, 1–13. [Google Scholar] [CrossRef]
- Pouraria, H.; Seo, J.K.; Paik, J.K. Numerical study of erosion in critical components of subsea pipeline: Tees vs bends. Ships Offshore Struct. 2016, 12, 233–243. [Google Scholar] [CrossRef]
- Hossain, M.; Chinenye-Kanu, N.M.; Droubi, G.M.; Islam, S.Z. Investigation of slug-churn flow induced transient excitation forces at pipe bend. J. Fluids Struct. 2019, 91, 102733. [Google Scholar] [CrossRef]
- Bakkouch, M.; Minguez, M. Riser base jumper slugging analysis by CFD simulations. In Proceedings of the 32nd International Conference on Ocean, Offshore and Arctic Engineering, Nantes, France, 8–13 June 2013. [Google Scholar]
- Zhu, H.; Gao, Y.; Zhao, H.L. Experimental investigation on the flow-induced vibration of a free-hanging flexible riser by internal unstable hydrodynamic slug flow. Ocean Eng. 2018, 164, 488–507. [Google Scholar] [CrossRef]
- Zhu, H.; Gao, Y.; Srinil, N.; Bao, Y. Mode switching and standing-travelling waves in slug flow-induced vibration of catenary riser. J. Petrol. Sci. Eng. 2021, 203, 108310. [Google Scholar] [CrossRef]
- Chica, L.; Pascali, R.; Jukes, P.; Ozturk, B.; Gamino, M.; Smith, K. Detailed FSI analysis methodology for subsea piping components. In Proceedings of the 31st International Conference on Ocean, Offshore and Arctic Engineering, Rio de Janeiro, Brazil, 1–6 July 2012. [Google Scholar]
- Elyyan, M.A.; Perng, Y.Y.; Doan, M. Fluid-structure interaction modeling of subsea jumper pipe. In Proceedings of the 33rd International Conference on Ocean, Offshore and Arctic Engineering, San Francisco, CA, USA, 8–13 June 2014. [Google Scholar]
- Zhu, H.; Gao, Y.; Hu, J.; Zhao, H.; Bao, Y. Temporal-spatial mode competition in slug-flow induced vibration of catenary flexible riser in both in plane and out of plane. Appl. Ocean Res. 2022, 119, 103017. [Google Scholar] [CrossRef]
- Jia, D. Slug flow induced vibration in a pipeline span, a jumper, and a riser section. In Proceedings of the 2012 Offshore Technology Conference, Houston, TX, USA, 30 April–3 May 2012. [Google Scholar]
- Jia, D. Effect of boundary conditions, flow rate, slug length, and slug frequency on slug flow induced vibration in a pipeline span. In Proceedings of the 2013 Offshore Technology Conference, Houston, TX, USA, 6–9 May 2013. [Google Scholar]
- Pontaza, J.P.; Menon, R.G. Flow-induced vibrations of subsea jumpers due to internal multi-phase flow. In Proceedings of the 30th International Conference on Ocean, Offshore and Arctic Engineering, Rotterdam, The Netherlands, 19–24 June 2011. [Google Scholar]
- Dukler, A.E.; Maron, D.M.; Brauner, N. A physical model for predicting the minimum stable slug length. Chem. Eng. Sci. 1985, 40, 1379–1385. [Google Scholar] [CrossRef]
- Staurland, G.; Aamodt, M. Designing offshore pipeline systems divided into sections of different design pressures. In Proceedings of the 2004 International Pipeline Conference, Calgary, AB, Canada, 4–8 October 2004; Volumes 1–3, pp. 1935–1943. [Google Scholar]
- Pijl, S.P.V.D.; Segal, A.; Vuik, C. A mass conserving level set (MCLS) method for modeling of multi-phase flows. Int. J. Numer. Meth. Fluids 2005, 47, 339–361. [Google Scholar] [CrossRef]
- Abdulkadir, M.; Hernandez-Perez, V.; Lo, S.; Lowndes, I.; Azzopardi, B.J. Comparison of experimental and computational fluid dynamics (CFD) studies of slug flow in a vertical riser. Exp. Therm. Fluid Sci. 2015, 68, 468–483. [Google Scholar] [CrossRef]
- Araujo, J.D.P.; Miranda, J.M.; Campos, J.B.L.M. CFD study of the hydrodynamics of slug flow systems: Interaction between consecutive taylor bubbles. Int. J. Chem. React. Eng. 2015, 13, 541–549. [Google Scholar] [CrossRef]
- Alfonsi, G. Reynolds-averaged Navier-Stokes equations for turbulence modeling. Appl. Mech. Rev. 2009, 62, 040802. [Google Scholar] [CrossRef]
- Ishii, M.; Hibiki, T. Thermo-Fluid Dynamics of Two-Phase Flow; Springer: New York, NY, USA, 2010. [Google Scholar]
- Zhu, H.; Lin, P.; Pan, Q. A CFD (computational fluid dynamic) simulation for oil leakage from damaged submarine pipeline. Energy 2014, 64, 887–899. [Google Scholar] [CrossRef]
- Orszag, S.A.; Yakhot, V.; Flannery, W.S.; Boysan, F.; Choudhury, D.; Maruzewski, J.; Patel, B. Renormalization group modeling and turbulence simulations. In Proceedings of the International Conference on Near-Wall Turbulent Flows, Tempe, AZ, USA, 15–17 March 1993. [Google Scholar]
- Yakhot, V.; Orszag, S.A.; Thangam, S.; Gatski, T.B.; Speziale, C.G. Development of turbulence models for shear flows by a double expansion technique. Phys. Fluids A 1992, 4, 1510–1520. [Google Scholar] [CrossRef] [Green Version]
- Barth, T.J.; Jespersen, D. The design and application of upwind schemes on unstructured meshes. Technical Report AIAA-89-0366. In Proceedings of the AIAA 27th Aerospace Sciences Meeting, Reno, NV, USA, 9–12 January 1989. [Google Scholar]
- Hoff, C.; Hughes, T.J.R.; Hulbert, G.; Pahl, P.J. Extended comparison of the Hilber-Hughes-Taylor α-method and the θ1-method. Computer Meth. Appl. Mech. Eng. 1989, 76, 87–93. [Google Scholar] [CrossRef]
- Deng, L.; Zhang, Y.; Kennedy, D. Dynamics of 3D sliding beams undergoing large overall motions. Commun. Nonlinear Sci. Numer. Sim. 2021, 3, 105778. [Google Scholar] [CrossRef]
- Bamidele, O.E.; Ahmed, W.H.; Hassan, M. Characterizing two-phase flow-induced vibration in piping structures with U-bends. Int. J. Multiphase Flow. 2022, 151, 104042. [Google Scholar] [CrossRef]


| Parameter | Value | Unit |
|---|---|---|
| Length of vertical tube in both ends, L1 | 4 | m |
| Length of each top horizontal tube, L2 | 3 | m |
| Length of each inward vertical tube, L3 | 6 | m |
| Length of the bottom tube, L4 | 10 | m |
| Internal diameter, d | 0.21 | m |
| External diameter, D | 0.27 | m |
| Curvature radius of connecting bend, R/D | 2 | / |
| Young’s modulus, E | 2.068 × 10¹¹ | Pa |
| Poisson’s ratio, μ | 0.303 | / |
| Case | Tgas/Toil (β) | vgas (m/s) | voil (m/s) |
|---|---|---|---|
| 1 | 1:1 | 3 | 3 |
| 2 | 1:2 | 3 | 3 |
| 3 | 1:3 | 3 | 3 |
| 4 | 1:4 | 3 | 3 |
| 5 | 1:5 | 3 | 3 |
| 6 | 1:1 | 2 | 2 |
| 7 | 1:1 | 4 | 4 |
| 8 | 1:1 | 5 | 5 |
| 9 | 1:1 | 6 | 6 |
| Mesh | Elements of Fluid Domain | Elements of Solid Domain | PRMS at Bend 2 (Pa) | PRMS at Bend 3 (Pa) | PRMS at Bend 4 (Pa) | XRMS of Bend 2 (mm) | XRMS of Bend 3 (mm) | XRMS of Bend 4 (mm) |
|---|---|---|---|---|---|---|---|---|
| M1 | 201,427 | 21,360 | 33,336.94 | 43,216.98 | 39,352.24 | 0.072 | 0.394 | 0.444 |
| M2 | 313,721 | 41,139 | 38,114.12 (14.33%) | 49,358.11 (14.21%) | 45,330.01 (15.19%) | 0.083 (14.82%) | 0.453 (14.97%) | 0.509 (14.53%) |
| M3 | 403,958 | 61,220 | 41,986.51 (10.16%) | 54,205.08 (9.82%) | 49,967.27 (10.23%) | 0.091 (10.06%) | 0.498 (9.93%) | 0.559 (9.76%) |
| M4 | 512,647 | 82,098 | 43,854.91 (4.45%) | 56,552.16 (4.36%) | 52,470.63 (5.01%) | 0.095 (4.93%) | 0.525 (5.42%) | 0.586 (4.85%) |
| M5 | 628,326 | 101,431 | 44,039.10 (0.42%) | 56,863.19 (0.51%) | 52,932.37 (0.88%) | 0.096 (0.68%) | 0.527 (0.38%) | 0.589 (0.53%) |
Publisher’s Note: MDPI stays neutral with regard to jurisdictional claims in published maps and institutional affiliations. |
© 2022 by the authors. Licensee MDPI, Basel, Switzerland. This article is an open access article distributed under the terms and conditions of the Creative Commons Attribution (CC BY) license (https://creativecommons.org/licenses/by/4.0/).
Share and Cite
Zhu, H.; Hu, Y.; Tang, T.; Ji, C.; Zhou, T. Evolution of Gas-Liquid Two-Phase Flow in an M-Shaped Jumper and the Resultant Flow-Induced Vibration Response. Processes 2022, 10, 2133. https://doi.org/10.3390/pr10102133
Zhu H, Hu Y, Tang T, Ji C, Zhou T. Evolution of Gas-Liquid Two-Phase Flow in an M-Shaped Jumper and the Resultant Flow-Induced Vibration Response. Processes. 2022; 10(10):2133. https://doi.org/10.3390/pr10102133
Chicago/Turabian StyleZhu, Hongjun, Youning Hu, Tang Tang, Chunning Ji, and Tongming Zhou. 2022. "Evolution of Gas-Liquid Two-Phase Flow in an M-Shaped Jumper and the Resultant Flow-Induced Vibration Response" Processes 10, no. 10: 2133. https://doi.org/10.3390/pr10102133
APA StyleZhu, H., Hu, Y., Tang, T., Ji, C., & Zhou, T. (2022). Evolution of Gas-Liquid Two-Phase Flow in an M-Shaped Jumper and the Resultant Flow-Induced Vibration Response. Processes, 10(10), 2133. https://doi.org/10.3390/pr10102133