
Experiment on Gas–Liquid Sulfur Relative Permeability under High-Temperature High-Pressure Sour Gas Reservoir Condition


Abstract
:1. Introduction
2. Experimental Methodology
2.1. Experimental Principle
2.2. Experimental Equipment and Conditions
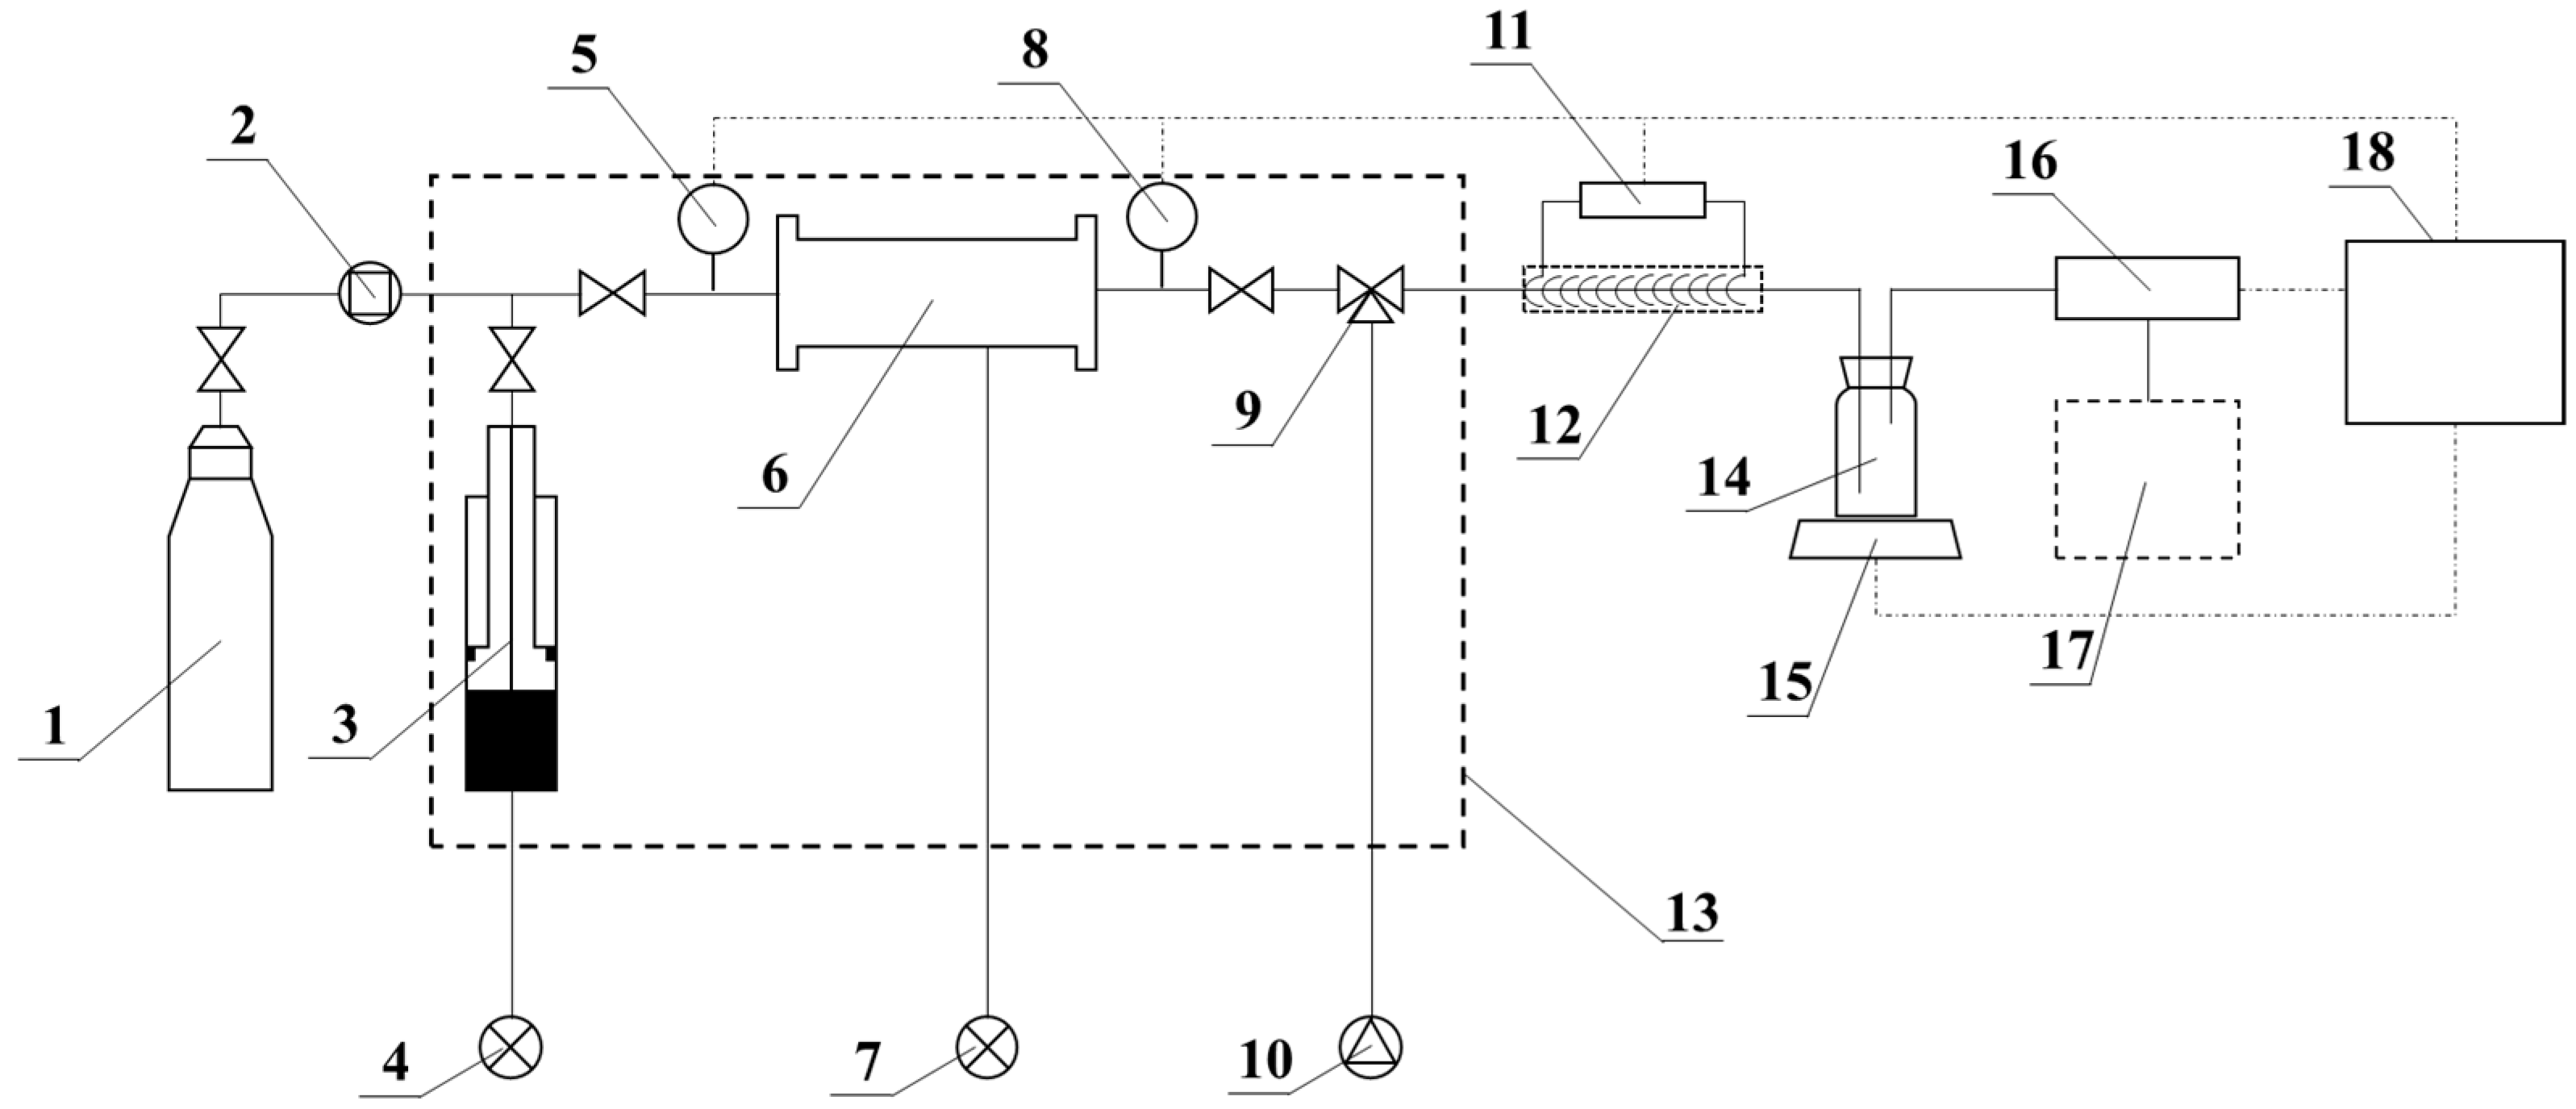
2.2.1. Experimental Equipment
- (a)
- Displacement system including the gas booster pump, displacement pump, medium container.
- (b)
- Simulation system including the core holder, automatic tracking confining pressure pump, back-pressure valve, back-pressure bump, and thermotank.
- (c)
- Data acquisition and control system including the pressure transmitter, temperature controller, electronic balance, electronic gas flowmeter, and computer. The system can collect the values of pressure, temperature, flow velocity and other parameters as well as control the flow path of the process in real-time.
2.2.2. Experimental Conditions
- (1)
- Temperature and pressure: 130–150 °C; 10–50 MPa.
- (2)
- Experimental sulfur: industrial sulfur with a purity of 99.5%.
- (3)
- Displacement gas: standard nitrogen with a purity of 99.9%.
- (4)
- Experimental core: drilling core samples from a typical sour gas reservoir in Sichuan Basin, China.
2.3. Experimental Preparation
2.3.1. Core Selection and Preparation
2.3.2. Liquid Sulfur Preparation
- (a)
- Wrap the intermediate container evenly with the electric heat-tracing wire, secure it with cable ties.
- (b)
- Add solid sulfur powder to the intermediate container, and close the intermediate container. The sulfur powder should not exceed the bottom of the screw cap.
- (c)
- Turn on the power to heat the intermediate container until the sulfur powder turns into liquid sulfur. Choose a ventilated area for heating.
- (d)
- Because the volume of sulfur powder decreases after it becomes liquid sulfur, the intermediate container must be refilled with sulfur powder and heated again. Repeat the above steps until the liquid sulfur is nearly filled with the intermediate container. Close the intermediate container for experimental use.
2.3.3. Improvement of Experimental Equipment and Process
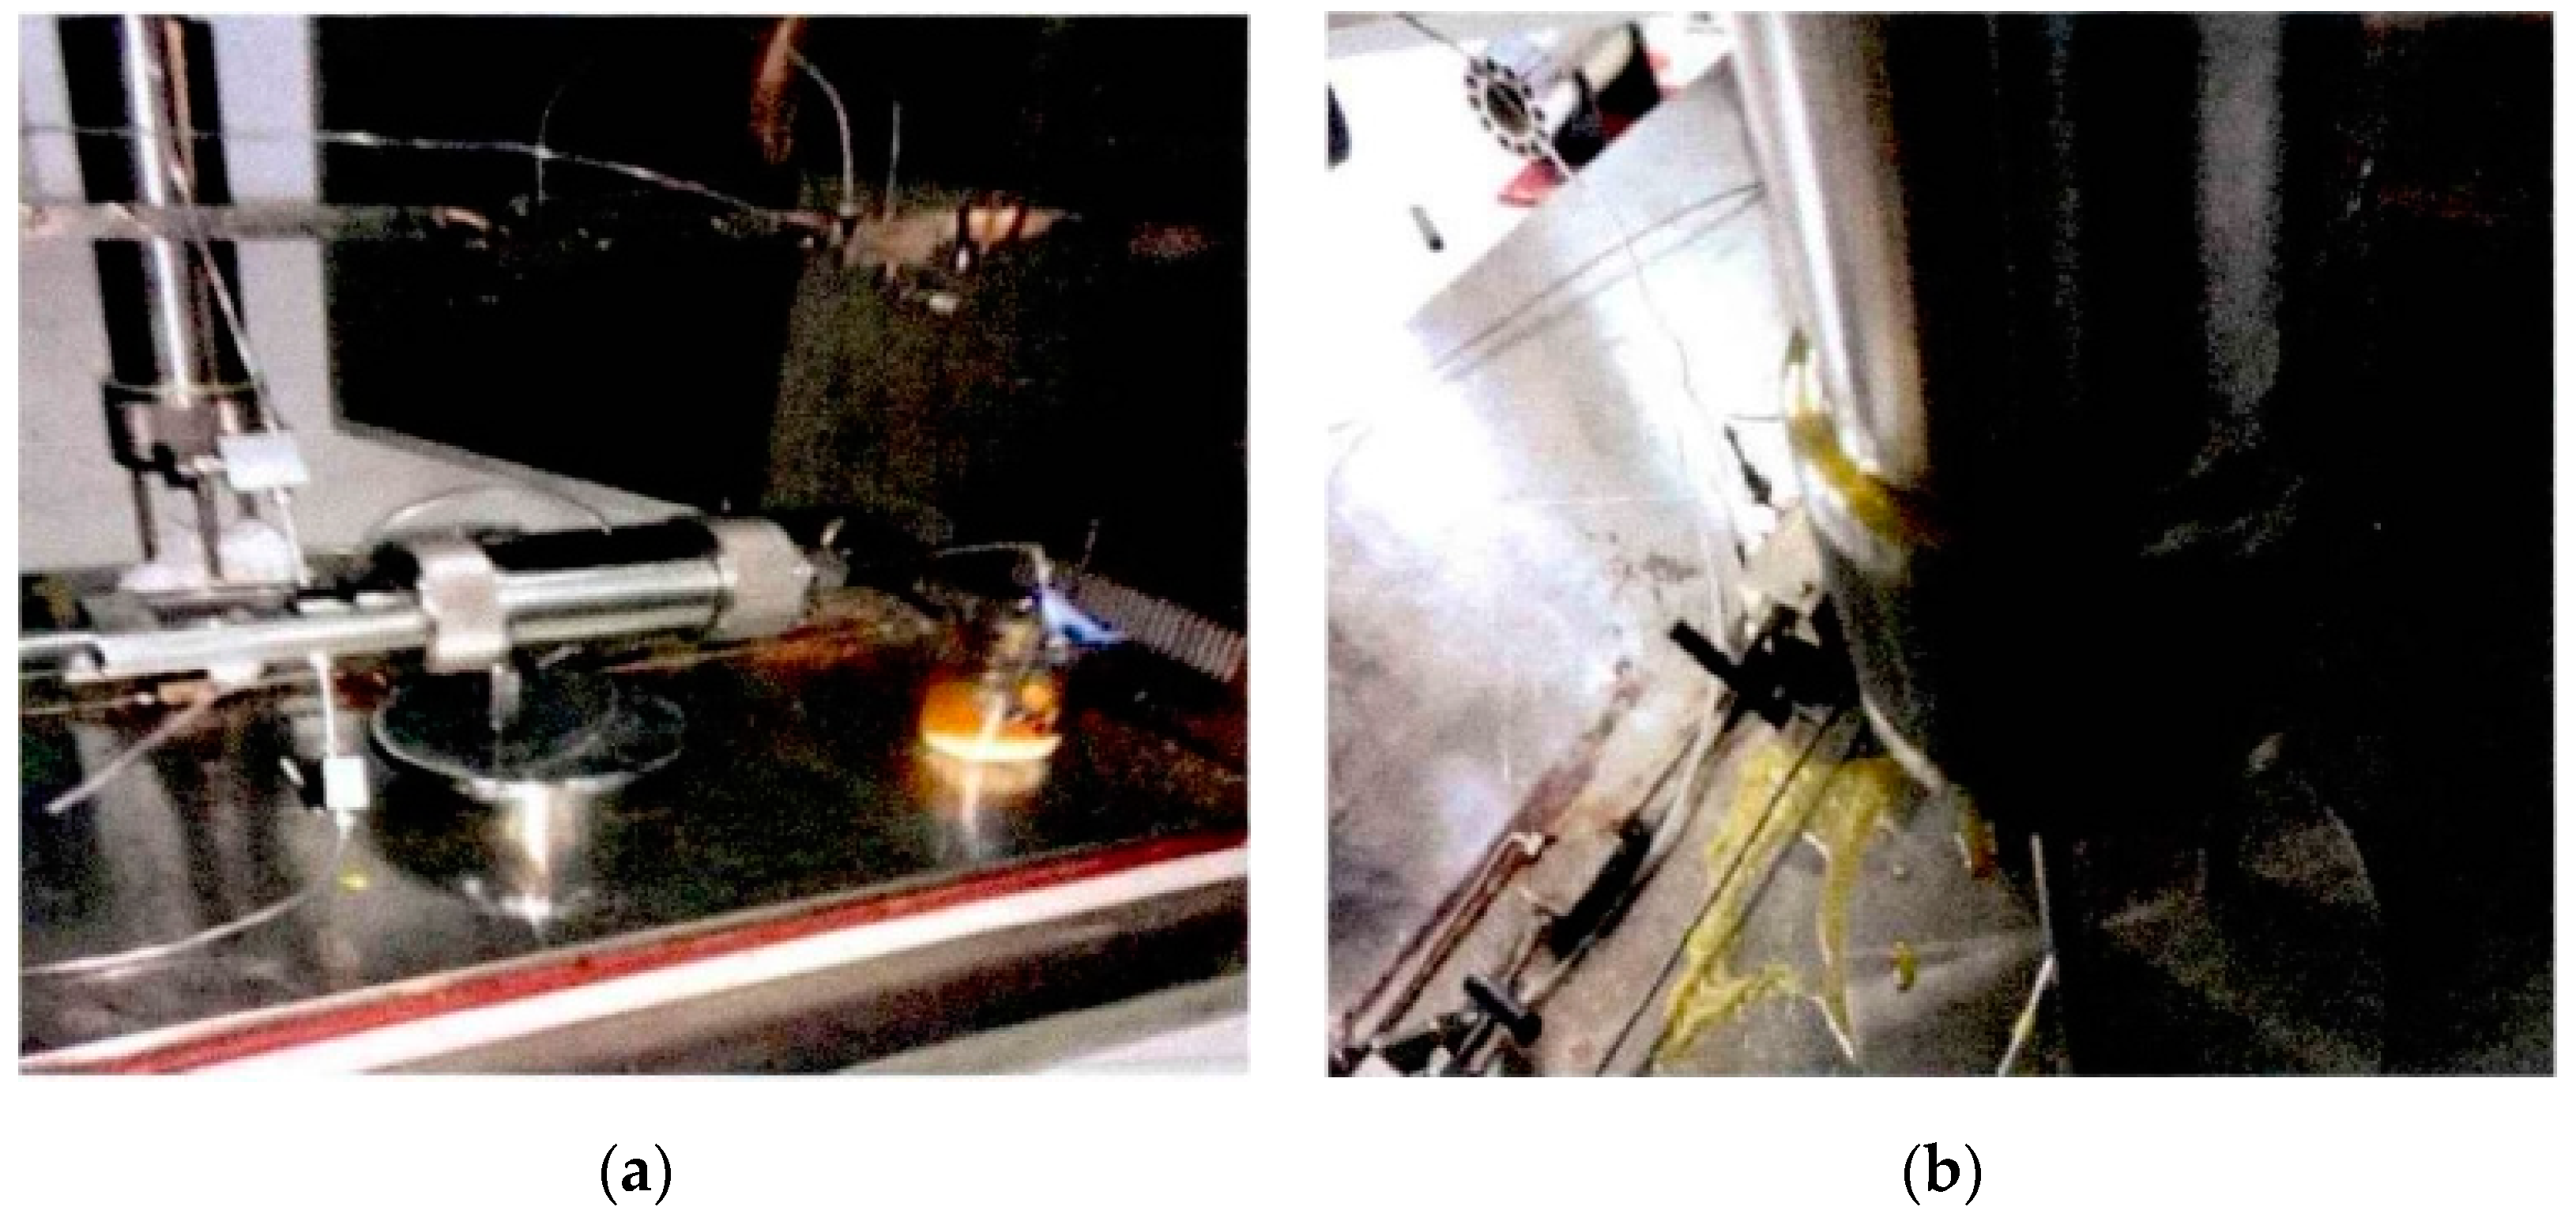
- (a)
- Liquid sulfur burning (Figure 1a). When the displacement liquid sulfur entered the pipeline at the simulated formation temperature (150 °C) at the start of the experiment, it spontaneously ignited and produced sulfur dioxide, which harmed the experiment process and jeopardized the experimenter’s safety.
- (b)
- Pipeline plugging by sulfur (Figure 1b). Because the terminal pipeline was not placed in the thermotank during the experiment, its temperature could not be maintained above the melting point of sulfur, resulting in sulfur plugging in the pipeline. Furthermore, even after reheating the pipeline, the sulfur plugging could not be completely removed.
- (a)
- Cleaning the experiment process with nitrogen in advance to ensure that there was no oxygen in the experiment process and nitrogen was used instead of natural gas to test the gas–liquid sulfur relative permeability.
- (b)
- Wrapping the asbestos mesh evenly around the electric heat-tracing wire and placing the pipeline outside the thermotank. Connect the electric heat-tracing wire to the temperature controller to ensure that the temperature of the pipeline outside the thermostat corresponds to the temperature inside the thermostat.
2.4. Experimental Procedures
- (1)
- Connect each flow line according to the schematic diagram (Figure 3), put the prepared core into the core holder.
- (2)
- Purge and replace the residual air in the experimental equipment with standard nitrogen, and test the air tightness of each sealing link and equipment connection. After the pressure difference and flow rate have been stabilized, record the inlet and outlet pressures and use the Darcy formula to calculate the absolute permeability of the cores. The permeability calculation formula is as follows:
- (3)
- Put the intermediate container filled with liquid sulfur into the thermotank for heating. Adjust the constant temperature system to 50 °C, 90 °C, 120 °C, and 150 °C successively to let the temperature of the constant temperature system rise slowly and steadily. The melted sulfur powder is heated at 150 °C for more than half an hour to ensure the stable liquid state of sulfur.
- (4)
- Maintain the thermotank temperature, turn on the electric heat-tracing wire and temperature controller, and set the temperature to 150 °C. Set the liquid injection rate, then gradually and synchronously increase the pressure of the back pressure valve and the confining pressure of the core gripper to the simulated formation pressure until the core is fully saturated with liquid sulfur.
- (5)
- Replace the liquid sulfur with nitrogen, record the pressure at the core’s inlet and outlet in real-time using the pressure transmitter, and record the total gas production and total liquid sulfur production in real-time using the metering system. The experiment is over when there is no liquid sulfur output at the outlet end.
- (6)
- Repeat the above experimental steps until the difference in the gas relative permeability at critical flow saturation of liquid sulfur between the last two measurements is less than 5%.
- (7)
- Change the core type, temperature, and confining pressure, then repeat the experiment to determine the relative permeability of the gas–liquid sulfur under different core properties, temperature, and stress sensitivity. The experimental scheme is shown in Table 4.
2.5. Data Processing
- (1)
- Amend the cumulative gas production measured at atmospheric pressure at the core’s outlet to the cumulative gas production measured at the average core pressure:
- (2)
- Plot the relationship between cumulative gas production ∑Vg, cumulative sulfur production ∑Vs, and cumulative injection time ∑t to obtain the relation curve of Vg − t and Vs − t.
- (3)
- Take points on the curve to obtain the corresponding gas production ΔVg and sulfur production ΔVs at the same time interval Δt.
- (4)
- Calculate the gas relative permeability Krg and liquid sulfur relative permeability Krs under different liquid sulfur saturation Sg by using the following formula:
- (5)
- Draw a relationship curve between the relative permeability of the gas–liquid sulfur and the saturation of liquid sulfur.
3. Results and Discussion
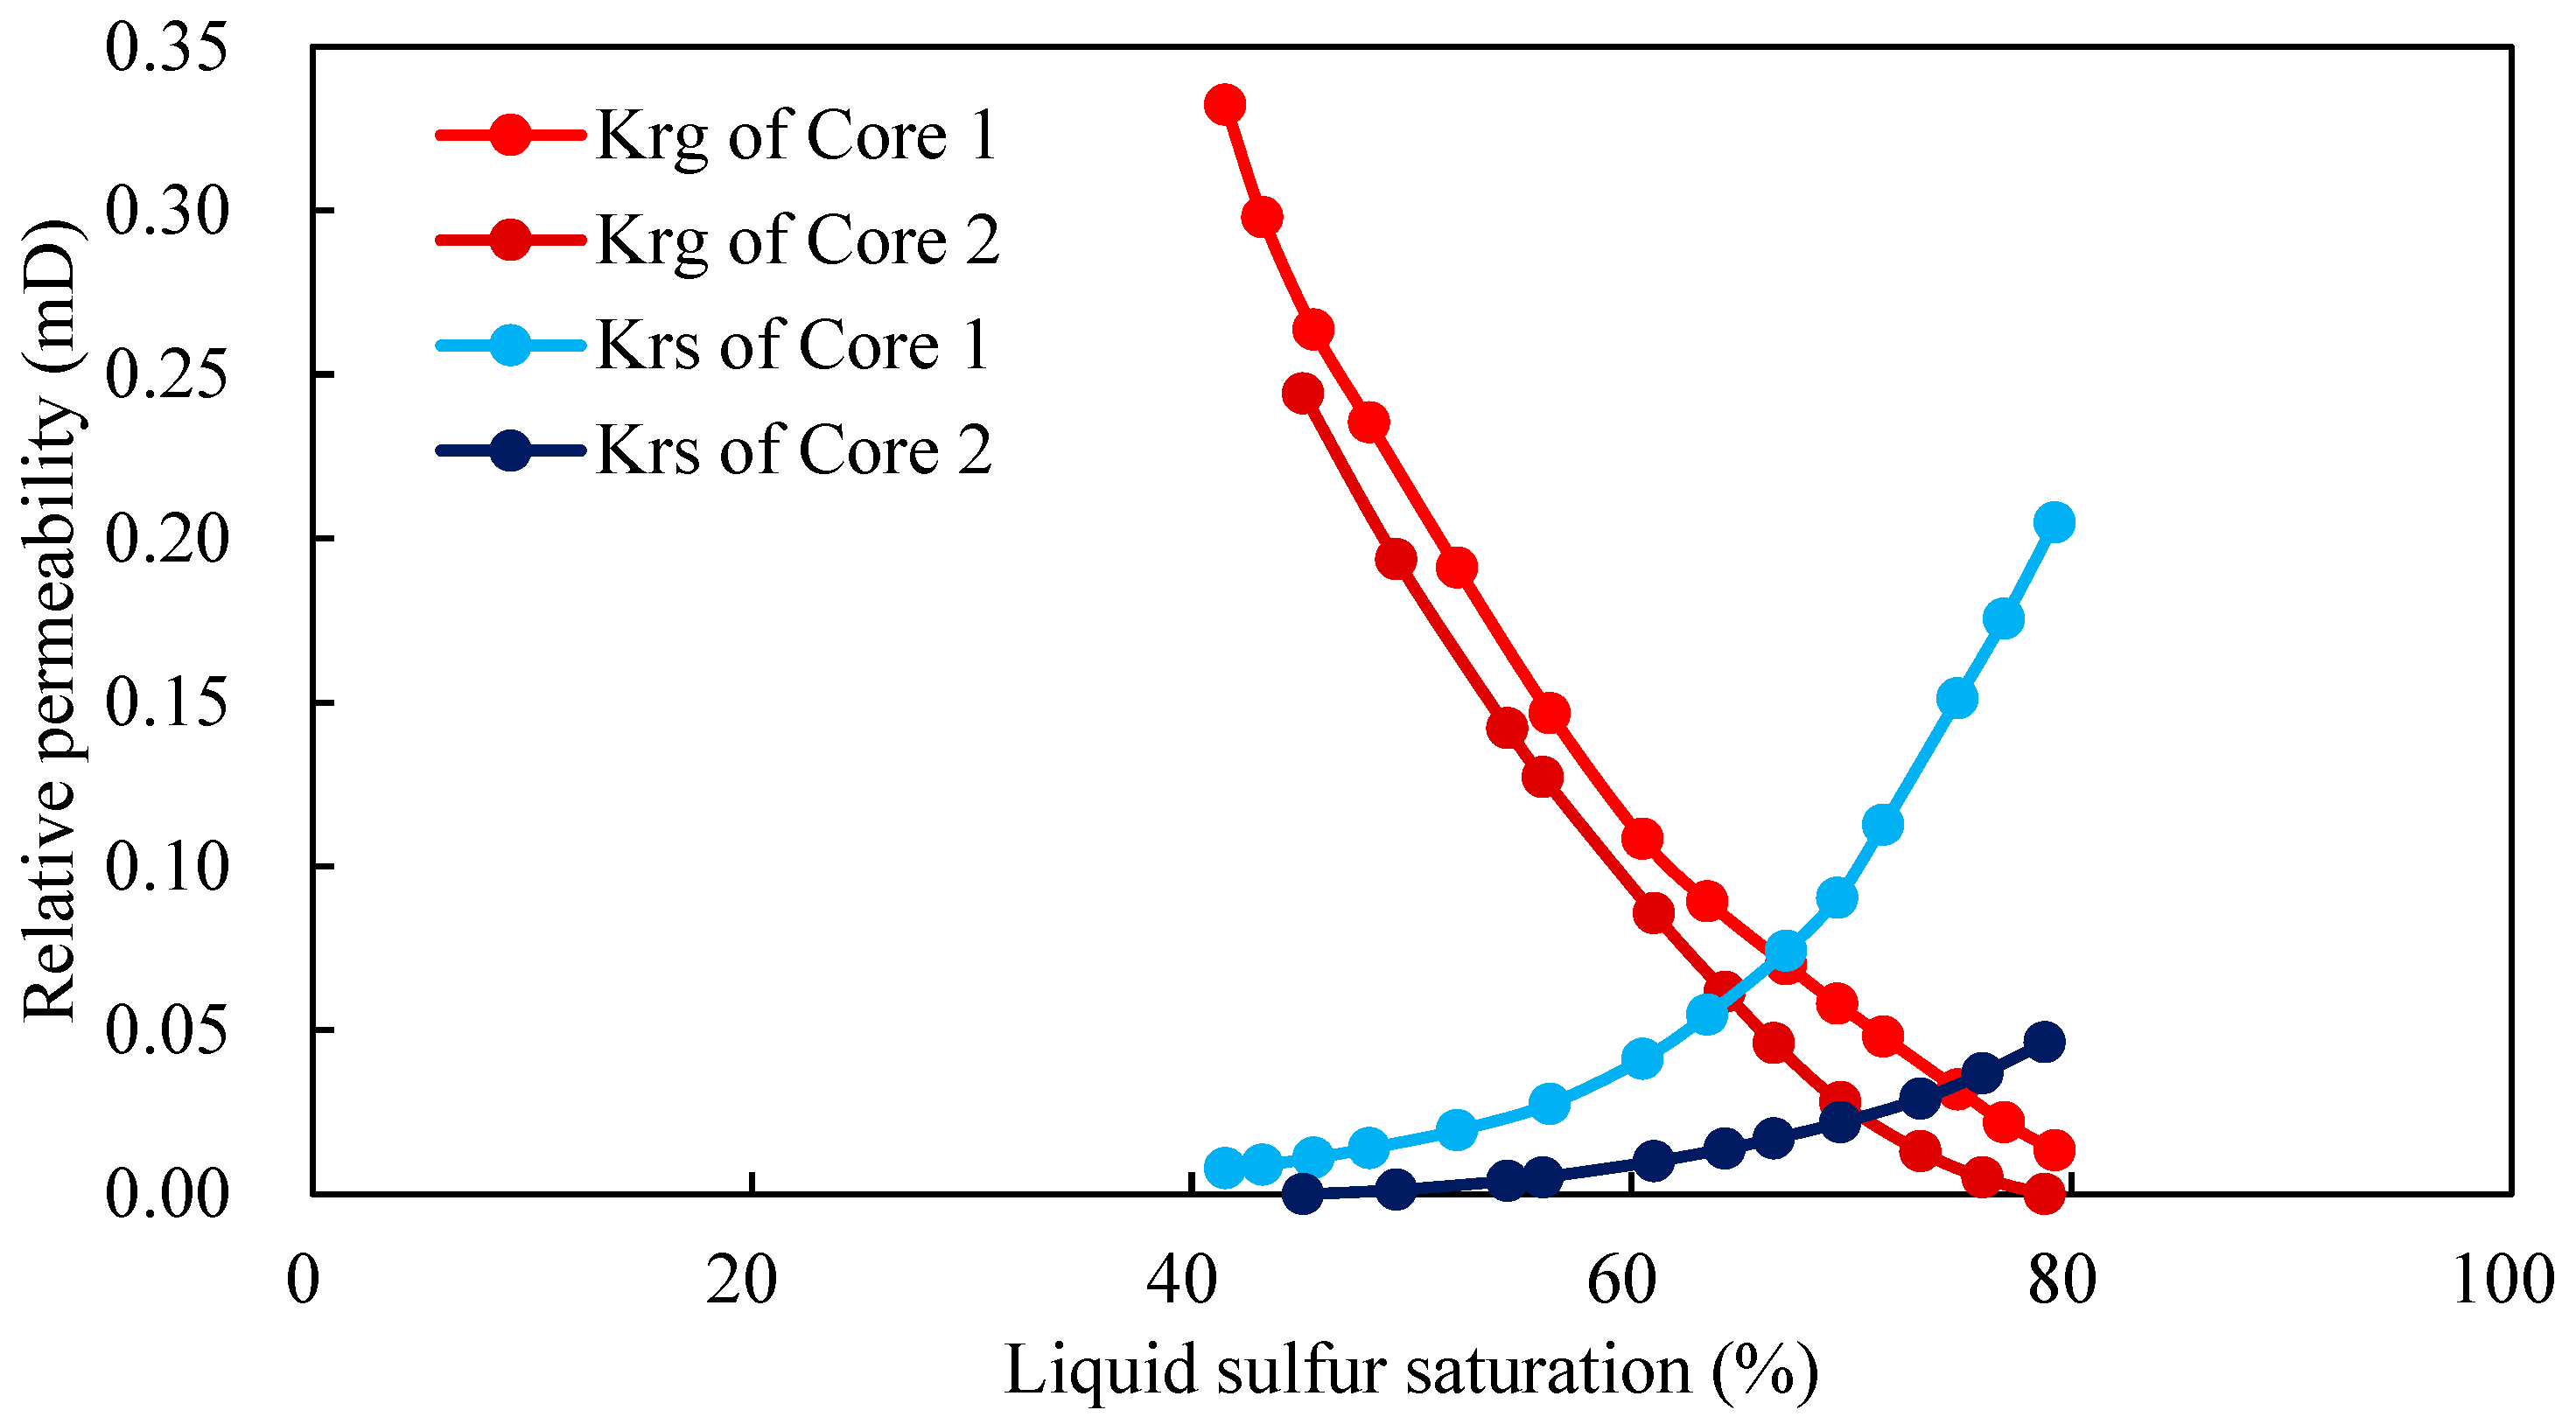
3.1. Characteristics of Gas-Liquid Sulfur Relative Permeability Curve
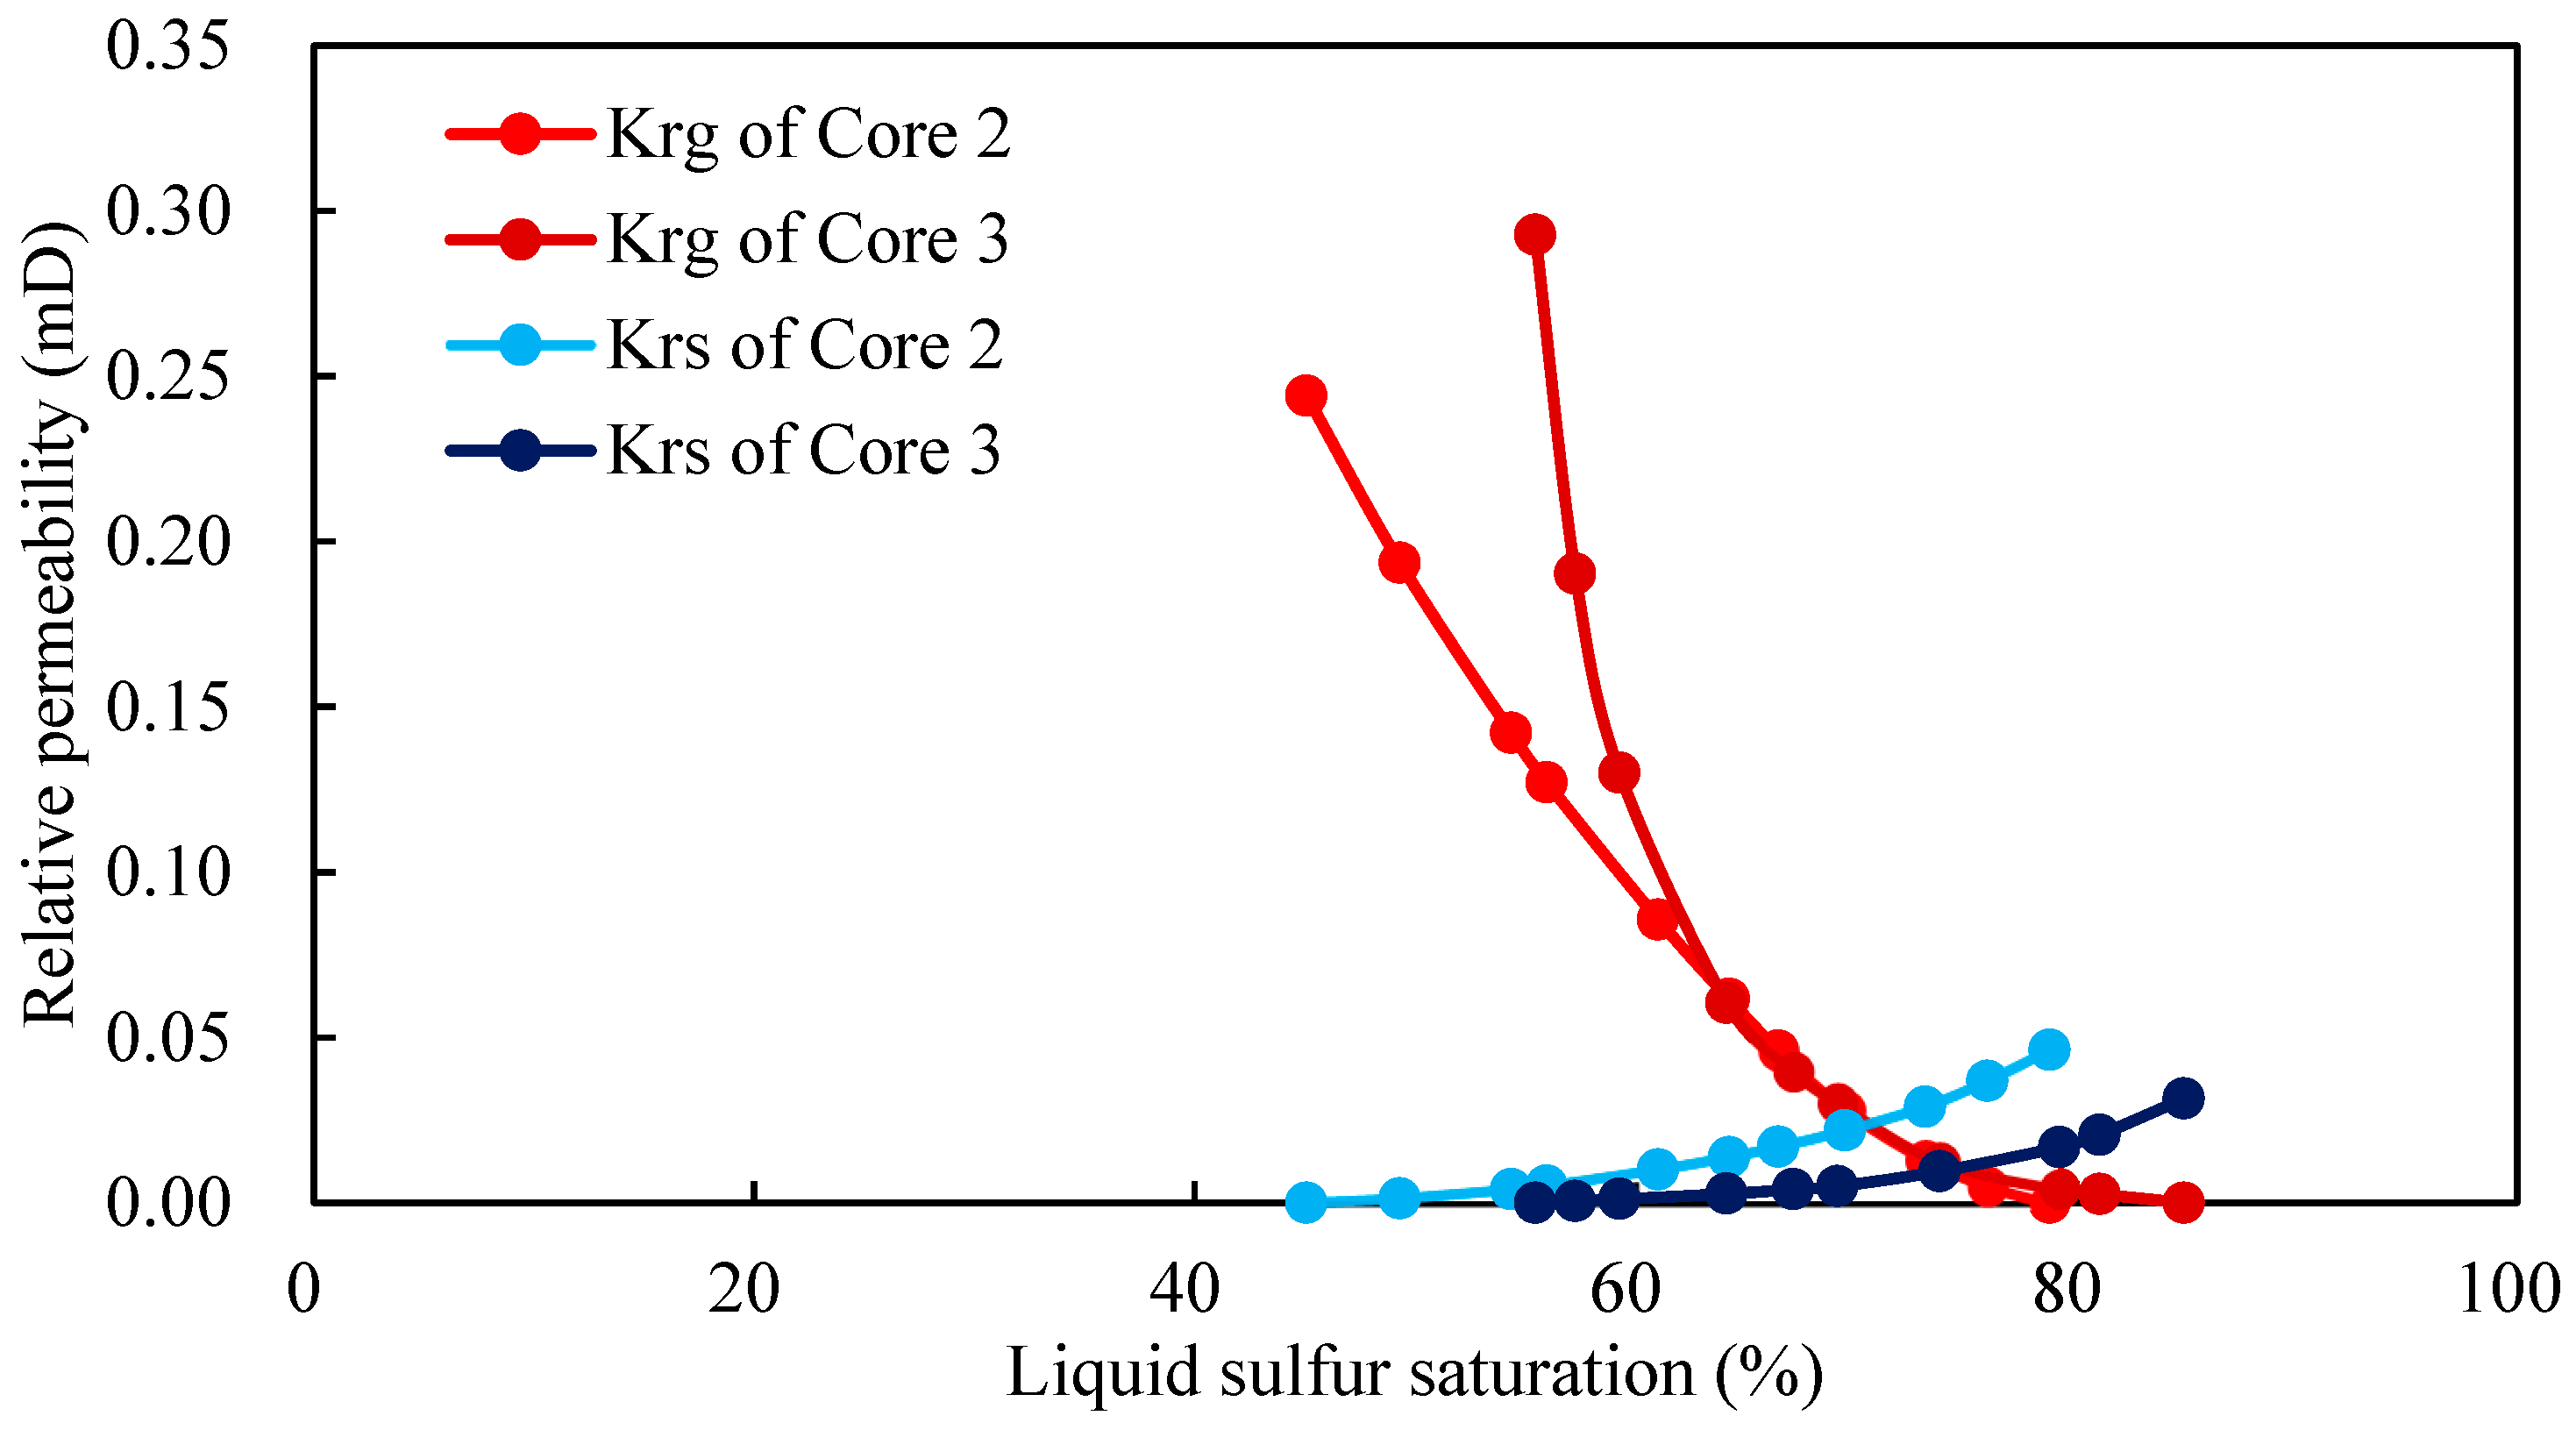
3.2. Effect of Core Type on Relative Permeability Curve
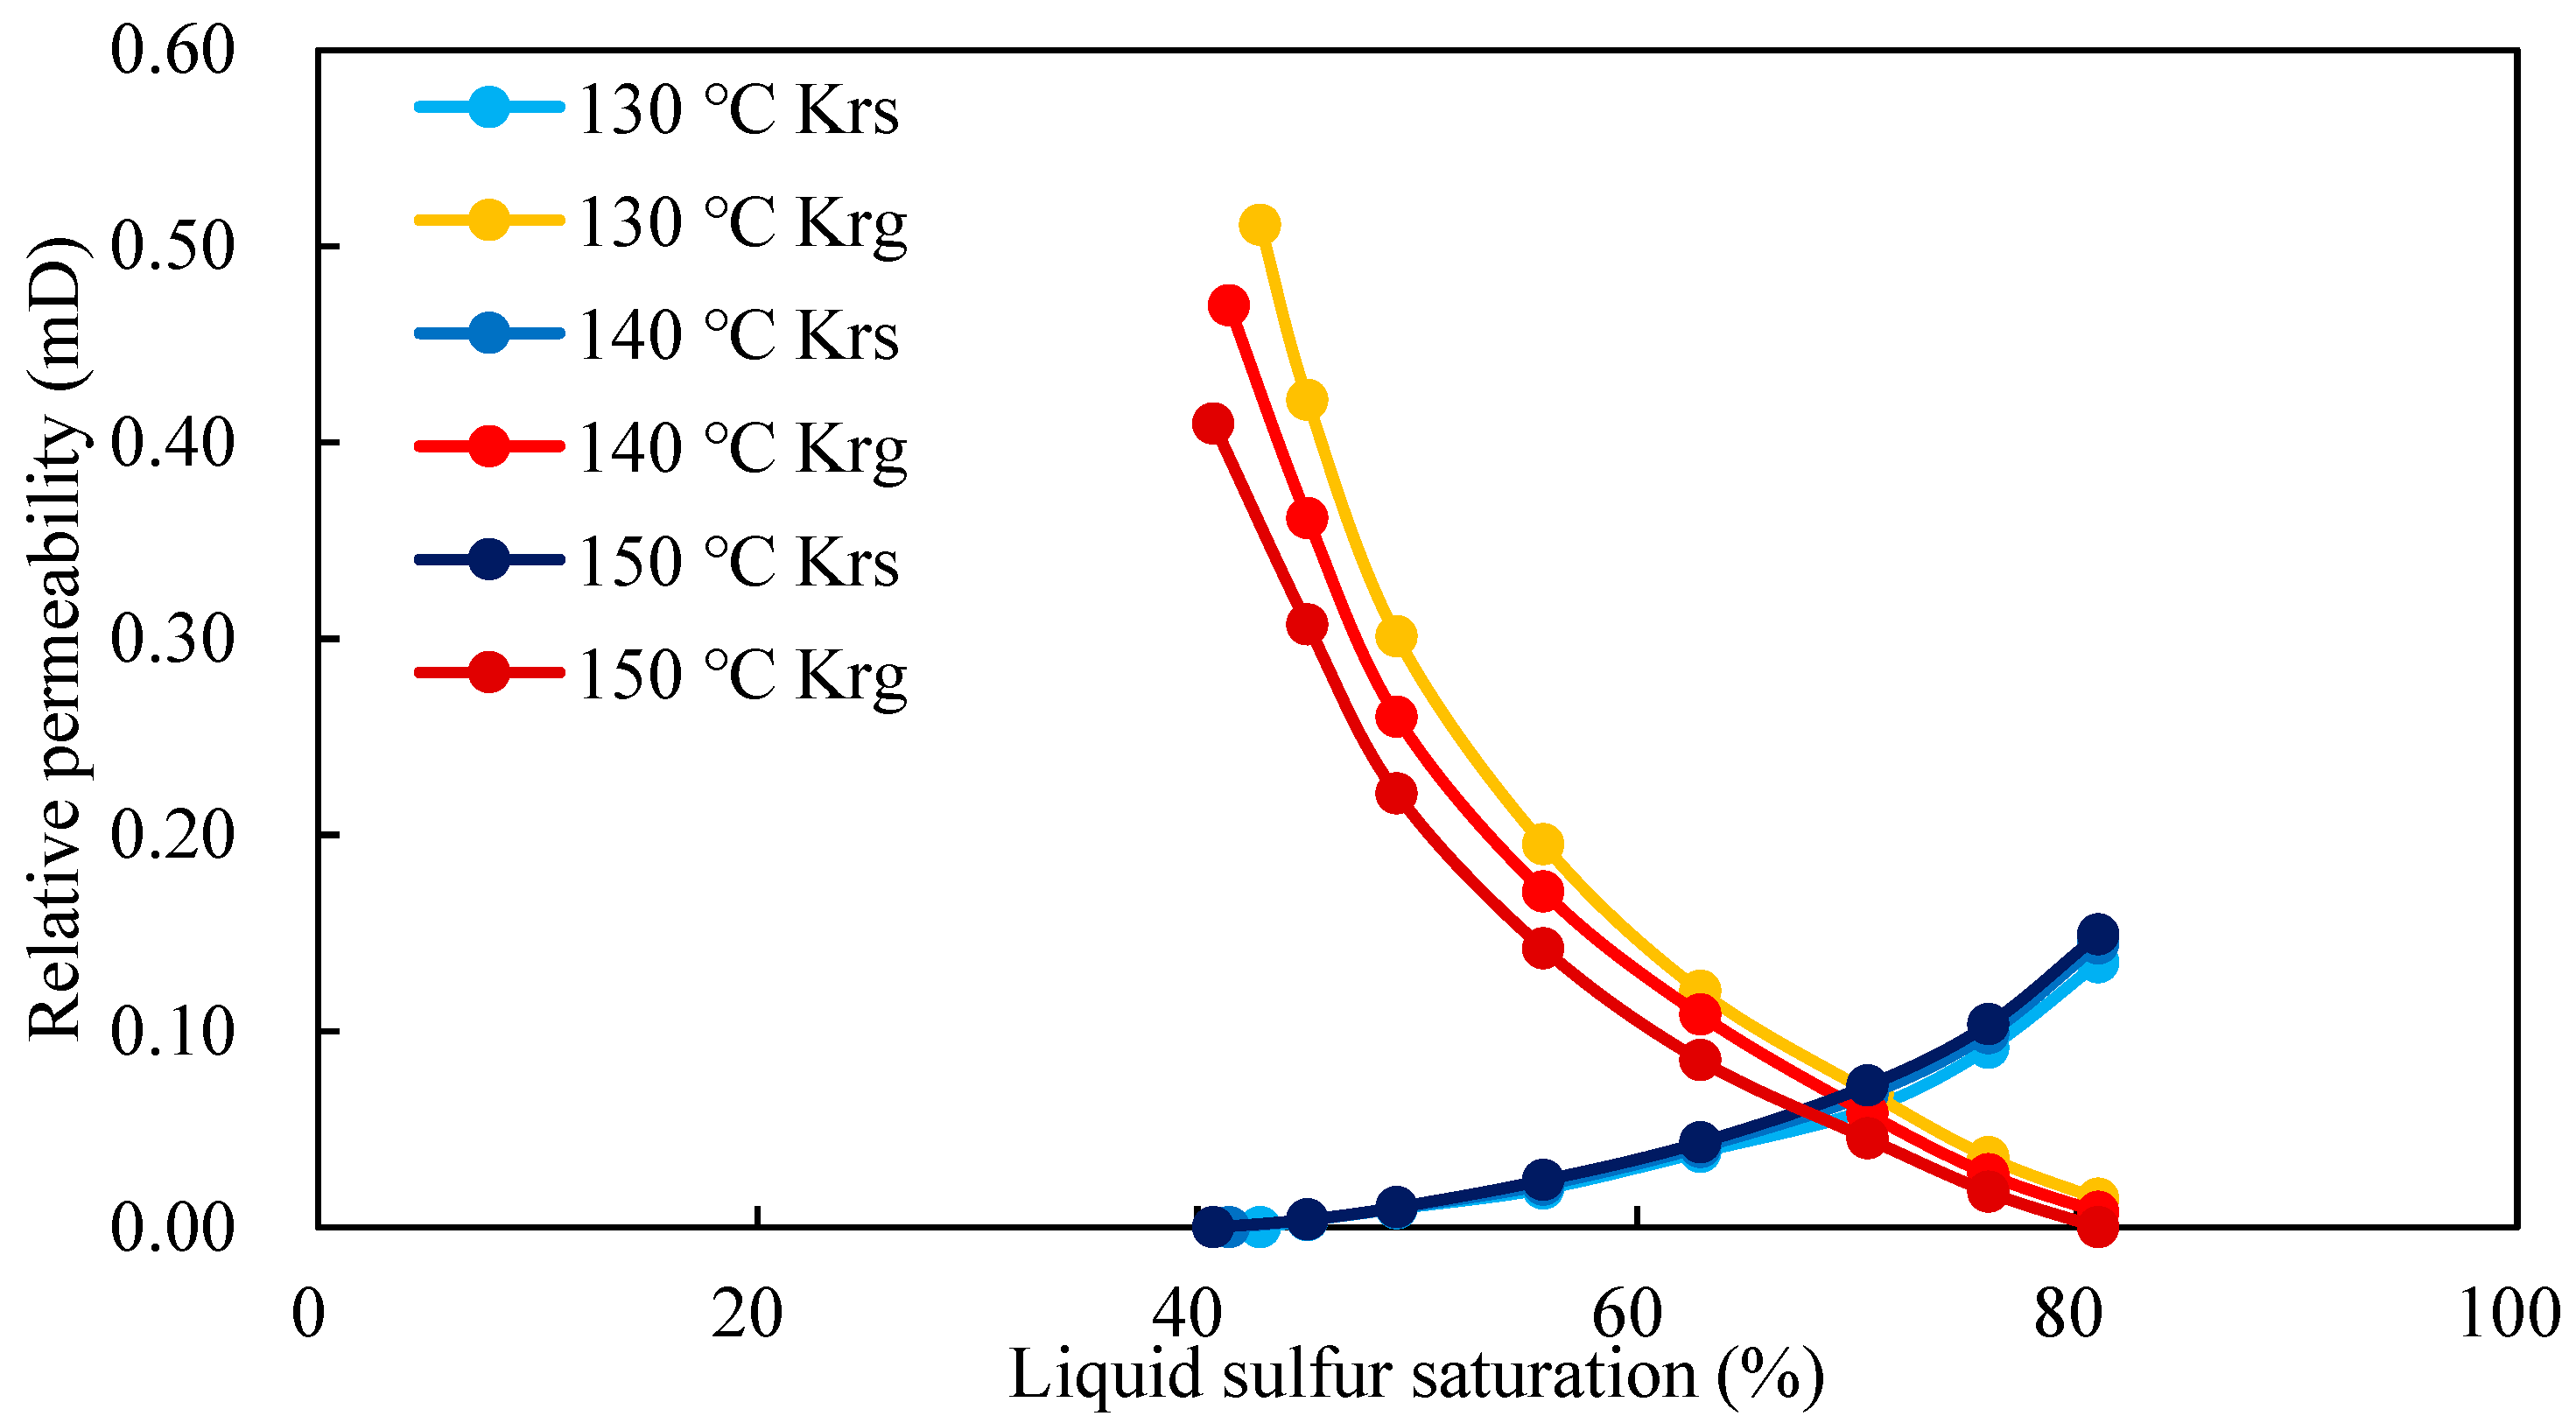
3.3. Effect of Temperature on Relative Permeability Curve
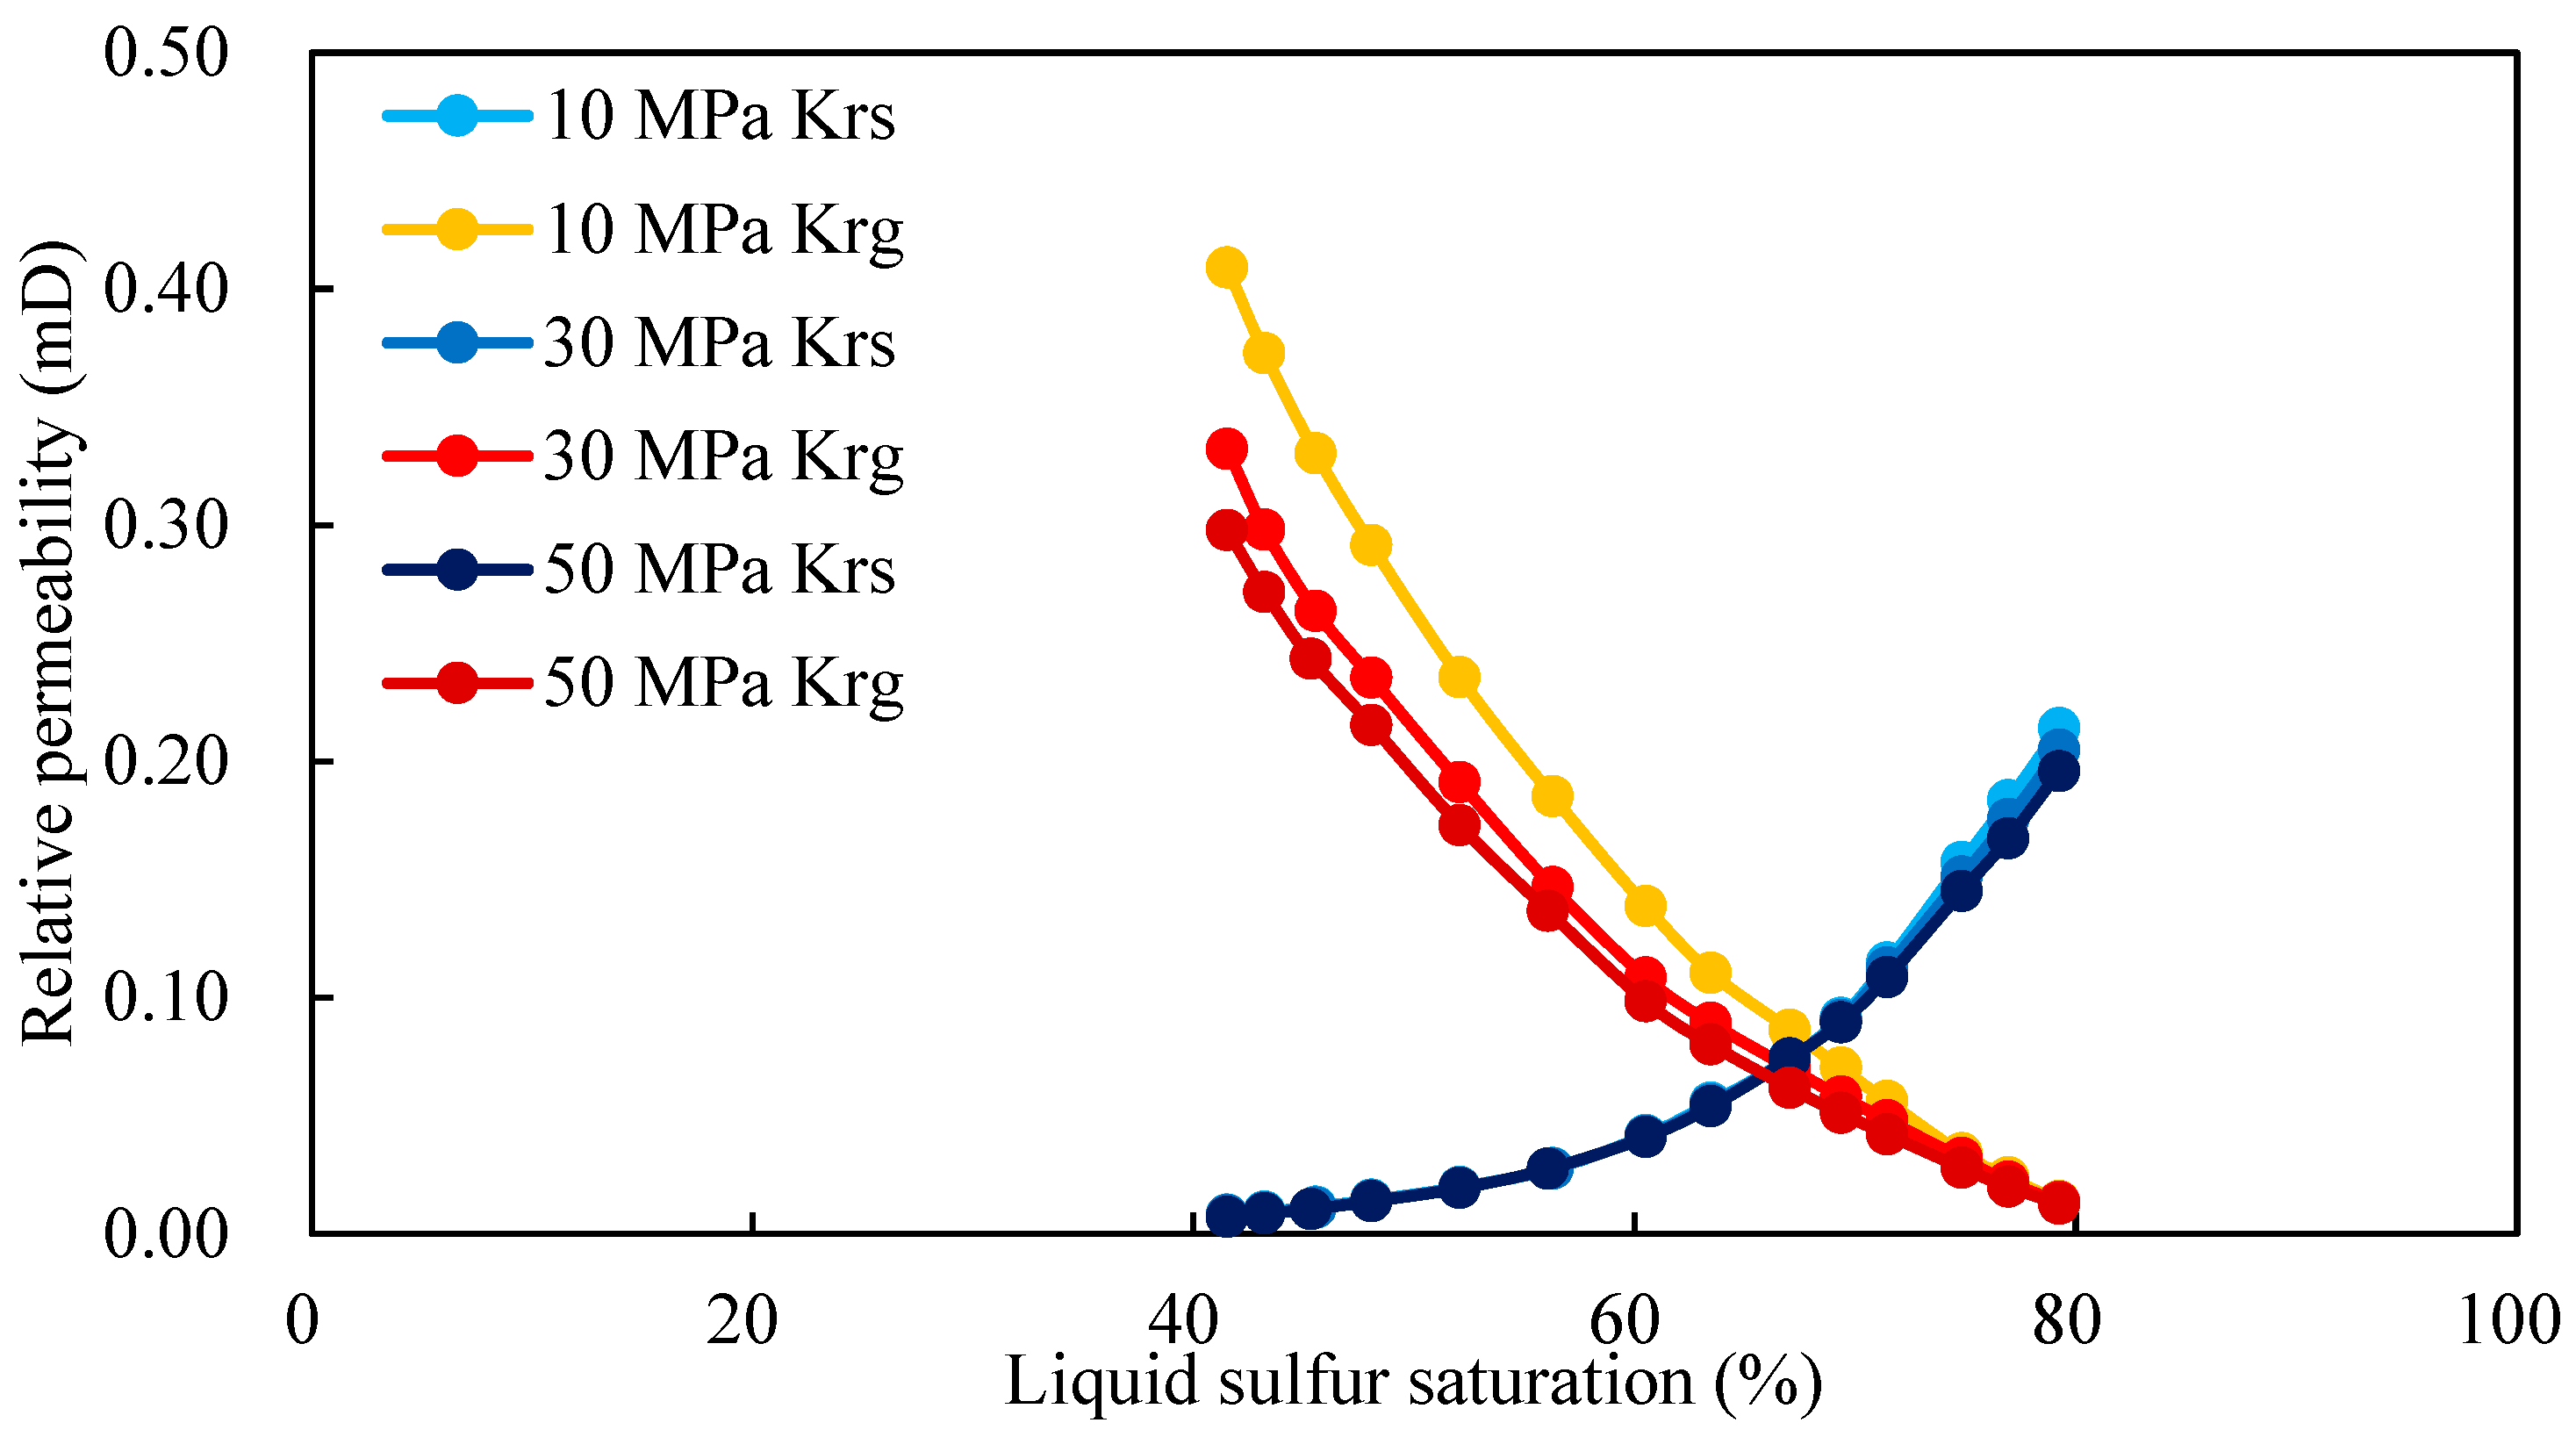
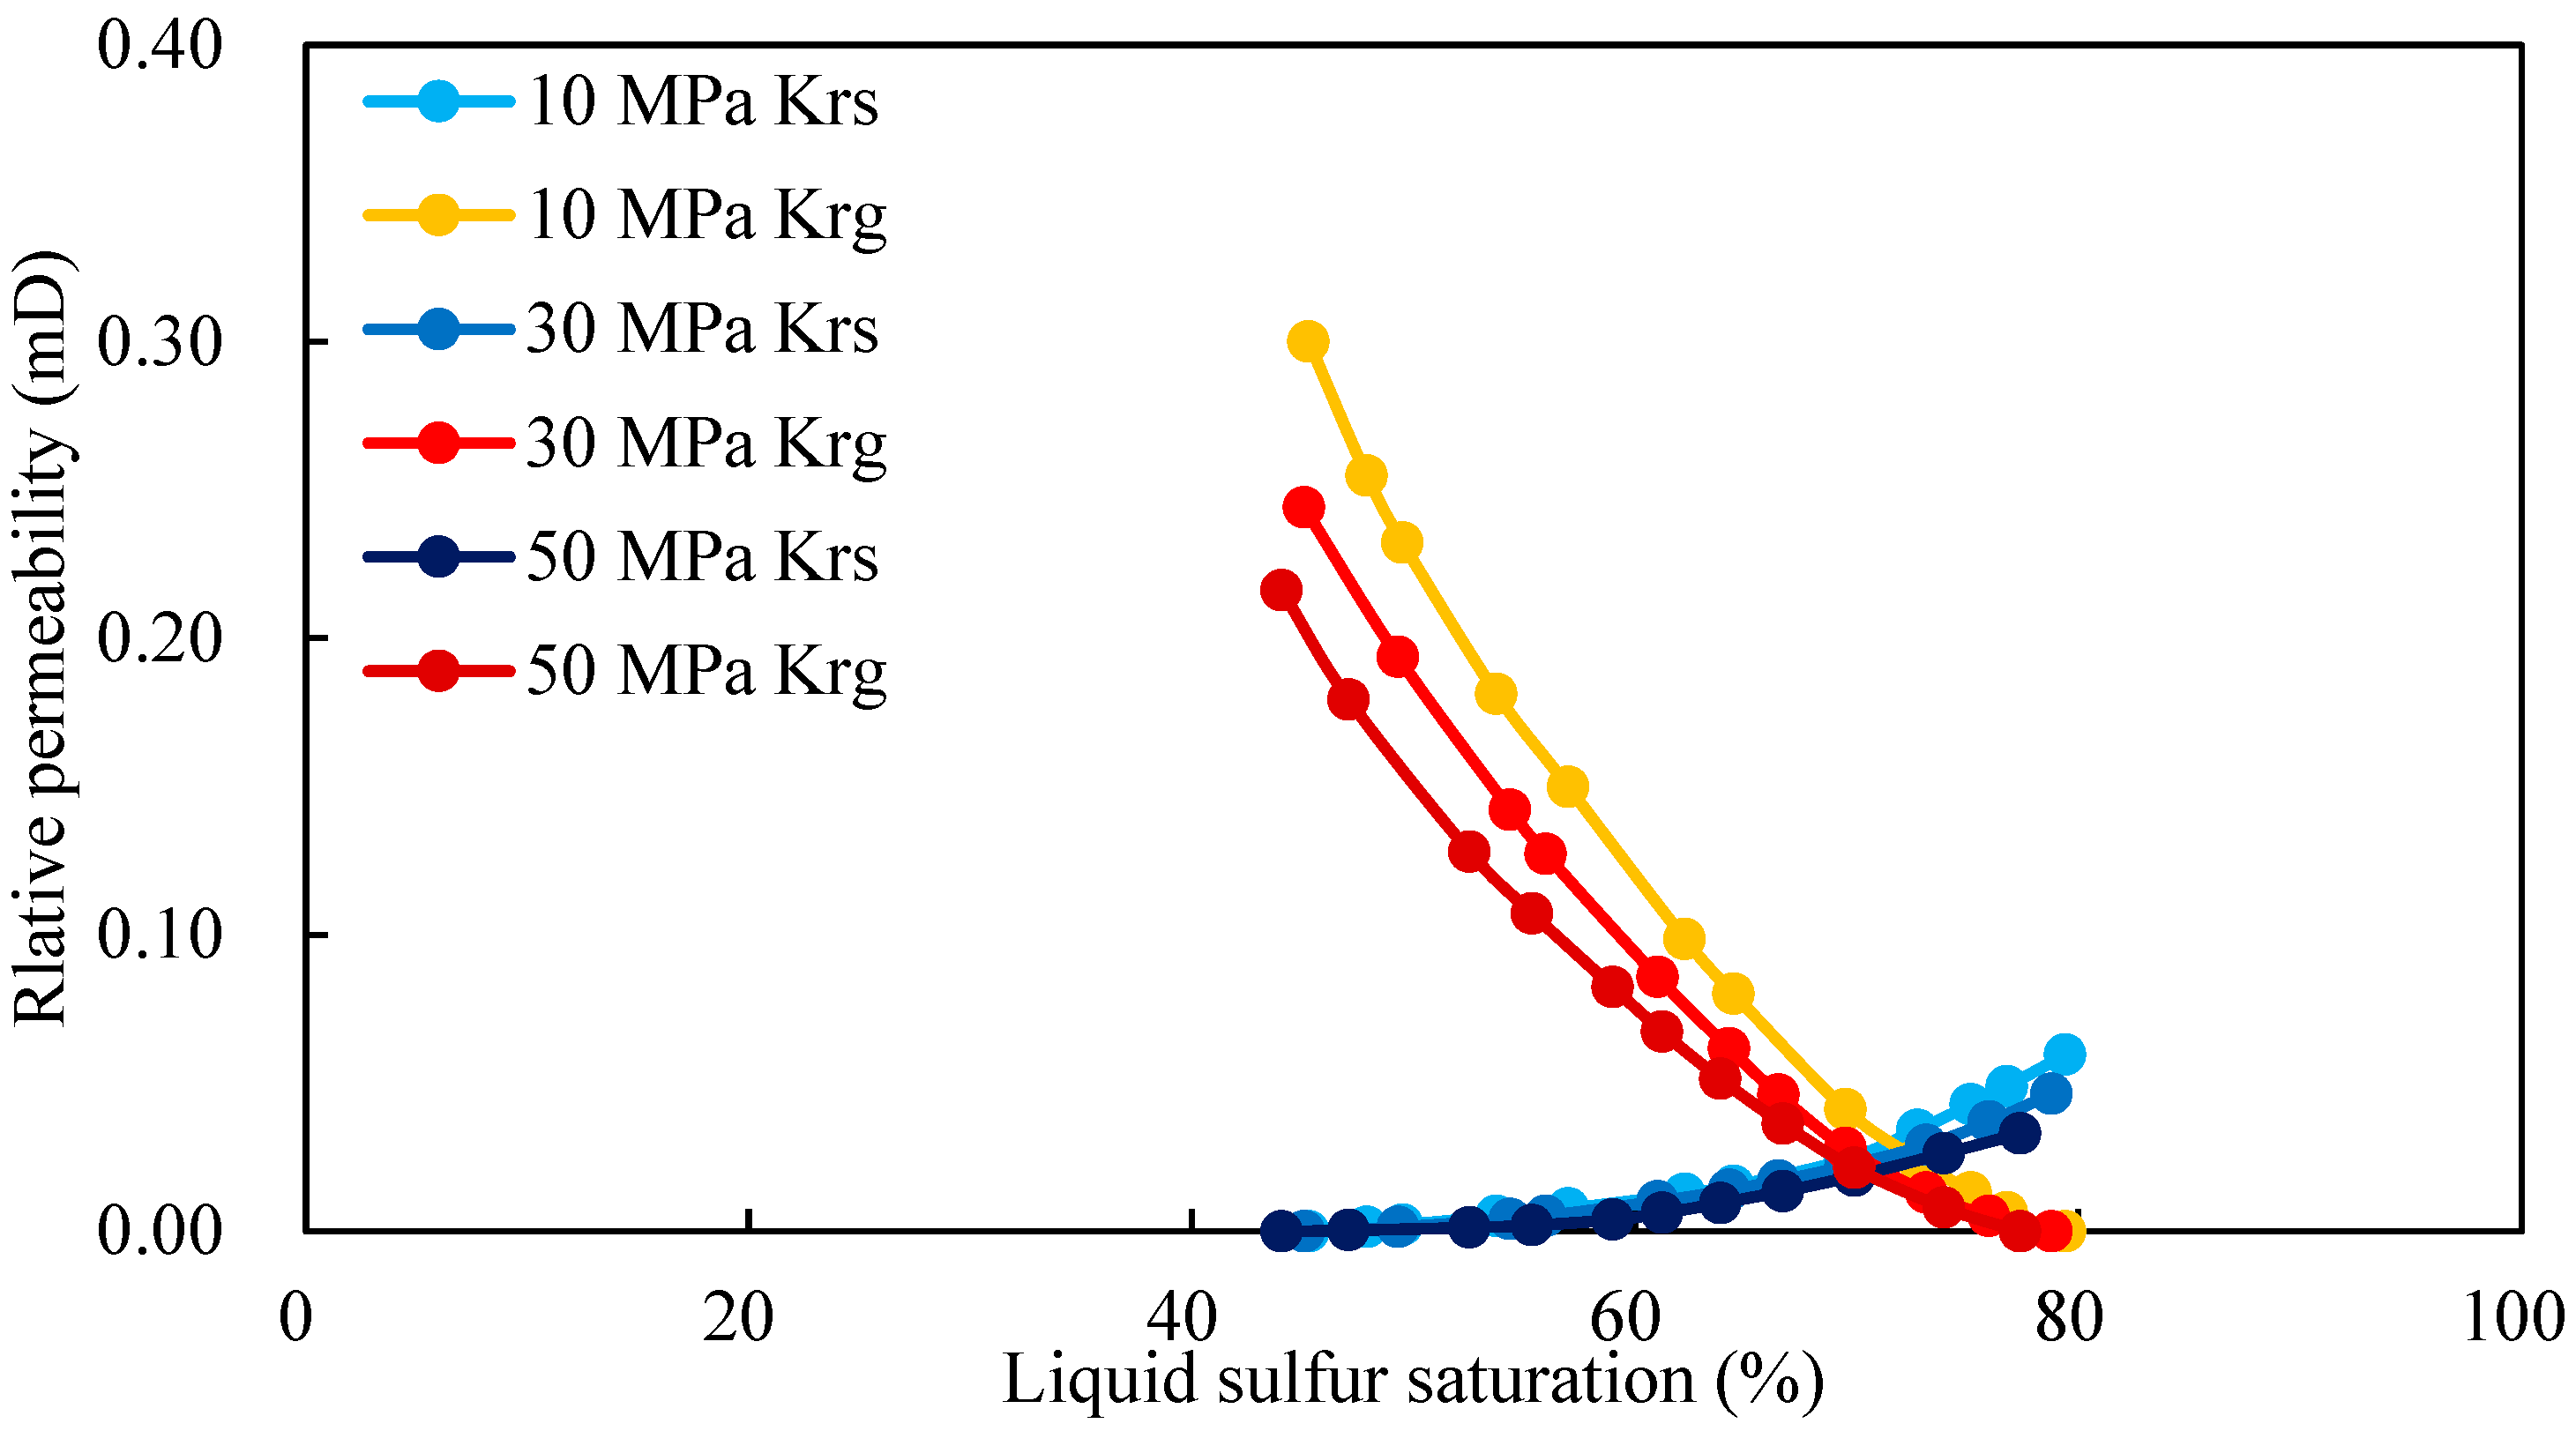
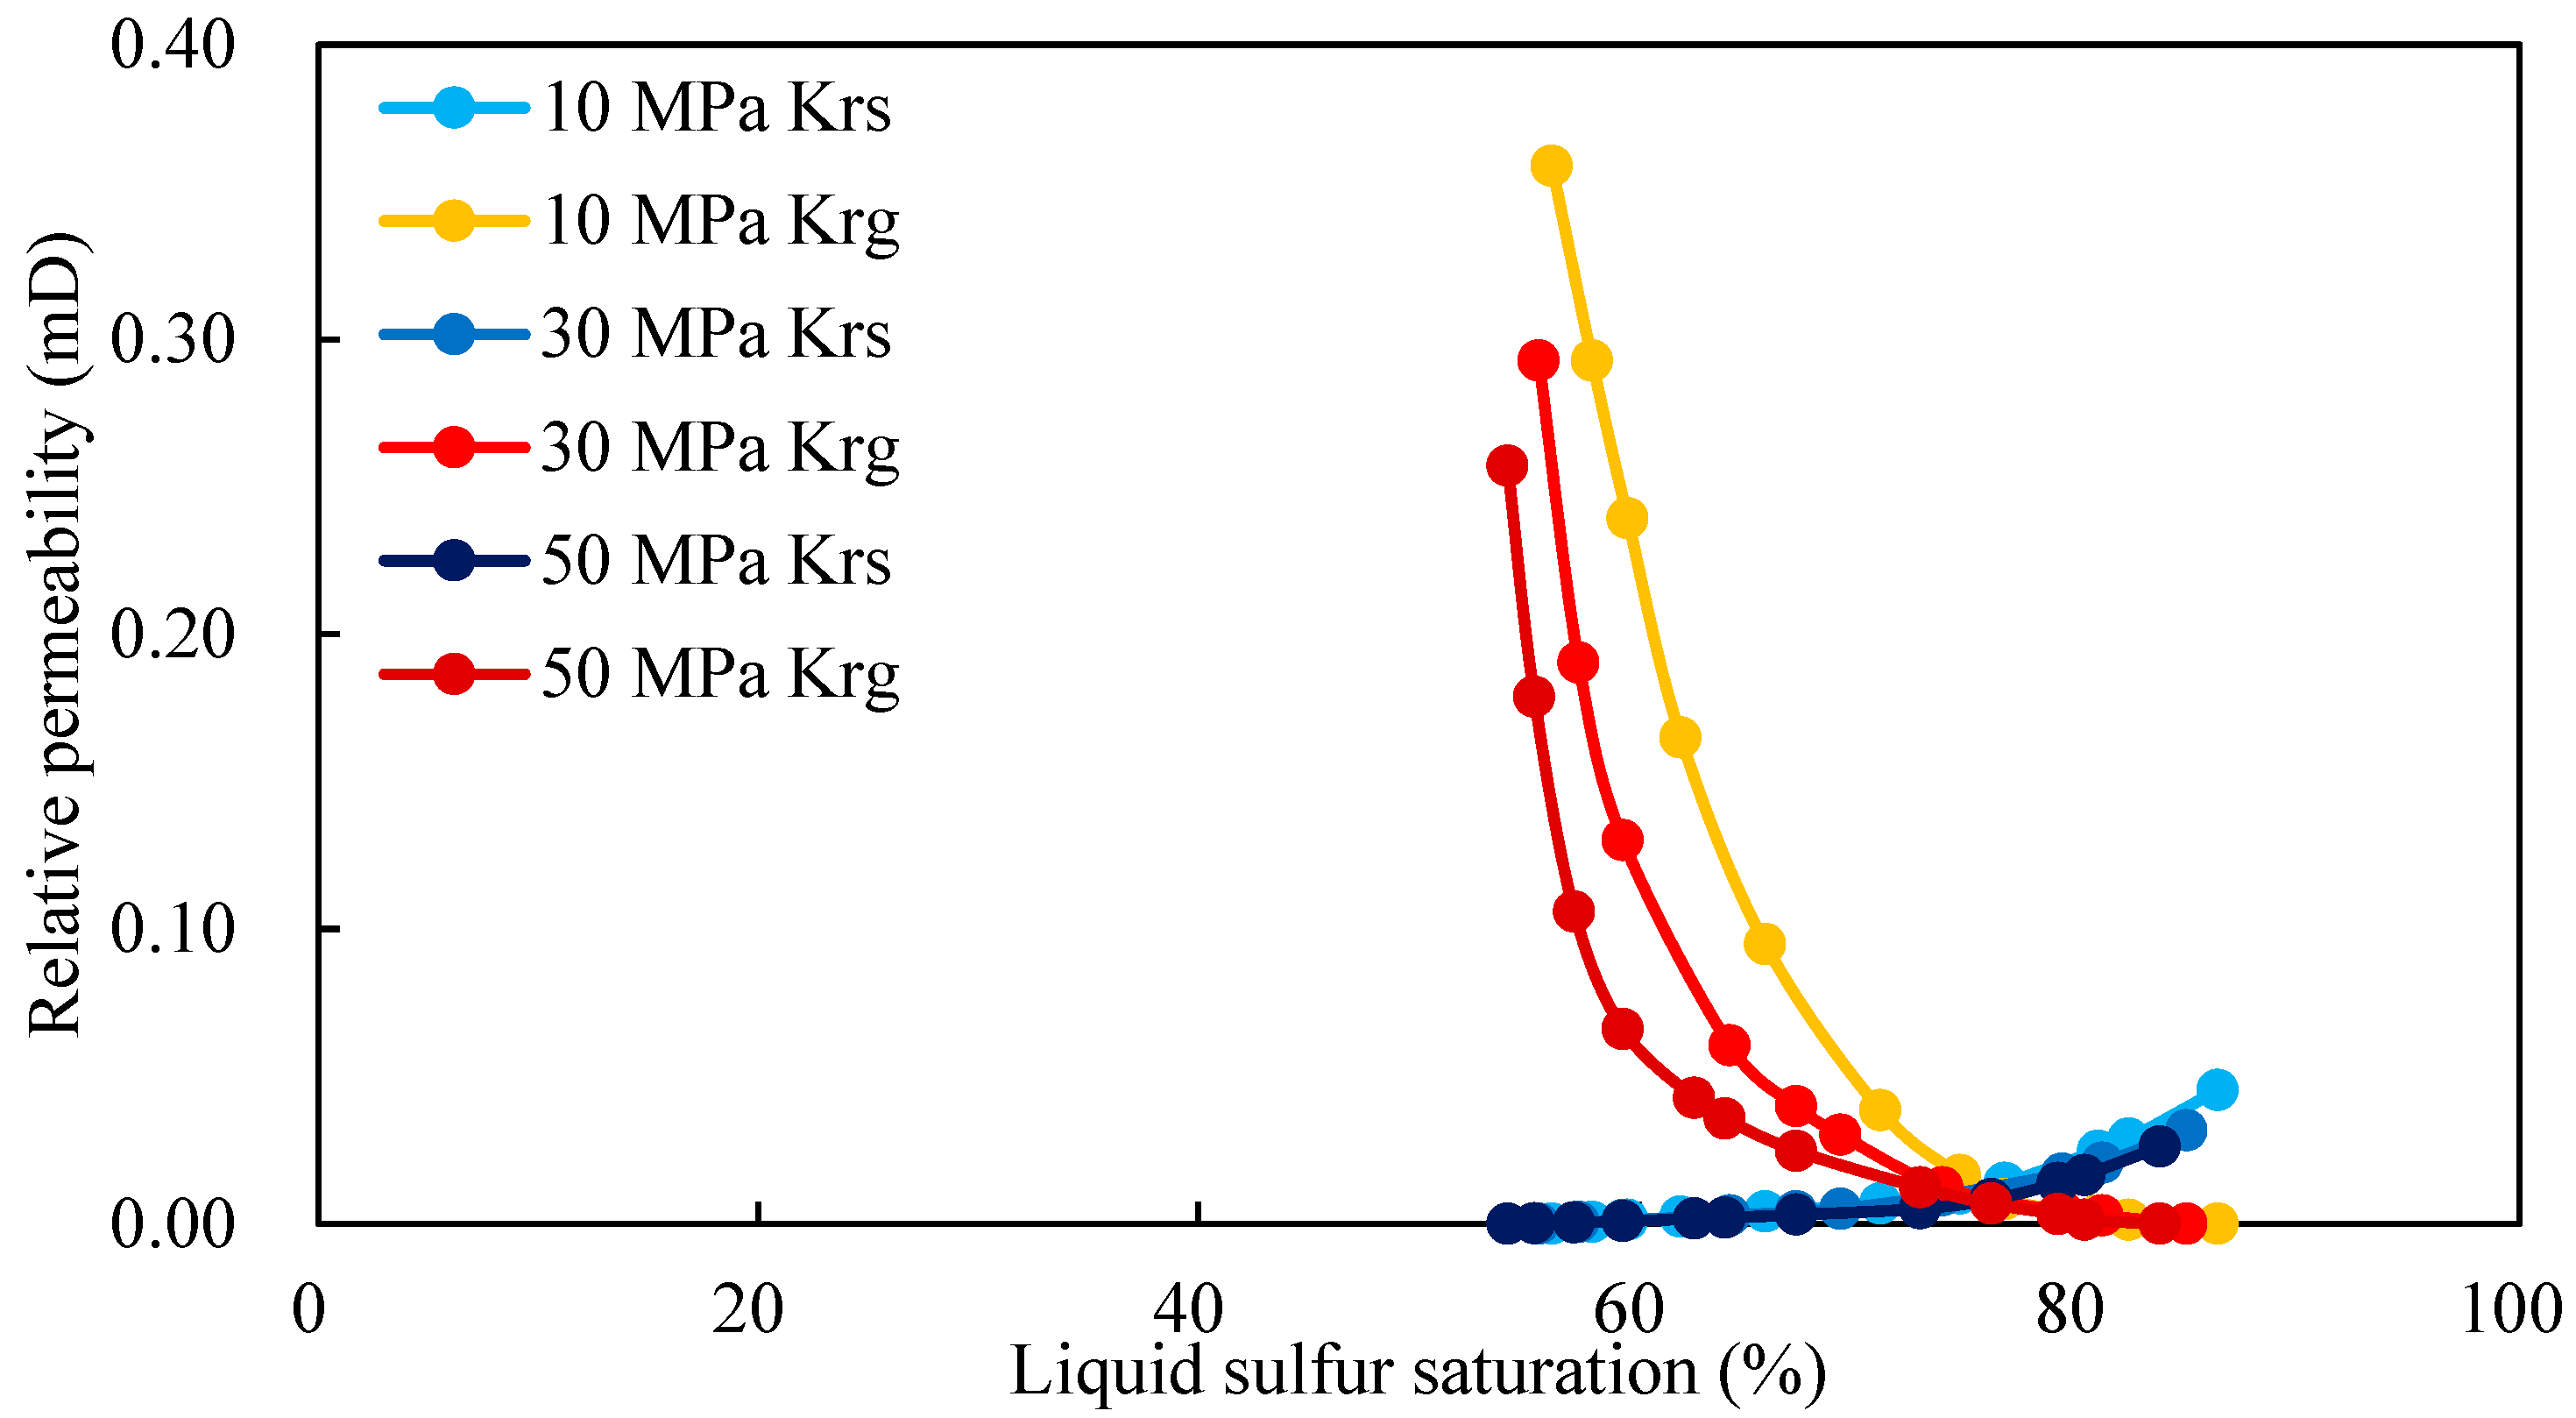
3.4. Effect of Confining Pressure on Relative Permeability Curve
4. Conclusions
- (a)
- The characteristics of the gas–liquid sulfur relative permeability curve were analyzed. Liquid sulfur had a critical flow saturation of 40%. The gas–liquid sulfur co-flow interval was narrow, with a liquid sulfur saturation range of 40–80% in the co-flow interval. This means that the majority of the precipitated liquid sulfur cannot flow, and only near-wellbore sulfur saturation may be higher than the critical flow saturation, resulting in lower gas well productivity.
- (b)
- The physical properties and structure type of the formation rocks have a significant impact on the relative permeability of gas–liquid sulfur. Because the gas–liquid sulfur relative permeability is low and the co-flow interval is small in matrix cores with good physical properties, it will be more difficult for the liquid sulfur to flow effectively, causing more damage to the reservoir with good physical properties. When compared to the matrix, the fractured cores had higher liquid sulfur residual saturation, a smaller gas–liquid sulfur co-flow interval, and greater gas relative permeability damage as the liquid sulfur saturation increased. In fractured reservoirs, liquid sulfur had little effect on the gas well productivity in the early and middle production stages; however, when the liquid sulfur saturation exceeded the residual liquid sulfur saturation, the gas well productivity decreased faster as the production time increased.
- (c)
- Temperature had a certain influence on the gas–liquid sulfur relative permeability. With the increase in temperature, the relative permeability of the gas decreased obviously, while that of the liquid sulfur decreased slightly and remained basically unchanged.
- (d)
- The relative permeability of the gas–liquid sulfur was affected by the confining pressure, particularly in the fractured core. The gas–liquid sulfur co-flow interval decreased slightly as the confining pressure increased, as did the relative permeability, and the decrease in the gas relative permeability was greater. For the fractured core, the decrease in the gas relative permeability was more substantial with the increase in the confining pressure, indicating that the stress sensitivity of fractured cores is more significant.
Author Contributions
Funding
Institutional Review Board Statement
Informed Consent Statement
Data Availability Statement
Conflicts of Interest
Error Analysis Statement
Nomenclature
| Absolute permeability of core, mD | |
| Atmospheric pressure under standard conditions, MPa | |
| Nitrogen flow rate under standard conditions, cm3/s | |
| Nitrogen viscosity at experimental temperature and pressure, mPa·s | |
| Core length, cm | |
| Cross-sectional area of core, cm2 | |
| Core inlet pressure, MPa | |
| Core outlet pressure, MPa | |
| Cumulative fluid production at time i, mL | |
| Cumulative fluid production at time i − 1, mL | |
| Liquid sulfur production change from time i − 1 to time i, mL | |
| Atmospheric pressure, MPa | |
| Core inlet and outlet pressure difference, MPa | |
| Gas change at atmospheric pressure from time i − 1 to time i, mL | |
| Cumulative gas production, mL | |
| Cumulative liquid sulfur production, mL | |
| Liquid sulfur saturation, % | |
| Core pore volume, cm3 | |
| Gas flow rate under gas-liquid sulfur two-phase flow, mL/s | |
| Gas flow rate under gas single-phase flow, mL/s | |
| Gas viscosity at average core pressure, mPa·s | |
| Viscosity of liquid sulfur, mPa·s | |
| Liquid sulfur void fraction, decimals | |
| Gas void fraction, decimals | |
| Gas relative permeability, decimals | |
| Liquid sulfur relative permeability, decimals |
References
- Burgers, W.F.J.; Northrop, P.S.; Kheshgi, H.S.; Valencia, J.A. Worldwide development potential for sour gas. Energy Procedia 2011, 4, 2178–2184. [Google Scholar] [CrossRef] [Green Version]
- Roberts, B.E. Flow impairment by deposited sulfur-a review of 50 years of research. J. Nat. Gas Eng. 2017, 2, 84–105. [Google Scholar] [CrossRef]
- Jamiolahmady, M.; Sohrabi, M.; Ghahri, P.; Ireland, S. Gas/Condensate Relative Permeability of a Low Permeability Core: Coupling vs. Inertia. SPE Res. Eng. 2010, 13, 214–227. [Google Scholar] [CrossRef]
- Kalla, S.; Leonardi, S.A.; Berry, D.W.; Poore, L.D.; Sahoo, H.; Kudva, R.A.; Braun, E.M. Factors That Affect Gas-Condensate Relative Permeability. SPE Res. Eng. 2015, 18, 5–10. [Google Scholar] [CrossRef]
- Rahimzadeh, A.; Bazargan, M.; Darvishi, R.; Mohammadi, A.H. Condensate blockage study in gas condensate reservoir. J. Nat. Gas Sci. Eng. 2016, 33, 634–643. [Google Scholar] [CrossRef]
- Hassan, A.; Mahmoud, M.; Al-Majed, A.; Alawi, M.B.; Elkatatny, S.; BaTaweel, M.; Al-Nakhli, A. Gas condensate treatment: A critical review of materials, methods, field applications, and new solutions. J. Pet. Sci. Eng. 2019, 177, 602–613. [Google Scholar]
- Khormali, A.; Sharifov, A.R.; Torba, D.I. The control of asphaltene precipitation in oil wells. Pet. Sci. Technol. 2018, 36, 443–449. [Google Scholar]
- Khormali, A.; Sharifov, A.R.; Torba, D.I. Experimental and modeling analysis of asphaltene precipitation in the near wellbore region of oil wells. Pet. Sci. Technol. 2018, 36, 1030–1036. [Google Scholar] [CrossRef]
- Kuo, C.H. On the production of hydrogen sulfide-sulfur mixtures from deep formations. J. Pet. Technol. 1972, 24, 1142–1146. [Google Scholar] [CrossRef]
- Chrastil, J. Solubility of solids and liquids in supercritical gases. J. Phys. Chem. 1982, 86, 3016–3021. [Google Scholar] [CrossRef]
- Roberts, B.E. The effect of sulfur deposition on gaswell inflow performance. SPE Res. Eng. 1997, 12, 118–123. [Google Scholar] [CrossRef]
- Mei, H.; Zhang, M.; Yang, X. The effect of sulfur deposition on gas deliverability. In Proceedings of the SPE Gas Technology Symposium, Calgary, AB, Canada, 15–17 May 2006. [Google Scholar]
- Guo, X.; Du, Z. EOS-Related mathematical model to predict sulfur deposition and cost-effective approach of removing sulfides from sour natural gas. In Proceedings of the Production and Operations Symposium, Oklahoma City, OK, USA, 31 March–3 April 2007. [Google Scholar]
- Mahmoud, M.A. New numerical and analytical models to quantify the near-wellbore damage due to sulfur deposition in sour gas reservoirs. In Proceedings of the SPE Middle East Oil and Gas Show and Conference, Manama, Bahrain, 10–13 March 2013. [Google Scholar]
- Hu, J.; He, S.; Zhao, J.; Li, Y. Modeling of sulfur plugging in a sour gas reservoir. J. Nat. Gas Sci. Eng. 2013, 11, 18–22. [Google Scholar] [CrossRef]
- Guo, X.; Zhou, X.; Zhou, B. Prediction model of sulfur saturation considering the effects of non-Darcy flow and reservoir compaction. J. Nat. Gas Sci. Eng. 2015, 22, 371–376. [Google Scholar] [CrossRef]
- Li, J.; Qi, Z.; Hu, S.; Yuan, Y.; Yan, W.; Xiang, Z. A numerical simulation method for high-sulfur gas reservoirs with liquid released sulfur. Natur. Gas Ind. 2015, 35, 40–44. [Google Scholar]
- Hu, J.; Chen, Z.; Liu, P.; Liu, H. A comprehensive model for dynamic characteristic curves considering sulfur deposition in sour carbonate fractured gas reservoirs. J. Pet. Sci. Eng. 2018, 170, 643–654. [Google Scholar] [CrossRef]
- Liu, J.; Jiang, L.; Liu, M.; Yi, S.; Liu, Z.; Dai, X.; Xie, Y.; Chen, Y. Fractal prediction model of gas-liquid sulfur phase permeability curve with boundary layer considered. In Proceedings of the International Conference on Applied Energy, Bangkok, Thailand, 1–10 December 2020. [Google Scholar]
- Xu, Z.; Gu, S.; Zeng, D.; Sun, B.; Xue, L. Numerical simulation of sulfur deposit with particle release. Energies 2020, 13, 1522. [Google Scholar] [CrossRef] [Green Version]
- Li, T.; Shao, M.; Yang, Q.; Zhang, J.; Ahmad, F.A. Fractal model for predicting elemental sulfur saturation in the presence of natural fracture. ACS Omega 2021, 6, 14394–14398. [Google Scholar] [CrossRef]
- Zou, C.; Wang, X.; Hu, J.; Lv, Y.; Fang, B.; Zhang, Y. A novel model for predicting the well production in high-sulfur-content gas reservoirs. Geofluids 2021, 2021, 5529908. [Google Scholar] [CrossRef]
- Coşkuner, G. Flow of sour gas, liquid sulfur, and water in porous media. J. Colloid Interface Sci. 1994, 165, 526–531. [Google Scholar] [CrossRef]
- Abou-Kassem, J.H. Experimental and numerical modeling of sulfur plugging in carbonate reservoirs. J. Pet. Sci. Eng. 2000, 26, 91–103. [Google Scholar] [CrossRef]
- Shedid, S.A.; Zekri, A.Y. Formation damage due to simultaneous sulfur and asphaltene deposition. In Proceedings of the SPE International Symposium and Exhibition on Formation Damage Control, Lafayette, Louisiana, 18–20 February 2004. [Google Scholar]
- Guo, X.; Du, Z.; Yang, X.; Zhang, Y.; Fu, D. Sulfur deposition in sour gas reservoirs: Laboratory and simulation study. Pet. Sci. 2009, 6, 405–414. [Google Scholar] [CrossRef] [Green Version]
- Hu, J.; He, S.; Zhao, J.; Li, Y.; Yang, X. Sulfur deposition experiment in the presence of non-movable water. J. Pet. Sci. Eng. 2012, 100, 37–40. [Google Scholar] [CrossRef]
- Yang, X.; Hu, Y.; Zhong, B.; Yang, H.; Wang, S. The damage appraisal on elemental sulfur deposition in high sulfur content gas reservoirs. In Proceedings of the International Petroleum Technology Conference, Beijing, China, 26–28 March 2013. [Google Scholar]
- Mahmoud, M.A. Effect of elemental-sulfur deposition on the rock petrophysical properties in sour-gas reservoirs. SPE J. 2014, 19, 703–715. [Google Scholar] [CrossRef]
- Maffeis, I.; de Angelis, A.R.; Guernelli, R.; Croce, E.; Luigi, R. Experimental methods for the evaluation of the efficiency of an innovative sulfur-dissolving product in HP-HT conditions. In Proceedings of the Abu Dhabi International Petroleum Exhibition & Conference, Abu Dhabi, United Arab Emirates, 15–18 November 2021. [Google Scholar]
- Buckley, S.E.; Leverett, M.C. Mechanism of fluid displacement in sands. Trans. AIME 1942, 146, 107–116. [Google Scholar] [CrossRef]
- Johnson, E.F.; Bossler, D.P.; Naumann Bossler, V.O. Calculation of relative permeability from displacement experiments. Trans. AIME 1959, 216, 370–372. [Google Scholar] [CrossRef]
- Guo, X.; Du, Z.; Jiang, Y.; Sun, L.; Liu, X.; Zhang, N. Can gas-water relative permeability measured under experiment conditions be reliable for the development guidance of a real HPHT reservoir. Natur. Gas Ind. 2014, 34, 1000-0976. [Google Scholar]
- Benzagouta, M.S.; Amro, M.M. Pressure and temperature effect on petrophysical characteristics: Carbonate reservoir case. In Proceedings of the SPE Saudi Arabia Section Technical Symposium, Al-Khobar, Saudi Arabia, 9–11 May 2009. [Google Scholar]
- Yavuz, H.; Demirdag, S.; Caran, S. Thermal effect on the physical properties of carbonate rocks. Int. J. Rock Mech. Min. Sci. 2010, 47, 94–103. [Google Scholar] [CrossRef]


| Device | Range of Application | Accuracy |
|---|---|---|
| Thermotank | 0–200 °C | 0.5 °C |
| Gas booster pump | 0–70 MPa | 0.1 MPa |
| Automatic tracking confining pressure pump | 0–120 MPa | 0.1 MPa |
| Electronic balance | 0–500 g | 0.001 g |
| Electronic gas flowmeter | 0.1–100 mL | 0.01 mL |
| Core Number | 1 | 2 | 3 |
|---|---|---|---|
| Dolomite | 98.04 | 97.22 | 96.73 |
| Calcite | 1.24 | 2.40 | 2.33 |
| Plagioclase | 0.52 | 0.38 | 0.94 |
| Quartz | 0.20 | 0 | 0 |
| Total | 100 | 100 | 100 |
| Core Number | 1 | 2 | 3 |
|---|---|---|---|
| Length (cm) | 4.950 | 4.862 | 4.857 |
| Cross sectional area (cm2) | 4.952 | 4.977 | 4.974 |
| Porosity (%) | 0.452 | 1.769 | 4.431 |
| Permeability (mD) | 2.23 | 13.42 | 23.79 |
| Type | Poor property | Good property | Fracture |
| Core Number | Confining Pressure (MPa) | Temperature (°C) |
|---|---|---|
| 1 | 10 | 150 |
| 30 | 130 | |
| 30 | 140 | |
| 30 | 150 | |
| 50 | 150 | |
| 2 | 10 | 150 |
| 30 | 150 | |
| 50 | 150 | |
| 3 | 10 | 150 |
| 30 | 150 | |
| 50 | 150 |
| Core Number | 1 | 2 | 3 |
|---|---|---|---|
| Critical flow saturation of liquid sulfur (%) | 41.52 | 45.05 | 55.44 |
| Corresponding gas relative permeability | 0.3322 | 0.2441 | 0.2928 |
| Liquid sulfur saturation at isopermeability point (%) | 66.67 | 70.51 | 74.67 |
| Corresponding relative permeability | 0.0720 | 0.0232 | 0.0104 |
| Residual gas saturation (%) | 20.75 | 21.21 | 15.12 |
| Corresponding liquid sulfur relative permeability | 0.2048 | 0.0463 | 0.0316 |
| Critical flow saturation of liquid sulfur (%) | 41.52 | 45.05 | 55.44 |
Publisher’s Note: MDPI stays neutral with regard to jurisdictional claims in published maps and institutional affiliations. |
© 2022 by the authors. Licensee MDPI, Basel, Switzerland. This article is an open access article distributed under the terms and conditions of the Creative Commons Attribution (CC BY) license (https://creativecommons.org/licenses/by/4.0/).
Share and Cite
Guo, X.; Wang, P.; Ma, J.; Li, T. Experiment on Gas–Liquid Sulfur Relative Permeability under High-Temperature High-Pressure Sour Gas Reservoir Condition. Processes 2022, 10, 2129. https://doi.org/10.3390/pr10102129
Guo X, Wang P, Ma J, Li T. Experiment on Gas–Liquid Sulfur Relative Permeability under High-Temperature High-Pressure Sour Gas Reservoir Condition. Processes. 2022; 10(10):2129. https://doi.org/10.3390/pr10102129
Chicago/Turabian StyleGuo, Xiao, Pengkun Wang, Jingjing Ma, and Tao Li. 2022. "Experiment on Gas–Liquid Sulfur Relative Permeability under High-Temperature High-Pressure Sour Gas Reservoir Condition" Processes 10, no. 10: 2129. https://doi.org/10.3390/pr10102129
APA StyleGuo, X., Wang, P., Ma, J., & Li, T. (2022). Experiment on Gas–Liquid Sulfur Relative Permeability under High-Temperature High-Pressure Sour Gas Reservoir Condition. Processes, 10(10), 2129. https://doi.org/10.3390/pr10102129