1. Introduction
Clinching technology is a joining method comprising plastic deformation, whereby sheet metals are deformed locally without using any additional elements [
1]. It has been widely used in automobile industries, home appliances and steel construction frameworks [
2]. Clinching technologies have continuously been developed with the emergence of lightweight materials. A new rotated clinching process has been proposed by our group. The movement of the punch was changed by applying a twin pair of simultaneously rotating rotated heads to locally deform the sheet in a rectangular flat-bottom fixed die. Further, a non-circular mechanical interlock joint suitable for the simultaneous multi-point joining of sheets was formed. This joint does not facilitate the rotation between sheets when subject to torque. Regarding the practical application of this new process, enterprises were concerned with the mechanical properties of the joint, particularly the peeling, shearing and tensile strengths. The strength of the joint is determined by various geometric parameters (interlock, neck thickness and bottom thickness) of the joint. These parameters are affected by several factors, with the process parameter being the most important factor. Consequently, it is important to study rotated clinching process parameters to obtain joints with good strength, while saving time and costs involved in tool development.
Recently, several studies have been conducted on the effect of process parameters on the strength of clinched joints using experimental methods, finite element simulation methods and intelligent algorithms. Regarding the experimental method, Chen et al. [
3] investigated the flat and bumped dies on the geometric parameters, tensile strength and shearing strength of joints with different thicknesses during the reshaping process. Ran et al. [
4], on their part, investigated the effects of different forming forces on the shearing and tensile strengths of rectangular joints. Ren et al. [
5] analysed different reinforcing loads on the static strength of rivet-reinforced joints. Lambiase et al. [
6] analysed the effects of different forming forces on the shearing and peeling strengths of joints produced using fixed and extensible dies. The experimental method is the most direct research method, although tool manufacturing is expensive. Contrarily, the finite element method can easily change the process parameters to reduce cost as well as improve joint forming quality and manufacturability [
7]. Shi et al. [
8] used an improved Lagrange finite element method to simulate the clinching forming process with different punch and die structure sizes. Hamel et al. [
9] established a two-dimensional (2D) axisymmetric model of the clinching process. Khaledi et al. [
10] used a Q1SP element to improve the prediction accuracy of the interlock values in the clinching process. Dean et al. [
11] analysed the effects of tool geometry on the geometric parameters of hybrid metal–composite joints using the Taguchi and finite element methods. The results showed that the finite element method could be used to simulate the clinching-forming process and optimise the parameters. Han et al. [
12] studied the effects of different geometric parameters and punch speed on the interlock of flat clinching joints by combining the simulation and experimental methods. Pan et al. [
13] investigated the geometries and motion conditions of the rollers on the formation of the interlocking of the front/rear sides of the roller clinching joints. The results conformed to one another. Coppieters et al. [
14] and Han et al. [
15] compared and analysed the joint strength obtained by the experiment and simulation. Although there were differences in the results, the finite element method was convenient in analysing the clinching forming process and joint strength. Moreover, simulating large deformation took longer than the finite element methods [
16].
With the aim of optimising finite element methods using intelligent algorithms, Lambiase [
17] proposed an optimisation tool to improve the strength of joints; the tool was based on a genetic algorithm and artificial neural network model. Deng et al. [
18], on their part, proposed an optimisation strategy based on genetic algorithm and real-time collaborative simulation of software CAD and CAE to optimise the tool and joint parameters. Roux [
19] established a calculation model for measuring the strength of the joint using global optimisation technology based on the Kriging metamodel. Additionally, Contrarily, Wang et al. [
20] adopted a Bezier curve to describe the contour shape of the die and improve joint strength. They equally proposed a dynamic optimisation system of the joint strength using finite element analysis and a genetic algorithm [
21]. Further, Glavan et al. [
22] designed an optimisation method based on genetic algorithm and simulation to estimate the material parameters of the joint. Zirngibl et al. [
23] developed a combination method using a deep and reinforcement learning approach to achieve the intelligent optimisation of the joint shape. Generally, genetic algorithms and neural networks require a considerable number of samples. Schwarz et al. [
24] adopted the principal component analysis approach to identify the geometric parameters of the entire tool and optimise the geometric contour of the joint to maximise the interlock and neck thickness. In addition, Eigen modes were used to mathematically characterise the entire joint. Yuan et al. [
25] developed an effective way to realize the optimisation of the process parameters integrating a response surface method—genetic algorithm approach. These improved methods effectively improved the operation efficiency and calculation accuracy of the finite element method.
The aforementioned studies indicated that tool parameters, forming force, punch speed and other process parameters considerably impact the strength of the joint, and their influence laws on the joint strength of these parameters have been analysed using several methods. However, the influence of the interaction between factors on joint strength was not considered. Consequently, it is important to establish the mapping relationship between each process parameter, their interaction and joint strength. It is equally essential to analyse the weight of influence of each factor on the joint strength and provide theoretical guidance for the optimization of joint strength.
Rotated clinching is a new process which involves several process parameters, such as the structural size of the rotated head, die cavity, rotation angle and rotation angle velocity of the rotated head. The purpose of this study is to analyse the important parameters that affect the joint’s strength and the relationship between them. To begin with, in this study, the main process parameters were preliminarily determined using a finite element simulation, based on the principle of this process. Subsequently, the simulation scheme during rotated clinching for two-layer Al1060 sheets was carried out and the corresponding shearing strength Fmax of the joints was obtained using the central composite design (CCD) method of the RSM. Further, using the analysis of variance, the relational expression between the main process parameters and shearing strength was established. In addition, the significance of these parameters was analysed and the influence law of several parameters was studied. Finally, experiments were carried out to validate the accuracy of the relational expression. The results laid the foundation for further research on this process, which will facilitate the understanding of the forming quality and practical application of rotated clinching.
2. Selection of Process Parameters for Investigation
We identified several important process parameters (the die depth, rotation angle, large fillet radius and small fillet radius) that affected joint strength. Firstly, the principle of rotated clinching, including its working principle and main process parameters, was introduced. Secondly, the forming process of rotated clinching was simulated using the finite element method to analyse the deformation of joints at different positions. Thirdly, the influencing parameters were analysed following the degree of deformation of the different positions. Lastly, process parameters that played crucial roles in joint geometry were preliminarily determined and identified as the main process parameters.
2.1. Principle of the Rotated Clinching Process
Figure 1 shows the principle of the rotated clinching process. Two sheets are placed on a concave die with a rectangular cavity (
L ×
W ×
h, where
L,
W, and
h are the length, width and depth of the die cavity, respectively) and fixed with a blank-holder to prevent the sheets from warping when connected. To begin, two rotated heads installed on two shafts (
O1 and
O2, which represent the rotated centres) are placed on the upper sheet and aligned with the die cavity. Further, the rotated heads are rotated into the die cavity at the same angular velocity
w, while the sheets above the die cavity are drawn into the cavity for local deformation. Furthermore, a mechanical interlock is formed between the upper and lower sheets as the rotation angle
α increases. The rotated heads rotate reversely to demould. Here, one-time joining is completed and a joint with an approximate ellipse at the bottom is obtained when the pre-set rotation angle
α is reached.
R,
r,
R1,
r1 and
w denote the large radius, small radius, large fillet radius, small fillet radius and rotation angular velocity of the rotated head, respectively. The rotation centres of the rotated head (
O1 and
O2) should be maintained at similar heights. In the figure below, the initial state with a rotation angle of zero degree is to the left, while the final state with rotation angle
α is to the right.
2.2. Finite Element Simulation Analysis of Rotated Clinching
Rotated clinching forming process is a complex deformation process that can be analysed using a finite element simulation. Here, the properties of the joining material must be determined, and the parameters of the finite element simulation model set to analyse the specific forming process and its sheet deformation.
Al1060 aluminium sheet materials with dimensions of 80 mm × 20 mm × 2 mm were used for finite element simulation. Following GB/T228.1-2010, a tensile test was carried out to establish the mechanical properties of the Al1060 aluminium sheet, wherein the elastic modulus was 68.9 GPa, Poisson ratio was 0.33, tensile stress was 114.9 MPa, yield stress was 56.8 MPa and real stress and strain relationship of the material was .
ABAQUS/Explicit software was employed to simulate the rotated clinching process. The corresponding three-dimensional (3D) finite element model is shown in
Figure 2. The section structure of the rotated head and the die are shown in
Figure 1. The rotated heads, die and blank holder were regarded as rigid bodies because their harnesses were higher than those of Al1060 sheets. Contrarily, the Al1060 sheet was considered as a plastic body and of the C3D8R element type, while the hexahedron element shape was employed. The rotated clinching process involved a larger deformation with high local plastic strains in the sheets, causing severe local mesh distortions. To solve this problem, the significantly deformed area of the sheet was refined using a mesh size of 1 mm × 0.25 mm and 0.5 mm along the thickness direction. The automatic remeshing approach was employed. After meshing, the number of grids in the upper and lower sheets was 39,808 and 27,335, respectively. The friction coefficients between the tools and sheets and in between the sheets were set at 0.15 and 0.3, respectively. The movement condition of the rotated heads was controlled by the rotation angle α.
The rotated clinching forming process comprises four stages: positioning, drawing, filling and forming. Further, the stress and strain levels show the degree of deformation of the sheet. As shown in
Figure 3 and
Figure 4, a considerable amount of stress and strain is visible at the contact area between the rotated head, die and sheets during the forming process. As shown in
Figure 5, the forming force
Fc increases sharply with the rotation angle α in the forming stage, showing that the resistance of the sheet to deformation increases, while material flow restricts the increase of stress and strain. During the forming process, deformations of the sheets increased alongside the rotation angle. Consequently, the maximum strain occurred at both the small and large fillet radii of the rotated head. Positions with the maximum stress and strain were hazardous areas that affected the joint’s strength. Determining the process parameters that impacted these hazardous areas was very important in achieving a high joining strength.
2.3. Determining Process Parameters
As shown in
Figure 6,
Tn,
Ti and
Tmin denote the neck thickness, interlock and minimum bottom thickness, respectively. These are the characteristic parameters of the joint. Further,
t1 and
t2 are the thickness of the sheet,
r1,
R1 and
α, the large fillet radius, small fillet radius and rotation angles of the rotated head, respectively, and
h and
L, the depth and length of the die cavity, respectively. The joint strength is affected by the joint parameters, while different geometric parameters of the joint can be obtained using different process parameters. As shown in the figure below, the neck thickness is mainly affected by the large radius
R, small radius
r, large fillet radius
R1, small fillet radius
r1, rotation angle
α and die cavity length
L. Contrarily, the interlock is mainly affected by the small fillet radius
r1, rotation angle
α, die cavity length
L and die depth
h. Furthermore, the minimum bottom thickness
Tmin is affected by the large fillet radius
R1, rotation angle
α and die depth
h.
From the above analysis results, the size of the rotated head, the concave shape of the die cavity and the rotation angle of the rotated head influenced the neck thickness, interlock and minimum bottom thickness of the joint. In this study, the dimensions of the basic parameters were determined based on the results of a preliminary simulation study. Particularly, the length
L and width
W of the die cavity, large radius
R and small radius
r of the rotated head were maintained at 10.5, 9, 18 and 15 mm, respectively. Four critical process parameters, namely: the die depth
h, rotation angle
α, small fillet radius
r1 and large fillet radius
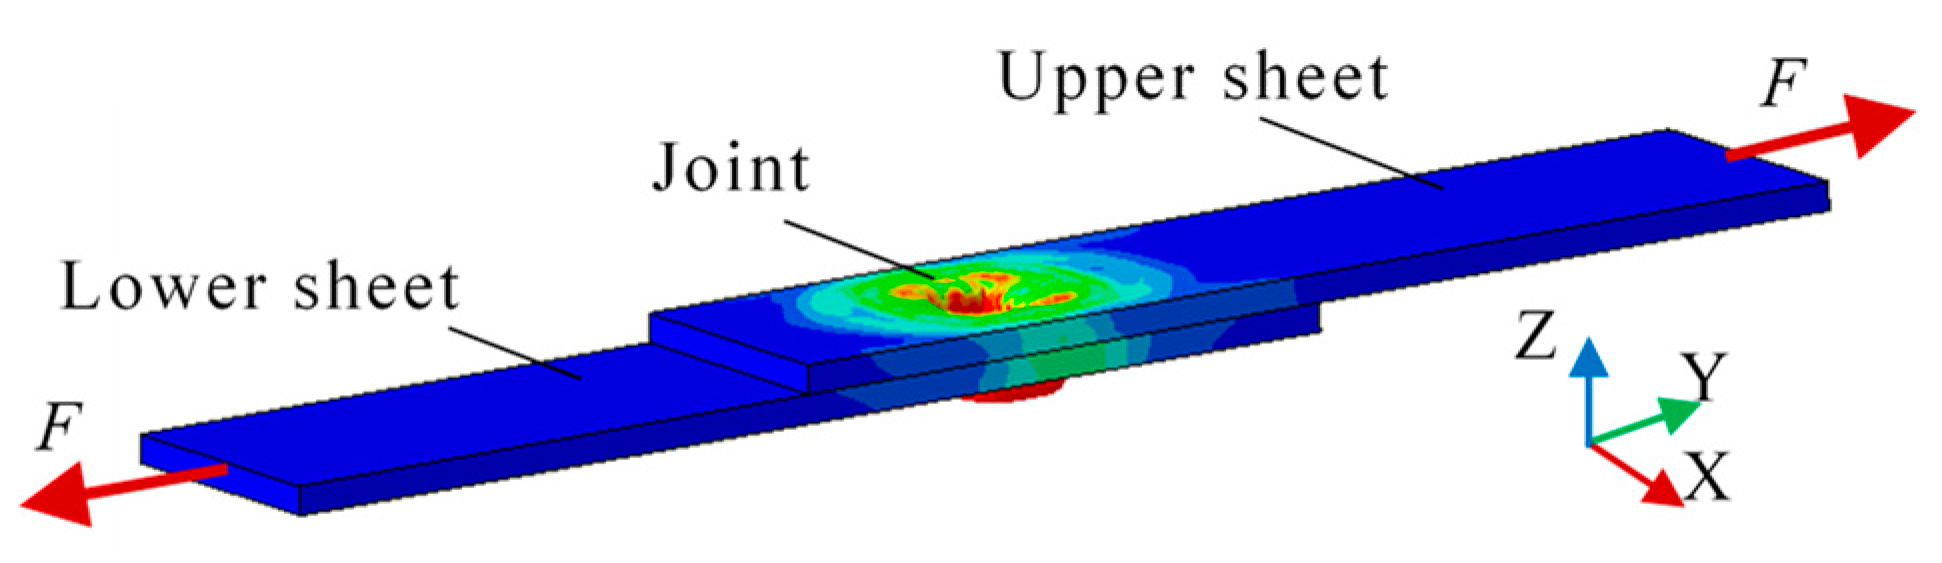
R1, were selected as variables to study the relationship between them and the shearing strength of the joint. The maximum load
Fmax was considered the shearing strength when the joint was destroyed during the shearing process, as shown in
Figure 7.
3. Scheme for Finite Element Simulation
Process parameters can easily be changed using finite element simulation to obtain joint strength with several parameter combinations. The resultant four critical process parameters include the following: the die depth, rotation angle, small fillet radius and large fillet radius. Each parameter has different values and several parameter combinations for simulation. It is important to design schemes that can select reasonable and effective parameter combinations, reduce the number of combinations and accurately analyse the influence of these parameters on shearing strength. A limited number of reasonable and effective combinations of multiple parameters were obtained and the influence of each parameter determined using the Response surface method (RSM). RSM implements deterministic schemes by reasonably selecting test samples and iterative strategies, while using a polynomial function to establish the function of input parameters (factors) and output parameters (response value). In addition, it can reduce the number of experiments in a given number of factors and their levels [
26]. Response values can be obtained by using the scheme. The significance of factors influencing responses can be identified by analysing variances, which is a method used for testing if multiple population means are equal, as well as determining if a second order polynomial regression equation can be constructed, thereby showing the relationship between the four parameters and shearing strength, as shown in Equation (1) [
27].
where
Fmax is the response value,
xi an independent design variable,
n the number of design variables,
a0 the average of the responses,
ai,
aii and
aij the regression coefficients,
xi,
and
xixj the linear, higher-order and interaction effects, respectively, and
ε the random error.
The central composite design (CCD) is one of the design methods of RSM, which is widely used in designing a computer simulation scheme. Consequently, in this study, CCD was used to design the scheme for finite element simulation with four factors and five levels.
Table 1 lists the values of four process parameters, namely: the die depth
h, rotation angle
α, small fillet radius
r1 and large fillet radius
R1, recorded as input factors. Each factor had five values with five levels, and the shearing strength
Fmax was recorded as the response value. Further, 30 groups of simulation samples with different parameter combinations were obtained using the CCD method, as seen in columns 2 to 4 of
Table 2. Thirty groups of samples were connected using rotated clinching to obtain 30 different joints using ABAQUS software based on the finite element model in
Figure 2. These joints were sheared based on the loading direction shown in
Figure 7, and their shearing strengths were obtained as shown in column 6 of
Table 2.
4. Results and Discussion
The die depth
h, rotation angle
α, small fillet radius
r1 and large fillet radius
R1 were considered input factors, while the corresponding shearing strength
Fmax was considered the response value. Thirty groups of samples, as shown in
Table 2, were analysed and calculated using RSM by employing the software design expert v11.0. Firstly, a relational expression that can predict the joint strength of parameters with different values was established. This expression only reflects the quantitative relationship between the effects of the four process parameters on the shearing strength and the significance of each process parameter. Secondly, the influence law of the four process parameters and their interaction on the shearing strength were intuitively analysed by the 3D response surface. This relational expression was evaluated experimentally to analyse if both results were consistent because they were based on the finite element simulation results.
4.1. Relational Expression between Process Parameters and Shearing Strength Fmax
Following RSM, the least squares method was used to perform fitting analysis on 30 groups of simulated data, as seen in
Table 2. The relational expression of all factors (the die depth, rotation angle, small fillet radius, large fillet radius and interactions with each other) and the shearing strength were obtained, as shown in Equation (2).
However, in above equation, there were significant and insignificant factors affecting the shear strength. The significance of all factors in the relational expression was identified using analysis of variance to obtain an ideal relational expression.
Table 3 lists the results of the analysis of variance. The F-value and
p-value show the importance and significance of the equation and its coefficients, respectively. The larger the F-value and the smaller the
p-value, the more important and significant the coefficient of the equation. The significance level of the influence was set at 0.05. The coefficient of the equation had a significant impact on the shearing strength, as it is an important factor when
p < 0.05. Further, the aforementioned coefficient had no significant impact on the shearing strength, as it is an insignificant factor when
p > 0.1.
Based on the results in
Table 3, the F-value of 95.97 and
p < 0.0001 show the relevance of the relational expression. In addition, coefficients
h,
α,
r1,
hα,
αr1,
αR1,
h2,
α2,
r12 and
R12 are significant. The coefficient of single factor
R1 and the interaction coefficients of
hr1,
hR1 and
r1R1 were not significant. Although the
p-value of single factor
R1 was 0.675 (
p > 0.1), all coefficients with single factors and significant interaction factors were retained to obtain an ideal relational expression. Further, the final relational expression of the reduced factors for shearing strength is shown in Equation (3), which predicted the shearing strength of the joint.
The error was studied using the coefficient of fitting degree (
R2) and residual analysis to check the fitting degree and rationality of the relational expression of partial factors, as shown in Equation (3). The residual is the difference between the simulation value and the predicted value calculated from the relational expression. When the
R2 value is 1, a smaller residual and better fitting accuracy are obtained. The coefficient values of the fitting degree (
R2, adjusted
R2 and predicted
R2) for the expression of all factors shown in Equation (2) and the expression of the partial factors shown in Equation (3) were compared, as shown in
Table 4. The adjusted
R2 conformed to
R2, and the predicted
R2 (0.9541) of the expression of partial factors improved, showing that this expression was more feasible.
The residual is expressed in a residual diagram and the abnormal data points can be seen throughout the residual diagram. The values of the process parameters in
Table 2 were substituted in Equation (3), the corresponding predicted values of the shearing strength were calculated and the residuals between the simulated and predicted values were obtained. Further, the residuals were irregularly distributed within the scope of (−3.3) and without abnormal data points, as shown in
Figure 8a–c. As shown in
Figure 8d, the simulated and predicted values of the shearing strength revealed linear regression, with a coefficient of fitting degree
R2 = 0.9866 (approaching 1). This showed that the residual was smaller and the fitting degree better. Conformity between the simulated and predicted values of the shearing strength was observed. Consequently, the expression of the partial factors presented in Equation (3) was valid, which could be used to predict the shear strength of joints with different parameters.
4.2. Analysis of the Influence of Process Parameters on the Shearing Strength Fmax
Although the relationship between the four parameters and the shearing strength was established and the shearing strength of each parameter with different parameter values was calculated, it is necessary to further analyse the degree of effect of each parameter on the shearing strength and their effect law.
Figure 9 shows the degree of effect (expressed as percentage contribution) of various parameters for shearing strength. It can be seen from the figure that the highest significance of single factors on shearing strength was recorded as the die depth
h (47.1%), followed by the rotation angle
α (26.8%) and small fillet radius
r1(8.2%). The least was the large fillet radius
R1. The significance of interaction factors on shearing strength
Fmax is as follows: rotation angle
α and small fillet radius
R1, rotation angle
α and small fillet radius
r1, die depth
h and rotation angle
α.
Figure 10 shows the 3D response surface graphs, indicating the effect of the process parameters on shearing strength. The laws of effect of a single process parameter and their interactions on shearing strength
Fmax are discussed below.
The law of effect of single process parameters on shearing strength will now be discussed. As shown in
Figure 10a, increasing the die depth would lead to a drastic drop in the shearing strength. The material subjected to the rotated clinching process would experience more stress upon increasing the die depth due to a higher tensile strain. Consequently, the material flow during high tension strain would cause a rapid drop in the neck thickness when the die depth increases, leading to a decrease in the shearing strength.
Further, as seen in
Figure 10a–c, an increase in the rotation angle would lead to an increase in shear strength. Consequently, the material subjected to the rotated clinching process would experience more compressive stress due to higher compressive strain. This will lead to an increase of the interlock, thereby increasing the shearing strength.
Furthermore, an increase in the small fillet radius will lead to reduced shearing strength. During the rotated clinching process, tension from bending in the sheet material reduces as the value of the small fillet increases, thereby limiting the formation of interlocks. Consequently, the shearing strength decreased, as shown in
Figure 10b.
The law of effect of interaction between single process parameters on shearing strength was also considered. All the response surface graphs were curved rather than planar, revealing that the effects of these interactions of parameters on the shearing strength of the joint were nonlinear. The more the bending of the response surface graph was obvious, the greater the influence of the interaction on the shearing strength. As seen in
Figure 10a, the shearing strength of the joint was significantly improved by increasing the rotation angle
α when the die depth
h was at a lower level. Contrarily, an increase in the rotation angle had a significant effect on the shearing strength when the die depth was at a higher level (
h > 2.3 mm). As see in
Figure 10b, the shearing strength was minimum when the small fillet radius was higher (
r1 > 0.4 mm) and the rotation angle lower (
α < 18.37°). A joint with better shearing strength was obtained with a small fillet radius at the medium level (0.2 mm <
r1 < 0.4 mm) and a rotation angle at a higher level (
α > 18.74°). Additionally, a joint with better shearing strength was obtained with a large fillet radius at a lower level (
R1 < 1.4 mm), combined with a rotation angle at higher level (
α > 18.74°), as shown in
Figure 10c. The shearing strength was significantly improved by increasing the rotation angle
α.
The above results show that the effect of each parameter was mutually restricted. When the optimal combination was attained, the shearing strength was maximum. The optimal process parameters of the joint were obtained using response surface analysis, with a die depth of 2.29 mm, small fillet radius of 0.46 mm, large fillet radius of 1.27 mm and rotation angle of 18.48°. From these parameters, the predicted value of shearing strength of the joint was 1231.92 N.
4.3. Experimental Evaluation of Relational Expression
Experimenting is the most direct method to evaluate shearing strength. Experiments are required to verify the predicted result of the relational expression and further evaluate the rationality of the relational expression.
As the die depth is a significant parameter in shearing strength, and considering the cost of tool processing, experiments were carried out for three groups (15, 24 and 29), as seen in
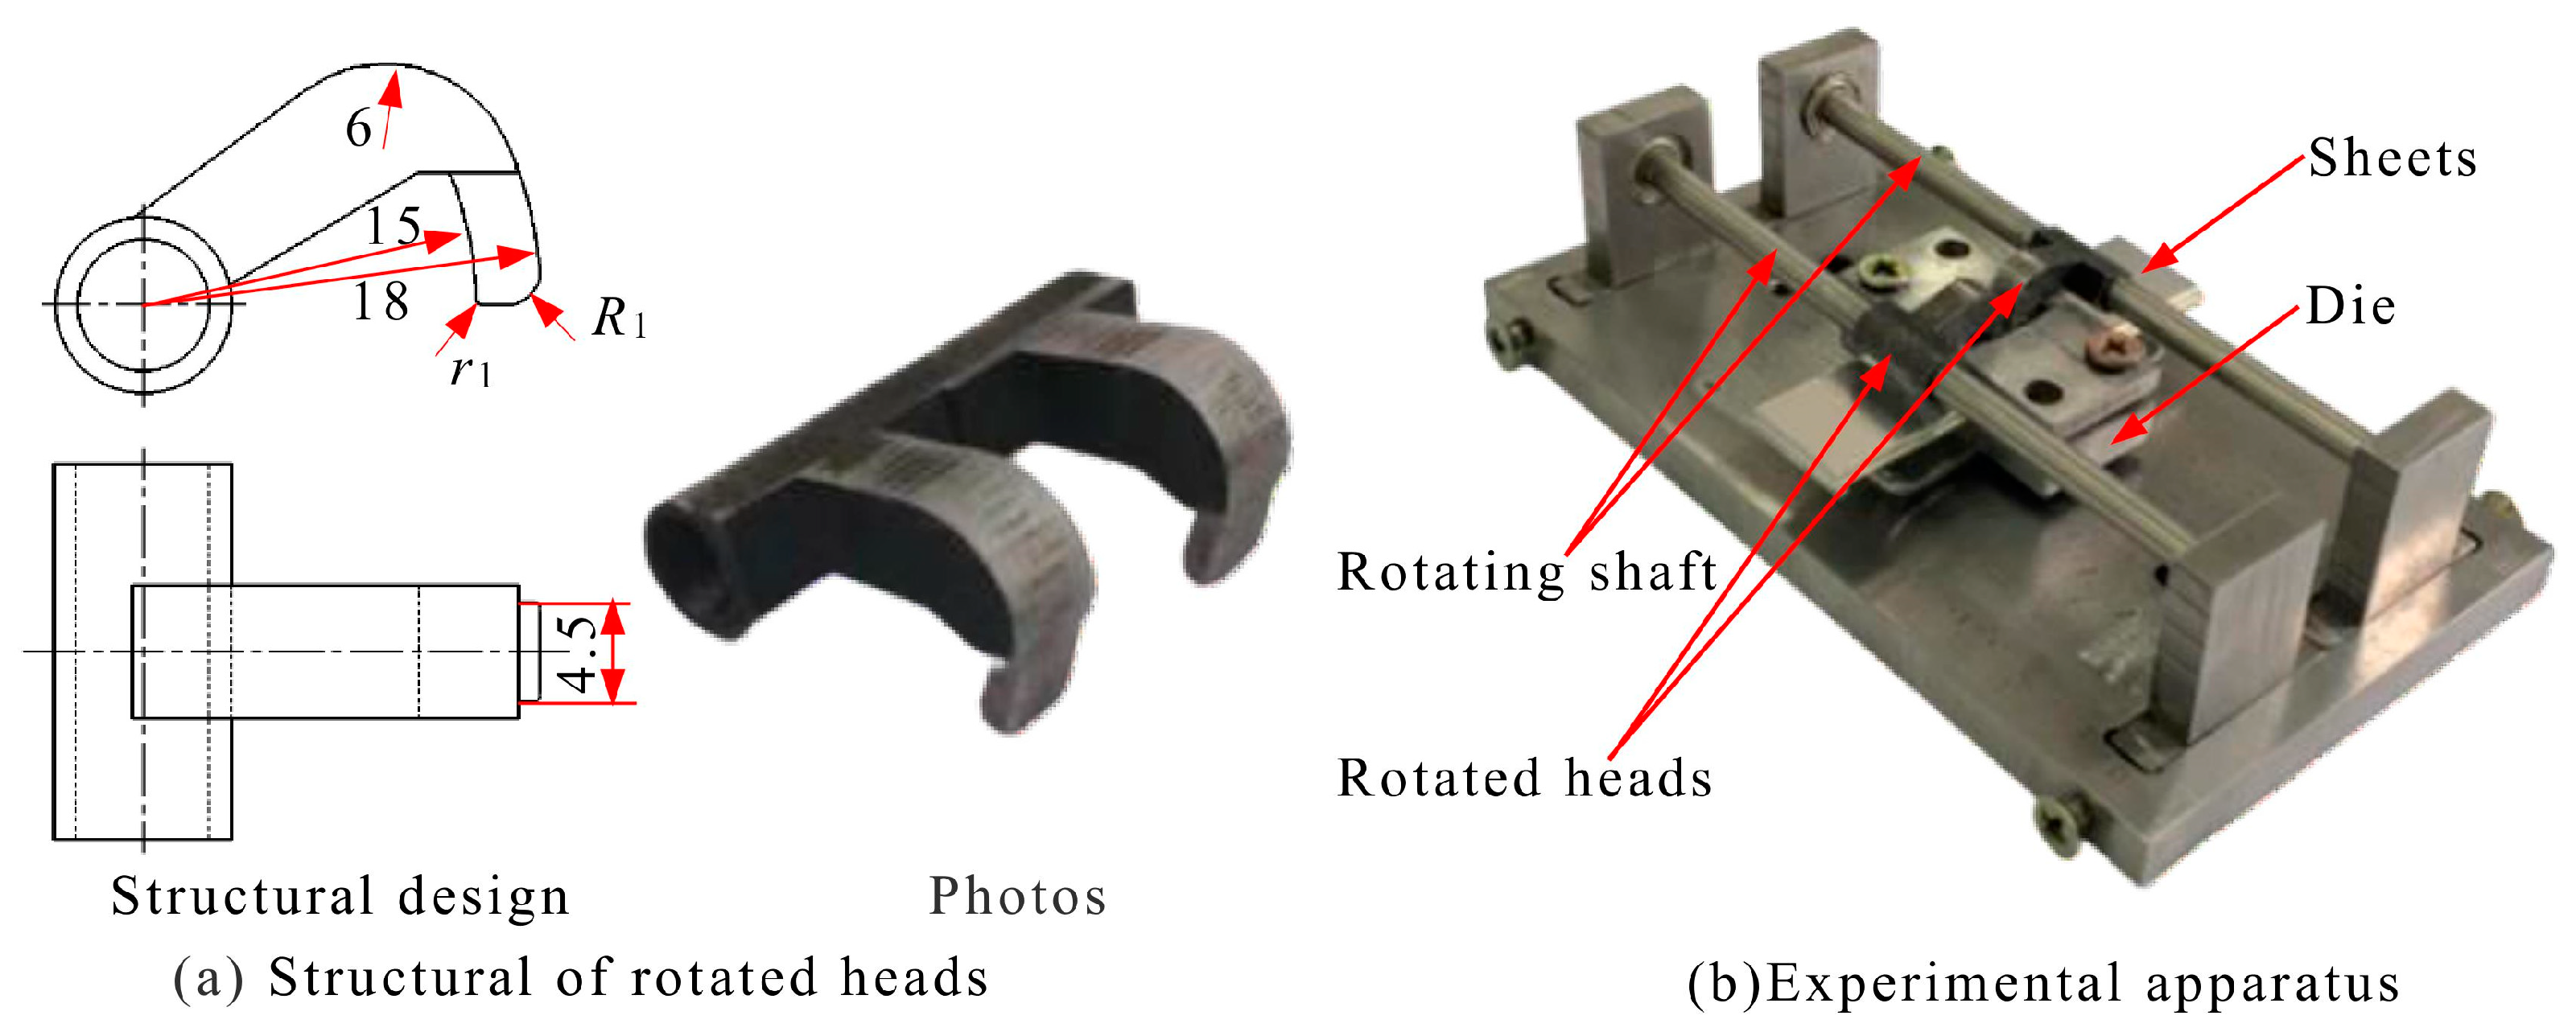
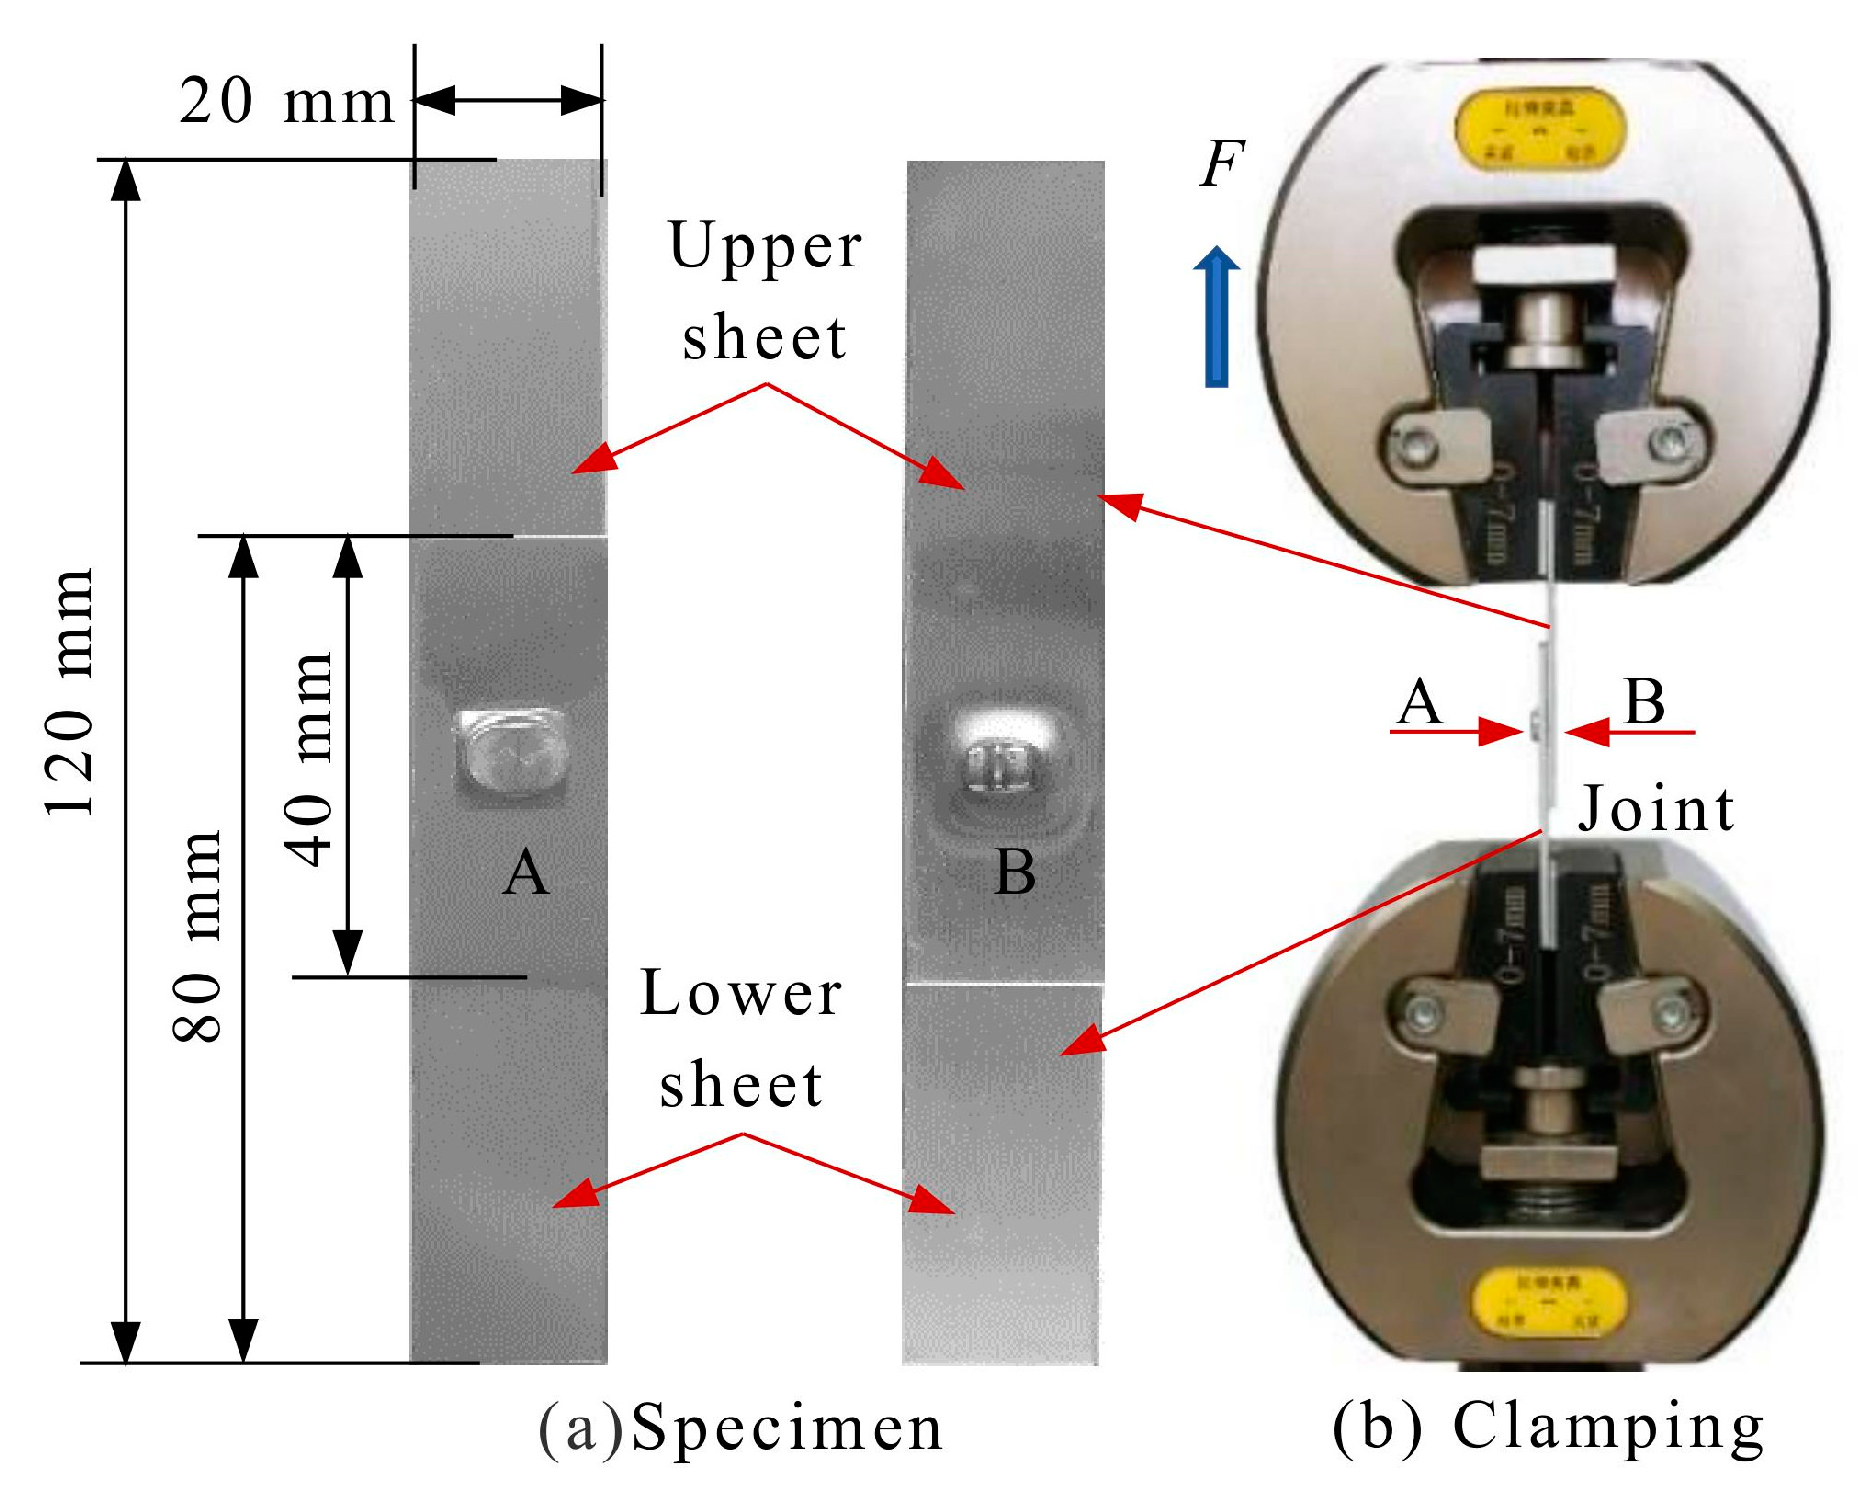
Table 2. In this study, they correspond to three different die depths, that is, 2.3, 2.4 and 2.2 mm, respectively. The experiments for each group were performed thrice and the average value of the shearing force was obtained. Further, the size of the experimental specimens conformed to those of the simulation. The experimental apparatus for the rotated clinching forming developed by our group (shown in
Figure 11) was used to join Al1060 sheets. Furthermore, shearing tests were carried out on the formed joints using WDW-100100GD tensile testing machines to obtain the shearing strength.
Figure 12 shows the shearing specimen and its clamping.
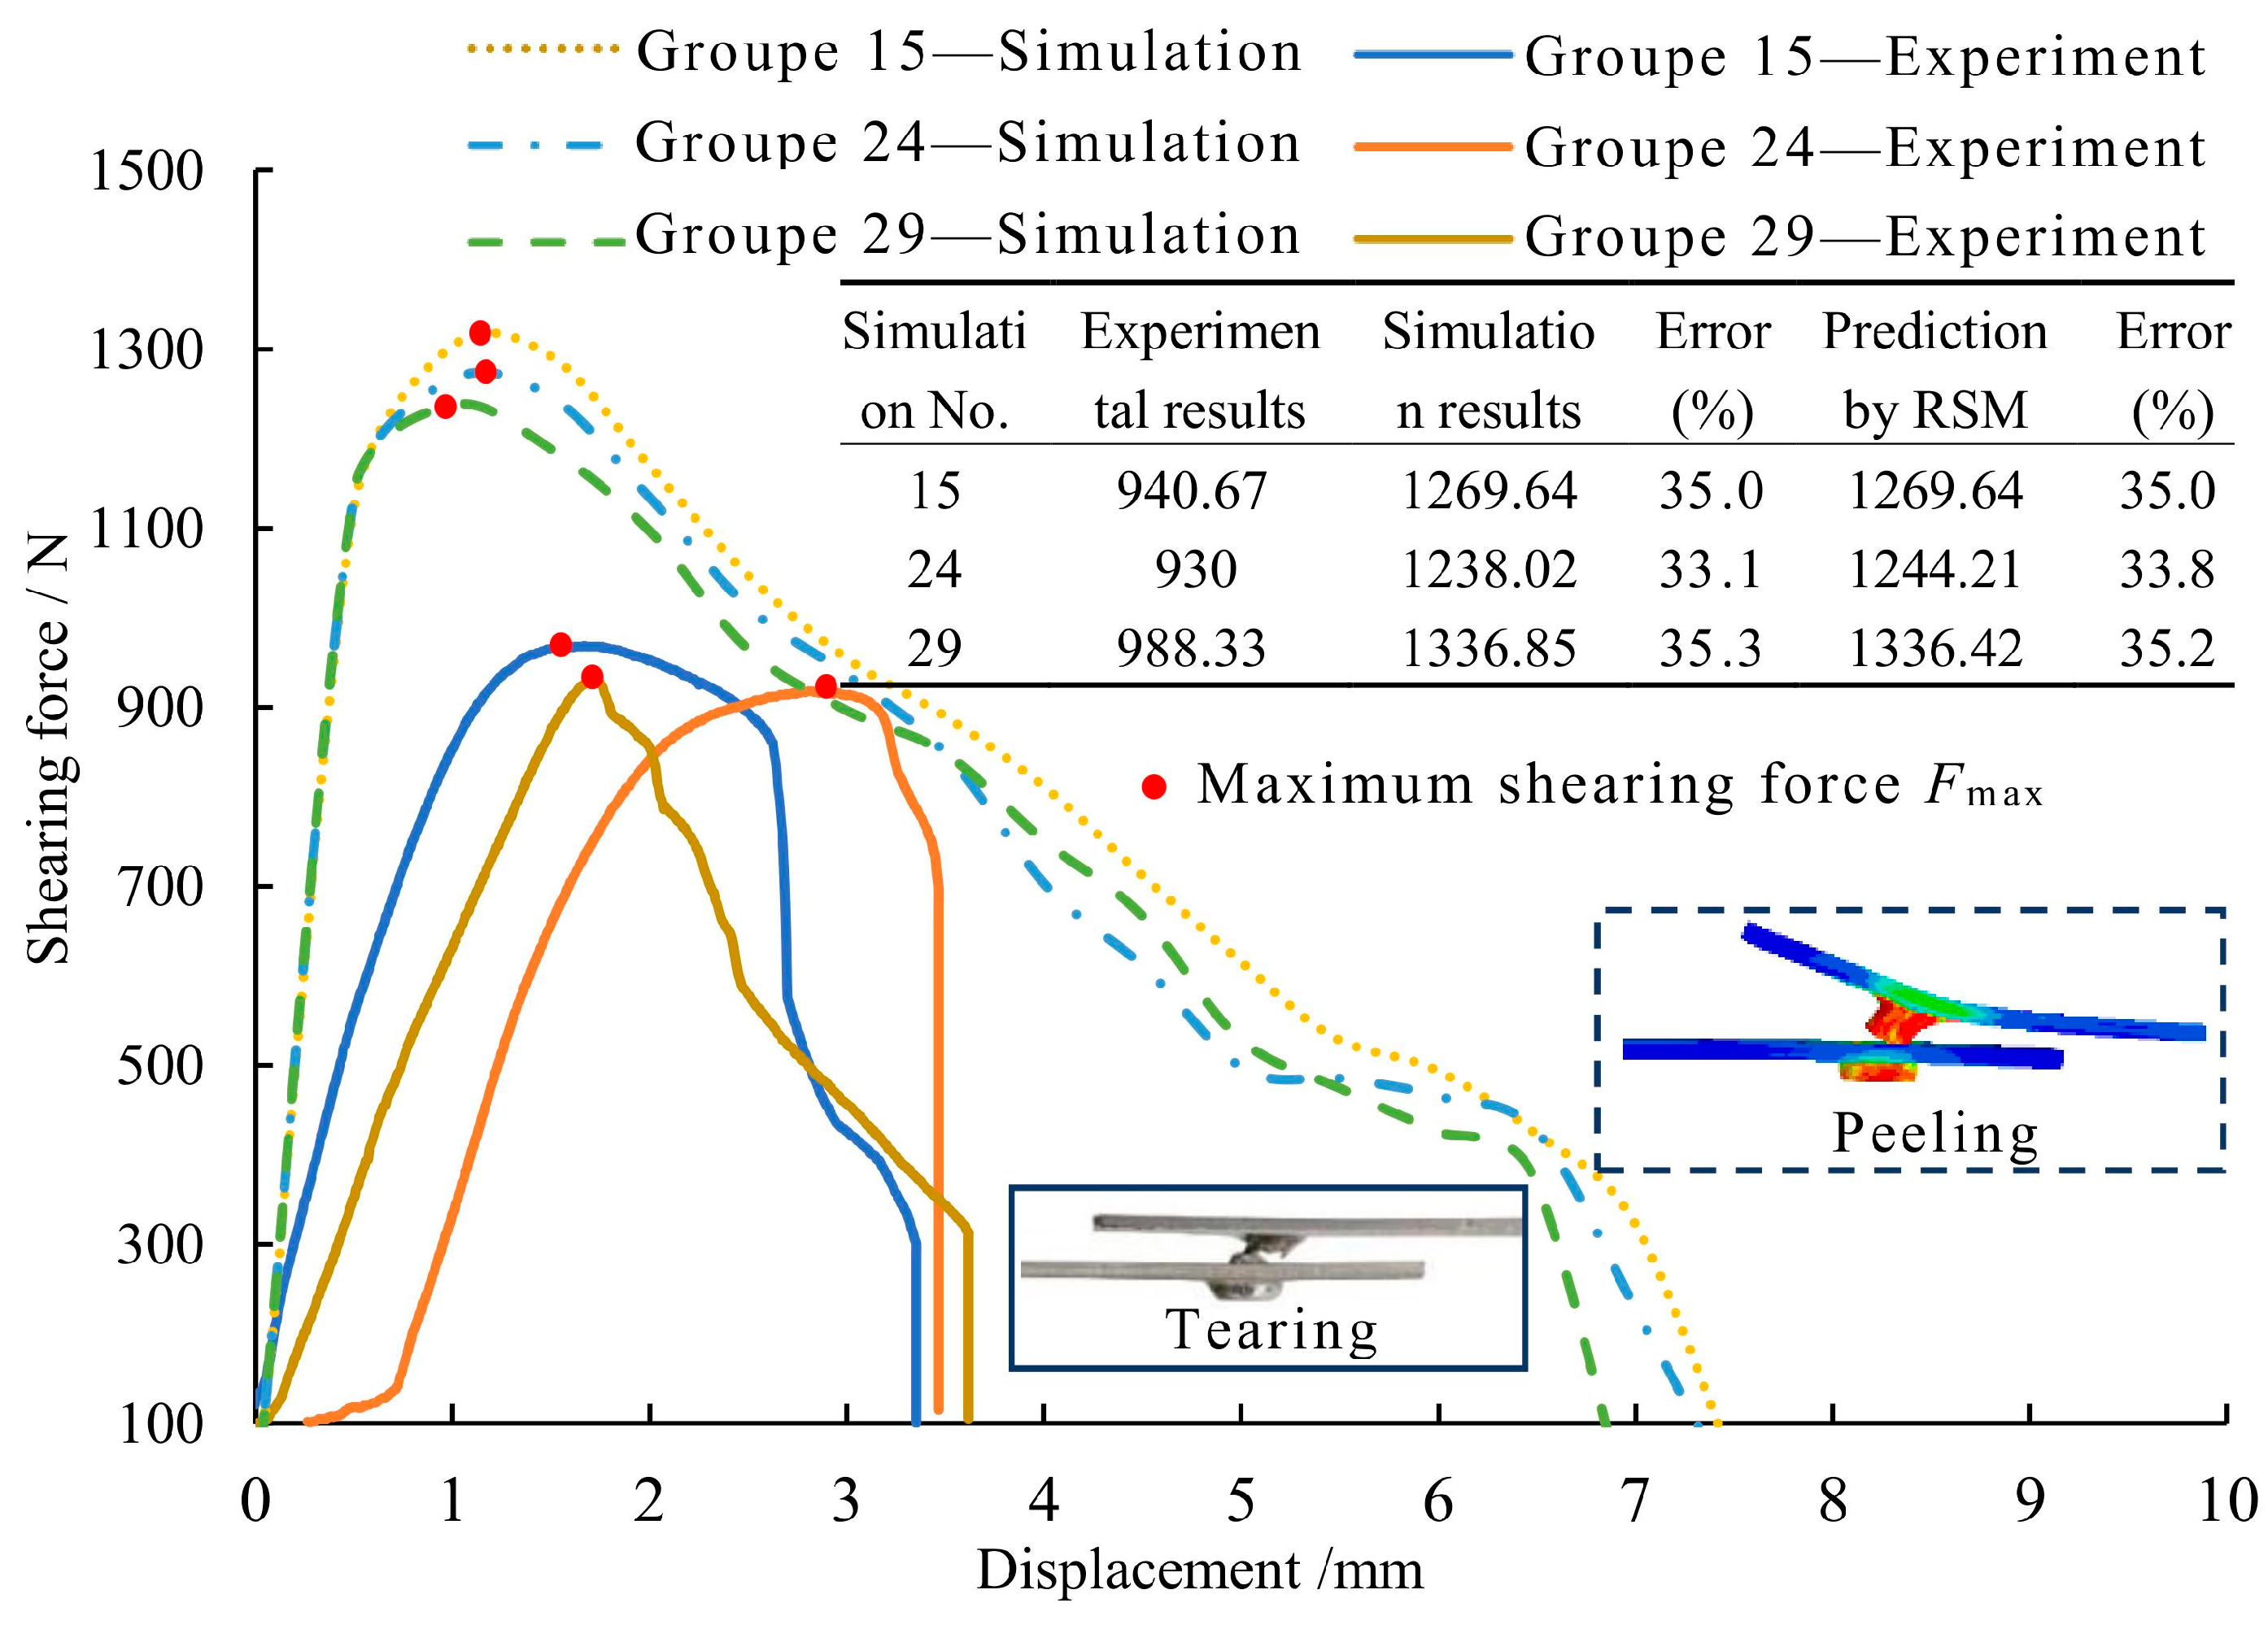
The shearing strength (expressed by the maximum shearing force) of the joint obtained by experiment is shown in
Figure 13. The relative errors of the maximum shearing force (represented by the red dot on the curve) between the experiment and the simulation for three groups of 15 (2.3 mm), 24 (2.4 mm) and 29 (2.2 mm) were 35%, 33.1% and 35.3%, respectively, and the corresponding relative errors between the results of the experiment and the prediction for the three groups were 35%, 33.8% and 35.2%, respectively. Additionally, the simulation and prediction values were relatively greater than those of the experiment. This is because the ductile damage of the material was not considered in the finite element simulation model, resulting in greater shearing strength values of the simulation joints. Furthermore, since the data used to establish the relational expression were derived from the results of the finite element simulation, the values of the relational expression are also larger. In addition, the failure modes of the experimental and simulation joints were the tearing and peeling failures, respectively, as shown in
Figure 12. The tearing of the material directly led to a decrease in the shearing strength of the joint.
Figure 14 illustrates the final deformed shape of rotated clinching joints. The experimental and simulated results were compared using three important characteristic parameters (neck thickness interlock and minimum bottom thickness) of the joints. As shown in
Figure 14, the neck thickness of the simulation joint was larger than its interlock value, leading to the peeling failure of the joint in the shearing test. Additionally, the neck thickness of the joint experiment obtained was less than its interlock value, leading to the tearing failure of the joint in the shearing test.
The analysis results show that the maximum relative error between the experimental results and predicted results of shear strength was 35.2%. Although there is a slight deviation between the experimental and predicted values, the trend of change is similar. The experimental results of each group of shear strength were less than the predicted results (approximately 74% of the predicted results).
5. Conclusions
In this study, we analysed the effect of process parameters on the shearing strength of joints by rotated clinching of Al1060 sheets. The simulation scheme was designed using CCD and simulated using the finite element method. In addition, the significance of each process parameter on the shearing strength was analysed based on RSM. The main results obtained are as follows:
The rotated clinching process was simulated using finite element simulation and four critical process parameters (die depth h, rotation angle α, small fillet radius r1 and large fillet radius R1) were determined using finite element analysis.
The results of the analysis of variance revealed that the order of the effect of all four process parameters on shearing strength Fmax were as follows: die depth h (47.1%), rotation angle α (26.8%) and small fillet radius r1 (8.2%). Further, the order of the effect of interaction on shearing strength Fmax was as follows: rotation angle α and large fillet radius R1, rotation angle α and small fillet radius r1, rotation angle α and die depth h. Furthermore, a joint with high strength was obtained when die depth h was at a lower level, the large fillet radius R1 was at the middle level and the rotation angle α was at a higher level.
The response surface graphs revealed that the shearing strength Fmax decreased alongside the die depth h, whereas small fillet radius r1 increased, increasing significantly with rotation angle α. Further, the rotation angle α had an insignificant effect on the shearing strength Fmax at higher levels of large fillet radius R1 and small fillet radius r1. The predicted maximum value of the shearing strength Fmax (1231.92 N) was attained at a die depth of 2.29 mm, small fillet radius of 0.46 mm, large fillet radius of 1.27 mm and rotation angle of 18.45°.
The results of the experimental evaluation showed that the experimental values of the shearing strength of the joint were less than the predicted values, which were approximately 74% of the predicted values, while the error was between 33.8% and 35.2%.
From the research results, it is clear that there are some deviations in the experimental results that may have been as a result of several factors. These factors are as follows: (1) the accuracy of the finite element model may have been affected by the material properties of joint fracture, meshing quality and the changing friction coefficient in the forming process; (2) only four key process parameters were selected without considering other effect parameters, thereby limiting the number of samples to save time and improve efficiency; (3) the values of the process parameters may have affected the connection strength of the joint; and (4) there may have been a certain error when controlling the bottom thickness during the experiment (as shown in
Figure 13) due to the insufficient accuracy of the machine and tool machining. Although some errors between the experimental and predicted results were recorded, the relational expression between the four process parameters (die depth, rotation angle, small fillet radius and large fillet radius) and joint shearing strength was established with fewer experimental groups using the response surface method. Additionally, the quantitative relationship between them was expressed by this relational expression, and the significance of process parameters was obtained using the analysis of variance. The influence laws of different effect factors and their interaction on the joint shearing strength were obtained. This is relevant in studying the influence of process parameters on joint strength using the response surface method. In a follow-up study, the finite element model will be further optimised by refining the mesh and optimising material parameters. Additionally, models with other parameters, including spacing between rotated heads, will be established. Further, techniques on adopting more effective methods to improve the precision of the experimental device and the machining of the tools to obtain the rotated clinching joint with improved strength will be investigated. Furthermore, the connection strength in different directions will be studied to better evaluate the mechanical properties of the joint using a rotated clinching process.


