
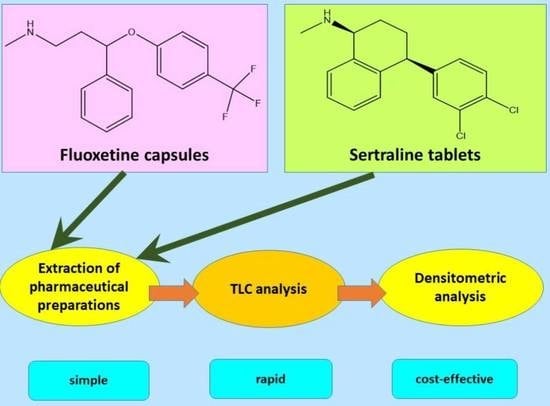
New TLC Method Combined with Densitometry for Determination of Sertraline and Fluoxetine in Pharmaceutical Preparations


Abstract
:
1. Introduction
2. Materials and Methods
2.1. Pharmaceutical Reference Standards, Drugs, and Chemicals
2.2. Investigations of Selectivity of Method
- Solution I—acid hydrolysis—3 mL of sertraline (fluoxetine) primary solution was taken, 1 mL of methanol and 1 mL of 2 M NaOH were added;
- Solution II—alkaline hydrolysis—3 mL of sertraline (fluoxetine) primary solution was taken, 1 mL of methanol and 1 mL of 2M HCl were added;
- Solution III—3 mL of sertraline (fluoxetine) primary solution was taken, 1 mL of methanol and 1 mL of distilled water were added;
- Solution IV—oxidation—3 mL of the primary solution of sertraline (fluoxetine) were taken, 1 mL of methanol and 1 mL of 3% H2O2 were added;
- Solution V—3 mL of sertraline (fluoxetine) primary solution was taken, 1 mL of methanol and 1 mL of physiological saline (normal saline, 0.9% solution of sodium chloride) were added;
- Solution VI—3 mL of sertraline (fluoxetine) stock solution was taken and 2 mL of methanol was added.
- Solution VII—3 mL of sertraline (fluoxetine) stock solution was taken, 2 mL of methanol was added.
- Standard solutions—3 mL of sertraline (fluoxetine) stock solution was taken, 2 mL of methanol was added.
2.3. Preparation of Drug Samples
2.4. Conditions for the Analysis of Drug Samples by TLC Combined with Densitometry
2.5. Linearity and Range
2.6. Accuracy of the Method
2.7. Precision of the Method
2.8. Limit of Quantification and Detection Limit of the Method
2.9. Robustness
3. Results and Discussion
3.1. Validation of TLC-Densitometric Method
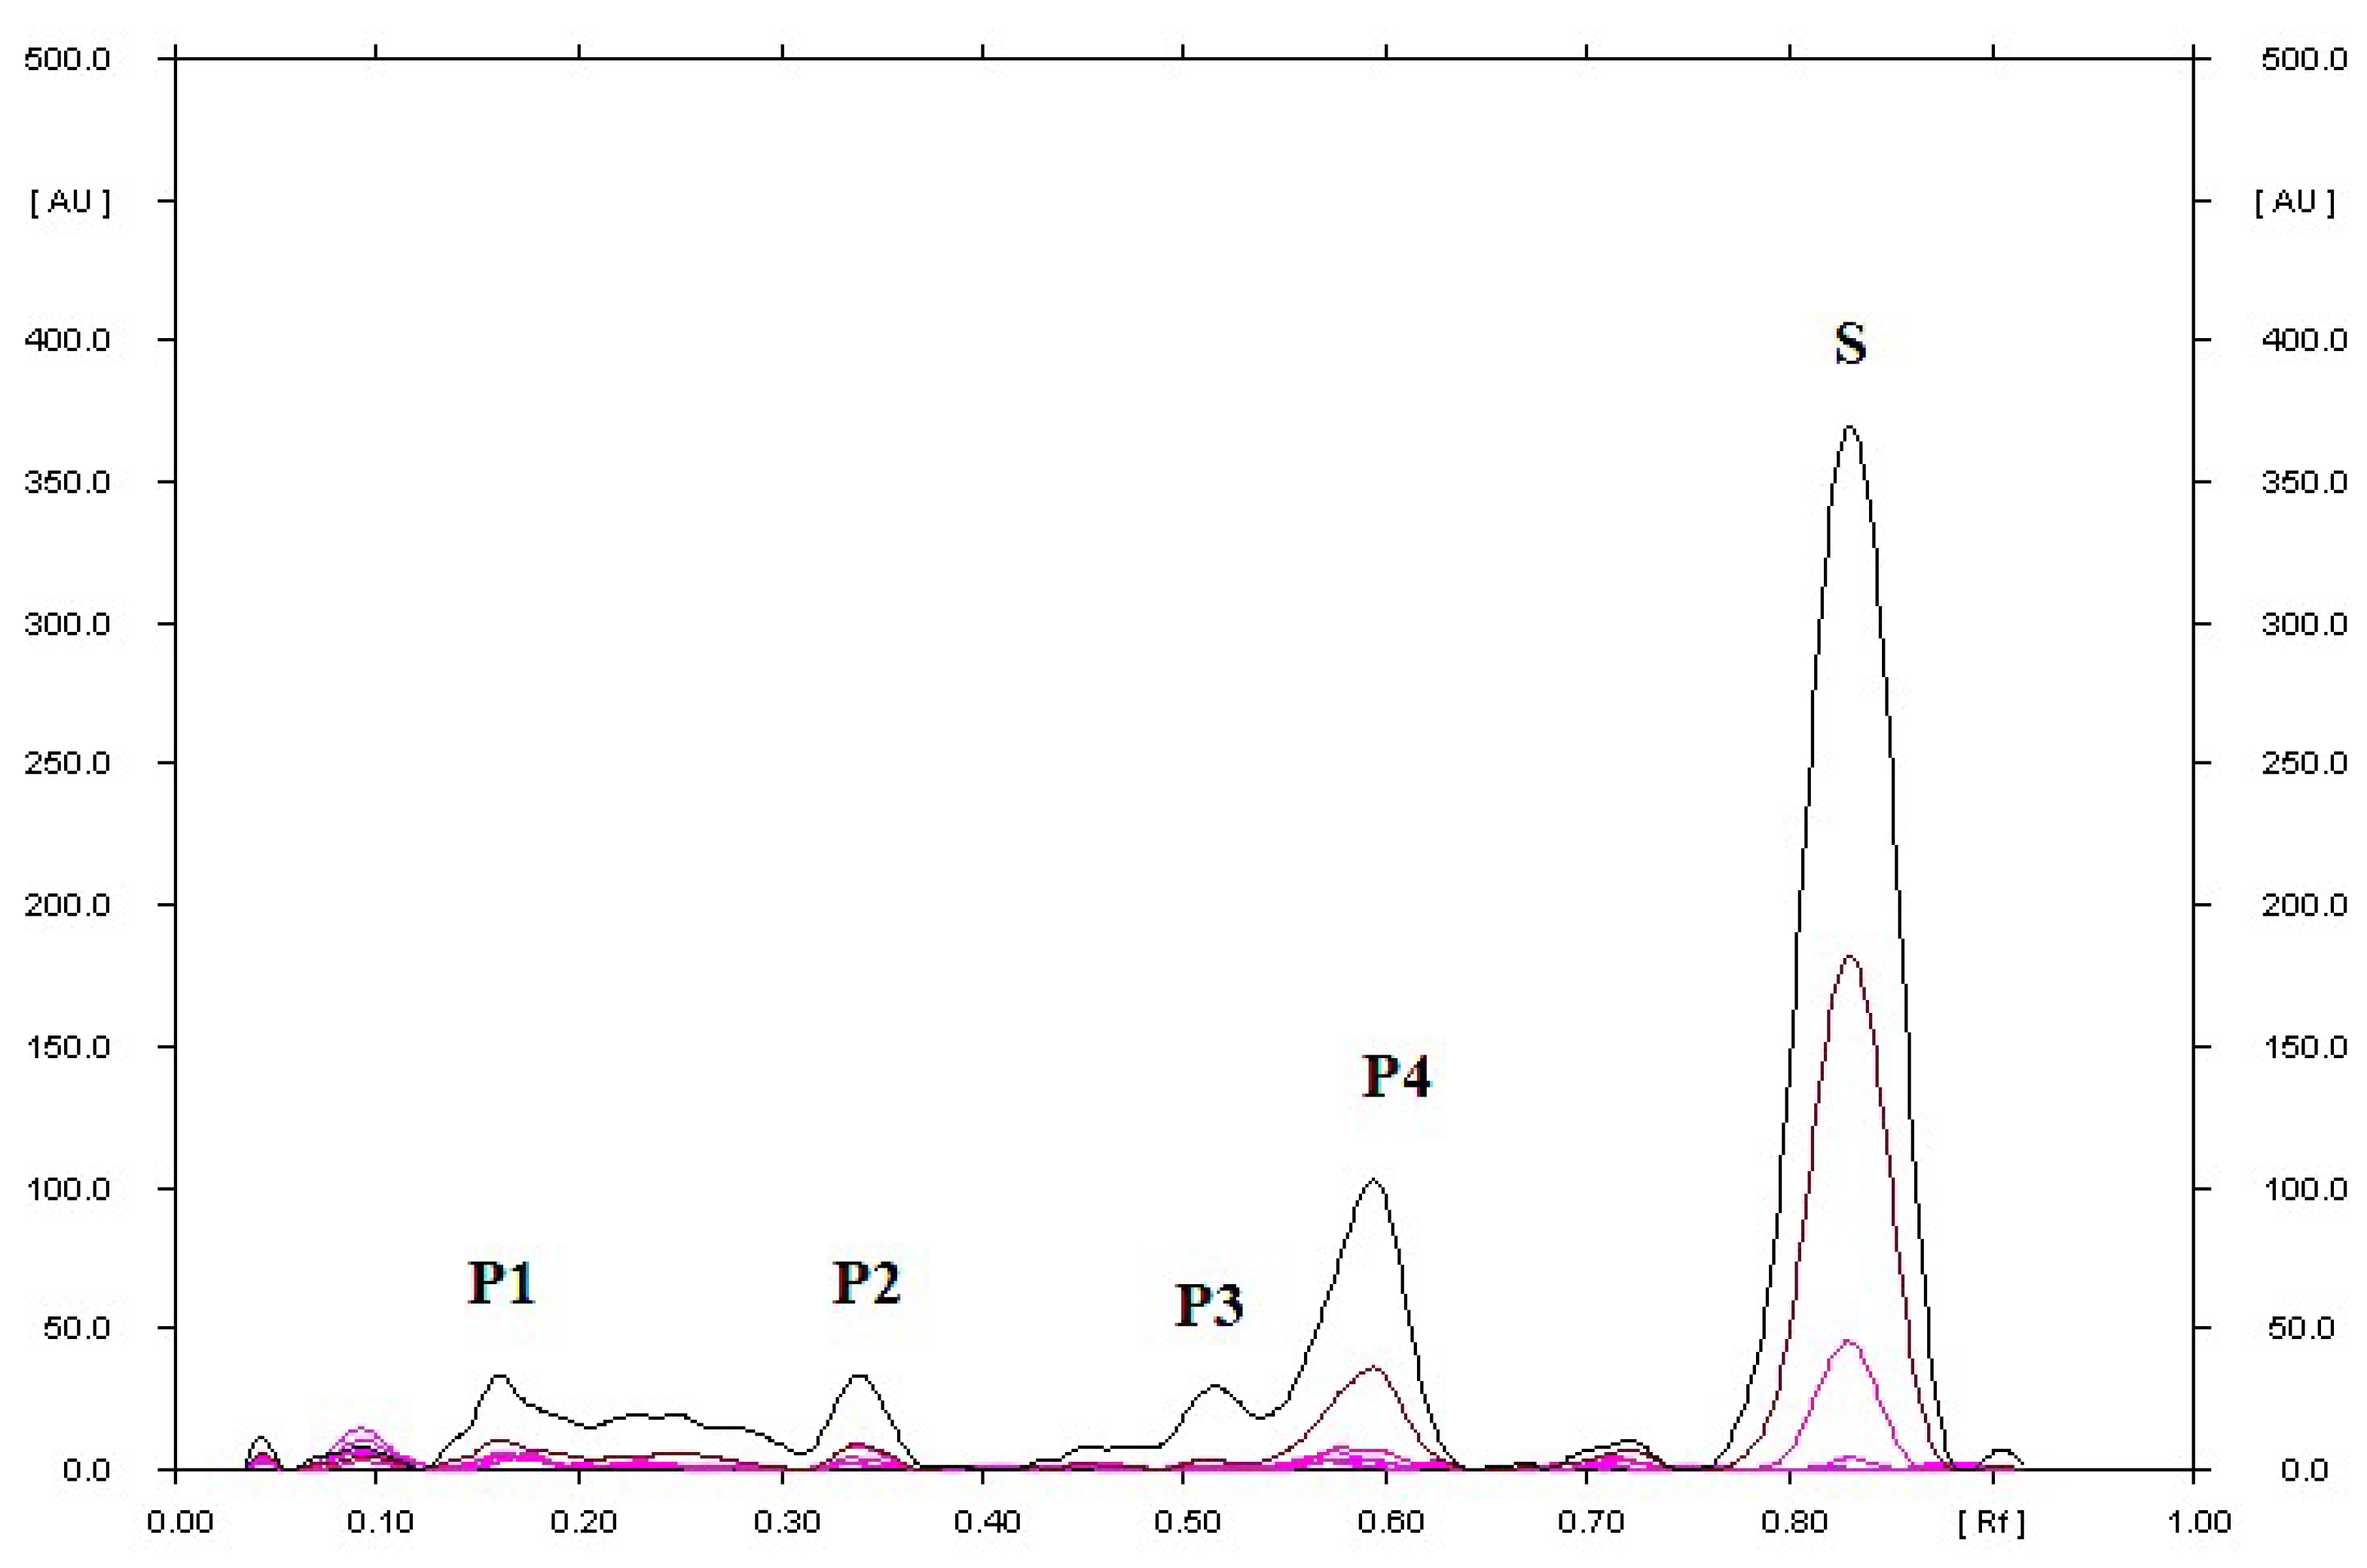
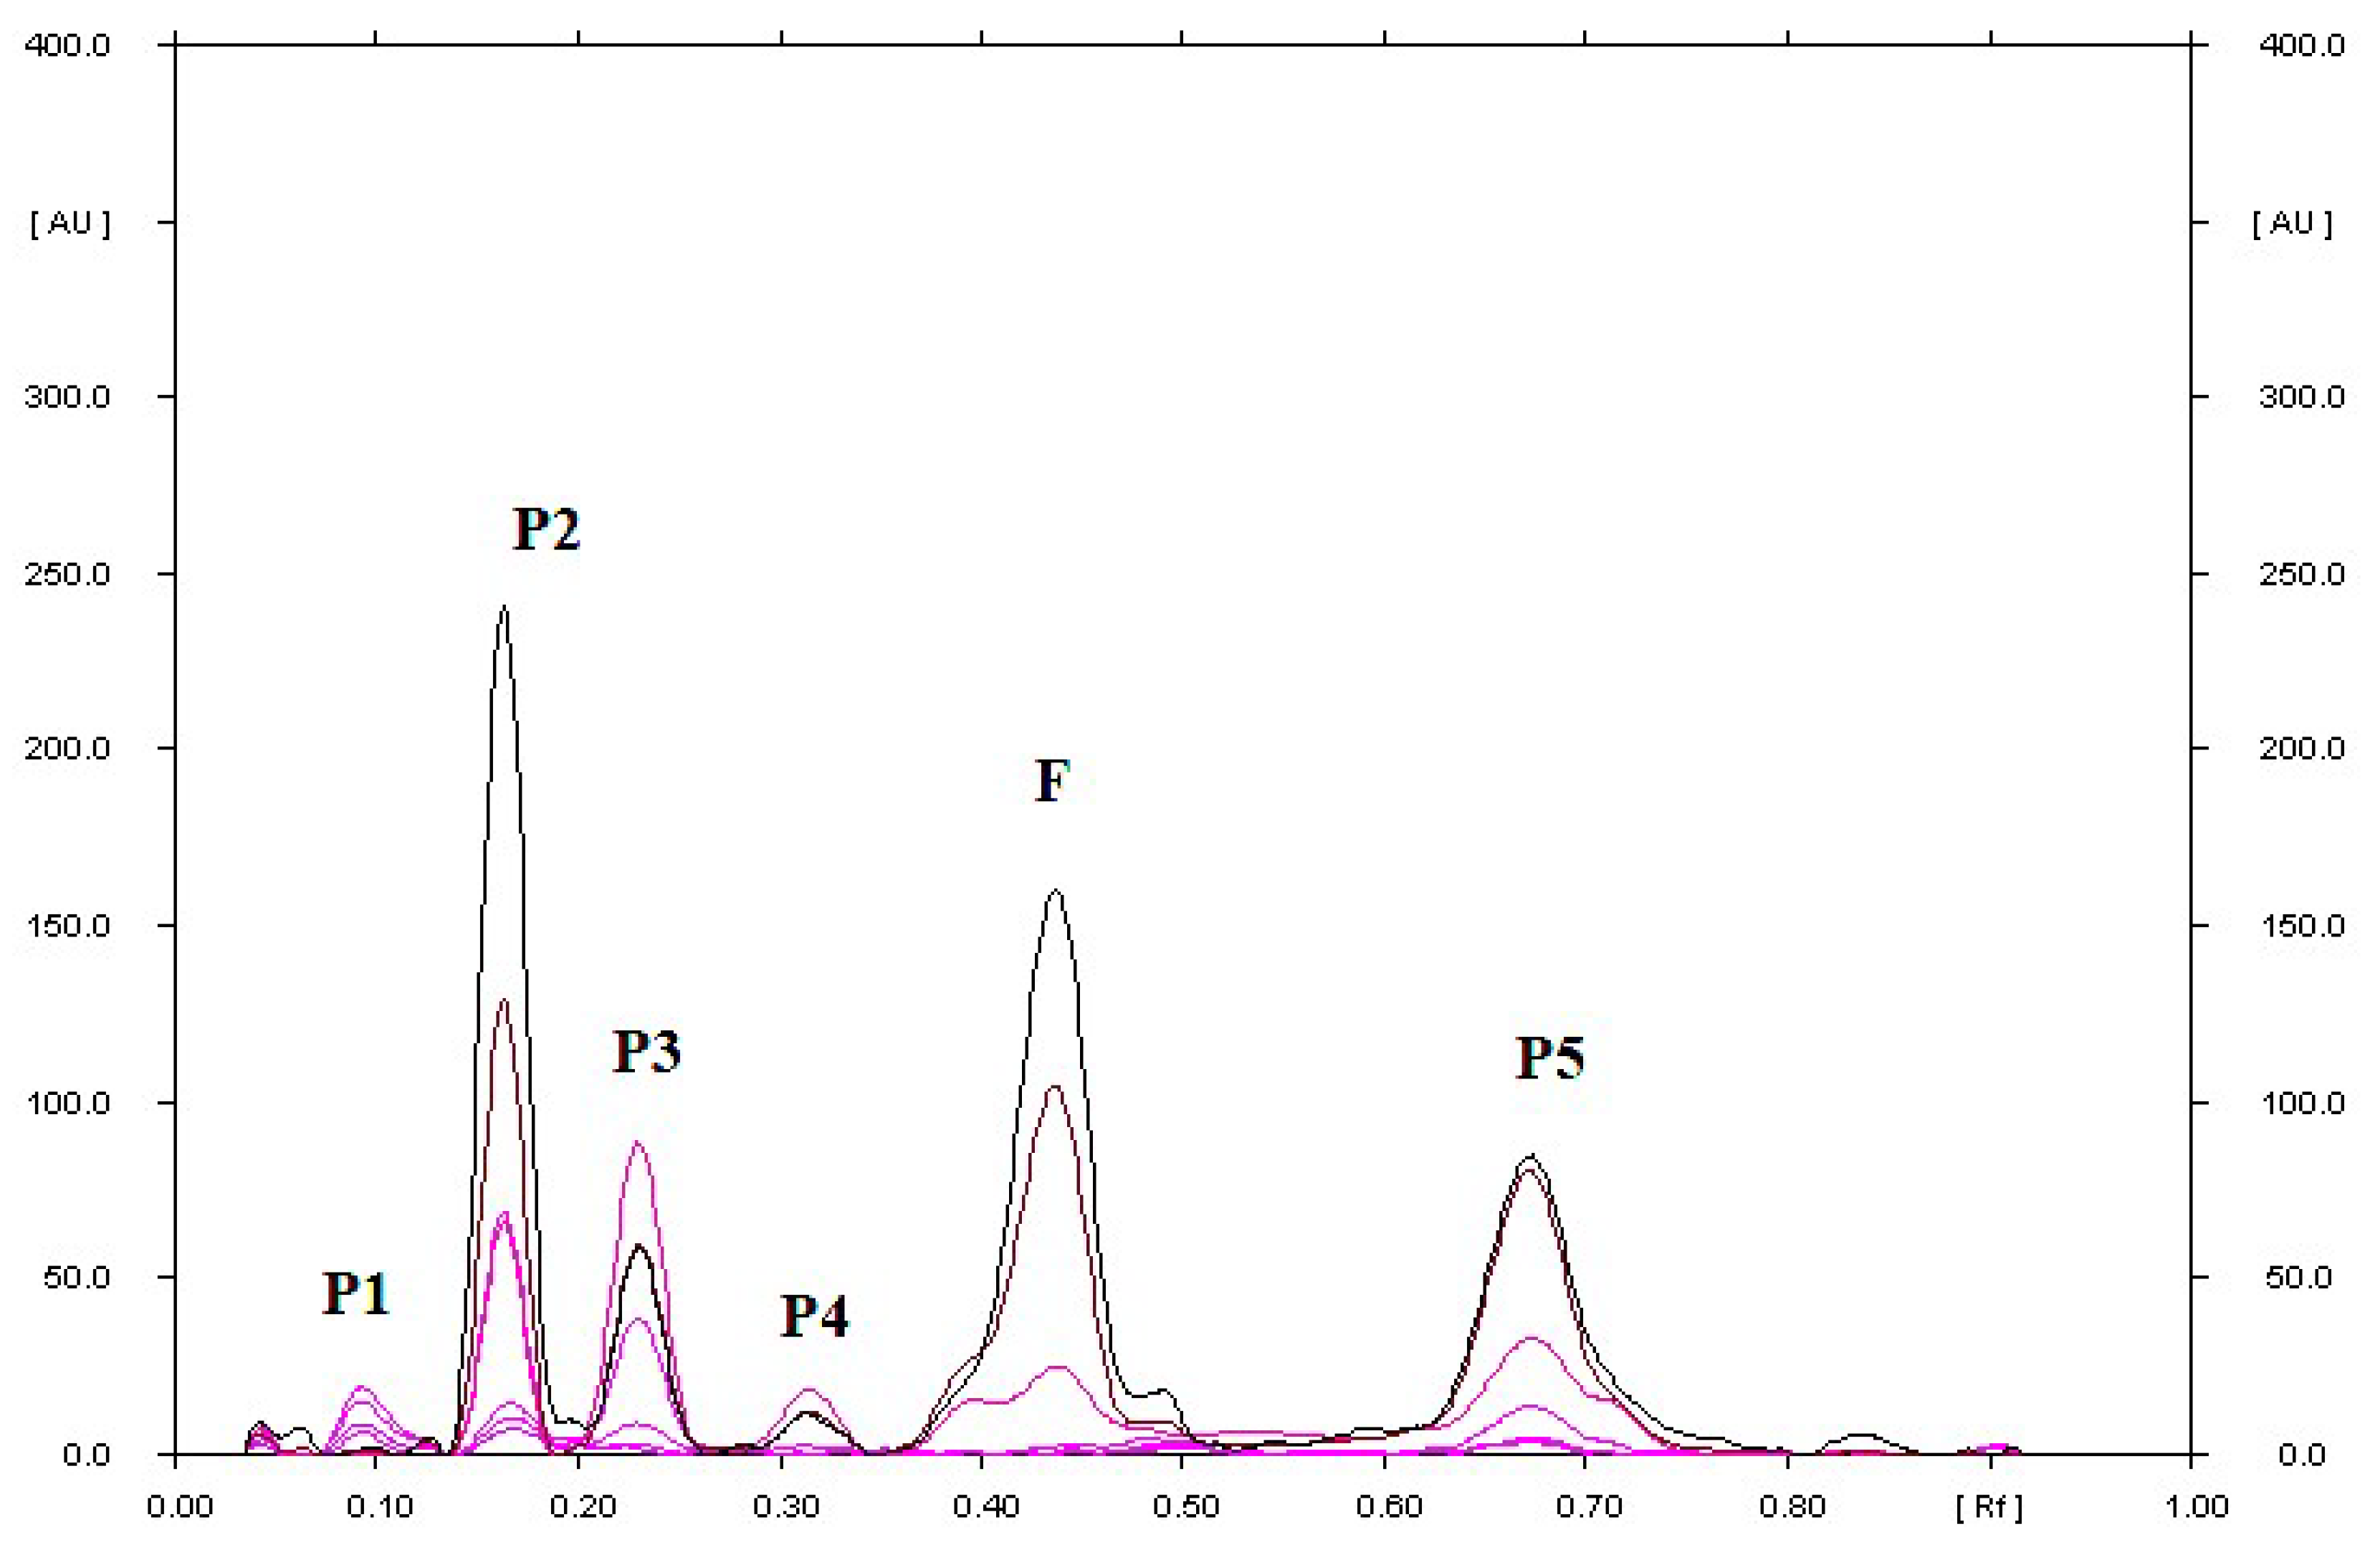
3.1.1. Selectivity of the Method
3.1.2. Linearity and Range
3.1.3. Accuracy
3.1.4. Precision
3.1.5. Limit of the Quantification and Limit of the Detection of the Method
3.1.6. Robustness
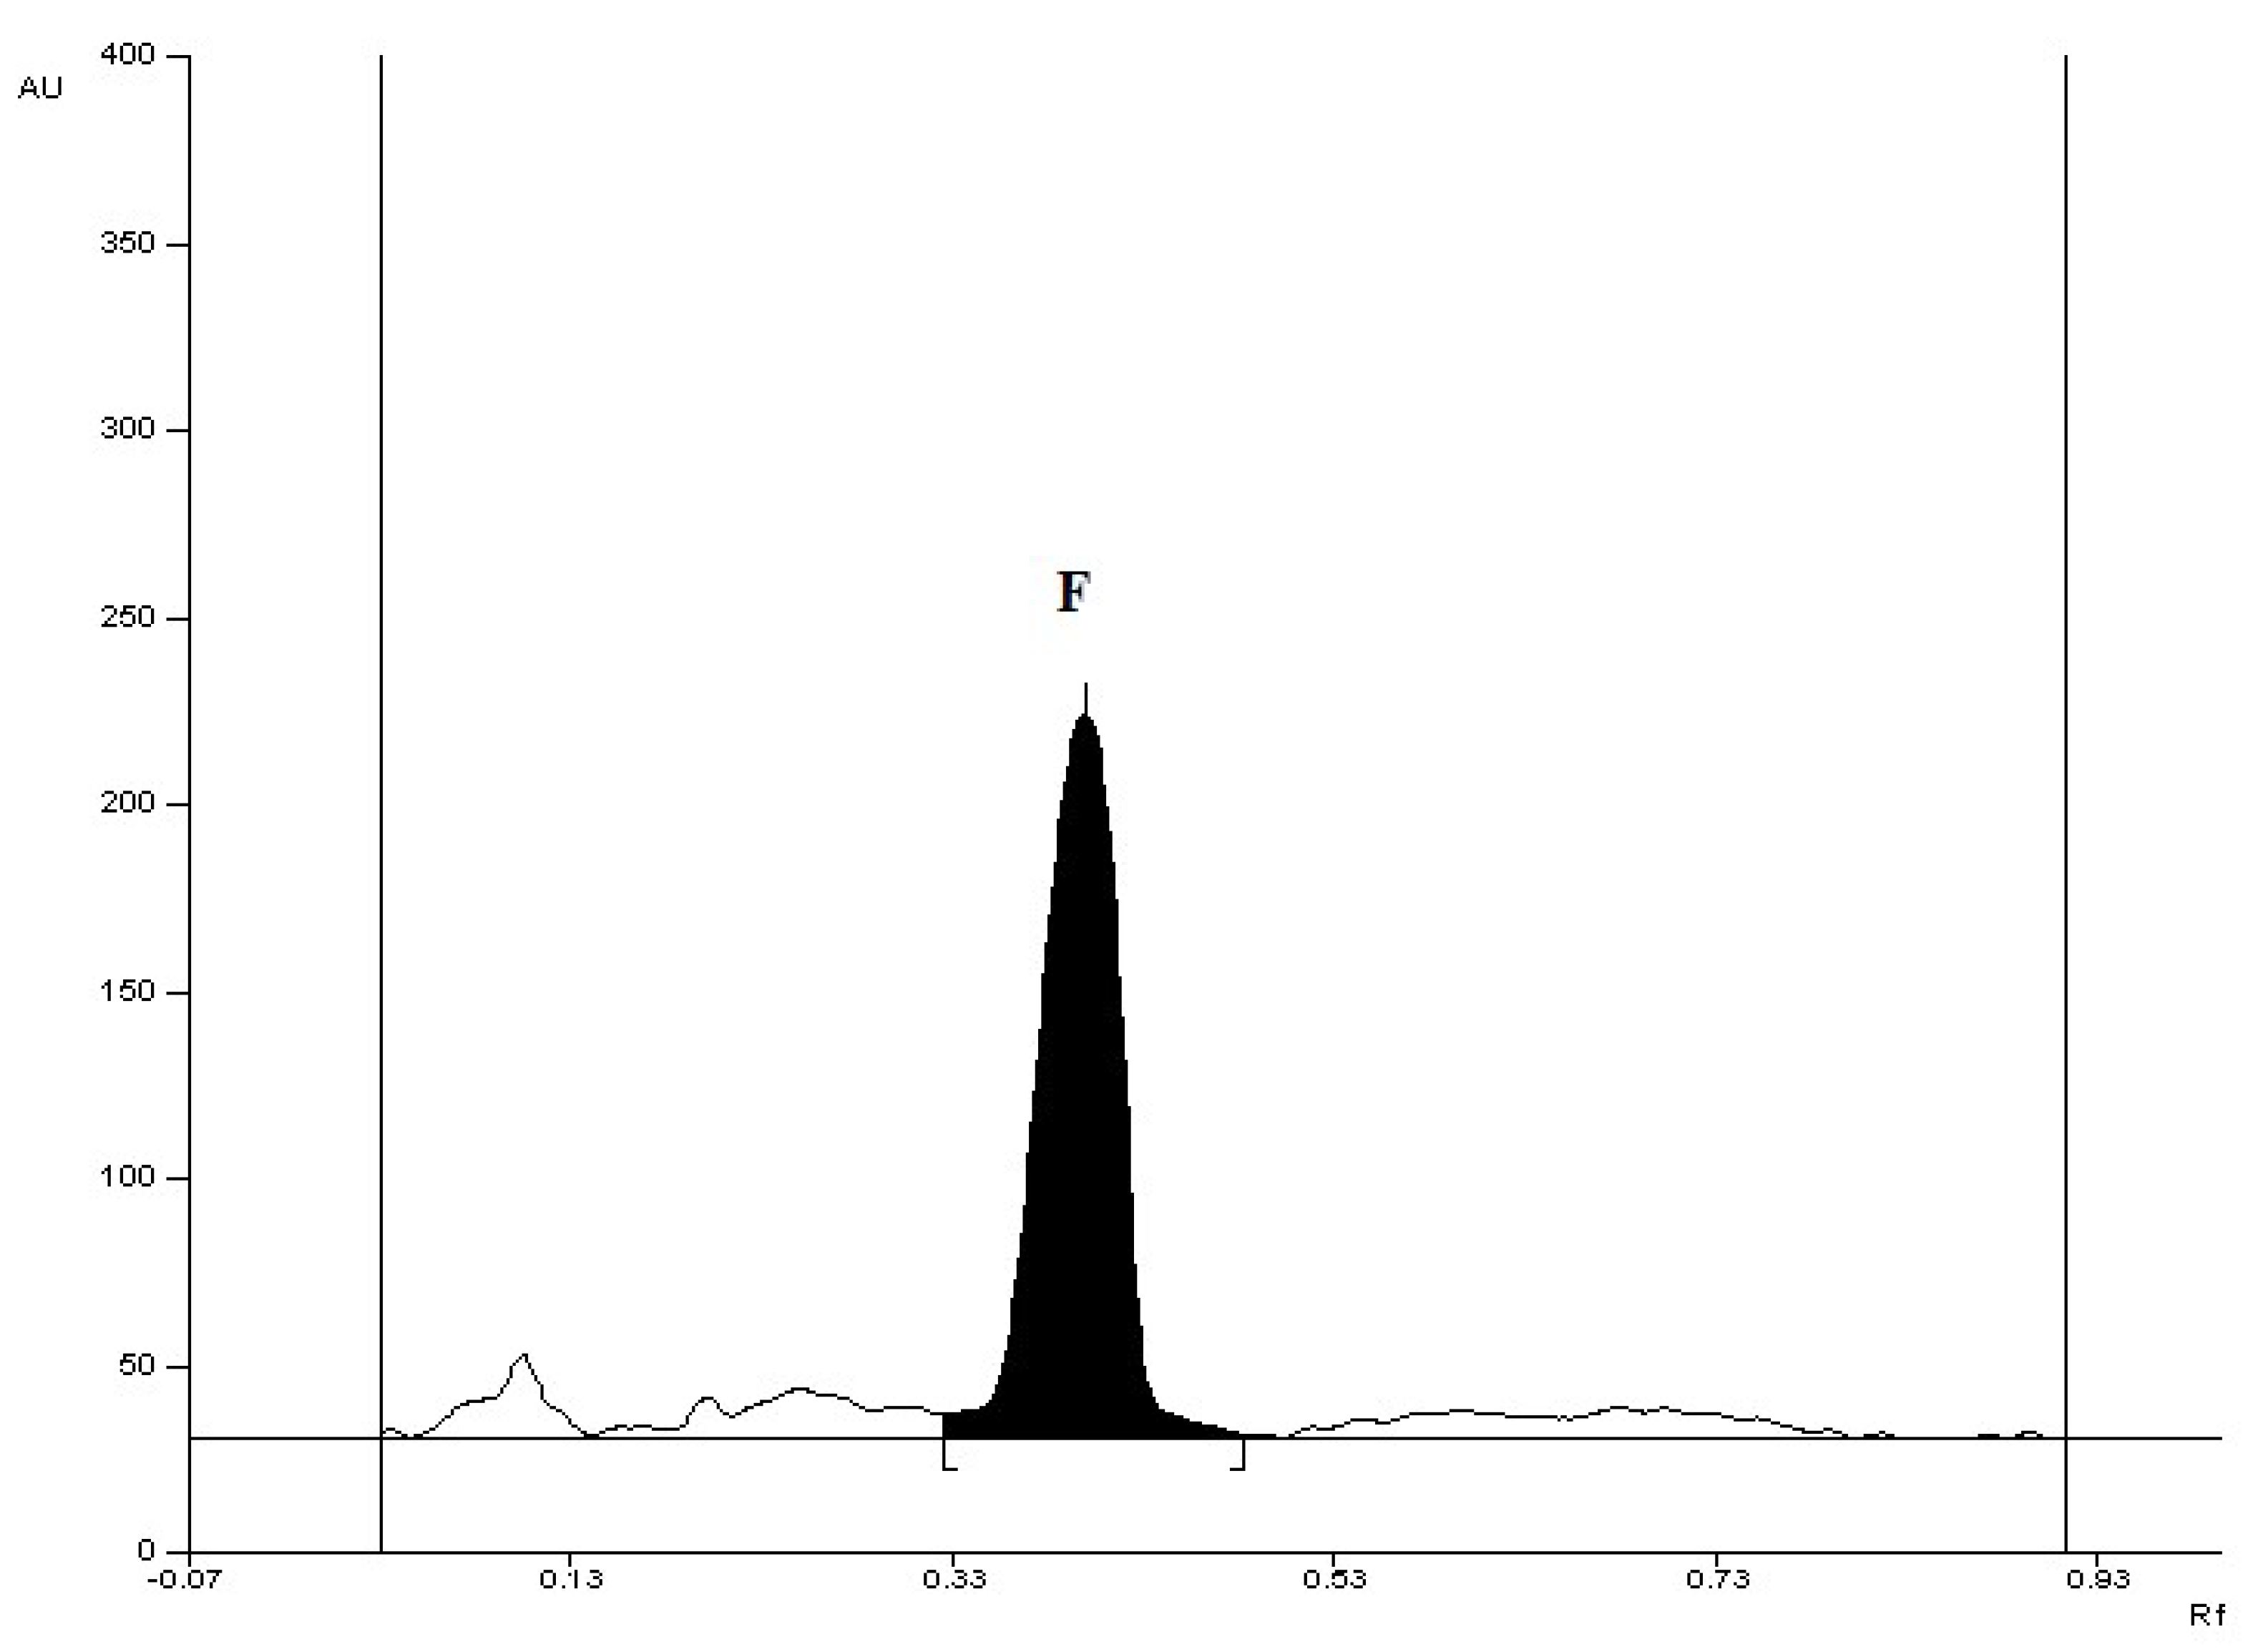
3.2. Quantitative Determination of Fluoxetine and Sertraline in Tested Pharmaceutical Preparations
4. Conclusions
Supplementary Materials
Funding
Institutional Review Board Statement
Informed Consent Statement
Data Availability Statement
Conflicts of Interest
Sample Availability
References
- Katzung, B.; Trevor, A. Basic and Clinical Pharmacology 15e; McGraw-Hill Education/Medical: New York, NY, USA, 2021. [Google Scholar]
- Kubanek, A.; Paul, P.; Przybylak, M.; Kanclerz, K.; Rojek, J.J.; Renke, M.; Bidzan, L.; Grabowski, J. Use of sertraline in hemodialysis patients. Medicina 2021, 57, 949. [Google Scholar] [CrossRef] [PubMed]
- Miziak, B.; Błaszczyk, B.; Czuczwar, S.J. Some candidate drugs for pharmacotherapy of Alzheimer’s disease. Pharmaceuticals 2021, 14, 458. [Google Scholar] [CrossRef]
- Romero-Martínez, Á.; Murciano-Martí, S.; Moya-Albiol, L. Is sertraline a good pharmacological strategy to control anger? Results of a systematic review. Behav. Sci. 2019, 9, 57. [Google Scholar] [CrossRef] [Green Version]
- Yue, J.K.; Burke, J.F.; Upadhyayula, P.S.; Winkler, E.A.; Deng, H.; Robinson, C.K.; Pirracchio, R.; Suen, C.G.; Sharma, S.; Ferguson, A.R.; et al. Selective serotonin reuptake inhibitors for treating neurocognitive and neuropsychiatric disorders following traumatic brain injury: An evaluation of current evidence. Brain Sci. 2017, 7, 93. [Google Scholar] [CrossRef] [PubMed] [Green Version]
- Ramírez-Rodríguez, G.B.; Vega-Rivera, N.M.; Meneses-San Juan, D.; Ortiz-López, L.; Estrada-Camarena, E.M.; Flores-Ramos, M. Short daily exposure to environmental enrichment, fluoxetine, or their combination reverses deterioration of the coat and anhedonia behaviors with differential effects on hippocampal neurogenesis in chronically stressed mice. Int. J. Mol. Sci. 2021, 22, 10976. [Google Scholar] [CrossRef]
- Zorzin, S.; Corsi, A.; Ciarpella, F.; Bottani, E.; Dolci, S.; Malpeli, G.; Pino, A.; Amenta, A.; Fumagalli, G.F.; Chiamulera, C.; et al. Environmental enrichment induces meningeal niche remodeling through TrkB-mediated signaling. Int. J. Mol. Sci. 2021, 22, 10657. [Google Scholar] [CrossRef] [PubMed]
- Ahmed, H.; Khan, M.A.; Kahlert, U.D.; Niemelä, M.; Hänggi, D.; Chaudhry, S.R.; Muhammad, S. Role of adaptor protein myeloid differentiation 88 (MyD88) in post-subarachnoid hemorrhage inflammation: A systematic review. Int. J. Mol. Sci. 2021, 22, 4185. [Google Scholar] [CrossRef] [PubMed]
- Dornquast, C.; Tomzik, J.; Reinhold, T.; Walle, M.; Mönter, N.; Berghöfer, A. To what extent are psychiatrists aware of the comorbid somatic illnesses of their patients with serious mental illnesses?—A cross-sectional secondary data analysis. BMC Health Serv. Res. 2017, 17, 162. [Google Scholar] [CrossRef] [Green Version]
- Rajewski, A.; Komorowska-Pietrzykowska, R.; Rybakowski, F.P. Buspirone vs. fluoxetine in treatment of bulimia nervosa. Eur. Neuropsychopharmacol. 2005, 15, S601. [Google Scholar] [CrossRef]
- McRae, A.L.; Brady, K.T. Review of sertraline and its clinical applications in psychiatric disorders. Expert Opin. Pharmacother. 2001, 2, 883–892. [Google Scholar] [CrossRef]
- Tantawy, M.A.; Hassan, N.Y.; Elragehy, N.A.; Abdelkawy, M. Simultaneous determination of olanzapine and fluoxetine hydrochloride in capsules by spectrophotometry, TLC-spectrodensitometry and HPLC. J. Adv. Res. 2013, 4, 173–180. [Google Scholar] [CrossRef] [PubMed] [Green Version]
- Shah, C.R.; Suhagia, B.N.; Shah, N.J.; Patel, D.R.; Patel, N.M. Stability-indicating simultaneous HPTLC method for olanzapine and fluoxetine in combined tablet dosage form. Indian J. Pharm. Sci. 2008, 70, 251–255. [Google Scholar] [CrossRef] [PubMed] [Green Version]
- Venkateswarlu, K.; Venisetty, R.K.; Yellu, N.R.; Keshetty, S.; Pai, M.G. Development of HPTLC-UV absorption densitometry method for the analysis of alprazolam and sertraline in combination and its application in the evaluation of marketed preparations. J. Chromatogr. Sci. 2007, 45, 537–539. [Google Scholar] [CrossRef] [PubMed] [Green Version]
- Rao, J.; Kumar, M.; Sathiyanarayanan, L.; Yadav, S.; Yadav, V. Application of a stability-indicating HPTLC method for quantitative analysis of sertraline hydrochloride in pharmaceutical dosage forms. JPC-J. Planar Chromatogr.-Mod. TLC 2011, 24, 140–144. [Google Scholar] [CrossRef]
- Bhushan, R.; Agarwal, C. High-performance liquid chromatographic enantioseparation of (R,S)-fluoxetine using Marfey’s reagent and (S)-N-(4-nitrophenoxycarbonyl) phenylalanine methoxyethyl ester as chiral derivatizing reagents along with direct thin-layer chromatographic resolution and isolation of enantiomers using L-tartaric acid as mobile phase additive. Biomed. Chromatogr. 2010, 24, 1152–1158. [Google Scholar] [CrossRef]
- Patel, S.; Patel, N.J. Simultaneous RP-HPLC and HPTLC estimation of fluoxetine hydrochloride and olanzapine in tablet dosage forms. Indian J. Pharm. Sci. 2009, 71, 477–480. [Google Scholar] [CrossRef] [Green Version]
- Hussain, A.; Rahman, A.; Hussain, S.; Mirza, M.A.; Iqbal, Z.; Harwansh, R.; Singh, L.R. HPTLC method for analysis of sertraline in pure bulk drug and lipidic nano delivery system: A stress degradation studies. J. Liq. Chromogr. Relat. Technol. 2013, 36, 700–716. [Google Scholar] [CrossRef]
- Mennickent, S.; Fierro, R.; Vega, M.; De Diego, C.M.; Godoy, G. Quantitative determination of fluoxetine in human serum by high performance thin layer chromatography. J. Sep. Sci. 2010, 33, 2206–2210. [Google Scholar] [CrossRef]
- Mennickent, S.; Fierro, R.; Vega, M.; De Diego, C.M.; Godoy, G.; Cifluentes, C.; Miranda, A. Quantification of sertraline in human serum by high-performance thin layer chromatography as a tool in pharmacotherapy adherence evaluation. JPC-J. Planar Chromatogr.-Mod. TLC 2013, 26, 358–362. [Google Scholar] [CrossRef]
- Gondova, T.; Halamova, D.; Spacayova, K. Simultaneous analysis of new antidepressants by densitometric thin-layer chromatography. J. Liq. Chromogr. Relat. Technol. 2008, 31, 2429–2441. [Google Scholar] [CrossRef]
- Thomas, A.B.; Naphade, A.; Karanjkhele, S.S. Determination of alprazolam and fluoxetine HCl from spiked rat pasma using HPTLC with UV detection. Int. J. Pharm. Pharm. Sci. 2016, 8, 147–151. [Google Scholar]
- Hamedi, R.; Hadjmohammadi, M.R. Optimization of alcohol-assisted dispersive liquid-liquid microextraction by experimental design for the rapid determination of fluoxetine in biological samples. J. Sep. Sci. 2016, 39, 4784–4793. [Google Scholar] [CrossRef] [PubMed]
- Zilfidou, E.; Kabir, A.; Furton, K.G.; Samanidou, V. An improved fabric phase sorptive extraction method for the determination of five selected antidepressant drug residues in human blood serum prior to high performance liquid chromatography with diode array detection. J. Chromatogr. B Analyt. Technol. Biomed. Life Sci. 2019, 1125, 121720. [Google Scholar] [CrossRef] [PubMed]
- da Silva, A.C.C.; Raasch, J.R.; Vargas, T.G.; Peteffi, G.P.; Hahn, R.Z.; Antunes, M.V.; Perassolo, M.S.; Linden, R. Simultaneous determination of fluoxetine and norfluoxetine in dried blood spots using high-performance liquid chromatography-tandem mass spectrometry. Clin. Biochem. 2018, 52, 85–93. [Google Scholar] [CrossRef]
- Weisskopf, E.; Panchaud, A.; Nguyen, K.A.; Grosjean, D.; Hascoët, J.M.; Csajka, C.; Eap, C.B.; Ansermot, N.; Collaborators of the SSRI-Breast Milk Study. Simultaneous determination of selective serotonin reuptake inhibitors and their main metabolites in human breast milk by liquid chromatography-electrospray mass spectrometry. J. Chromatogr. B Analyt. Technol. Biomed. Life Sci. 2017, 1057, 101–109. [Google Scholar] [CrossRef]
- López-Rabuñal, A.; Lendoiro, E.; Concheiro, M.; López-Rivadulla, M.; Cruz, A.; de-Castro-Ríos, A. LC-MS-MS method for the determination of antidepressants and benzodiazepines in Meconium. J. Anal. Toxicol. 2020, 44, 580–588. [Google Scholar] [CrossRef]
- Rosetti, A.; Ferretti, R.; Zanitti, L.; Casulli, A.; Villani, C.; Cirilli, R. Single-run reversed-phase HPLC method for determining sertraline content, enantiomeric purity, and related substances in drug substance and finished product. J. Pharm. Anal. 2020, 10, 610–616. [Google Scholar] [CrossRef] [PubMed]
- Batra, S.; Bhushan, R. Liquid chromatographic enantioseparation of (RS)-mexiletine and (RS)-fluoxetine using chiral derivatizing reagents synthesized with (S)-naproxen moiety. Biomed. Chromatogr. 2014, 28, 815–825. [Google Scholar] [CrossRef]
- Pathak, A.; Rajput, S.J. Development of a stability-indicating high-performance liquid chromatographic method for the simultaneous determination of alprazolam and sertraline in combined dosage forms. J. AOAC Int. 2008, 91, 1344–1353. [Google Scholar] [CrossRef] [Green Version]
- Chen, D.; Jiang, S.; Chen, Y.; Hu, Y. HPLC determination of sertraline in bulk drug, tablets and capsules using hydroxypropyl-beta-cyclodextrin as mobile phase additive. J. Pharm. Biomed. Anal. 2004, 34, 239–245. [Google Scholar] [CrossRef]
- Rao, R.N.; Talluri, M.V.; Maurya, P.K. Separation of stereoisomers of sertraline and its related enantiomeric impurities on a dimethylated beta-cyclodextrin stationary phase by HPLC. J. Pharm. Biomed. Anal. 2009, 50, 281–286. [Google Scholar] [CrossRef]
- Kertys, M.; Krivosova, M.; Ondrejka, I.; Hrtanek, I.; Tonhajzerova, I.; Mokry, J. Simultaneous determination of fluoxetine, venlafaxine, vortioxetine and their active metabolites in human plasma by LC–MS/MS using one-step sample preparation procedure. J. Pharm. Biomed. Anal. 2020, 181, 113098. [Google Scholar] [CrossRef]
- Runfola, M.; Lima, D.L.D.; Fonseca, A.P.; Barbosa, Z. Optimization of a dispersive liquid-liquid microextraction method followed by UHPLC analysis for fluoxetine quantification in environmental water resources. J. Sep. Sci. 2018, 41, 4246–4252. [Google Scholar] [CrossRef]
- Ma, W.; Gao, X.; Guo, H.; Chen, W. Determination of 13 antidepressants in blood by UPLC-MS/MS with supported liquid extraction pretreatment. J. Chromatogr. B Analyt. Technol. Biomed. Life Sci. 2021, 1171, 122608. [Google Scholar] [CrossRef] [PubMed]
- Fernández, P.; Taboada, V.; Regenjo, M.; Morales, L.; Alvarez, I.; Carro, A.M.; Lorenzo, R.A. Optimization of ultrasound assisted dispersive liquid-liquid microextraction of six antidepressants in human plasma using experimental design. J. Pharm. Biomed. Anal. 2016, 124, 189–197. [Google Scholar] [CrossRef]
- Cai, P.; Xiong, X.; Li, D.; Zhou, Y.; Xiong, C. Magnetic solid-phase extraction coupled with UHPLC-MS/MS for four antidepressants and one metabolite in clinical plasma and urine samples. Bioanalysis 2020, 12, 35–52. [Google Scholar] [CrossRef]
- Snamina, M.; Wietecha-Posłuszny, R.; Zawadzki, M. Postmortem analysis of human bone marrow aspirate—Quantitative determination of SSRI and SNRI drugs. Talanta 2019, 204, 607–612. [Google Scholar] [CrossRef]
- Paíga, P.; Correia, M.; Fernandes, M.J.; Silva, A.; Carvalho, M.; Vieira, J.; Jorge, S.; Silva, J.G.; Freire, C.; Delerue-Matos, C. Assessment of 83 pharmaceuticals in WWTP influent and effluent samples by UHPLC-MS/MS: Hourly variation. Sci. Total Environ. 2019, 648, 582–600. [Google Scholar] [CrossRef]
- Li, D.; Xiong, X.; Zhuang, S.; Du, Z.; Xiong, C.; Jiang, H. Preparation of bovine serum albumin restricted access octadecyl/phenyl-mixed-functionalized magnetic silica nanoparticles for magnetic solid phase extraction of antidepressants in aquatic products followed by UHPLC-MS/MS. Talanta 2021, 221, 121458. [Google Scholar] [CrossRef]
- Feng, Y.; Zheng, M.; Zhang, X.; Kang, K.; Kang Weijun Lian, K.; Yang, J. Analysis of four antidepressants in plasma and urine by gas chromatography-mass spectrometry combined with sensitive and selective derivatization. J. Chromatogr. A 2019, 1600, 33–40. [Google Scholar] [CrossRef]
- Chen, X.; Zheng, S.; Le, J.; Qian, Z.; Zhang, R.; Hong, Z.; Chai, Y. Ultrasound-assisted low-density solvent dispersive liquid-liquid microextraction for the simultaneous determination of 12 new antidepressants and 2 antipsychotics in whole blood by gas chromatography-mass spectrometry. J. Pharm. Biomed. Anal. 2017, 142, 19–27. [Google Scholar] [CrossRef]
- Koçoğlu, E.S.; Bakırdere, S.; Keyf, S. Sensitive Determination of sertraline in commercial drugs and its stability check in simulated gastric juice. J. AOAC Int. 2016, 99, 1527–1532. [Google Scholar] [CrossRef]
- Luiz Oenning, A.; Birk, L.; Eller, S.; Franco de Oliveira, T.; Merib, J.; Carasek, E. A green and low-cost method employing switchable hydrophilicity solvent for the simultaneous determination of antidepressants in human urine by gas chromatography—Mass spectrometry detection. J. Chromatogr. B Analyt. Technol. Biomed. Life Sci. 2020, 1143, 122069. [Google Scholar] [CrossRef]
- Boumba, V.A.; Rallis, G.; Petrikis, P.; Vougiouklakis, T.; Mavreas, V. Determination of clozapine, and five antidepressants in human plasma, serum and whole blood by gas chromatography-mass spectrometry: A simple tool for clinical and postmortem toxicological analysis. J. Chromatogr. B Analyt. Technol. Biomed. Life Sci. 2016, 1038, 43–48. [Google Scholar] [CrossRef]
- Ntoupa, P.A.; Armaos, K.P.; Athanaselis, S.A.; Spiliopoulou, C.A.; Papoutsis, I.I. Study of the distribution of antidepressant drugs in vitreous humor using a validated GC/MS method. Forensic Sci. Int. 2020, 317, 110547. [Google Scholar] [CrossRef] [PubMed]
- Gonçalves, R.; Ribeiro, C.; Cravo, S.; Cunha, S.C.; Pereira, J.A.; Fernandes, J.O.; Afonso, C.; Tiritan, M.E. Multi-residue method for enantioseparation of psychoactive substances and beta blockers by gas chromatography-mass spectrometry. J. Chromatogr. B Analyt. Technol. Biomed. Life Sci. 2019, 1125, 121731. [Google Scholar] [CrossRef]
- Ali, E.A.; Adawy, A.M.; El-Shahat, M.F.; Amin, A.S. Simple spectrophotometric methods for determination of fluoxetine and clomipramine hydrochlorides in dosage forms and in some post-mortem biological fluids samples. Egypt J. Forensic Sci. 2016, 6, 370–380. [Google Scholar] [CrossRef] [Green Version]
- Nezhadali, A.; Motlagh, M.O.; Sadeghzadeh, S. Spectrophotometric determination of fluoxetine by molecularly imprinted polypyrrole and optimization by experimental design, artificial neural network and genetic algorithm. Spectrochim. Acta A Mol. Biomol. Spectrosc. 2018, 190, 181–187. [Google Scholar] [CrossRef] [PubMed]
- Walash, M.J.; Belal, F.F.; El-Enany, N.M.; Elmansi, H. Development and validation of stability indicating method for determination of sertraline following ICH guidelines and its determination in pharmaceuticals and biological fluids. Chem. Cent. J. 2011, 5, 61. [Google Scholar] [CrossRef] [PubMed] [Green Version]
- Lotfi, A.; Manzoori, J.L. Determination of fluoxetine in pharmaceutical and biological samples based on the silver nanoparticle enhanced fluorescence of fluoxetine-terbium complex. Luminescence 2016, 31, 1349–1357. [Google Scholar] [CrossRef]
- Wang, Z.R.; Hsieh, M.M. Ultrasound-assisted dispersive liquid-liquid microextraction coupled with field-amplified capillary electrophoresis for sensitive and quantitative determination of fluoxetine and norfluoxetine enantiomers in biological fluids. Anal. Bioanal. Chem. 2020, 412, 5113–5123. [Google Scholar] [CrossRef] [PubMed]
- Murtada, K.; de Andrés, F.; Ríos, A.; Zougagh, M. Determination of antidepressants in human urine extracted by magnetic multiwalled carbon nanotube poly(styrene-co-divinylbenzene) composites and separation by capillary electrophoresis. Electrophoresis 2018, 39, 1808–1815. [Google Scholar] [CrossRef] [PubMed]
- Alizadeh, T.; Azizi, S. Graphene/graphite paste electrode incorporated with molecularly imprinted polymer nanoparticles as a novel sensor for differential pulse voltammetry determination of fluoxetine. Biosens. Bioelectron. 2016, 81, 198–206. [Google Scholar] [CrossRef] [PubMed]
- Feroz, M.; Lopes, I.C.; ur Rehman, H.; Ata, S.; Vadgama, P. A novel molecular imprinted polymer layer electrode for enhanced sensitivity electrochemical determination of the antidepressant fluoxetine. J. Electroanal. Chem. 2020, 878, 114693. [Google Scholar] [CrossRef]
- Aladaghlo, Z.; Fakhari, A.R.; Hasheminasab, K.S. Application of electromembrane extraction followed by corona discharge ion mobility spectrometry analysis as a fast and sensitive technique for determination of tricyclic antidepressants in urine samples. Microchem. J. 2016, 129, 41–48. [Google Scholar] [CrossRef]
- Inkielewicz-Stępniak, I. Impact of fluoxetine on liver damage in rats. Pharmacol. Rep. 2011, 63, 441–447. [Google Scholar] [CrossRef]
- Silva, V.H.; Dos Santos Batista, A.P.; Silva Costa Teixeira, A.C.; Borrely, S.I. Degradation and acute toxicity removal of the antidepressant Fluoxetine (Prozac®) in aqueous systems by electron beam irradiation. Environ. Sci. Pollut. Res. Int. 2016, 23, 11927–11936. [Google Scholar] [CrossRef]
- Khan, M.F.; Murphy, C.D. Bacterial degradation of the anti-depressant drug fluoxetine produces trifluoroacetic acid and fluoride ion. Appl. Microbiol. Biotechnol. 2021, 105, 9359–9369. [Google Scholar] [CrossRef]
- Ferenczi-Fodor, K.; Renger, B.; Végh, Z. The frustrated reviewer—Recurrent failures in manuscripts describing validation of quantitative TLC/HPTLC procedures for analysis of pharmaceuticals. JPC-J. Planar Chromatogr.-Mod. TLC 2010, 23, 173–179. [Google Scholar] [CrossRef]
- Nagy-Turák, A.; Végh, Z.; Ferenczi-Fodor, K. Validaton of the quantitative planar chromatographic analysis of drug substances. III. Robustness testing in OPLC. JPC-J. Planar Chromatogr.-Mod. TLC 1995, 8, 188–193. [Google Scholar]
- Ferenczi-Fodor, K.; Nagy-Turák, A.; Végh, Z. Validation and monitoring of quantitative thin layer chromatographic purity tests for bulk drug substances. JPC-J. Planar Chromatogr.-Mod. TLC 1995, 8, 349–356. [Google Scholar]
- Hendix, C.D. What every technologist should know about experiment design. Chem. Technol. 1979, 9, 167–174. [Google Scholar]
- European Pharmacopoeia VIII. Council of Europe: Strasbourg, France, 2013; Volume 1, pp. 298, 780, 810.
- The United States Pharmacopeia 34. Twinbrook Parkway: Rockville, MD, USA, 2011; Volume 3, pp. 2877, 4219.


| Mobile Phase Symbol | Composition of the Mobile Phase | Composition of the Solvents in Volume Ratio | Refs. |
|---|---|---|---|
| A | Toluene + ethyl acetate + ammonia | 2: 10: 0.2 | [18] |
| B | Chloroform + methanol | 8.5: 1.5 | - |
| C | Toluene + glacial acetic acid | 4: 5 | [19] |
| D | Toluene + ethyl acetate + methanol + glacial acetic acid | 4.5: 1.5: 1: 0.5 | [20] |
| E | Methanol + toluene | 4: 2 | [13] |
| G | Acetone + benzene + ammonia | 50: 45: 5 | [21] |
| G1 | Acetone + toluene + ammonia | 10: 9: 1 | - |
| G2 | Acetone + toluene + ammonia | 9.5: 9.5: 1 | - |
| G3 | Acetone + toluene + ammonia | 10.5: 8.5: 1 | - |
| H | Methanol + toluene + ammonia | 7: 3: 0.1 | [12] |
| I | Toluene + ethyl acetate + ethanol + ammonia | 8: 2: 0.5: 0.1 | [15] |
| I1 | Toluene + ethyl acetate + ethanol + glacial acetic acid | 8: 2: 0.5: 0.4 | - |
| J | Ethyl acetate + toluene + methanol + ammonia | 4: 3: 1: 0.1 | [22] |
| J1 | Ethyl acetate + toluene + methanol + ammonia | 4: 4:1: 0.1 | - |
| J2 | Ethyl acetate + toluene + methanol + ammonia | 5: 3: 1: 0.1 | - |
| K | Carbon tetrachloride + methanol + acetone + ammonia | 12: 3: 5: 0.1 | [14] |
| L | Chloroform + methanol + glacial acetic acid | 8.5: 1.5: 0.5 | - |
| L1 | Chloroform + methanol + glacial acetic acid | 8.5: 1.5: 0.3 | - |
| M | Acetone + chloroform + ammonia | 10: 5: 1 | - |
| Symbol | Factors | Method Condition | Levels | |
|---|---|---|---|---|
| + | − | |||
| X1 | Sorbent type (Merck, #) | Al sheet (1.05570) | Al sheet (1.05570) | Al sheet (1.05554) |
| X2 | Temperature of plate activation [°C] | 120 | 130 | 110 |
| X3 | Extraction time [min] | 30 | 32 | 28 |
| X4 | Saturation time of the chamber [°C] | 30 | 35 | 25 |
| X5 | Volume of acetone [mL] | 10.0 | 10.1 | 9.9 |
| X6 | Volume of chloroform [mL] | 5.0 | 5.1 | 4.9 |
| X7 | Wavelength in densitometric analysis at λ [nm] | 200 | 205 | 200 |
| Experiment No | X1 | X2 | X3 | X4 | X5 | X6 | X7 | Biological Active Substance a Content (yi) [mg·tablet−1] | ||
|---|---|---|---|---|---|---|---|---|---|---|
| F | S | |||||||||
| 1 | + | + | + | + | + | + | + | 18.92 | 48.94 | |
| 2 | + | + | - | + | - | - | - | 18.50 | 48.61 | |
| 3 | + | - | + | - | - | + | - | 19.08 | 49.34 | |
| 4 | + | - | - | - | + | - | + | 19.51 | 50.60 | |
| 5 | - | + | + | - | + | - | - | 19.33 | 49.80 | |
| 6 | - | + | - | - | - | + | + | 19.03 | 49.21 | |
| 7 | - | - | + | + | - | - | + | 18.97 | 49.07 | |
| 8 | - | - | - | + | + | + | - | 19.70 | 50.93 | |
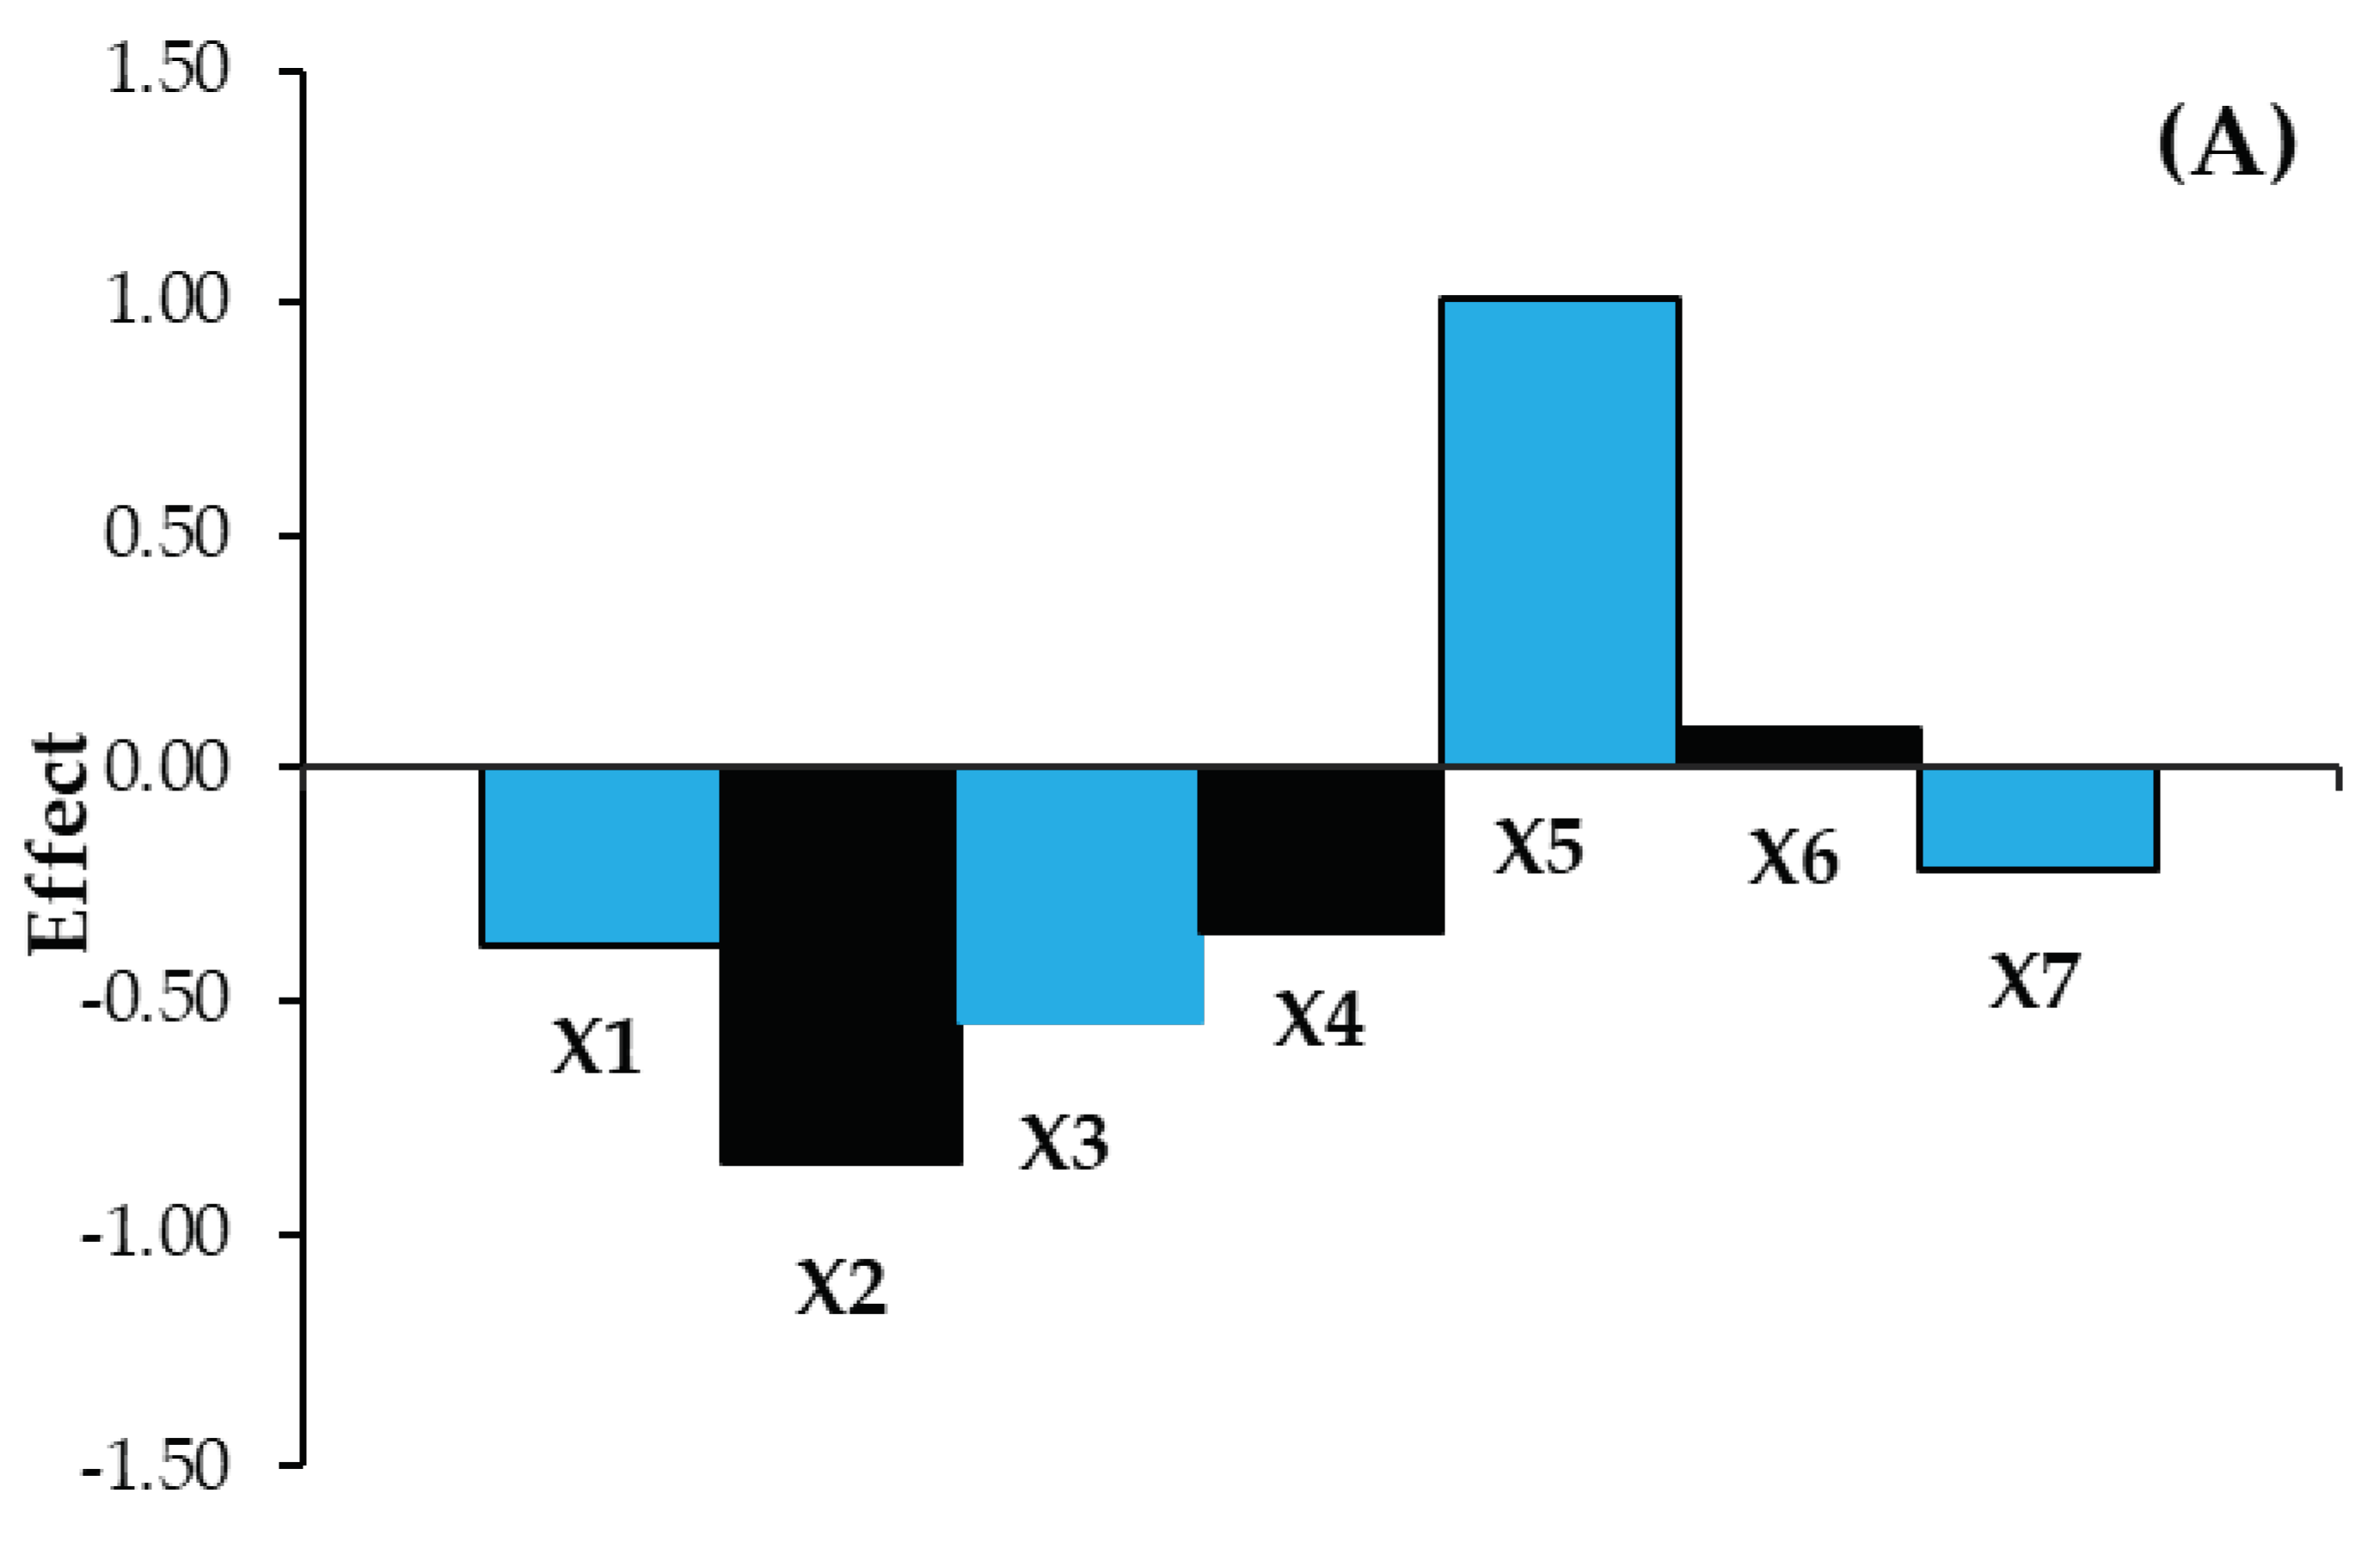
| Size of effect | F | −0.255 | −0.370 | −0.110 | −0.215 | 0.470 | 0.105 | −0.045 | ||
| S | −0.380 | −0.845 | −0.547 | −0.348 | 1.010 | 0.082 | −0.215 | |||
| The label claim [mg] | 20 | 50 | ||||||||
| Average amount [mg] | 19.1 | 49.6 | ||||||||
| Variance | 0.141 | 0.673 | ||||||||
| Standard deviation (SD) | 0.376 | 0.821 | ||||||||
| Coefficient of variation [CV, %] | 2.0 | 1.7 | ||||||||
| Stress Conditions | RF | |
|---|---|---|
| of Degradation Products of Sertraline (P) and RF of Sertraline (S) | of Degradation Products of Fluoxetine (P) and RF of Fluoxetine (F) | |
| S or F with the addition of 2M NaOH heated at 70 °C for 2 h | 0.04; 0.07 for P | 0.04; 0.28 for P |
| 0.80 for S | 0.39 for F | |
| S or F with the addition of 2M HCl heated at 70 °C for 2 h | 0.05; 0.19; 0.22; 0.68 for P | 0.04; 0.63 for P |
| 0.79 for S | 0.39 for F | |
| S or F with the addition of H2O heated at 70 °C for 2 h | 0.78 for S | 0.05; 0.17 for P |
| 0.38 for F | ||
| S or F with the addition of H2O2 heated at 70 °C for 2 h | 0.06; 0.91 for P | 0.04; 0.12; 0.18; 0.82 for P |
| 0.78 for S | 0.37 for F | |
| S or F with the addition of physiological saline heated at 70 °C for 2 h | 0.78 for S | 0.40 for F |
| S or F in a methanolic solution, heated at 70 °C for 2 h | 0.78 for S | 0.04; 0.10; 0.90 for P |
| 0.38 for F | ||
| S or F in a methanolic solution irradiated with UV at λ = 254 nm for 2 h | 0.16; 0.34; 0.52; 0.59 for P | 0.10; 0.16; 0.23; 0.32; 0.69 for P |
| 0.83 for S | 0.43 for F | |
| Method Characteristic | Results |
|---|---|
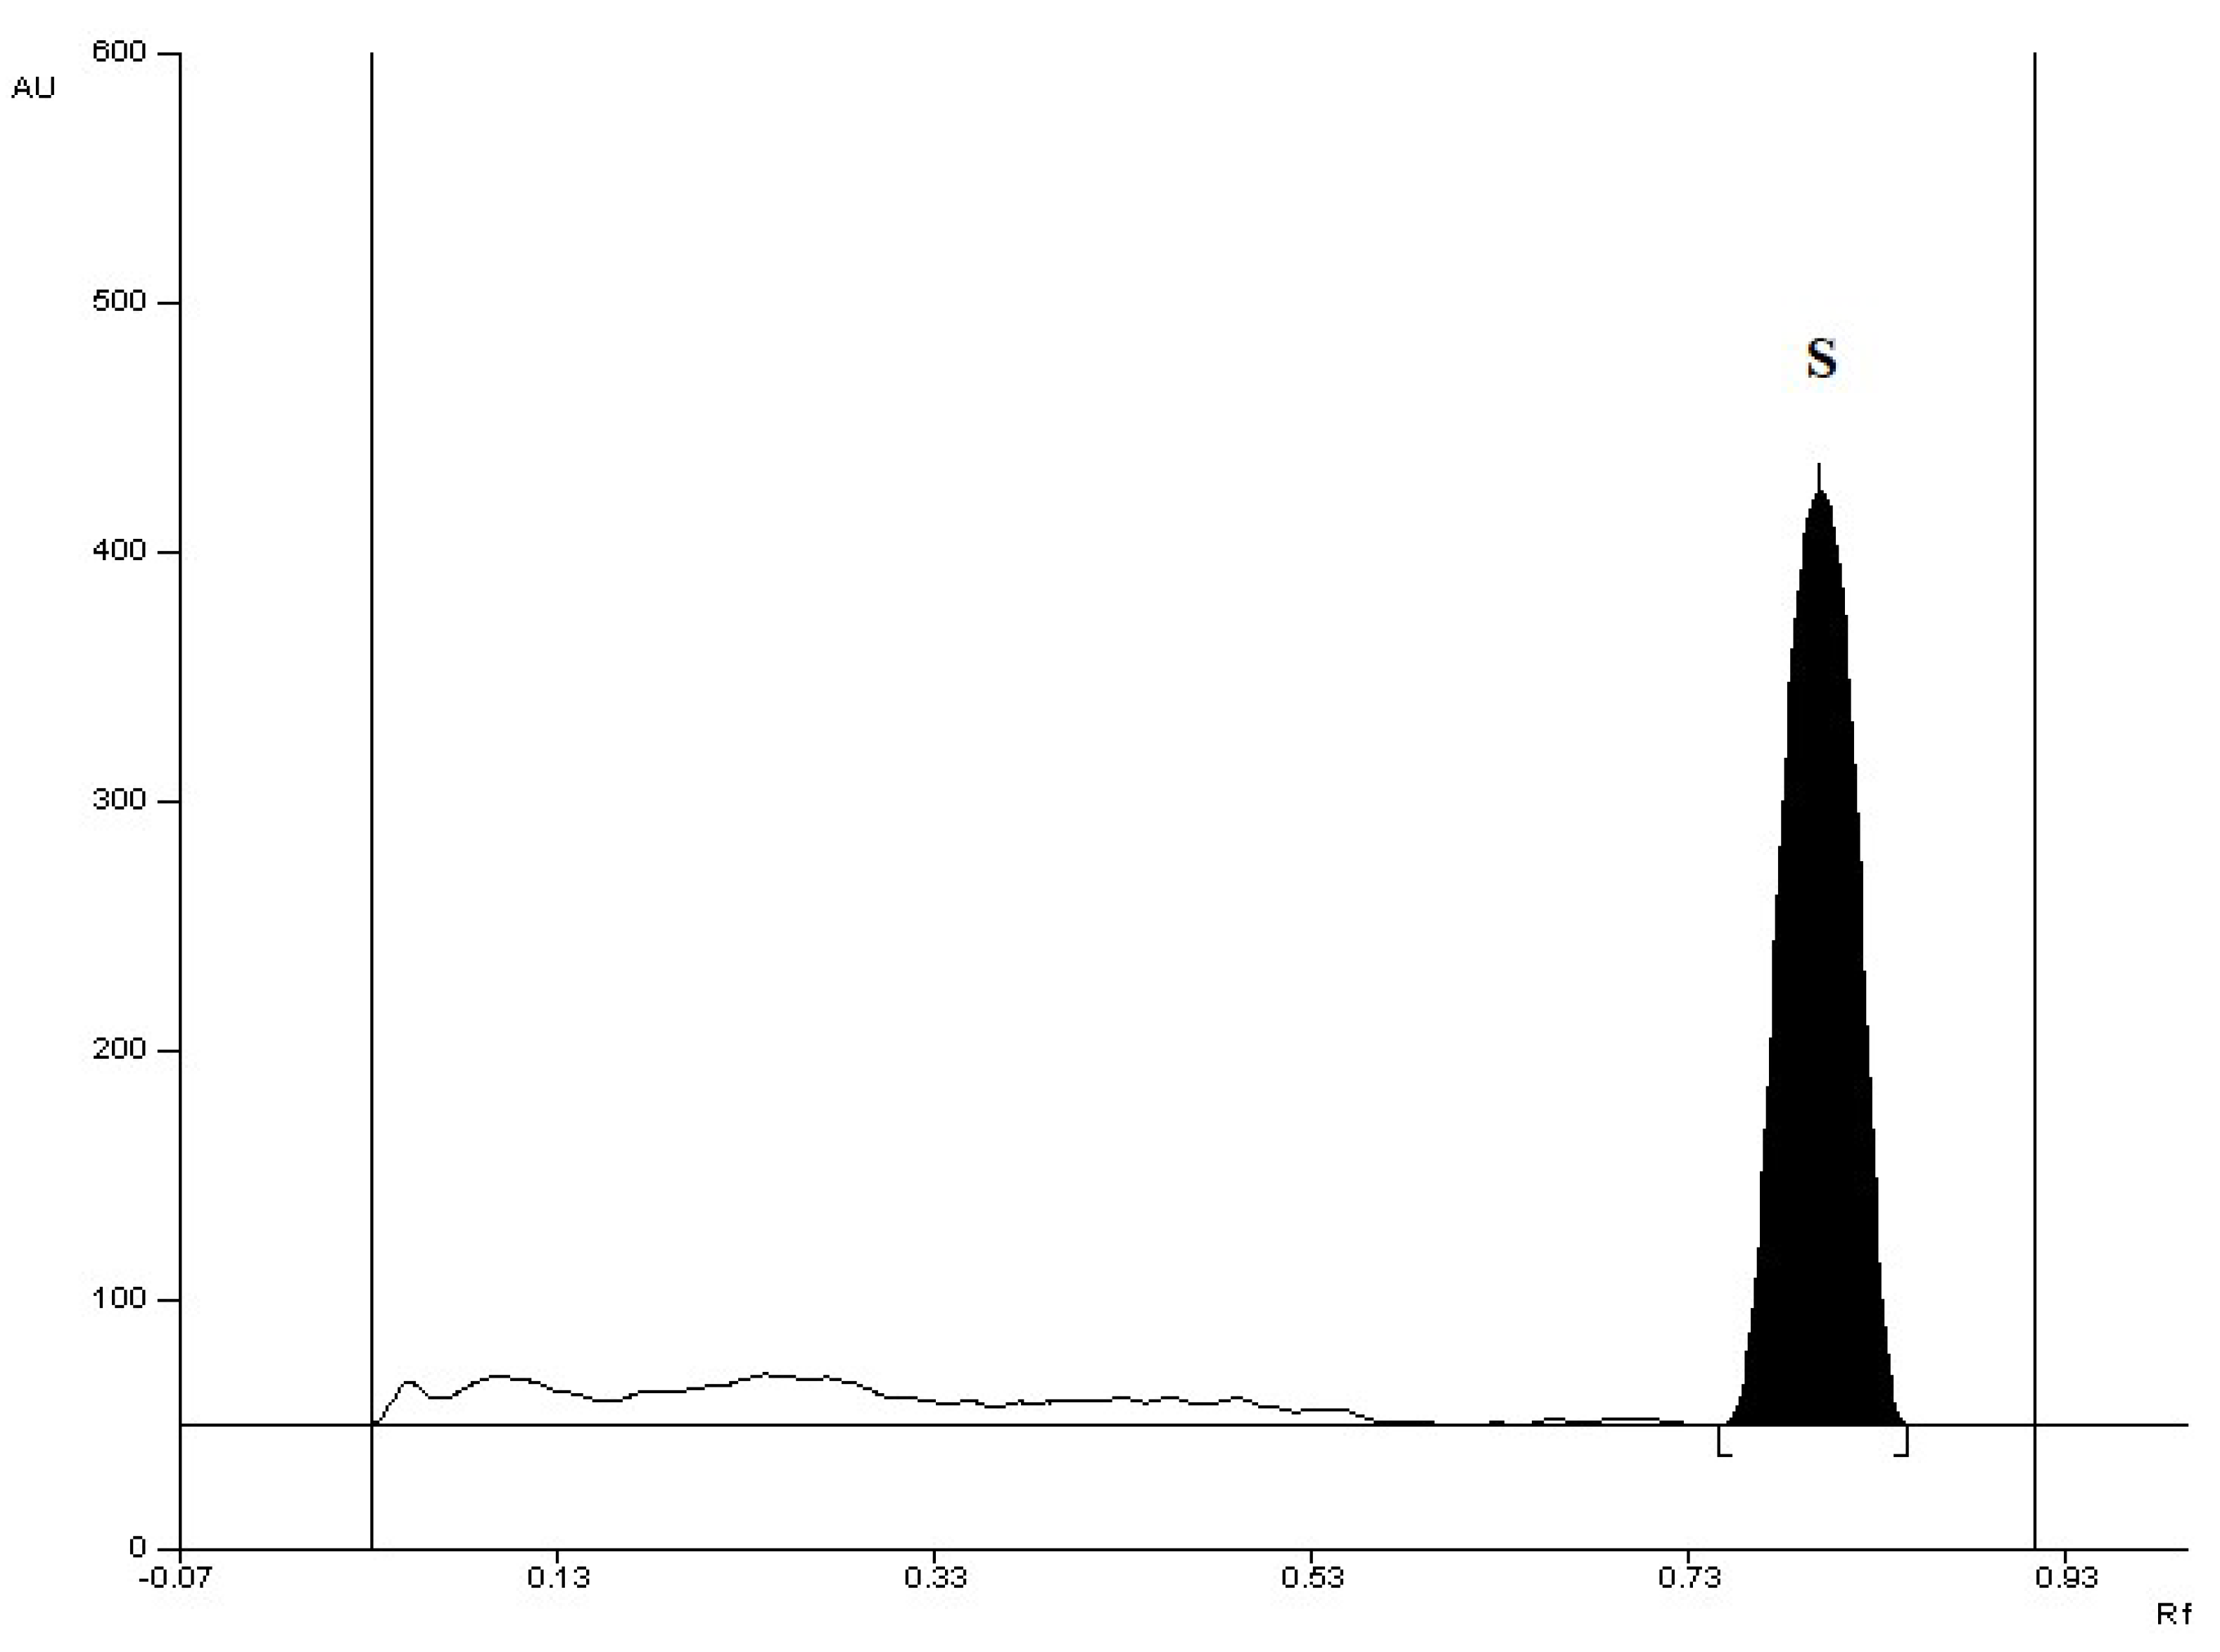
| Retardation factor (RF) | 0.42 ± 0.05 |
| Range [μg/spot] | 0.5–5.0 |
| Linearity [μg/spot] | A = 1552.8 (±31,7) + 1609.5 (±13.2)·x n = 10; r = 0.9997; s = 63.8; F = 14802; p ˂ 0.0001 |
| Limit of Detection (LOD) [(µg/spot] | 0.073 |
| Limit of Quantification (LOQ) [(µg/spot] | 0.219 |
| For capsules | |
| Accuracy | |
| for 50% fluoxetine added (n = 6) | R = 97.2%; CV = 0.88% |
| or 100% fluoxetine added (n = 6) | R = 97.3%; CV = 0.51% |
| for 150% fluoxetine added (n = 6) | R = 99.2%; CV = 1.57% |
| Precision (CV, [%]) | |
| Intra-day | |
| for 0.5 (µg/spot (n = 3) | 1.68 |
| for 1.0 (µg/spot (n = 3) | 1.69 |
| for 4.0 (µg/spot (n = 3) | 1.17 |
| Inter-day | |
| for 0.5 (µg/spot (n = 3) | 1.96 |
| for 1.0 (µg/spot (n = 3) | 2.11 |
| for 4.0 (µg/spot (n = 3) | 1.31 |
| Robustness (CV, [%]) | robust |
| Method Characteristic | Results |
|---|---|
| Retardation factor (RF) | 0.82 ± 0.05 |
| Range [μg/spot] | 0.5–3.0 |
| Linearity [μg/spot] | A = 2727.3 (±77.6) + 3301.2 (±43.8)·x n = 8; r = 0.9995; s = 98,6; F = 5676; p ˂ 0.0001 |
| Limit of Detection (LOD) [(µg/spot] | 0.054 |
| Limit of Quantification (LOQ) [(µg/spot] | 0.162 |
| For tablets | |
| Accuracy | |
| for 50% sertraline added (n = 6) | R = 99.9%; CV = 1.19% |
| for 100% sertraline added (n = 6) | R = 100.0%; CV = 1.20% |
| for 150% sertraline added (n = 6) | R = 99.7%; CV = 0.91% |
| Precision (CV, [%]) | |
| Intra-day | |
| for 0.6 (µg/spot (n = 3) | 1.12 |
| for 1.5 (µg/spot (n = 3) | 1.26 |
| for 3.0 (µg/spot (n = 3) | 1.20 |
| Inter-day | |
| for 0.6 (µg/spot (n = 3) | 1.62 |
| for 1.5 (µg/spot (n = 3) | 1.51 |
| for 3.0 (µg/spot (n = 3) | 1.99 |
| Robustness (CV, [%]) | robust |
| Fluoxetin Polpharma (Fluoxetine, Capsules 20 mg) | Sertagen (Sertraline, Tablets 50 mg) | |
|---|---|---|
| Number of analyzes | 9 | 9 |
| The drug content in a capsule/tablet declared by the manufacturer [mg] | 20 | 50 |
| Average drug content in capsule/ tablet [mg] | 19.45 | 50.51 |
| Minimum [mg] | 19.03 | 49.54 |
| Maximum [mg] | 19.85 | 51.12 |
| Variance (s2) | 0.098 | 0.324 |
| Standard deviation (SD) | 0.31 | 0.57 |
| Coefficient of variation (CV) [%] | 1.6 | 1.1 |
| Confidence interval of the arithmetic mean with a confidence level of 95% | µ = 19.45 ± 0.23 | µ = 50.51 ± 0.43 |
| The content of the drug in relation to that declared by the manufacturer | 97.2% | 101.0% |
Publisher’s Note: MDPI stays neutral with regard to jurisdictional claims in published maps and institutional affiliations. |
© 2022 by the author. Licensee MDPI, Basel, Switzerland. This article is an open access article distributed under the terms and conditions of the Creative Commons Attribution (CC BY) license (https://creativecommons.org/licenses/by/4.0/).
Share and Cite
Pyka-Pająk, A. New TLC Method Combined with Densitometry for Determination of Sertraline and Fluoxetine in Pharmaceutical Preparations. Processes 2022, 10, 2083. https://doi.org/10.3390/pr10102083
Pyka-Pająk A. New TLC Method Combined with Densitometry for Determination of Sertraline and Fluoxetine in Pharmaceutical Preparations. Processes. 2022; 10(10):2083. https://doi.org/10.3390/pr10102083
Chicago/Turabian StylePyka-Pająk, Alina. 2022. "New TLC Method Combined with Densitometry for Determination of Sertraline and Fluoxetine in Pharmaceutical Preparations" Processes 10, no. 10: 2083. https://doi.org/10.3390/pr10102083
APA StylePyka-Pająk, A. (2022). New TLC Method Combined with Densitometry for Determination of Sertraline and Fluoxetine in Pharmaceutical Preparations. Processes, 10(10), 2083. https://doi.org/10.3390/pr10102083