1. Introduction
In recent years, grouting has been widely used to improve mechanical properties of formations [
1,
2,
3,
4]. The grouting effect depends on both the property of the grouted medium and the rheology of the grout. For permeation grouting in a porous medium, such as sand layers, the most important parameter is the permeability, which is, to a large extent, dependent on the viscosity of the grout, and the available opening in the porous medium [
5,
6]. The permeability influences the design parameters during the grouting process, such as grouting pressure and grouting holes distance. For a porous medium with low permeability, the grouting pressure should be sufficiently high in order to ensure that the grout suspension can reach the boundary of the designed grouting area. Thus, it is important to understand the flowing pattern and the influence of the permeability on the grouting pressure and velocity during the grouting process.
A large number of laboratory and field studies have been conducted to estimate the permeability of porous media [
7,
8,
9,
10]. Among these established models, The Kozeny–Carman (KC) equation is the most well-known semi-empirical equation, which is widely accepted and used extensively for permeability estimation. However, the process of grouting penetration in a porous medium is much more complicated, due to the non-Newtonian fluid behavior of grout, and the interaction on the interface between grout and the groundwater. Thus, the traditional seepage flow equations, such as Darcy’s law, are no longer applicable for grouting penetration, and the KC equation cannot be used directly to calculate the permeability of the porous medium.
For decades, many researches have studied the penetrability of grout suspension both in the laboratory [
10,
11,
12,
13,
14,
15] and in the field [
16,
17]. Grouting with micro-fine cement has also been studied. Mittag and Savidis [
18] investigated the penetrability of micro-fine cement grout injected into sand by laboratory experiment, and the influence of the grain size on grout penetration was analyzed. Maghous et al. [
19] derived a macroscopic model containing both numerical and analytical solutions for grouting penetration in a porous medium. Eklund [
20] showed that penetrability of grouts is also related to the specific surface of the grains, and more fine-grained cement grains have a higher specific surface and, hence, a higher specific charge, leading to a lower penetrability. Some other researchers conducted numerical simulations on grouting penetration in a porous medium [
21,
22,
23,
24]. However, most of these studies have simplified the microstructures of the porous medium through homogenization, which neglected the tortuosity of the real flow path. Moreover, few studies have considered the influence of the distribution of the grains, and the grout–water interaction during the grouting process, and some basic mechanisms of penetration grouting may be overlooked.
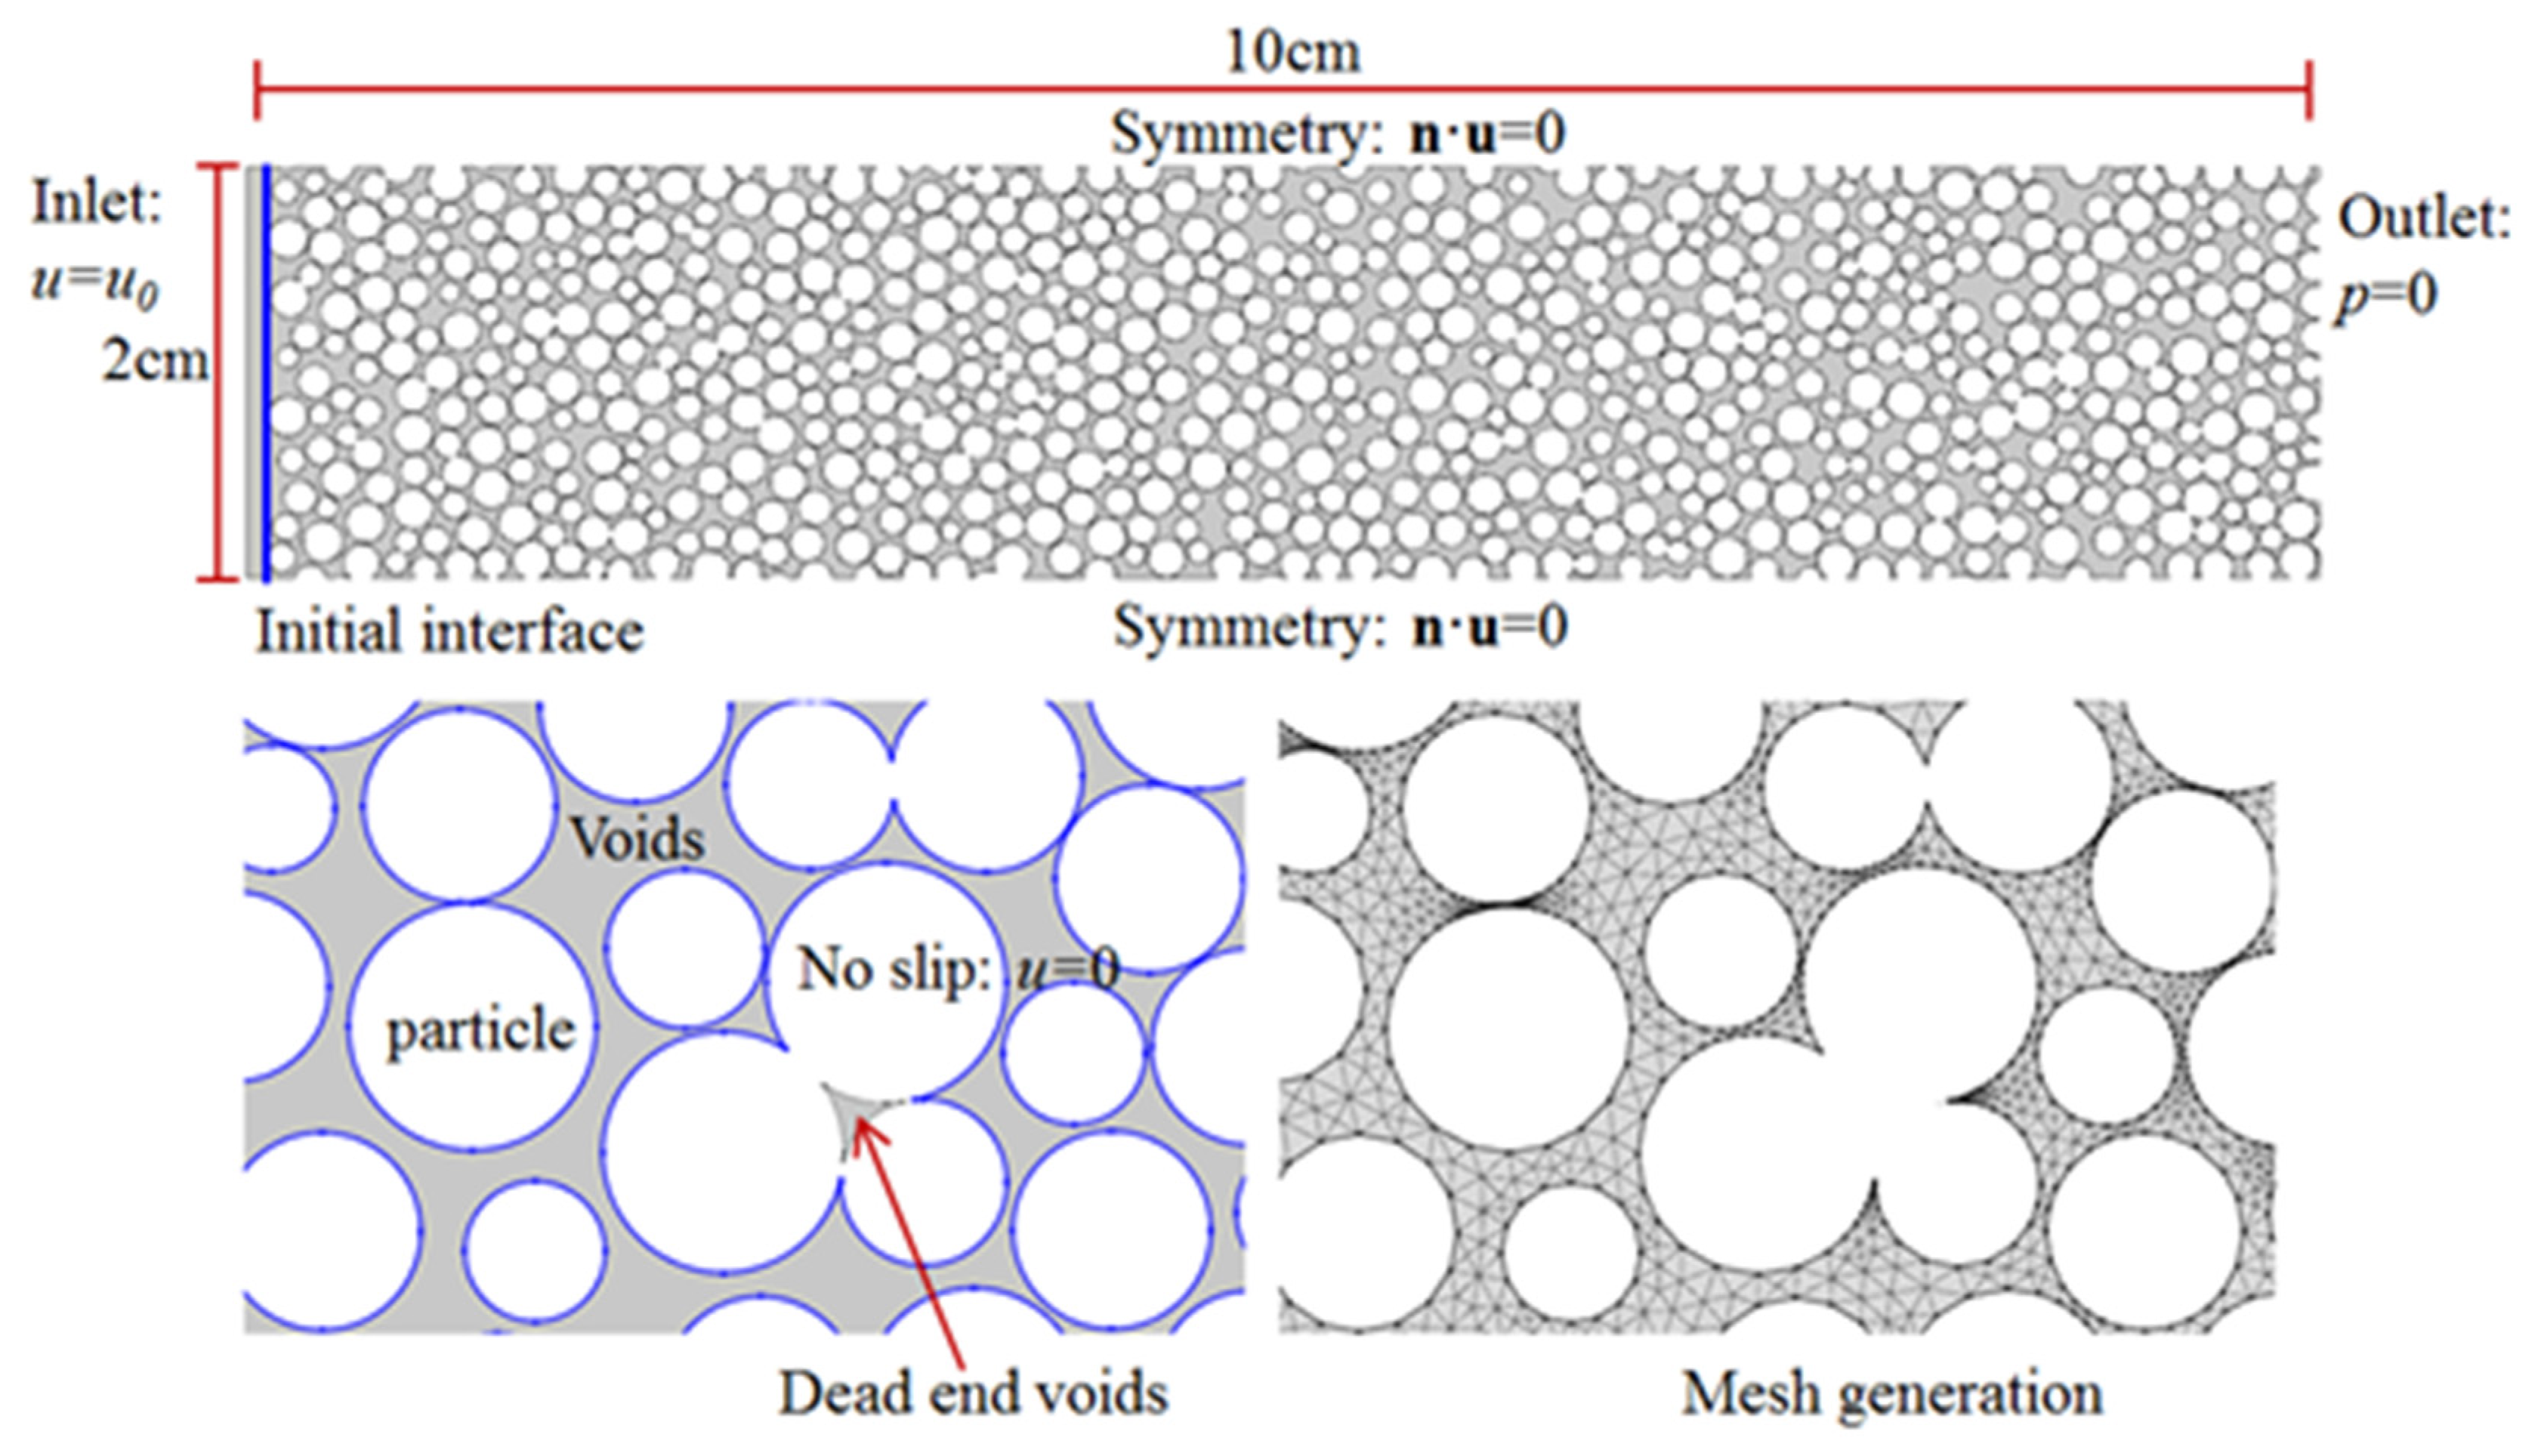
In this study, a numerical model of grouting penetration in the porous medium is established. The fluid flow in the interstices of the porous medium is directly modeled by Navier–Stokes equations. The grouting process is considered a two-phase flow problem, and the level set method is used to characterize the interaction between grout and groundwater. The proposed model has considered the nuances for each grain during grouting penetration instead of representing the fluid flow as a continuum process. In order to simplify the calculation, the clogging was not taken into account, which has a great impact in grouting engineering applications. In the simulation, three kinds of porosity (0.3; 0.4; 0.5), and two kinds of the grain size distribution (0.5~1 mm; 1~2 mm) are used. The value of porosity is chosen according to some similar previous studies, which also investigated two-dimensional fluid flow in porous media [
25,
26]. In those studies, the maximum porosity used was 0.358 and 0.37, respectively. Here, the value range is broadened from 0.3 to 0.5 so that more calculation details can be observed. The distribution of grout suspension in the porous medium at different times is acquired, and the filling degree is calculated. Then, a theoretical analysis is carried out with an equivalent model for fluid flow in the porous medium. Finally, some conclusions and perspectives are drawn from the calculation results.
3. Results and Analysis
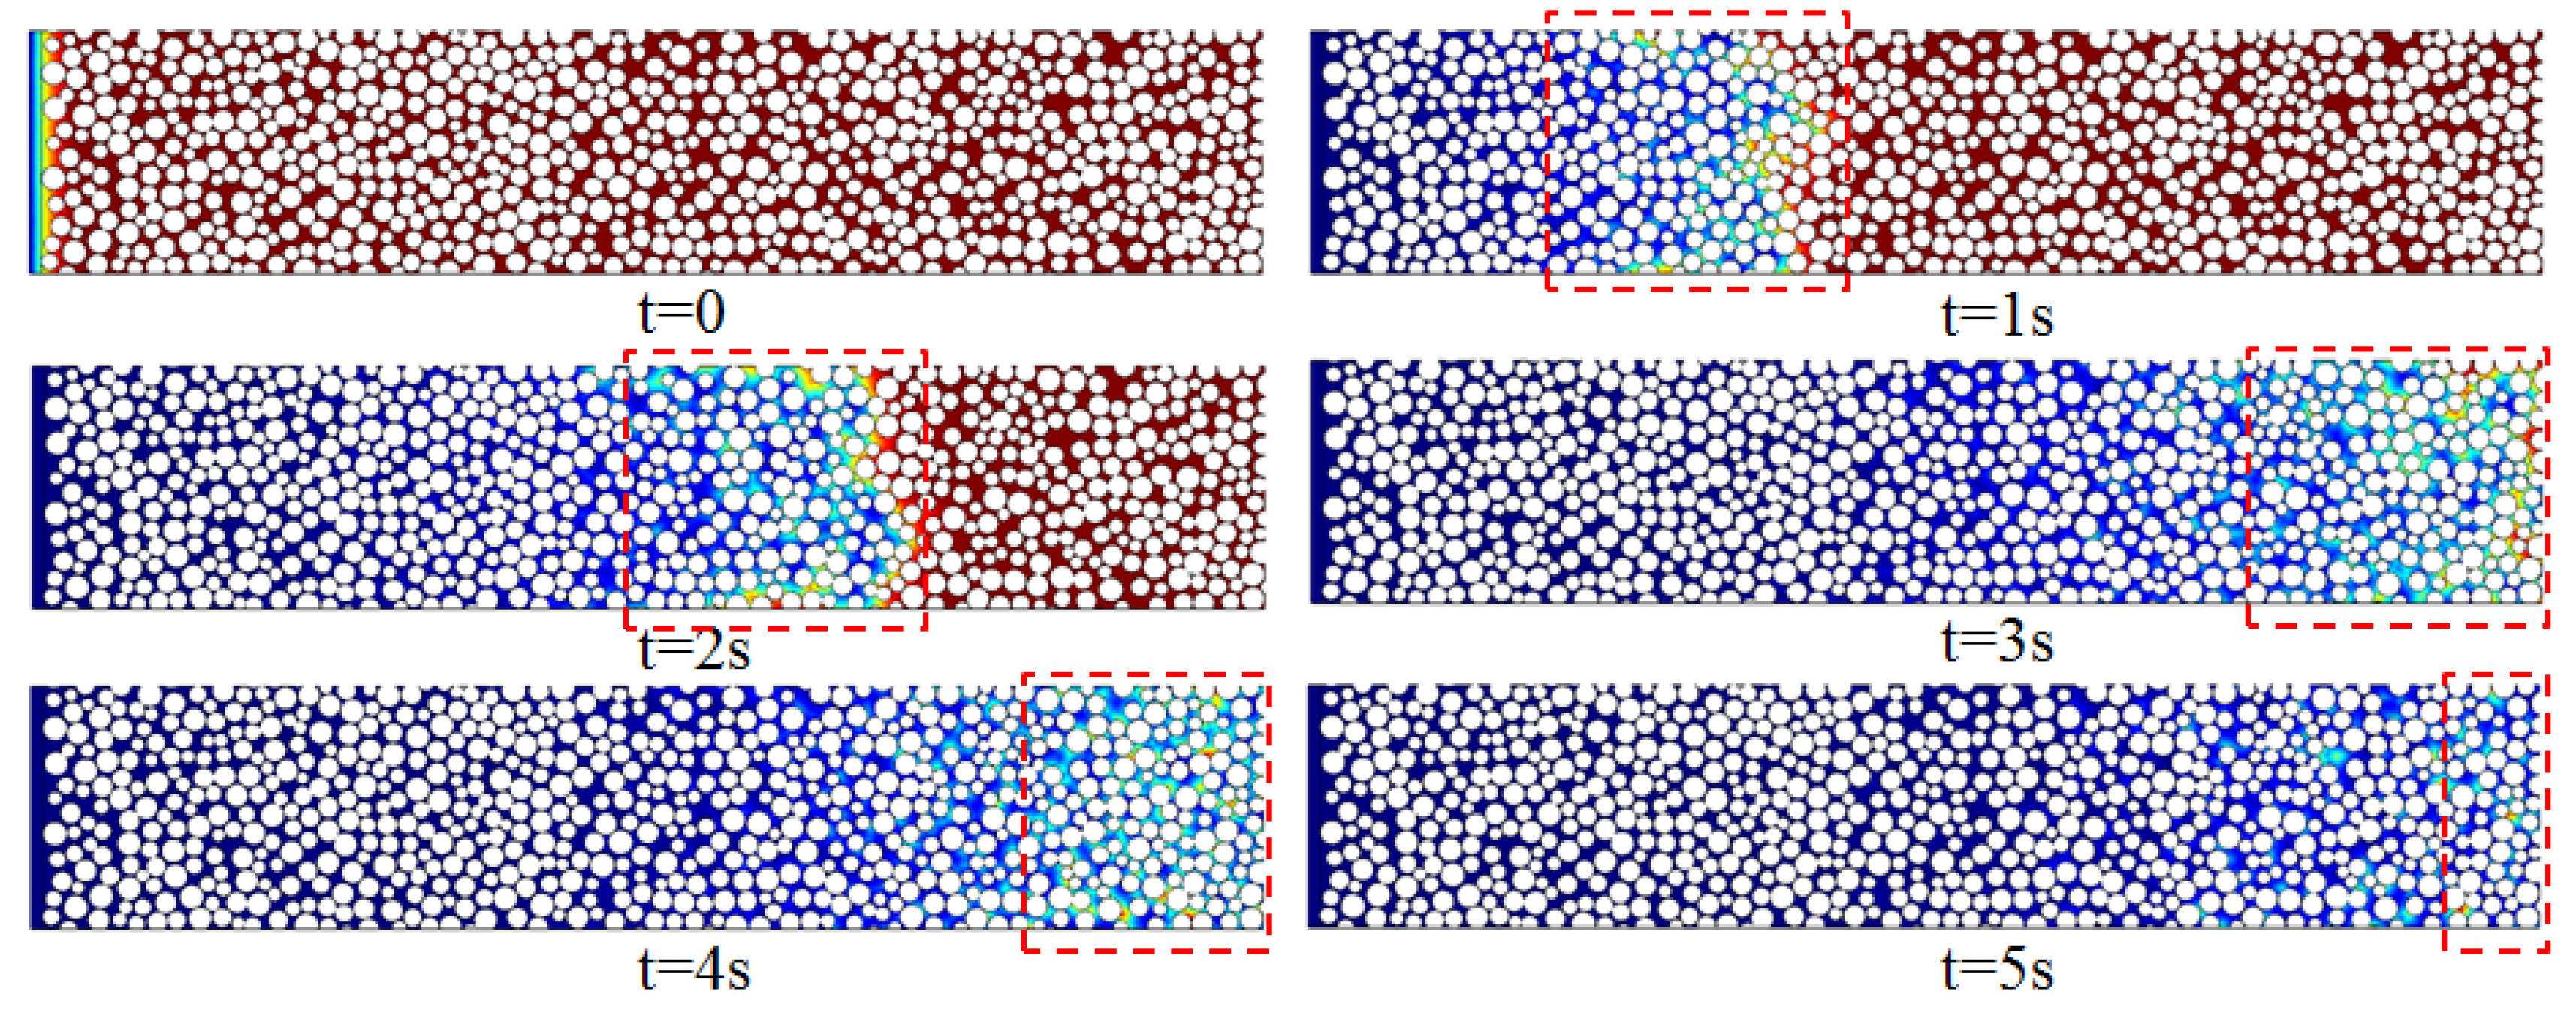
Figure 2 shows the penetration distance of grout suspension at different times. The porosity of the porous media is 0.35, and the grain size is between 0.5 mm and 1 mm. Regions with blue color mean the voids are filled with grout, and red color means the voids are filled with water. As can be seen, at the initial stage, all the voids of the porous media are filled with water. As grout is injected from the inlet, water in the voids is replaced by grout. The penetration distance increases with time in an almost linear trend since the grout is injected with a constant flow rate. At the time of 1 s, the grout reaches one-third of the length of the porous media. At the time of 3 s, the grout almost reaches the outlet.
At the grout front, it can be seen that the water is not replaced totally, and there is a transition area (as is shown with the dashed line), which means the grout and water are mixed together, and the grout is diluted by water. Water in some local areas is not thoroughly replaced by grout after the grout front has passed, and remains in the voids until it is replaced by the subsequent grout, or mixed in it. The width of the transition area is about 20 mm. When grout reaches the outlet, water in all the voids is totally replaced, except the transition area. In the time period from 3 s to 5 s, the subsequent grout keeps moving, and the transition area reduces. For a sufficiently long injection time, the transition area disappears, and the voids are totally filled with grout.
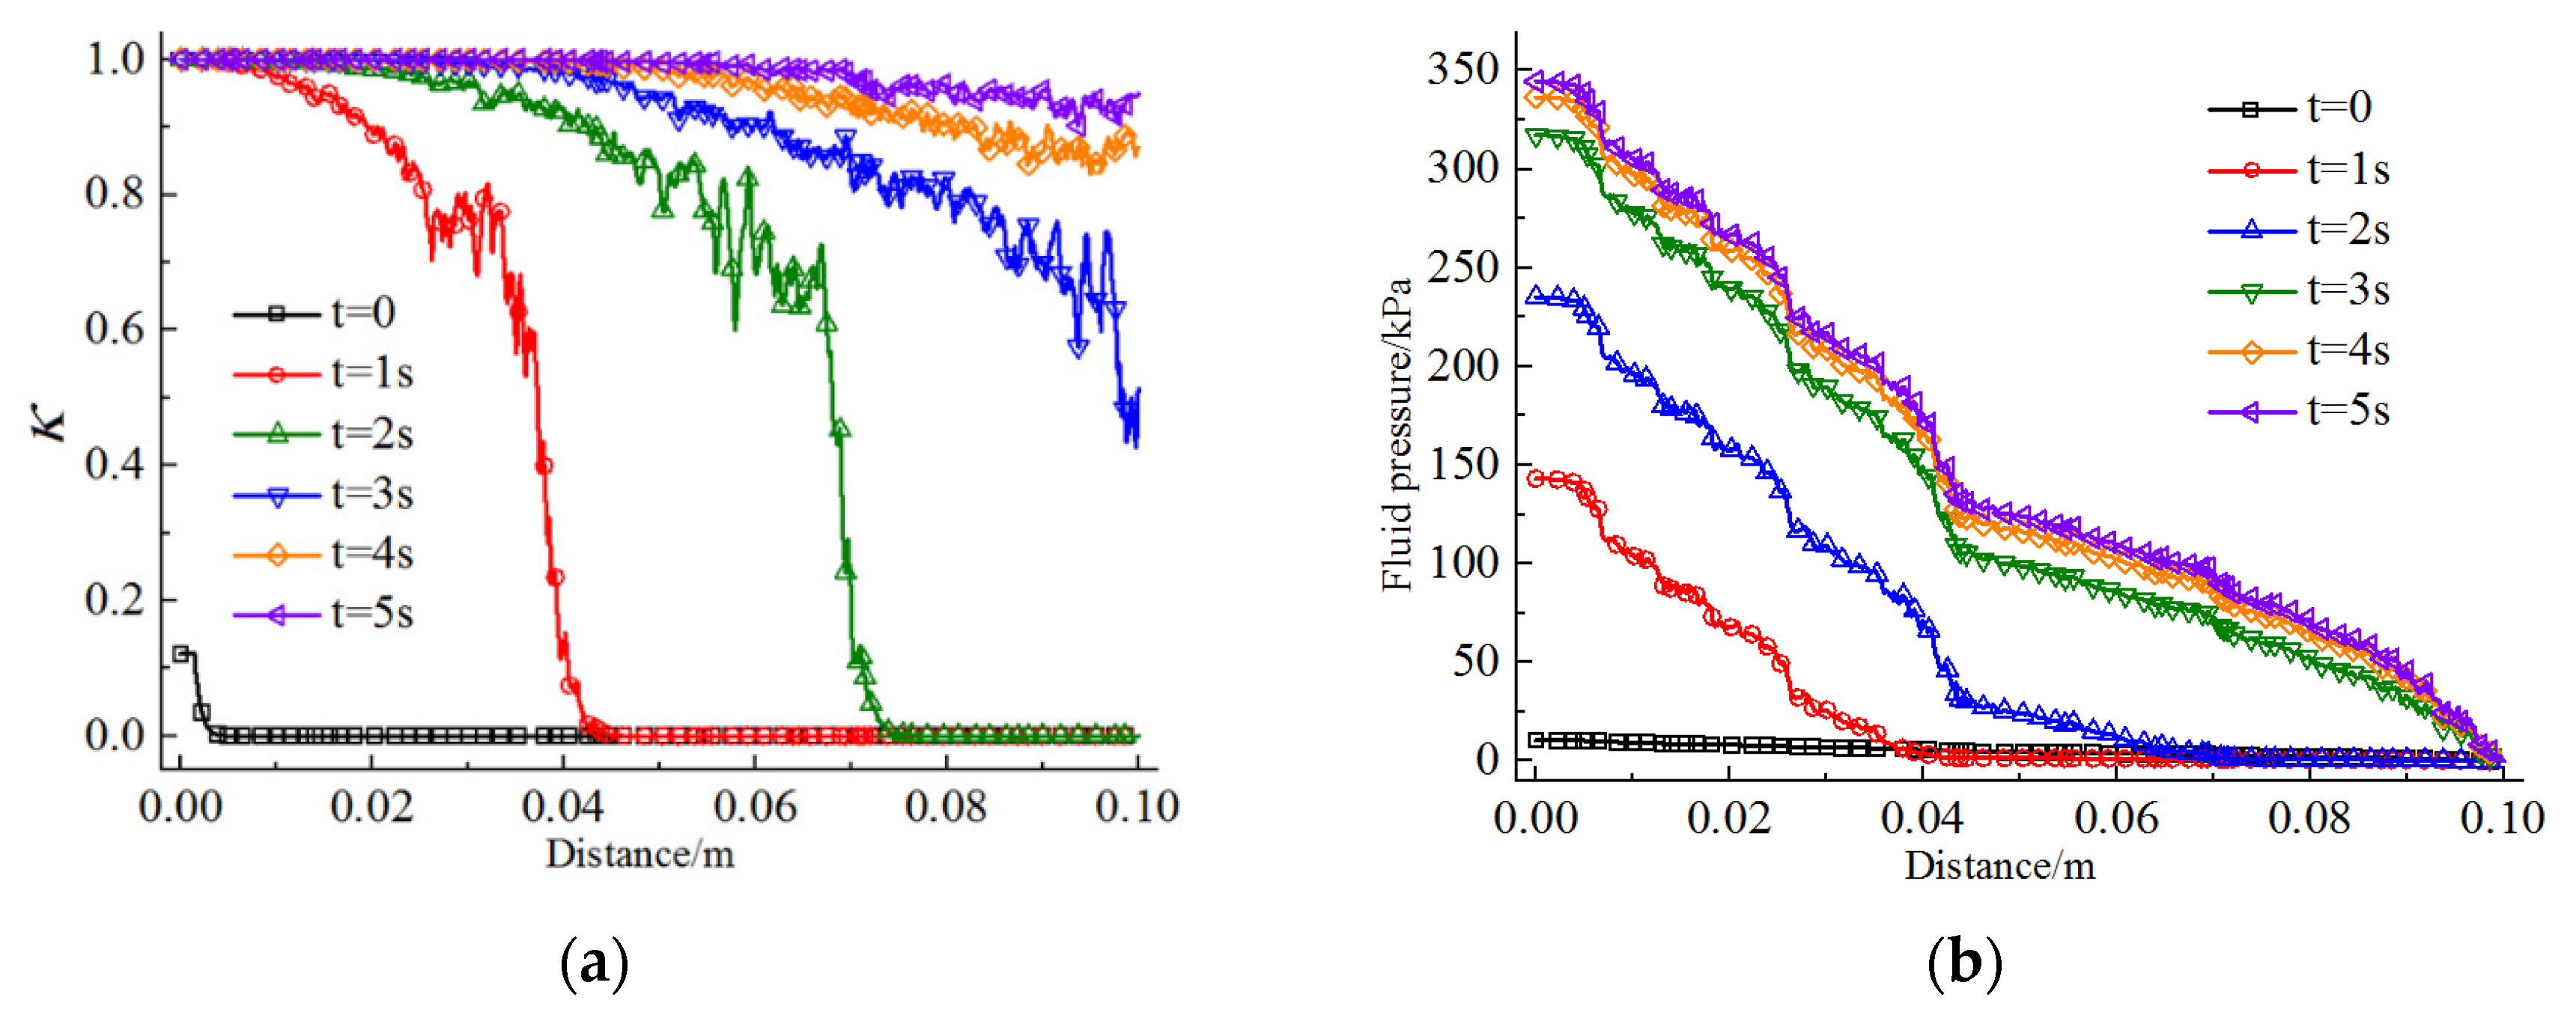
Figure 3a shows the filling degree (represented by
) of the grout, and the fluid pressure distribution, along with penetration distance at different times. The data of the curves are calculated by averaging the physical quantity (i.e., the percentage composition of grout and fluid pressure) on each cross-section, along with penetration distance. As can be seen, the curves of filling degree can be divided into three sections, especially for curves at the time of 1 s and 2 s. For the first section, the filling degree decreases slowly from 1 to about 0.6. For the second section, it drops to zero suddenly, and then in the third section, it keeps constant. The sudden drop of the second section represents the grout front. The variation of the grout front is the same as shown in
Figure 2. For grouting time after 3 s, the grout has reached the outlet, so the third section of the curves is absent.
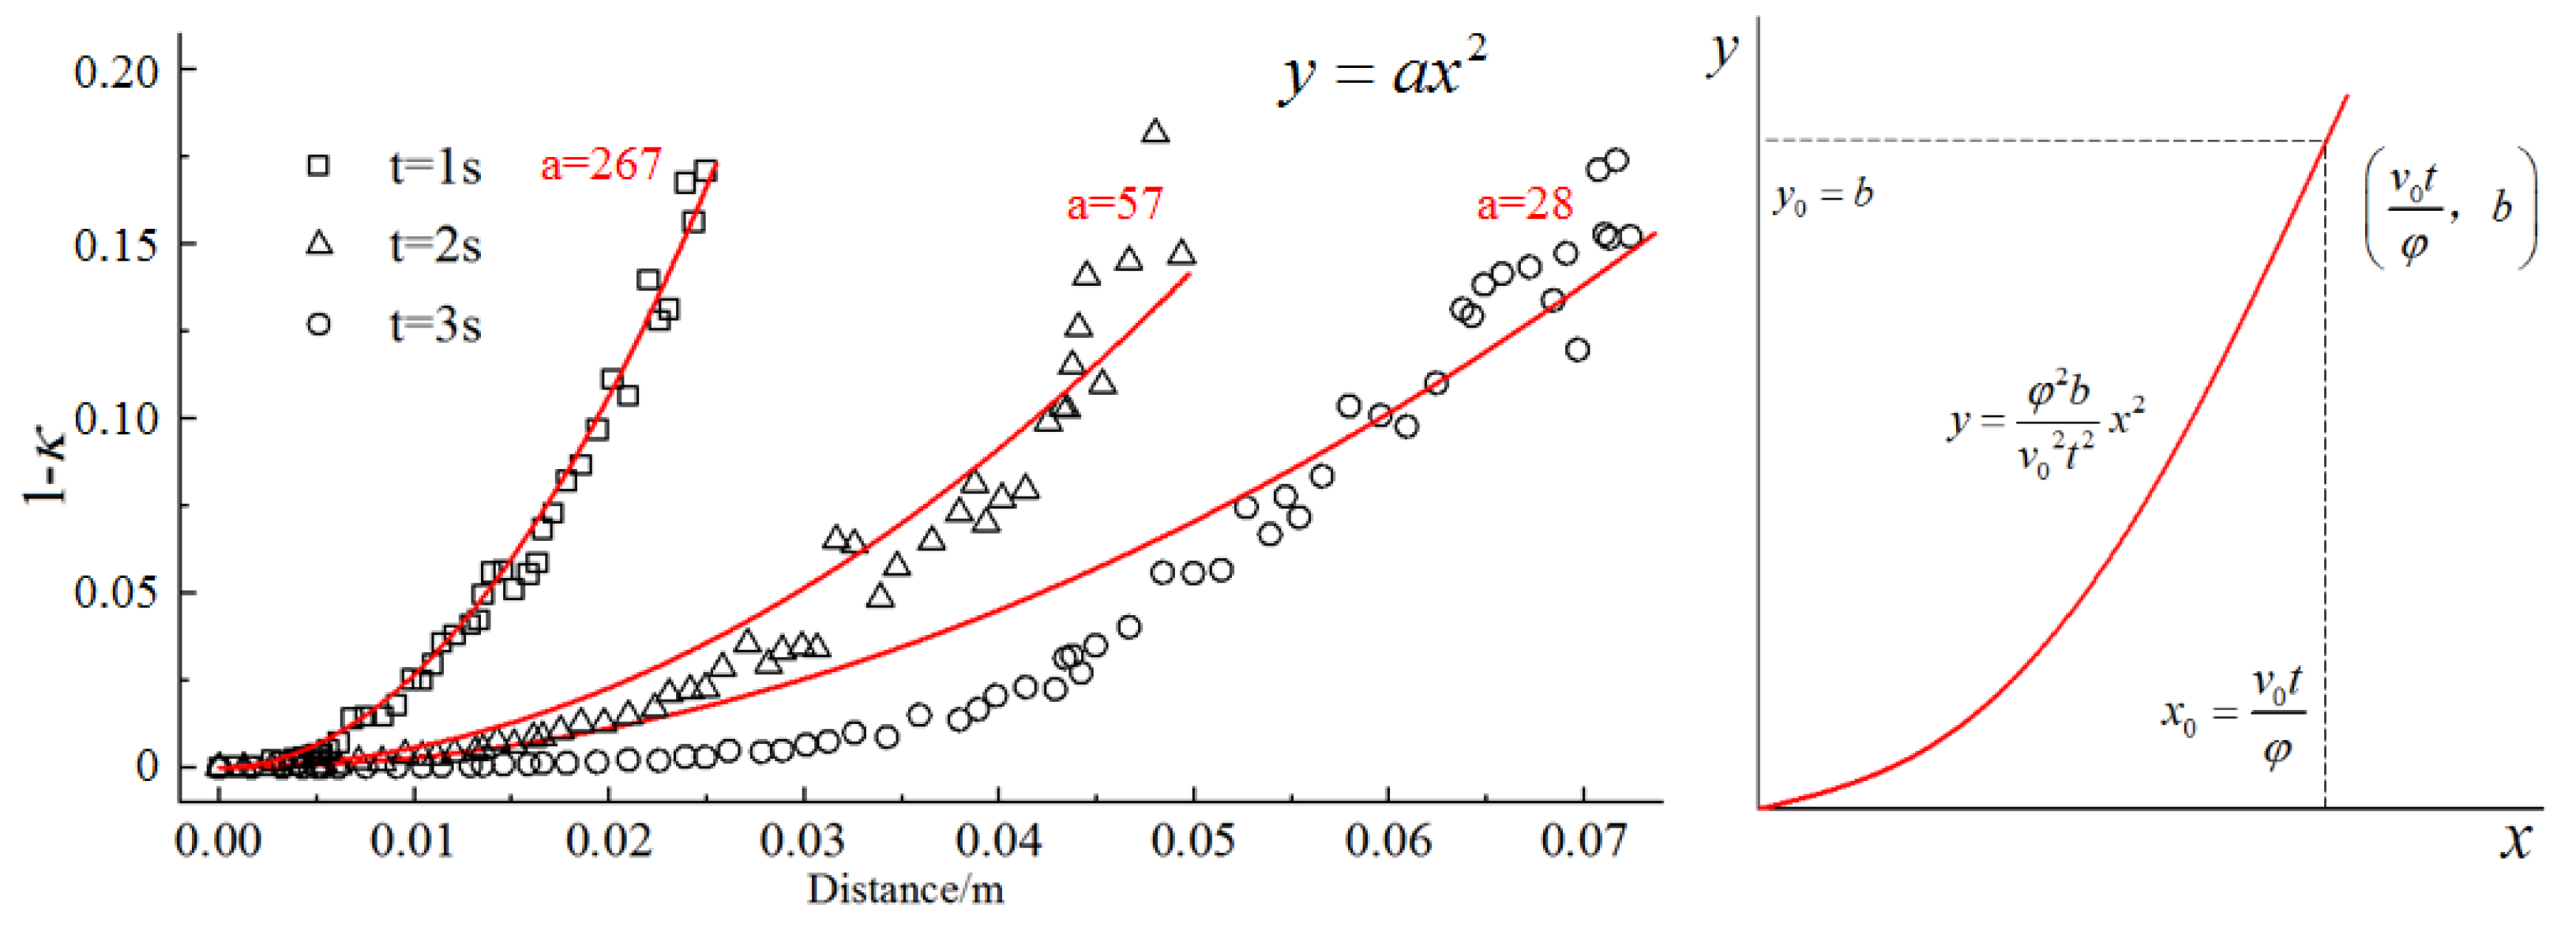
In the first section, the curve decreases with penetration distance instead of keeping constant at 1. This means the areas behind the grout front are not totally filled with grout. Moreover, the transition area between the first and second sections shows violent fluctuation, which means the water in the voids is not replaced immediately after the grout front has passed. The filling degree is about 0.7 at the turning point between the first and the second section. As penetration distance increases, the unfilled regions behind the grout front also increase. Regression analysis is made on the first section of the curves at times of 1 s, 2 s, and 3 s, with the equation form as y = ax
2 (in order to facilitate subsequent calculation, the curves are fitted as quadratic curves, and the actual powers are 2.66, 2.68, and 3.8). Calculation results are shown in
Figure 4. As can be seen, the fitting curves are generally in accordance with the original data, though it shows some small deviation as time increases. Thus, an approximate evaluation can be made on the variation of filling degree and its average value behind the grout front, as shown in
Figure 4. The x-coordinate of the turning point can be approximately represented by the penetration distance of the grout front. The y-coordinate is the difference between 1 and
, which is considered as 0.3 according to this study. Finally, the time and spatial distribution equation of
is derived as shown in Equation (6).
From
Figure 3b, it can be seen that the fluid pressure increases with grouting time. For a given time, the grouting pressure decreases along the penetration direction in the grouted zone in an almost linear trend. At the grout front, the fluid pressure reduces to almost zero, which means the pressure drop is induced mainly by the flow of the grout. In the grouted zone, the curves with different grouting times are nearly parallel, which means the fluid flow reaches a steady state after the grout front has passed. When grout has arrived at the outlet (
t > 3 s), the pressure increases very slowly with time, and finally approaches a constant value. At the inlet, the pressure finally reaches 350 kPa, and keeps constant. Another thing to notice is that the pressure drop is not in a strictly linear trend, but with a sequence of a sudden drop. This phenomenon is most obvious at a penetration distance of 0.04 m. The reason is that the distribution of porosity is not entirely uniform. In some local areas, the porosity is much smaller than adjacent areas, leading to a sudden pressure drop when grout passes.
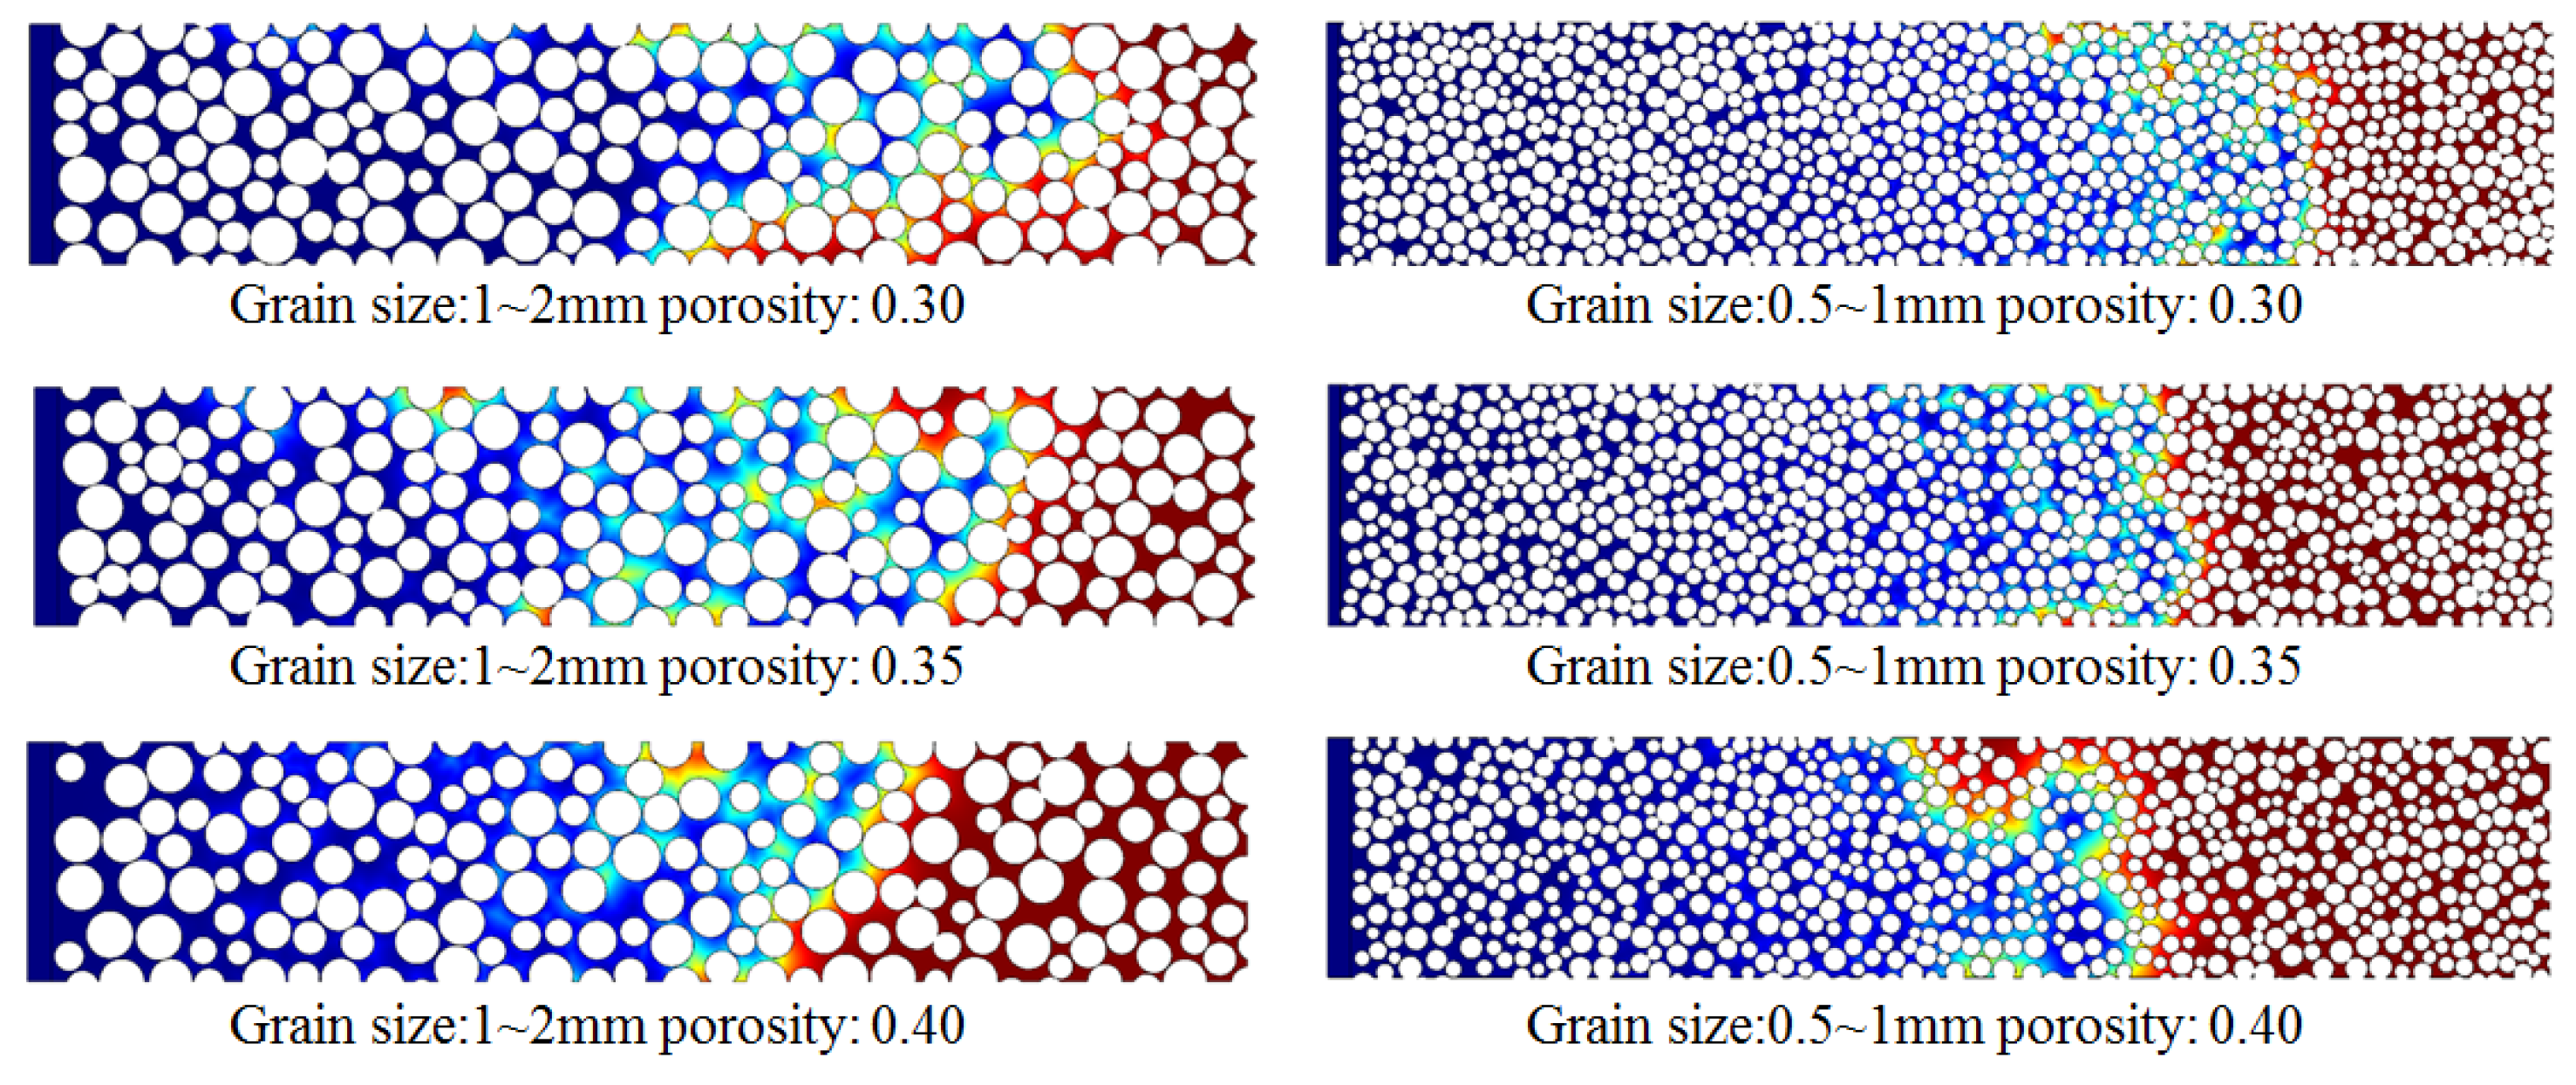
Figure 5 shows the penetration distance at the time of 2 s in the porous media with different grain sizes and porosity. It can be seen that the penetration distance decreases as the porosity increases; this is because the grout is injected at a constant rate, and it takes more grout to fill the voids in the porous medium with larger porosity. The transition area around the grout front seems to be larger in the medium with the grain size of 1~2 mm compared with that in the medium with the grain size of 0.5~1 mm. This is because for larger grain sizes, the uniformity is lower. In some local voids, the water cannot be easily replaced by grout. However, for a sufficiently large area (i.e., engineering scale), this difference can be neglected.
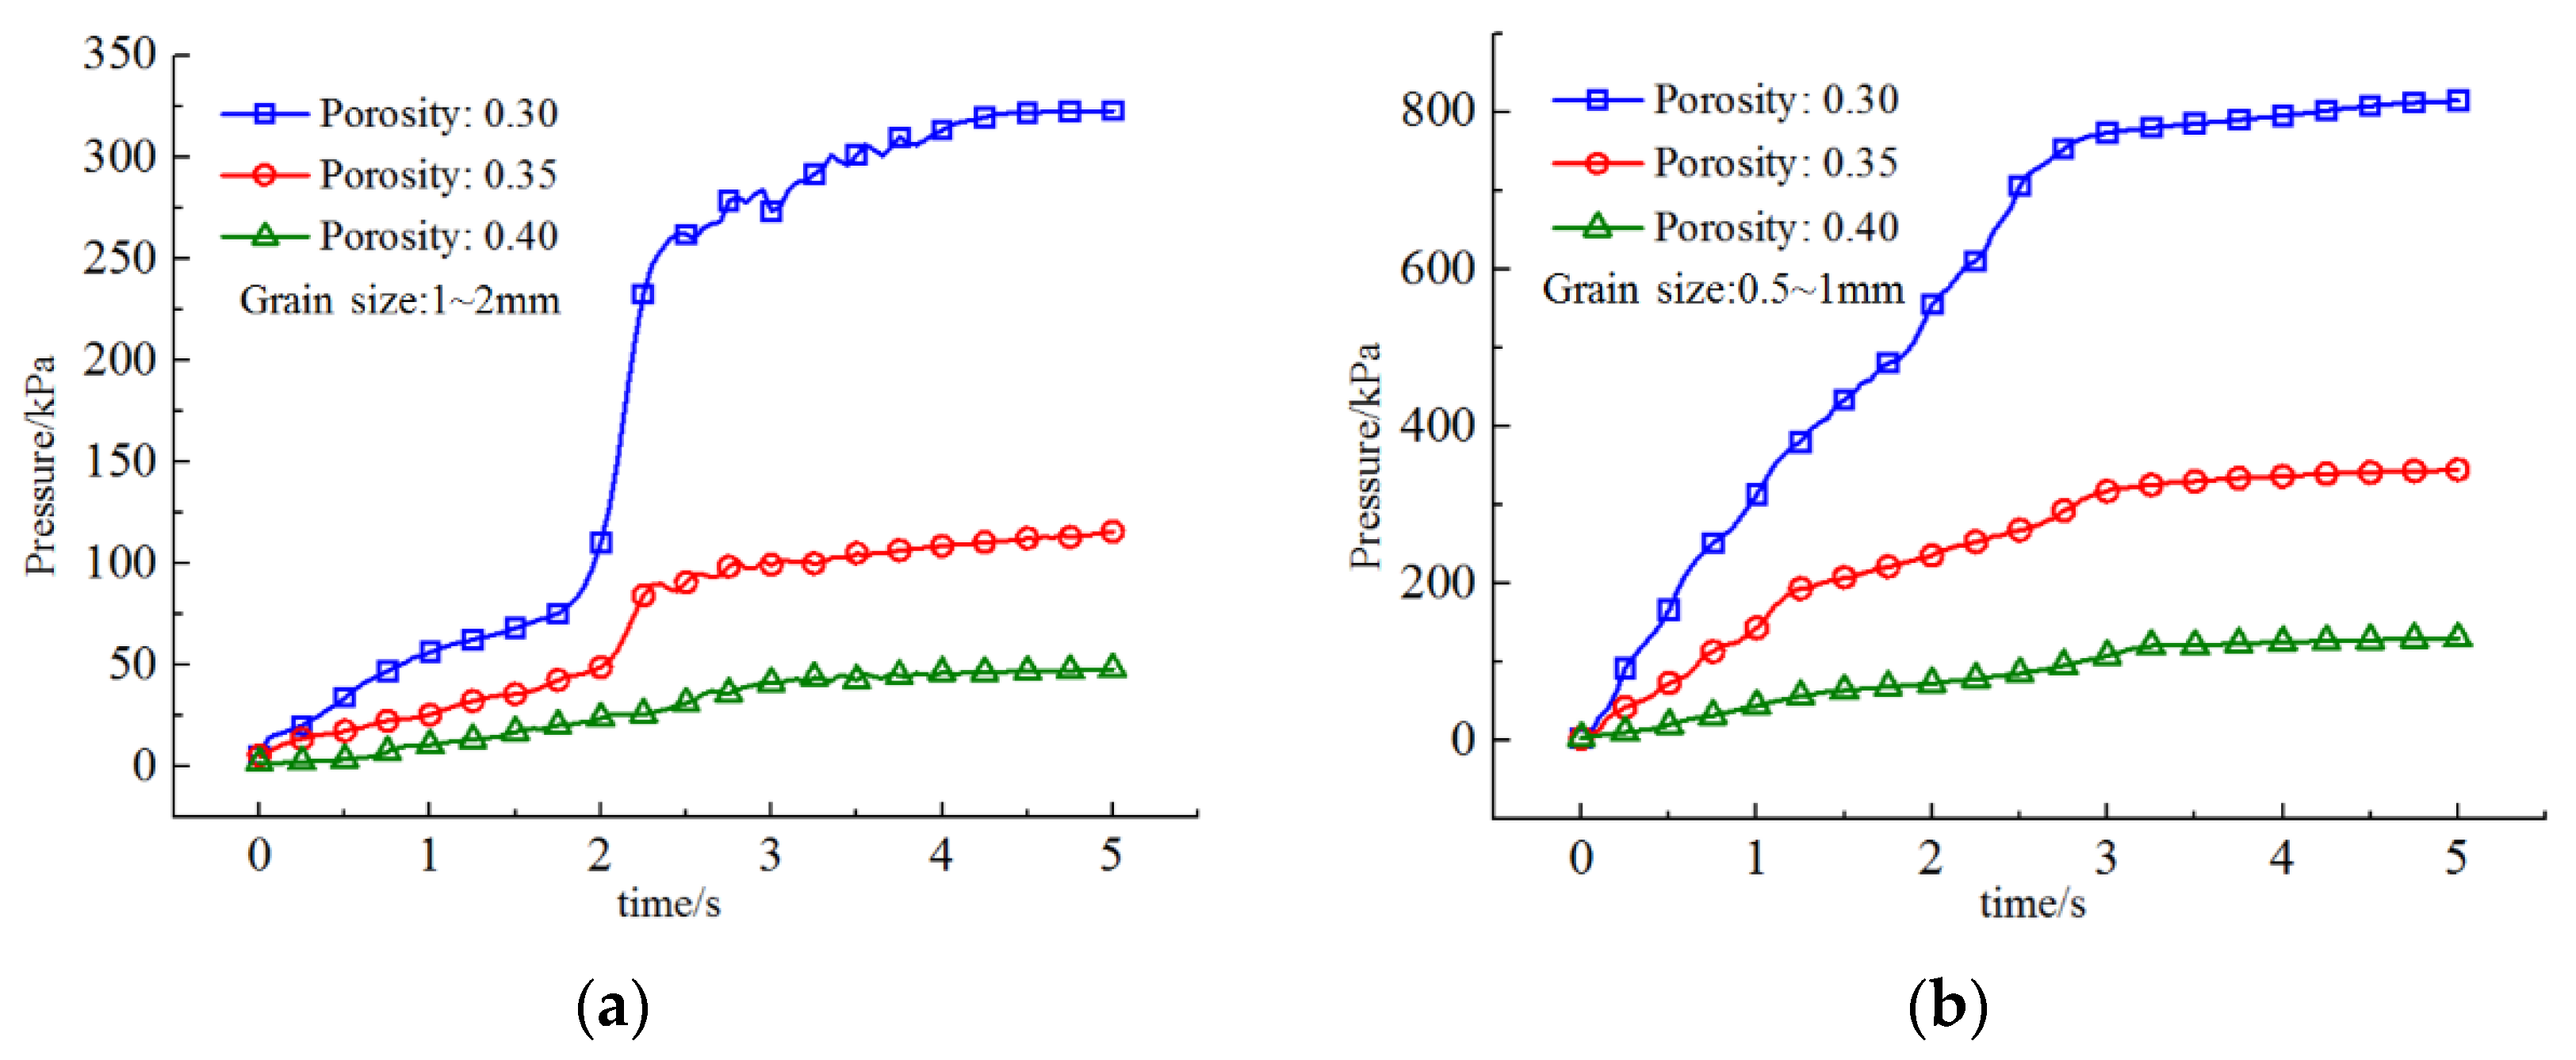
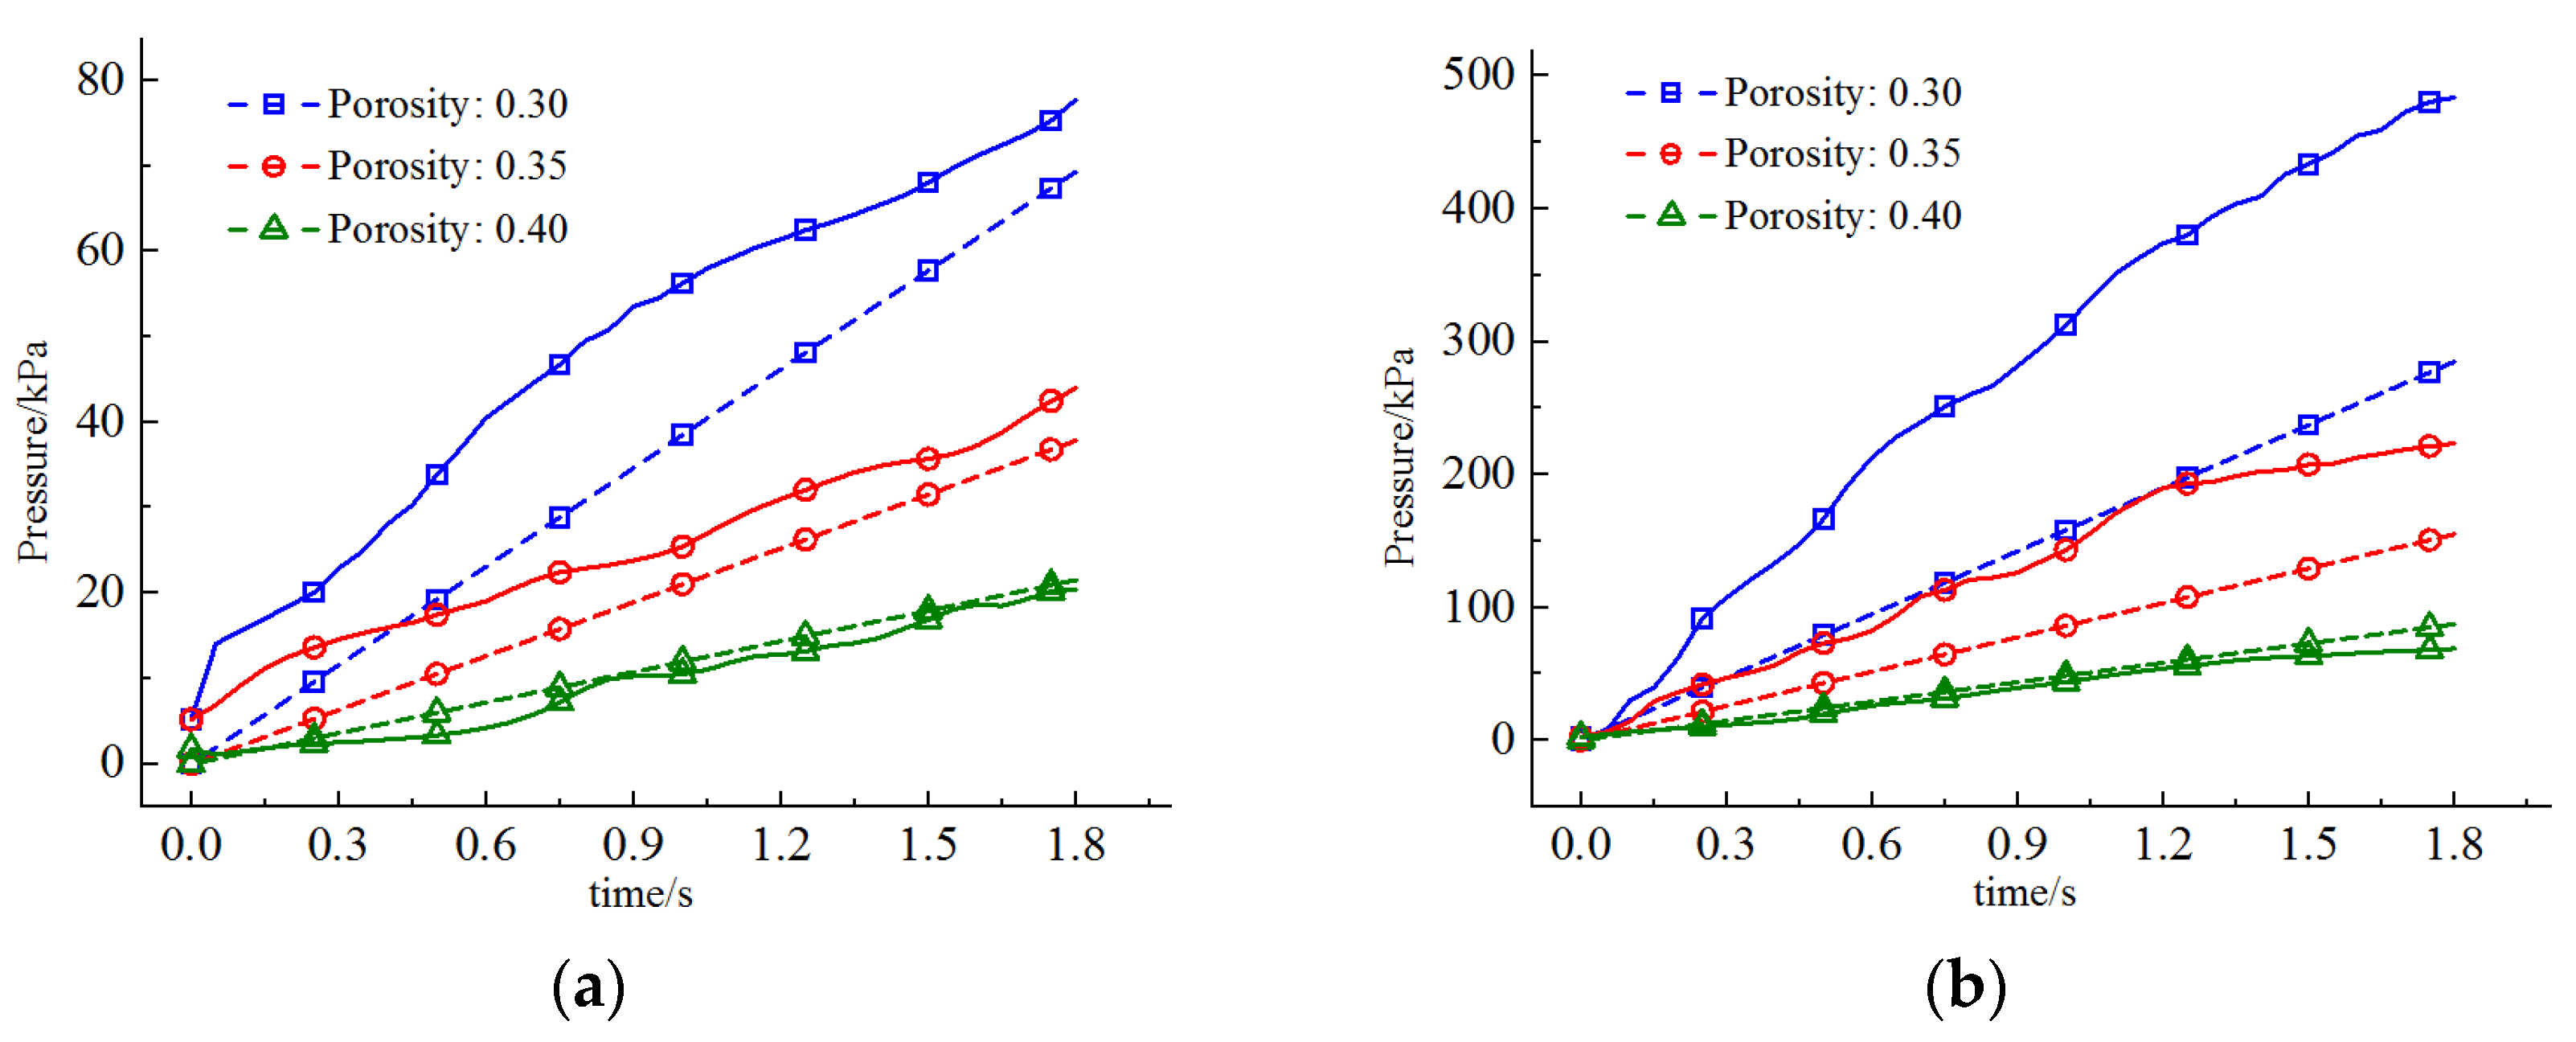
Figure 6 shows the variation of injection pressure (grouting pressure at the inlet) with grouting time. As can be seen, the injection pressure increases with time in an almost linear trend before the grout reaches the outlet, which is in accordance with the above-mentioned analysis. Afterward, it almost stays unchanged, which means the flow field reaches a stable state. In
Figure 6a, there is a sudden increase of injection pressure when the grout approaches the outlet, especially for the porosity of 0.3 and 0.35. This is because of the heterogeneity of porosity distribution. In the calculation of the pressure gradient in the following section, this sudden increase is neglected, and only the data at times before 2 s are used. By comparing the pressure variation of different curves, it can be seen that the pressure is influenced by the porosity and grain size of the porous medium, especially by the former. In
Figure 6a, the final injection pressure increases from 48 kPa to 323 kPa, and in
Figure 6b, the final injection pressure increases from 130 kPa to 814 kPa, as the porosity decreases from 0.4 to 0.3. The corresponding Reynolds number can be calculated according to the following equation:
where
is the width of the porous medium. According to Equation (7), the Reynolds number increases from 0.096 to 0.646 for
Figure 6a, and from 0.26 to 1.628 for
Figure 6b.
The result of pressure distribution along penetration distance in
Figure 3 and the injection pressure at different grouting times in
Figure 6 is compared with the work of Zhang et al. [
27], who also investigated the grouting process in porous media, considering the influence of flow paths of grout. In their work, a special experimental device was designed for grout penetration in the sand. The device is a cylinder with a length of 10 m and a diameter of 0.1 m, and the grout penetration is one dimensional. The experimental procedure, including the parameters and boundary conditions, is similar to the numerical model of this study.
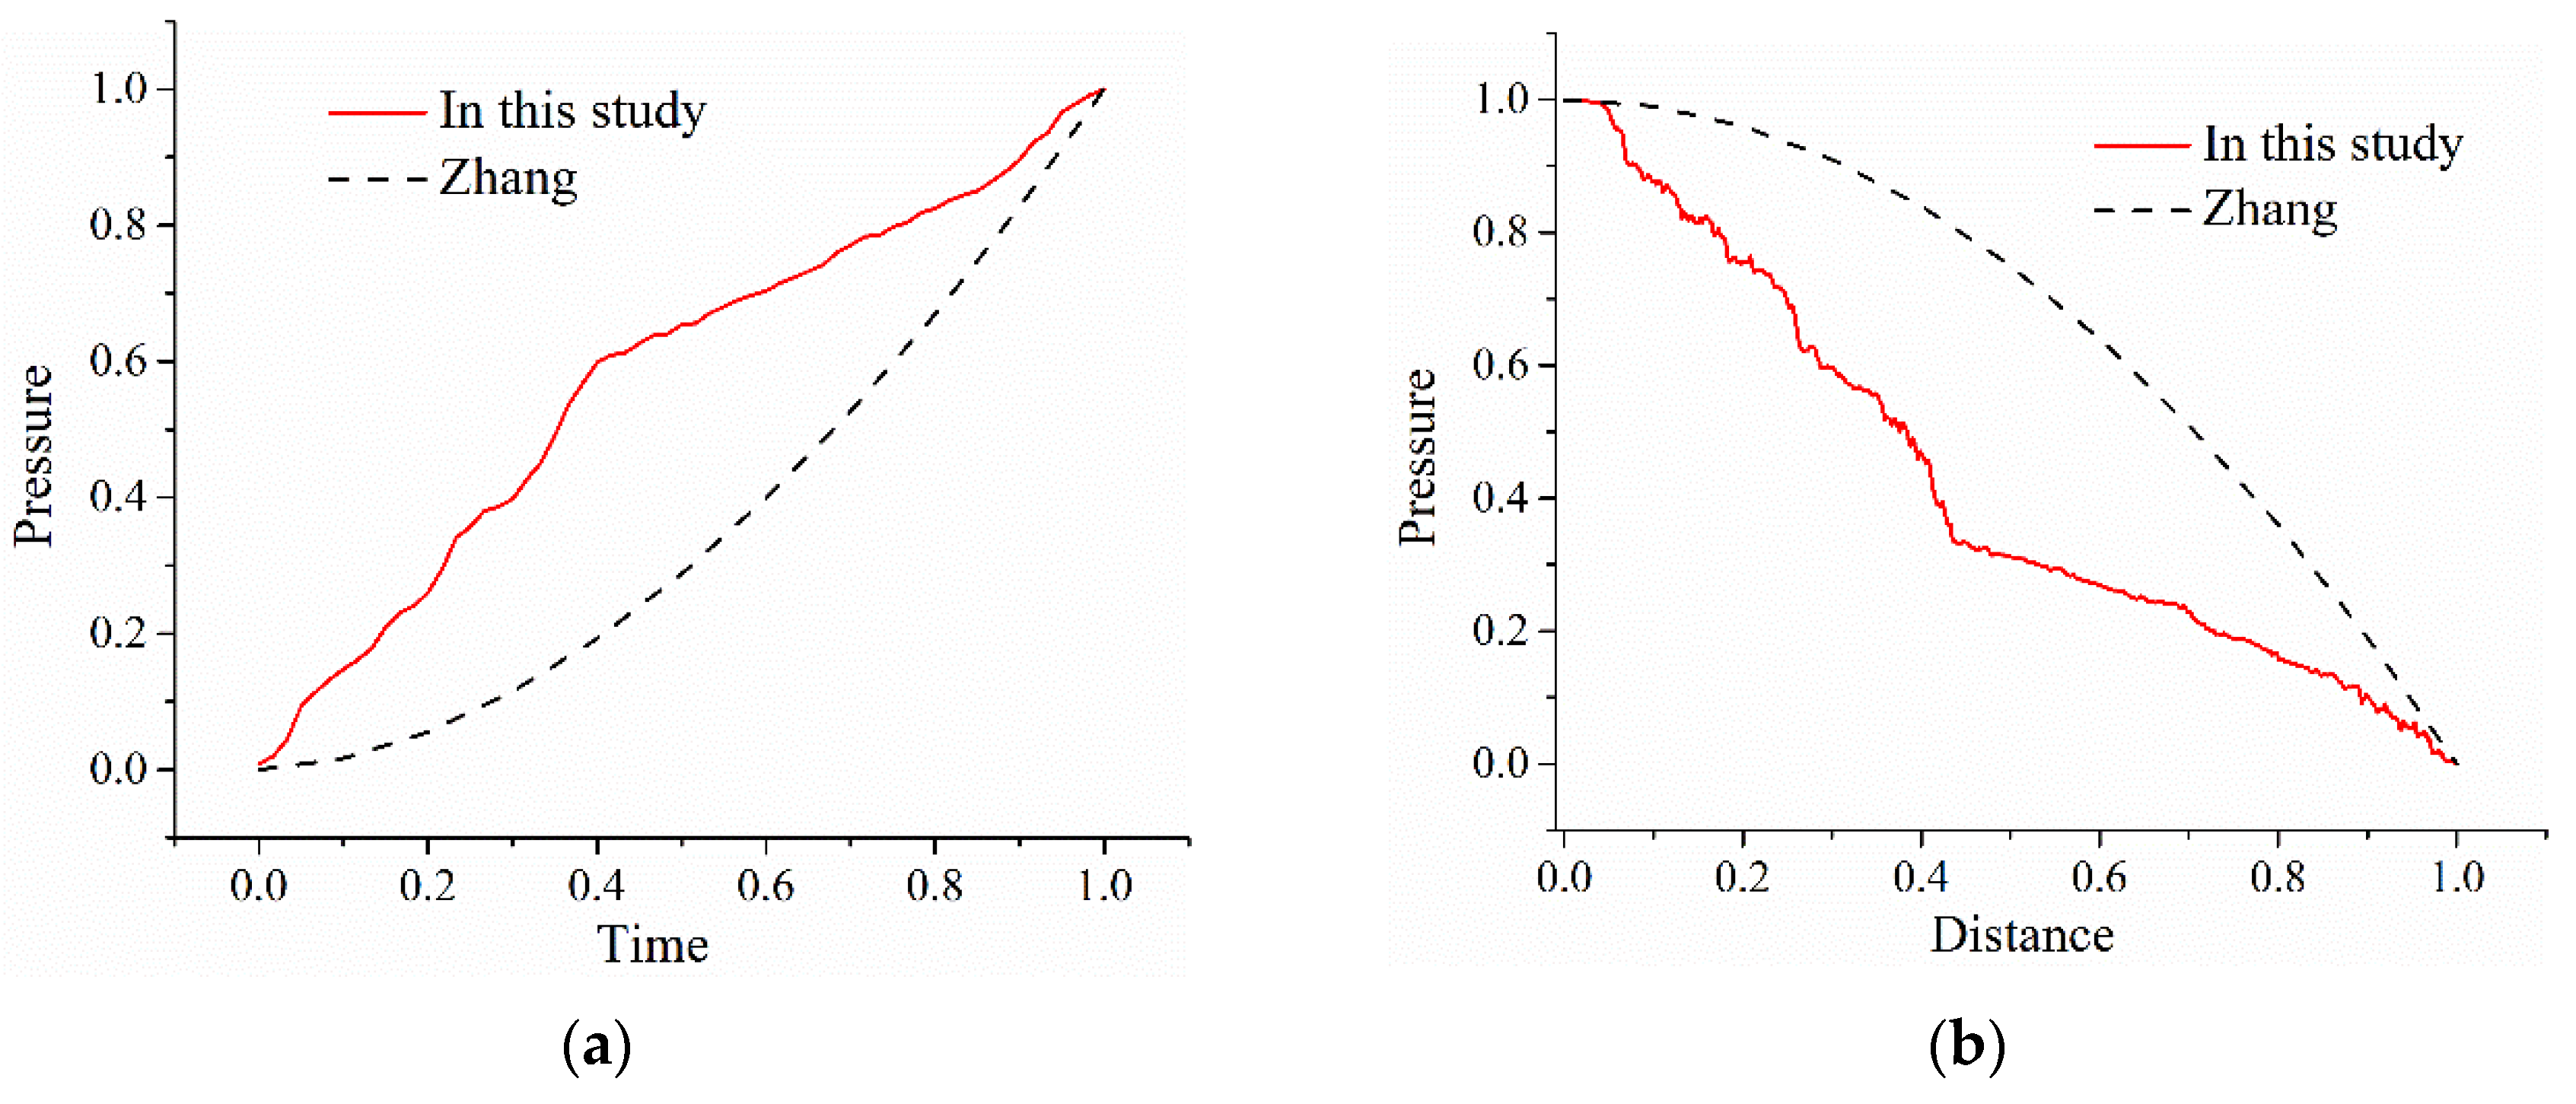
Comparison results are shown in
Figure 7. The solid lines are taken out from
Figure 3 and
Figure 6, which represent the case of porosity of 0.35 and a grain size of 1~2 mm. The dashed lines are drawn according to the results from Zhang, which only shows an overall trend of the pressure change. The horizontal and vertical coordinates have been normalized. As can be seen, the pressure-time curves in
Figure 7a are generally in a linear fashion. In Zhang’s work, it is concluded that the pressure should increase linearly with time, which is consistent with this Figure. However, the solid line is slightly convex, whereas the dashed line is slightly concave. This is probably caused by the non-uniformity of the porous media. In
Figure 7b, the dashed line is approximately in a parabola shape, whereas according to the calculation results of this study, the pressure has a sudden drop in the middle of the curve, which is also induced by the nonuniformity of particle distribution.
4. A New Analytical Formula of Grouting Penetration in the Porous Medium
In order to evaluate the rationality of the proposed numerical model, a theoretical analysis is carried out here to propose an analytical solution for the grouting penetration. The porous medium is considered as a bundle of capillary tubes of equal length, and the velocity components normal to the tube’s axes are not considered. Thus, the Navier–Stokes equation can be directly used, and the equivalent width of the porous medium (b0) can be acquired.
In this study, an estimation formula for
b0 is proposed with the following considerations:
b0 should have a positive correlation with the porosity of the medium, and a negative correlation with the specific area of the grain. In this two-dimensional problem, the specific area in a unit area of the calculation domain is represented by the sum of the perimeter (represented by
C) of all the grains divided by the length of the domain. Thus, the following formula is established:
Here, is an empirical parameter that is mainly influenced by the heterogeneity of the grain distribution, and is set to 2.7 in this calculation.
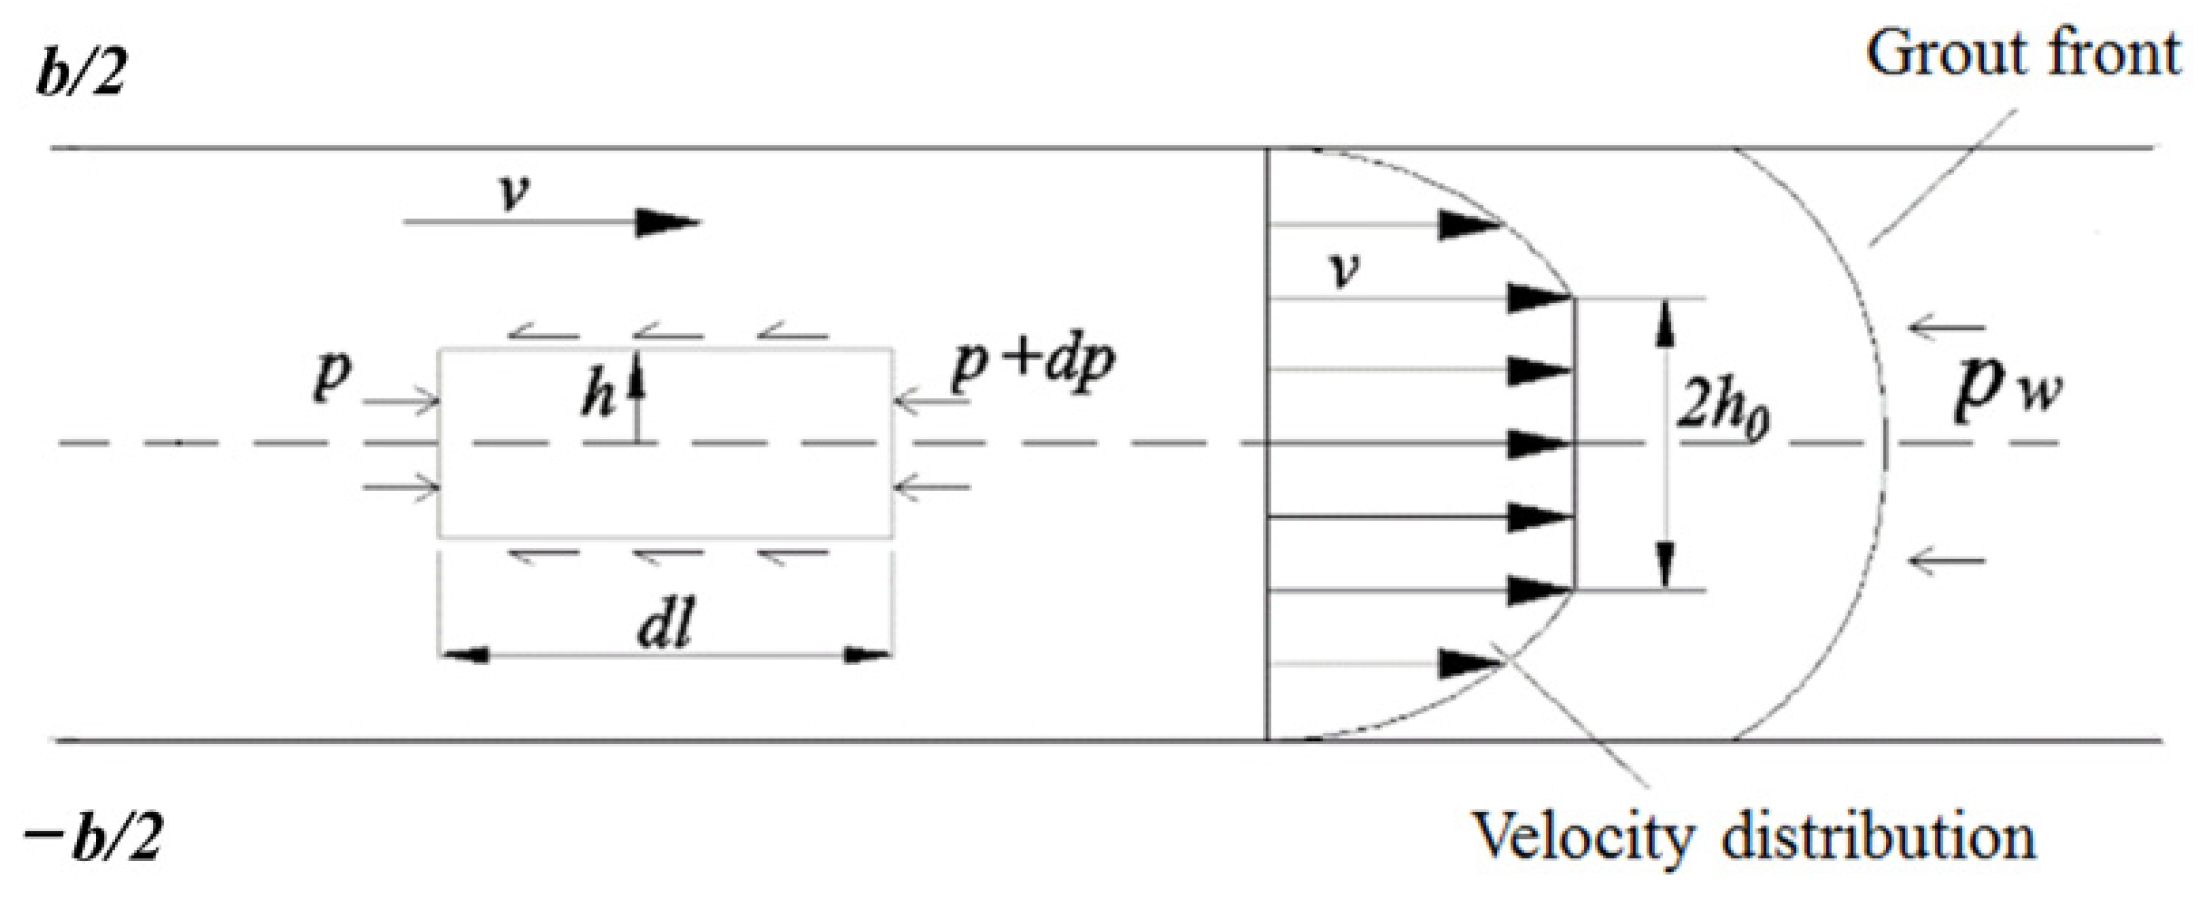
An infinitesimal analysis of the grout suspension is shown in
Figure 8. The force balance equation is written as:
Thus, the distribution of the shearing stress is written as:
The distribution of the velocity is written as [
28]:
The average velocity is expressed as:
As
is much bigger than
, the last term in the bracket can be omitted. Then, this equation can be directly integrated. As the velocity of grouting is constant, the relationship between
v and
l can be expressed as Equation (14), according to mass conservation:
By integrating Equation (13), and inserting Equations (7) and (14), the relationship between grouting pressure at the inlet and grouting time can be acquired:
Based on the proposed formula, the injection pressure at different grouting times can be estimated based on the given parameters. The estimation results are compared with the numerical results, as shown in
Figure 9. The solid line represents the numerical results, and the dashed line represents the estimation results with the proposed formula. As can be seen, the proposed formula gives a slightly lower estimation of the injection pressure compared with the numerical results. It is in coincidence with the numerical values for the most part, especially when the porosity is high and the grain size is small. The dashed lines and the solid lines are very close, for a porosity of 0.4. This is probably because the assumption of equivalent width (as shown in
Table 2) is more reasonable when the amount of grains in the medium is small, and the porosity is high. As the grains amounts increase, the difference becomes higher. For the condition with a porosity of 0.3 and a grain size 0.5~1 mm, the difference is the most obvious, and it becomes more extensive as time increases. When the grouting time is 1.8 s, the numerical value is about 40% larger than the estimated value using the proposed formula.
The parameters used in this formula can be easily acquired in real-world engineering. The value of l and b can be determined according to the actual boundary of the grouting region. and v can be directly measured during the grouting process. The porosity and the sum of the grain perimeter can be estimated according to field sampling statistics. However, it should be noticed that this formula is established with a two-dimensional condition. Thus, the validity with real-world engineering should be further investigated.
5. Conclusions
In this study, a numerical model of grouting penetration in the porous medium is established. The fluid flow in the interstices of the porous medium is directly modeled by Navier–Stokes equations. The grouting process is considered as a two-phase flow problem, and the level set method is used to characterize the interaction between grout and groundwater. Then, a theoretical analysis is carried out with an equivalent model, and an analytical solution of the grouting penetration is proposed for fluid flow in the porous medium. The main conclusions are as follows:
(1) As grout is injected from the inlet, the water in the voids is not thoroughly replaced by grout after the grout front has passed, and remains in the voids until it is replaced by the subsequent grout, or mixed in it. For a sufficiently long injection time, the transition area at the grout front disappears, and the voids are totally filled with grout. As penetration distance increases, the unfilled regions behind the grout front also increase.
(2) Along with the penetration distance, the filling degree decreases slowly at first, and then drops to zero suddenly at the grout front. The transition area shows violent fluctuation, which means the water in the voids is not replaced immediately after the grout front has passed. The filling degree is about 0.7 at the grout front. The variation of filling degree along with grouting distance approximately obeys a quadratic polynomial function.
(3) The pressure drop along penetration distance is approximately in a linear trend. In some local areas, the porosity is much smaller than adjacent areas, leading to a sudden pressure drop when grout passes. The injection pressure is influenced by the porosity and grain size of the porous medium, especially by the former. The final injection pressure increases from 48 kPa to 323 kPa for a grain size of 1~2 mm, whereas it increases from 130 kPa to 814 kPa for a grain size of 0.5~1 mm, as the porosity decreases from 0.4 to 0.3.
(4) The proposed formula gives a slightly lower estimation on the injection pressure comparing with the numerical results. It is in coincidence with the numerical values for the most part, especially when the amount of grains in the medium is small and the porosity is high. As the grain amount increases, the difference becomes higher. Since the formula is established with a two-dimensional condition, the validity with real world engineering should be further investigated.


