Article

Approximate Models of Microbiological Processes in a Biofilm Formed on Fine Spherical Particles

by
Szymon Skoneczny
1,* and
Monika Cioch-Skoneczny
2
1
Department of Chemical and Process Engineering, Cracow University of Technology, 31-155 Krakow, Poland
2
Department of Fermentation Technology and Technical Microbiology, University of Agriculture in Krakow, 30-149 Krakow, Poland
*
Author to whom correspondence should be addressed.
Processes 2022, 10(1), 48; https://doi.org/10.3390/pr10010048
Submission received: 1 November 2021 / Revised: 6 December 2021 / Accepted: 8 December 2021 / Published: 27 December 2021
(This article belongs to the Topic Bioreactors: Control, Optimization and Applications)

Abstract

:
This paper concerns the dynamical modeling of the microbiological processes that occur in the biofilms that are formed on fine inert particles. Such biofilm forms e.g. in fluidized-bed bio-reactors, expanded bed biofilm reactors and biofilm air-lift suspension reactors. An approximate model that is based on the Laplace–Carson transform and a family of approximate models that are based on the concept of the pseudo-stationary substrate concentration profile in the biofilm were proposed. The applicability of the models to the microbiological processes was evaluated following Monod or Haldane kinetics in the conditions of dynamical biofilm growth. The use of approximate models significantly simplifies the computations compared to the exact one. Moreover, the stiffness that was present in the exact model, which was solved numerically by the method of lines, was eliminated. Good accuracy was obtained even for large internal mass transfer resistances in the biofilm. It was shown that significantly higher accuracy was obtained using one of the proposed models than that which was obtained using the previously published approximate model that was derived using the homotopy analysis method.

1. Introduction

Numerous problems in the field of chemical and process engineering, for example those concerning heat transfer or simultaneous diffusion and reaction, are described by nonlinear differential equations [1,2,3]. Typically, such differential problems are solved using numerical algorithms, which may cause problems with convergence and require time-consuming computations [4,5,6]. For that reason, there is an interest in using ap-proximation methods for solving nonlinear differential equations. The application of these methods in dynamic simulations of two-scale objects is particularly significant [7]. Fluidized-bed catalytic reactors, reactors with a stationary catalytic bed and all microbiological reactors with an immobilized biofilm belong to this group [8]. In such devices, the microbiological process occurs in the liquid phase where the diffusional resistances are negligible and in the biofilm where the internal mass transfer resistances cannot be neglected. As a result, the mathematical description of the process is based on the application of different types of equations for both of the phases. According to Nicolella et al. [9], the significance of particle-based biofilm reactors is large as they provide the potential to develop compact and high-rate processes.
Studies concerning approximation models of catalytic processes in porous catalysts can be found in the literature. An example is the study by Szukiewicz [10], who proposed a method based on the Laplace–Carson transform for the determination of the dynamic changes of the average reactant concentration in a catalytic pellet. Another example is the study by Sun et al. [11], who used the Adomian decomposition method (ADM) for the determination of the stationary profiles of the reactant concentration in a catalytic pellet and its effectiveness factor. Abbasbandy [12] used the homotopy analysis method (HAM) for the modelling of a catalytic pellet at stationary conditions. In our previous study [13], the homotopy analysis method was applied for the simulation of a biofilm at a steady state.
Several studies can be found in which a simplified approach was used in the mod-eling of bioreactors with a biofilm. For example, Russo et al. [14] applied the concept of a so-called zero-dimensional biofilm model for a dynamic simulation of a continuous biofilm bioreactor. The quoted authors introduced a lumped-state variable expressing the overall attached biomass concentration in the bioreactor. This is a far-reaching approach, because the external and internal mass transfer resistances of the growth-limiting substrate are neglected. A similar approach was applied in the study by Dokianakis et al. [15] and in other recent studies [16,17,18,19] concerning the modeling of biofilm bioreactors. It was repeatedly proven that mass transfer resistances cause the distribution of a substrate concentrations inside the biofilm [20,21]. Neglecting this phenomenon in the mathematical model leads to obtaining results that are inconsistent with experimental observations [22]. Despite numerous papers concerning the applica-tion of approximation methods in the modeling of catalytic pellets and several studies concerning the modeling of biofilms at stationary conditions [13,23], there are no studies which demonstrate the applicability of such an approach in the modeling of dynamical biofilm growth.
This study presents an approximate model for biofilm dynamics, which is based on the Laplace–Carson transform and a family of approximate models that are based on the concept of pseudo-stationary substrate concentration profiles in the biofilm. The com-putational efficiency and accuracy of the proposed models were evaluated. The solution of the exact model that was obtained by using the method of lines was chosen as a reference. Moreover, the accuracy of the approach presented was compared with a previously published model, which was derived using the homotopy analysis method.

2. Exact Mathematical Model

A microbiological process limited by a single substrate is considered. Mass balance of substrate A in a spherical biofilm is the following:
c A b t = D e A 2 c A b x 2 + D e A 2 x c A b x r A b ( c A b )
Equation (1) is subject to the following boundary and initial conditions:
c A b ( r 0 , t ) x = 0 , t 0
c A b ( r 0 + L b , t ) = c A s b ( t )
c A b ( x , 0 ) = c 0 A b ( x ) x [ r 0 , r 0 + L b ]
where c 0 A b denotes the initial substrate A concentration in the biofilm, while c A s b de-notes the concentration at the biofilm’s surface.
The uptake rate of the carbonaceous substrate A in the biofilm can be formulated as follows:
r A b ( c A b ) = 1 w BA f ( c A b ) ρ b
In this study, two kinetic models of microbiological processes were taken into account, i.e., Monod and Haldane. The former describes the utilization of many non-toxic substrates [24], whereas the latter is commonly used in modelling the biodegradation of toxic compounds [25]. Function f ( c A b ) for Monod kinetics is defined as
f ( c A b ) = k c A b K A + c A b
For Haldane kinetics, one obtains
f ( c A b ) = k c A b K A + c A b + ( c A b ) 2 K i n
The following dimensionless space coordinate in the biofilm was introduced to the mathematical model (1)–(2):
z = x r 0 L b ( t ) [ 0 , 1 ]
where Lb(t) denotes the biofilm thickness variable over time.
After that, the substrate concentration was described by a new function which depends on the dimensionless space coordinate and time:
c A b ( x , t ) c ˜ A b ( z ( x , t ) , t )
In accordance with differential calculus, the derivatives of the substrate concentration with respect to x and t were transformed according to the following relationships:
c A b x = c ˜ A b z z x = 1 L b c ˜ A b z
c A b t = c ˜ A b z z t + c ˜ A b t = ( x r 0 ) L b , t L b 2 c ˜ A b z + c ˜ A b t = z L b , t L b c ˜ A b z + c ˜ A b t
The dynamic changes of a substrate concentration in the biofilm can be, therefore, described by the following partial differential equation (see Appendix A for the derivation):
c ˜ A b t = D e A L b 2 [ 2 c ˜ A b z 2 + c ˜ A b z ( 2 L b ( r 0 + z L b ) + 1 D e A ( z L b ) L b , t ) L b 2 D e A r A b ( c ˜ A b ) ]
The equation of the biofilm thickness dynamics was based on the biomass balance from the paper [26]:
d L b d t = 1 3 ρ b r b 3 r 0 3 r b 2 r B , a v b k d e t L b 3 r b 3 r 0 3 r b 2
where:
r B , a v b = 3 r b 3 r 0 3 r 0 r b x 2 r B b ( c A b ) d x = 3 L b r b 3 r 0 3 0 1 ( r 0 + L b z ) 2 r B b ( c A b ) d z
with the initial condition:
L b ( 0 ) = L b 0

3. Approximate Mathematical Model Based on Laplace-Carson Transform

Numerical simulations were performed with the use of the exact model of biofilm growth (Equation (12) with conditions (2)–(4) and Equation (13) with the condition (15)). The computations were realized using Matlab 2016a. The results proved that the term 1 D e A ( z L b ) L b , t is lower than 2 L b ( r 0 + z L b ) by more than three orders of magnitude. The former term can be therefore neglected. Then, Equation (12) simplifies to:
c ˜ A b t = D e A L b 2 [ 2 c ˜ A b z 2 + 2 L b ( r 0 + z L b ) c ˜ A b z L b 2 D e A r A b ( c ˜ A b ) ]
In order to reduce the number of parameters in the above equation, the variable τ was introduced, which is related to time t according to the relationship:
d τ = D e A L b 2 d t
After introducing variable τ, Equation (16) will transform to:
c ˜ A b τ = 2 c ˜ A b z 2 + 2 L b ( r 0 + L b z ) c ˜ A b z L b 2 D e A r A b ( c ˜ A b )
The following boundary and initial conditions are associated with Equation (18):
c ˜ A b ( 0 , τ ) z = 0
c ˜ A b ( 1 , τ ) = c ˜ A s b
c ˜ A b ( z , 0 ) = c ˜ A 0 b
Equation (18) can be written as:
c ˜ A b τ = 2 c ˜ A b z 2 + 2 L b ( r 0 + L b z ) c ˜ A b z Φ r ˜ A b ( c ˜ A b )
where: Φ = L b 2 k D e A
The forms of the kinetic expressions in Equation (22) were as follows:
  • Monod model:
r ˜ A b ( c ˜ A b ) = 1 w BA c ˜ A b K + c ˜ A b ρ b
  • Haldane model:
r ˜ A b ( c ˜ A b ) = 1 w BA c ˜ A b K + c ˜ A b + ( c ˜ A b ) 2 / K i n ρ b
In order to derive the approximate model, the kinetic expression was linearized using Taylor series expansion:
r ˜ A b ( c ˜ A b ) = r ˜ A b ( c ˜ A s b ) + r ˜ A b ( c ˜ A s b ) c ˜ A b ( c ˜ A b c ˜ A s b )
After introducing Expression (25) into Equation (22), one obtains:
c ˜ A b τ = 2 c ˜ A b z 2 + 2 L b r 0 + L b z c ˜ A b z Φ r ˜ A b ( c ˜ A s b ) + Φ r ˜ A b ( c ˜ A s b ) c ˜ A b ( c ˜ A s b c ˜ A b )
The Laplace–Carson transform was used for the derivation of the approximate model. It is an integral transform defined by the following formula:
Q ( p , x ) = p 0 e p τ ( τ , x ) d τ
It has, historically, been applied in solving various mathematical and physical problems. For example, Kumar and Qureshi [27] used it to obtain an analytical solution for the non-integer order initial value problems with the Caputo operator. Makarov [28] applied it in order to reduce a model of nonstationary flow of a viscoplastic medium. Aggarwal et al. [29] proved that the Laplace–Carson transform can be used for solving system of convolution-type Volterra integro-differential equations of the first kind. In turn, Szukiewicz published several papers describing the application of this transform to the problems of diffusion and reaction in a catalytic pellet [10,30,31]. His studies were the motivation for developing an approximate model of the process occurring in a biofilm.
Equation (26) is converted by the Laplace–Carson transform into:
p C p c ˜ A s b = 2 C z 2 + 2 L b r 0 + L b z C z Φ r ˜ A b ( c ˜ A s b ) + Φ r ˜ A b ( c ˜ A s b ) c ˜ A b ( c ˜ A s b C )
with boundary conditions:
d C ( 0 ) d z = 0
C ( 1 ) = c ˜ A s b
where:
C = p 0 c ˜ A b e p τ d τ
The solution of Equation (28) with boundary conditions (29) was the following:
C = 1 μ 3 ( c ˜ A 0 b p Φ r ˜ A b ( c ˜ A s b ) + Φ r ˜ A b ( c ˜ A s b ) c ˜ A b c ˜ A s b ) + ( L b + r 0 ) ( c ˜ A s b p c ˜ A 0 b p + Φ r ˜ A b ( c ˜ A s b ) ) ( e μ ( z + 1 ) ( L b + r 0 μ ) e μ ( z 1 ) ( L b r 0 μ ) ) μ 2 ( r 0 + L b z ) ( r 0 μ L b + e 2 μ ( L b + r 0 μ ) )
where:
μ = p + Φ r ˜ A b ( c ˜ A s b ) c ˜ A b
The average concentration c ˜ A , a v b was calculated as an integral average for a spherical bioparticle:
c ˜ A , a v b = 3 L b ( r 0 + L b ) 3 r 0 3 0 1 c ˜ A b ( z ) ( r 0 + L b z ) 2 d z
It can be written in the domain of complex numbers as:
C a v = 3 L b ( r 0 + L b ) 3 r 0 3 0 1 C ( p , z ) ( r 0 + L b z ) 2 d z
Equation (32) was substituted to Equation (35). Afterwards, using Matlab’s symbolic toolbox, it was integrated and transformed into the following form:
p C a v p c ˜ A 0 b = Ψ ( p ) ( c ˜ A s b C a v ) Φ r ˜ A b ( c ˜ A s b ) + Φ r ˜ A b ( c ˜ A s b ) c ˜ A b ( c ˜ A s b C a v )
where:
Ψ ( p ) = 3 μ 2 ( L b + r 0 ) ( L b 2 μ cosh ( μ ) L b 2 sinh ( μ ) + r 0 2 μ 2 sinh ( μ ) + L b r 0 μ 2 sinh ( μ ) ) ( 3 L b 3 sinh ( μ ) + 3 L b 2 r 0 sinh ( μ ) 3 L b 3 μ cosh ( μ ) + L b 3 μ 2 sinh ( μ ) 3 r 0 3 μ 2 sinh ( μ ) + 3 r 0 3 μ 3 cosh ( μ ) 3 L b 2 r 0 μ cosh ( μ ) + 3 L b r 0 2 μ 3 cosh ( μ ) + L b 2 r 0 μ 3 cosh ( μ ) 3 L b r 0 2 μ 2 sinh ( μ ) )
The left-hand side of Equation (36) is a transform of the derivative of the average substrate concentration with respect to time, while the right-hand side includes the transform of the driving force ( c A s b C a v ) . Therefore, Equation (21) is a Laplace–Carson transform of the linear driving force (LDF) equation [10].
In order to verify the obtained expression, r0 = 0 was substituted. It was expected that Equation (37) would then simplify to the equation that was obtained by Szukiewicz [10] for a spherical catalytic pellet. As expected, the following result was obtained:
Ψ ( p ) = 3 μ 2 ( μ cosh ( μ ) sinh ( μ ) ) 3 sinh ( μ ) + μ 2 sinh ( μ ) 3 μ cosh ( μ )
where: μ = p + Φ r ˜ A b ( c ˜ A s b ) c ˜ A b
For the determination of the inverse transform of Equation (36), the value p = 0 was substituted, which is equivalent to time τ tending to infinity. The form of the coefficient Ψ in the domain of real numbers depends on the derivative r ˜ A ( c ˜ A b ) c ˜ A s b at the biofilm surface, which can accept positive or negative values, or zero:
  • for r ˜ A b ( c ˜ A b ) c ˜ A s b > 0
Ψ = 3 φ 2 ( L b + r 0 ) ( L b 2 φ cosh ( φ ) L b 2 sinh ( φ ) + r 0 2 μ 2 sinh ( φ ) + L b r 0 μ 2 sinh ( φ ) ) ( 3 L b 3 sinh ( φ ) + 3 L b 2 r 0 sinh ( φ ) 3 L b 3 φ cosh ( φ ) + L b 3 μ 2 sinh ( φ ) 3 r 0 3 φ 2 sinh ( φ ) + 3 r 0 3 φ 3 cosh ( φ ) 3 L b 2 r 0 μ cosh ( φ ) + 3 L b r 0 2 μ 3 cosh ( φ ) + L b 2 r 0 μ 3 cosh ( φ ) 3 L b r 0 2 μ 2 sinh ( φ ) )
where:
φ = Φ r A ( c ˜ A s b ) c ˜ A b
  • for r ˜ A b ( c ˜ A s b ) c ˜ A b = 0
Ψ = 15 ( L b + r 0 ) ( L b 2 + 3 L b r 0 + 3 r 0 2 ) L b 3 + 6 L b 2 r 0 + 15 L b r 0 2 + 15 r 0 3
  • for r ˜ A b ( c ˜ A s b ) c ˜ A b < 0
Ψ = 3 φ 2 ( L b + r 0 ) ( φ L b 2 cos ( φ ) L b 2 sin ( φ ) + φ 2 r 0 2 sin ( φ ) + φ 2 L b r 0 sin ( φ ) ) ( 3 L b 3 sin ( φ ) 3 L b 2 r 0 sin ( φ ) + 3 φ L b 3 cos ( φ ) φ 2 L b 3 sin ( φ ) + 3 φ 2 r 0 3 sin ( φ ) + 3 φ 3 r 0 3 cos ( φ ) + 3 φ L b 2 r 0 cos ( φ ) + 3 φ 3 L b r 0 2 cos ( φ ) + φ 3 L b 2 r 0 cos ( φ ) + 3 φ 2 L b r 0 2 sin ( φ ) )
where:
φ = Φ r ˜ A b ( c ˜ A s b ) c ˜ A b
Applying the inverse Laplace–Carson transform to Equation (36) results in the LDF equation, in the domain of real numbers, as follows:
d c A , a v b d τ = Ψ ( c A s b c A , a v b ) Φ r ˜ A ( c A , a v b ) + Φ r ˜ A b ( c A s b ) c A b ( c A s b c A , a v b )
Or, by substituting time t:
d c A , a v b d t = D e A L b 2 [ Ψ ( c A s b c A , a v b ) Φ r ˜ A ( c A , a v b ) + Φ r ˜ A b ( c A s ) c A b ( c A s b c A , a v b ) ]
with the initial condition:
c A , a v b ( 0 ) = c A 0 b
Based on Equation (25), it can be written as follows:
r ˜ A b ( c A , a v b ) r ˜ A b ( c A s b ) r ˜ A b ( c A s b ) c A b ( c A s b c A , a v b )
After using Equation (45), the LDF Equation (43) transformed into the following form [10]:
d c A , a v b d t = D e A L b 2 [ Ψ ( c A s b c A , a v b ) Φ r ˜ A b ( c A , a v b ) ]
with the initial condition (44).
The model given by Equation (43) with initial condition (44) is linear, whereas the model given by Equation (46) with initial condition (44) is nonlinear.
It is convenient to use approximate models in a dimensionless form. To this end, a dimensionless substrate concentration was used:
η = c ˜ A b c A c
The linear approximate model in a dimensionless form can be presented as follows:
d η a v d t = 1 c A c d c A c d t η + D e A L b 2 Ψ ( η s η a v ) D e A L b 2 Φ ¯ r ˜ A ( η a v ) + D e A L b 2 Φ ¯ r ˜ A ( η s ) η ( η s η a v )
where: Φ ¯ = L b 2 k ρ b D e A w BA c A c , with the initial condition:
η a v ( 0 ) = η 0
While the nonlinear one is expressed as:
d η a v d t = 1 c A c d c A c d t η a v + D e A L b 2 Ψ ( η s η a v ) D e A L b 2 Φ ¯ r ˜ A ( η a v )
with the initial condition (49).
The form of kinetic expressions in a dimensionless form is as follows:
  • Monod model:
r ˜ A ( η ) = η K ¯ + η
  • Haldane model:
r ˜ A ( η ) = η K ¯ + η + η 2 / K ¯ i n
where: K ¯ = K A c A c , K ¯ i n = K i n c A c .
It is assumed that the average biomass growth rate can be approximated by using the following expression:
r B , a v b r B b ( c A , a v b )
In order to evaluate the accuracy of this approximation, dynamical simulations of the biofilm growth were carried out using the exact model and the average biomass growth rate was calculated using the exact equation—i.e., (53). Matlab 2016a was used for this purpose. The results of the comparison are illustrated in Figure 1 for two values of the bulk liquid substrate concentration for Monod kinetics (Figure 1a) and Haldane kinetics (Figure 1b). It can be seen that the accuracy decreases with the increase in the value of parameter Φ ¯ and with the increase in c A c . In each case, a very good approximation was obtained for Φ ¯ < 2 .
Applying the relationship described in Equation (53) to Equation (13) resulted in:
d L b d t = 1 3 ρ b r b 3 r 0 3 r b 2 r B b ( c A , a v b ) k d e t L b 3 r b 3 r 0 3 r b 2
with the initial condition:
L b ( 0 ) = L b 0
The approximate model is a system of ordinary differential equations. The linear version consists of Equation (48) with boundary condition (49) and Equation (54) with boundary condition (55). The nonlinear version consists of Equation (50) with boundary condition (49) and Equation (54) with boundary condition (55). The model that was derived using the Laplace–Carson transform was used in the comparisons that are presented in the further parts of the study and will be abbreviated to AM1.

4. Approximate Model Based on Pseudo-Steady State Approximation

The processes of diffusion and reaction are significantly faster than the growth and detachment of a biofilm, thus the distribution of the limiting substrate concentration in the biofilm is close to a steady-state profile, even when the biofilm thickness is changing [3,8,32].
A stationary profile of the substrate concentration was obtained by solving its mass balance, i.e., Equation (26), after equating the time derivative to zero. It was proposed, in this study, to treat the biofilm as though it were flat. As a result of this, a simpler analytical expression was obtained that was related to the lower number of parameters. In order to evaluate the accuracy of such an approach, the exact biofilm model was solved assuming flat and spherical geometry. The average biomass growth rate, (Equation (14)) was calculated and compared for a range of inert particle radius and biofilm thickness, what is presented in Figure 2. It can be seen that the relative difference between obtained values does not exceed 1.5%.
The dimensionless form of the linearized substrate mass balance in the flat biofilm was expressed as:
0 = 2 η z 2 Φ ¯ r ˜ A ( η )
with boundary conditions:
η ( 0 ) z = 0 ,   η ( 1 ) = η s
The analytical solution of the linearized form of Equation (56) was:
η ( z ) = r ˜ A ( η s ) η r ˜ A ( η s ) r ˜ A ( η s ) η + cosh ( z Φ ¯ r ˜ A ( η s ) η ) ( r ˜ A ( η s ) r ˜ A ( η s ) η + r ˜ A ( η s ) η η s ) r ˜ A ( η s ) η cosh ( Φ ¯ r ˜ A ( η s ) η )
Equation (59), describing the biofilm dynamics, was derived based on the relationship that connects the overall substrate uptake rate in the biofilm and the substrate mass flux into the biofilm:
V b r A , a v b = S b D e A d c A b ( L b ) d x
Equation (59) can be transformed to:
r A , a v b = 3 r b 2 ( r b 2 r 0 3 ) D e A c A c L b d η ( 1 ) d z
The derivative at the biofilm surface (i.e., for z = 1) was obtained from Equation (58):
d η ( 1 ) d z = tanh ( Φ ¯ r ˜ A ( η s ) η ) Φ ¯ r ˜ A ( η s ) η ( r ˜ A ( η s ) r ˜ A ( η s ) η + r ˜ A ( η s ) η η s ) r ˜ A ( η s ) η
The average biomass growth rate can be calculated by its relationship with the substrate uptake rate, according to:
r B , a v b = w BA r A , a v b = w BA 3 r b 2 ( r b 2 r 0 3 ) D e A c A c L b d η ( 1 ) d z
This approximate model, including Equations (54), (55), (61) and (62), will be abbreviated, in the further parts of the present study, to AM2-1.
The derivative d η ( 1 ) d z can be determined in different ways, which will influence the accuracy of the approximate model. In this study, it was proposed to find this derivative analytically through the finite difference method for one internal node. For the Monod kinetic model, the following algebraic equation was obtained:
η 0 2 η 0.5 + η s ( Δ z ) 2 Φ ¯ η 0.5 K ¯ + η 0.5 = 0
where η 0 = 4 η η s 3 and Δz = 0.5.
Equation (63) had two solutions, one of which is positive. It can be expressed as:
η 0.5 = 8 8 K ¯ 3 Φ ¯ + 9 Φ ¯ 2 48 Φ ¯ + 64 + 48 Φ ¯ K ¯ + 128 K ¯ + 64 K ¯ 2 16
The application of the differential quotient of the second order resulted in:
d η ( 1 ) d z = 8 3 8 8 K ¯ 3 Φ ¯ + ( 9 Φ ¯ 2 48 Φ ¯ + 64 ) + 48 c A c Φ ¯ K ¯ + 128 K ¯ + 64 K ¯ 2 6
The above derivative was used to obtain the average biomass growth rate according to Equation (62). This approximate model, involving Equations (54), (55), (62) and (65), will be abbreviated, in the further parts of the present study, to AM2-2.
Another way to determine the derivative d η ( 1 ) d z , which is the original aim of this study, is based on a two-step application of the finite difference method. Namely, in the first step, the η0.5 is determined, as above. In the second step, the same method is used to determine η0.75, based on the previously found value of η0.5. Afterwards, the backward difference quotient of the second order can be used to find the derivative, obtaining:
d η ( 1 ) d z = 32 + 32 K ¯ A 2 + K ¯ ( 48 A 1 + 640 K ¯ ) + A 3 + Φ ¯ 8
where:
A 1 = 9 Φ ¯ 2 48 Φ ¯ + 64 + 48 Φ ¯ K ¯ + 128 K ¯ + 64 K ¯ 2
A 2 = 640 240 Φ ¯ + 25 Φ ¯ 2
A 3 = A 1 ( 48 8 Φ ¯ ) + K ¯ ( 1280 16 Φ ¯ )
This approximate model, involving Equations (54), (55), (62) and (66), will be abbreviated, in the further parts of the present study, to AM2-3.
A similar derivation can be performed for the Haldane kinetic model. If the procedure that was previously abbreviated to AM2-2 is used, then the following expression is obtained:
d η ( 1 ) d z = 8 3 8 x 3
where:
x = { q + [ q 2 + ( r p 2 ) 3 ] 1 / 2 } 1 / 3 + { q [ q 2 + ( r p 2 ) 3 ] 1 / 2 } 1 / 3 + p
p = b 3 a ,   q = p 3 + ( b c 3 a d ) 6 a 2 ,   r = c 3 a
and:
a = 1 , b = K ¯ i n 1 , c = 3 / 8 Φ ¯ K ¯ i n + K ¯ K ¯ i n K ¯ i n , d = K ¯ K ¯ i n .
The cubic root f 3 in Equation (68) denotes the real cube root of f, if f is real. If f is not real, it is then the cube root with the maximum real part.
If the procedure that has been previously referred to as AM2-3 is used, then one gets:
d η ( 1 ) d z = 2 η 0.5 8 x + 6
where: x, p, q and r are defined by Equation (68) and:
a = 1 ,   b = ( η 0.5 2 K ¯ + 1 ) / 2 ,   c = ( 32 K ¯ K ¯ i n 16 K ¯ i n 16 η 0.5 K ¯ i n + Φ ¯ K ¯ i n ) / 32 ,   d = ( η 0.5 K ¯ K ¯ i n ) / 2 ( K ¯ K ¯ i n ) / 2
The value η0.5 in the Equation (69) was determined in the first step of the procedure. It was expressed as a real solution of a third-order polynomial, i.e.,
η 0.5 = { q + [ q 2 + ( r p 2 ) 3 ] 1 / 2 } 1 / 3 + { q [ q 2 + ( r p 2 ) 3 ] 1 / 2 } 1 / 3 + p
where: p, q and r are defined by Equation (68) and:
a = 1 ,   b = K ¯ i n 1 ,   c = 3 8 Φ ¯ K ¯ i n + K ¯ K ¯ i n K ¯ i n ,   d = K ¯ K ¯ i n .

5. Accuracy and Efficiency Evaluation of the Approximate Model Based on the Laplace-Carson Transform

Calculations were performed for two of the microbiological processes that are of large technological significance: the oxidation of nitrites by nitrifying bacteria and the phenol degradation that is performed by Pseudomonas putida. The former follows Monod kinetics (Equation (23)), whereas the latter follows Haldane kinetics (Equation (24)). The kinetic parameters are presented in Table 1 and Table 2, respectively. A stepwise change of the substrate concentration at the biofilm surface c A s b = c A c = 0.1 kg / m 3 and a constant biofilm thickness were used for the purpose of the evaluation. The method of lines was used for solving the exact model (see Appendix B).
Figure 3 presents the relationship, ηav(τ), that was obtained according to the exact model and the approximate models known as AM1 (i.e., the linear one—Equations (48) and (49)) and the nonlinear one—Equations (50) and (49). Figure 3a illustrates the results that were obtained for the oxidation of nitrites, while Figure 3b shows those that were obtained for the phenol degradation. The results that were obtained indicate that:
  • The accuracy of the approximate models decreased with the increase in Φ ¯ ;
  • The nonlinear approximate model was more accurate than the linear one;
  • The differences between the approximate models and the accurate model decreased with time.
The above observations are in agreement with those presented by Szukiewicz [10].
The proposed approximate mathematical models, known as AM1, were evaluated with regard to their computational efficiency. Matlab 2016a was used for this purpose. The execution times of the computer programs using the exact model and the approximate models were compared. The exact model was solved, as previously explained, by the method of lines (MOL). Two integration algorithms were used in all of the programs. The first one was the Dormand–Prince (4/5) algorithm, which is an explicit method that is used for solving non-stiff and moderately stiff differential equations [34]. The second one was Gear’s algorithm, which is commonly used for stiff problems [26,35,36]. The results of the comparison are shown in Table 3. The values of the execution times were normalized through the process of dividing by the value that was obtained for the exact model and the explicit integration algorithm. The application of the implicit algorithm, i.e., Gear’s algorithm, significantly increased the performance of the exact model. This suggests that the system of equations that were obtained by the method of lines was stiff. In order to verify this hypothesis, the stiffness ratio was calculated, according to the formula:
S R = max [ Re | λ i | ] min [ Re | λ i | ]
In Equation (71), λi represents the eigenvalues of the Jacobi matrix of the right hand sides of the system of the equations that was considered. If the stiffness ratio (SR) is less than 100, then the system of differential equations is not regarded to be stiff [37]. It can be seen, in Figure 4, that the stiffness ratio was over 1000 for the whole range of dimensionless time.
It can be seen, from Table 3, that when the explicit algorithm was used for the integration, the computations that used the approximate models were about 20–30 times faster than those that used the exact one. This makes it advantageous for engineering purposes.

6. Application of Approximate Models to Conditions of the Dynamical Growth of Biofilm

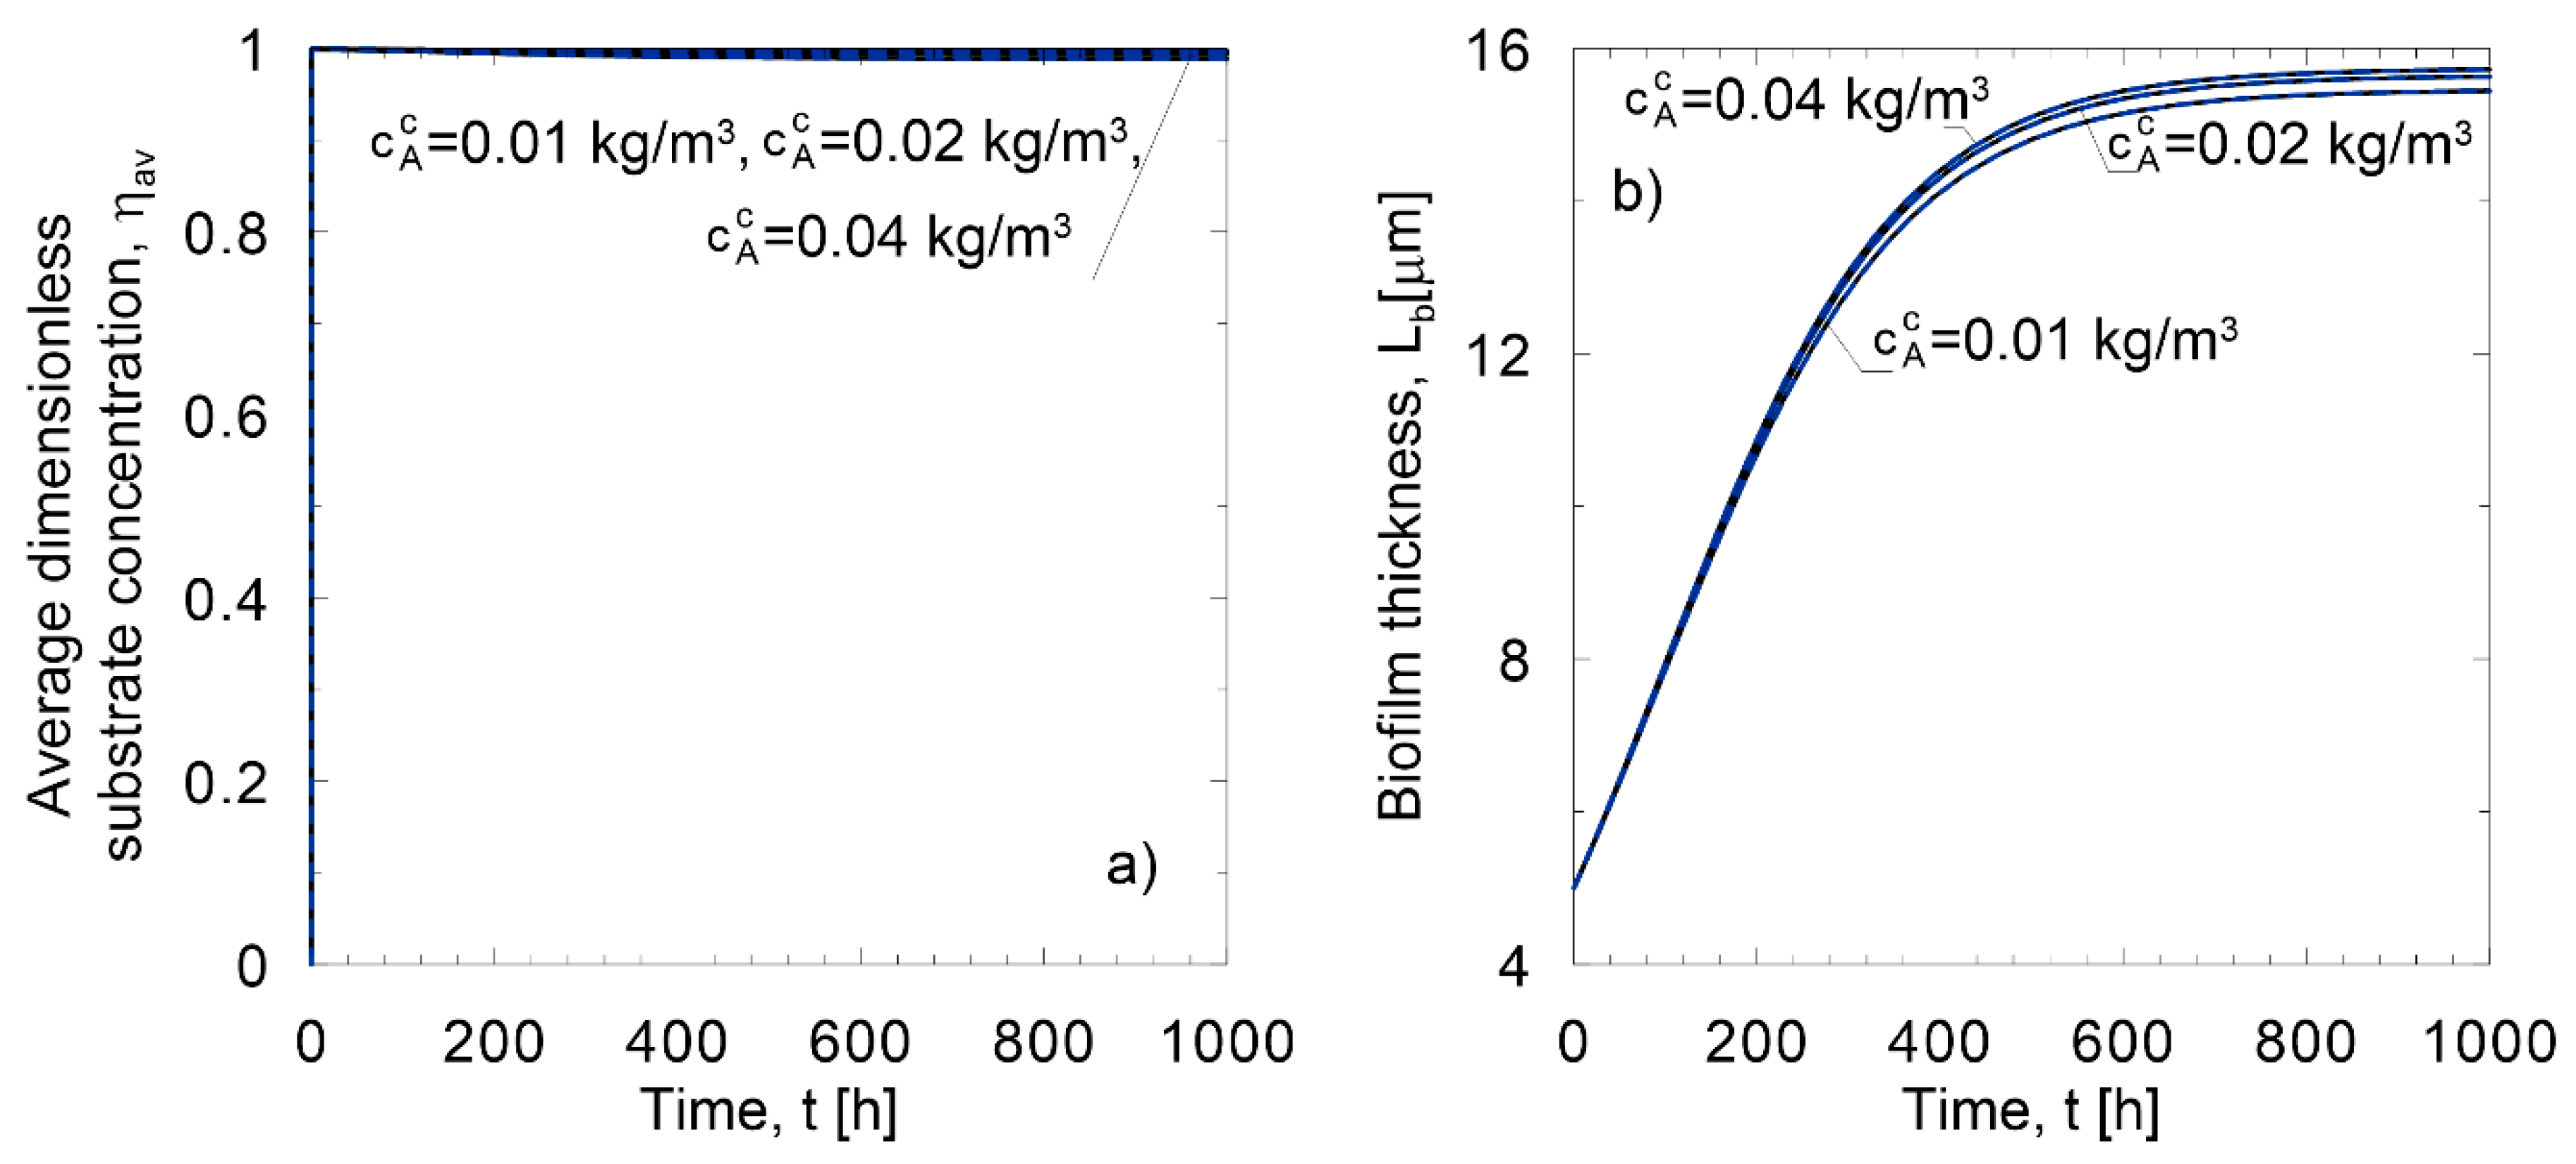
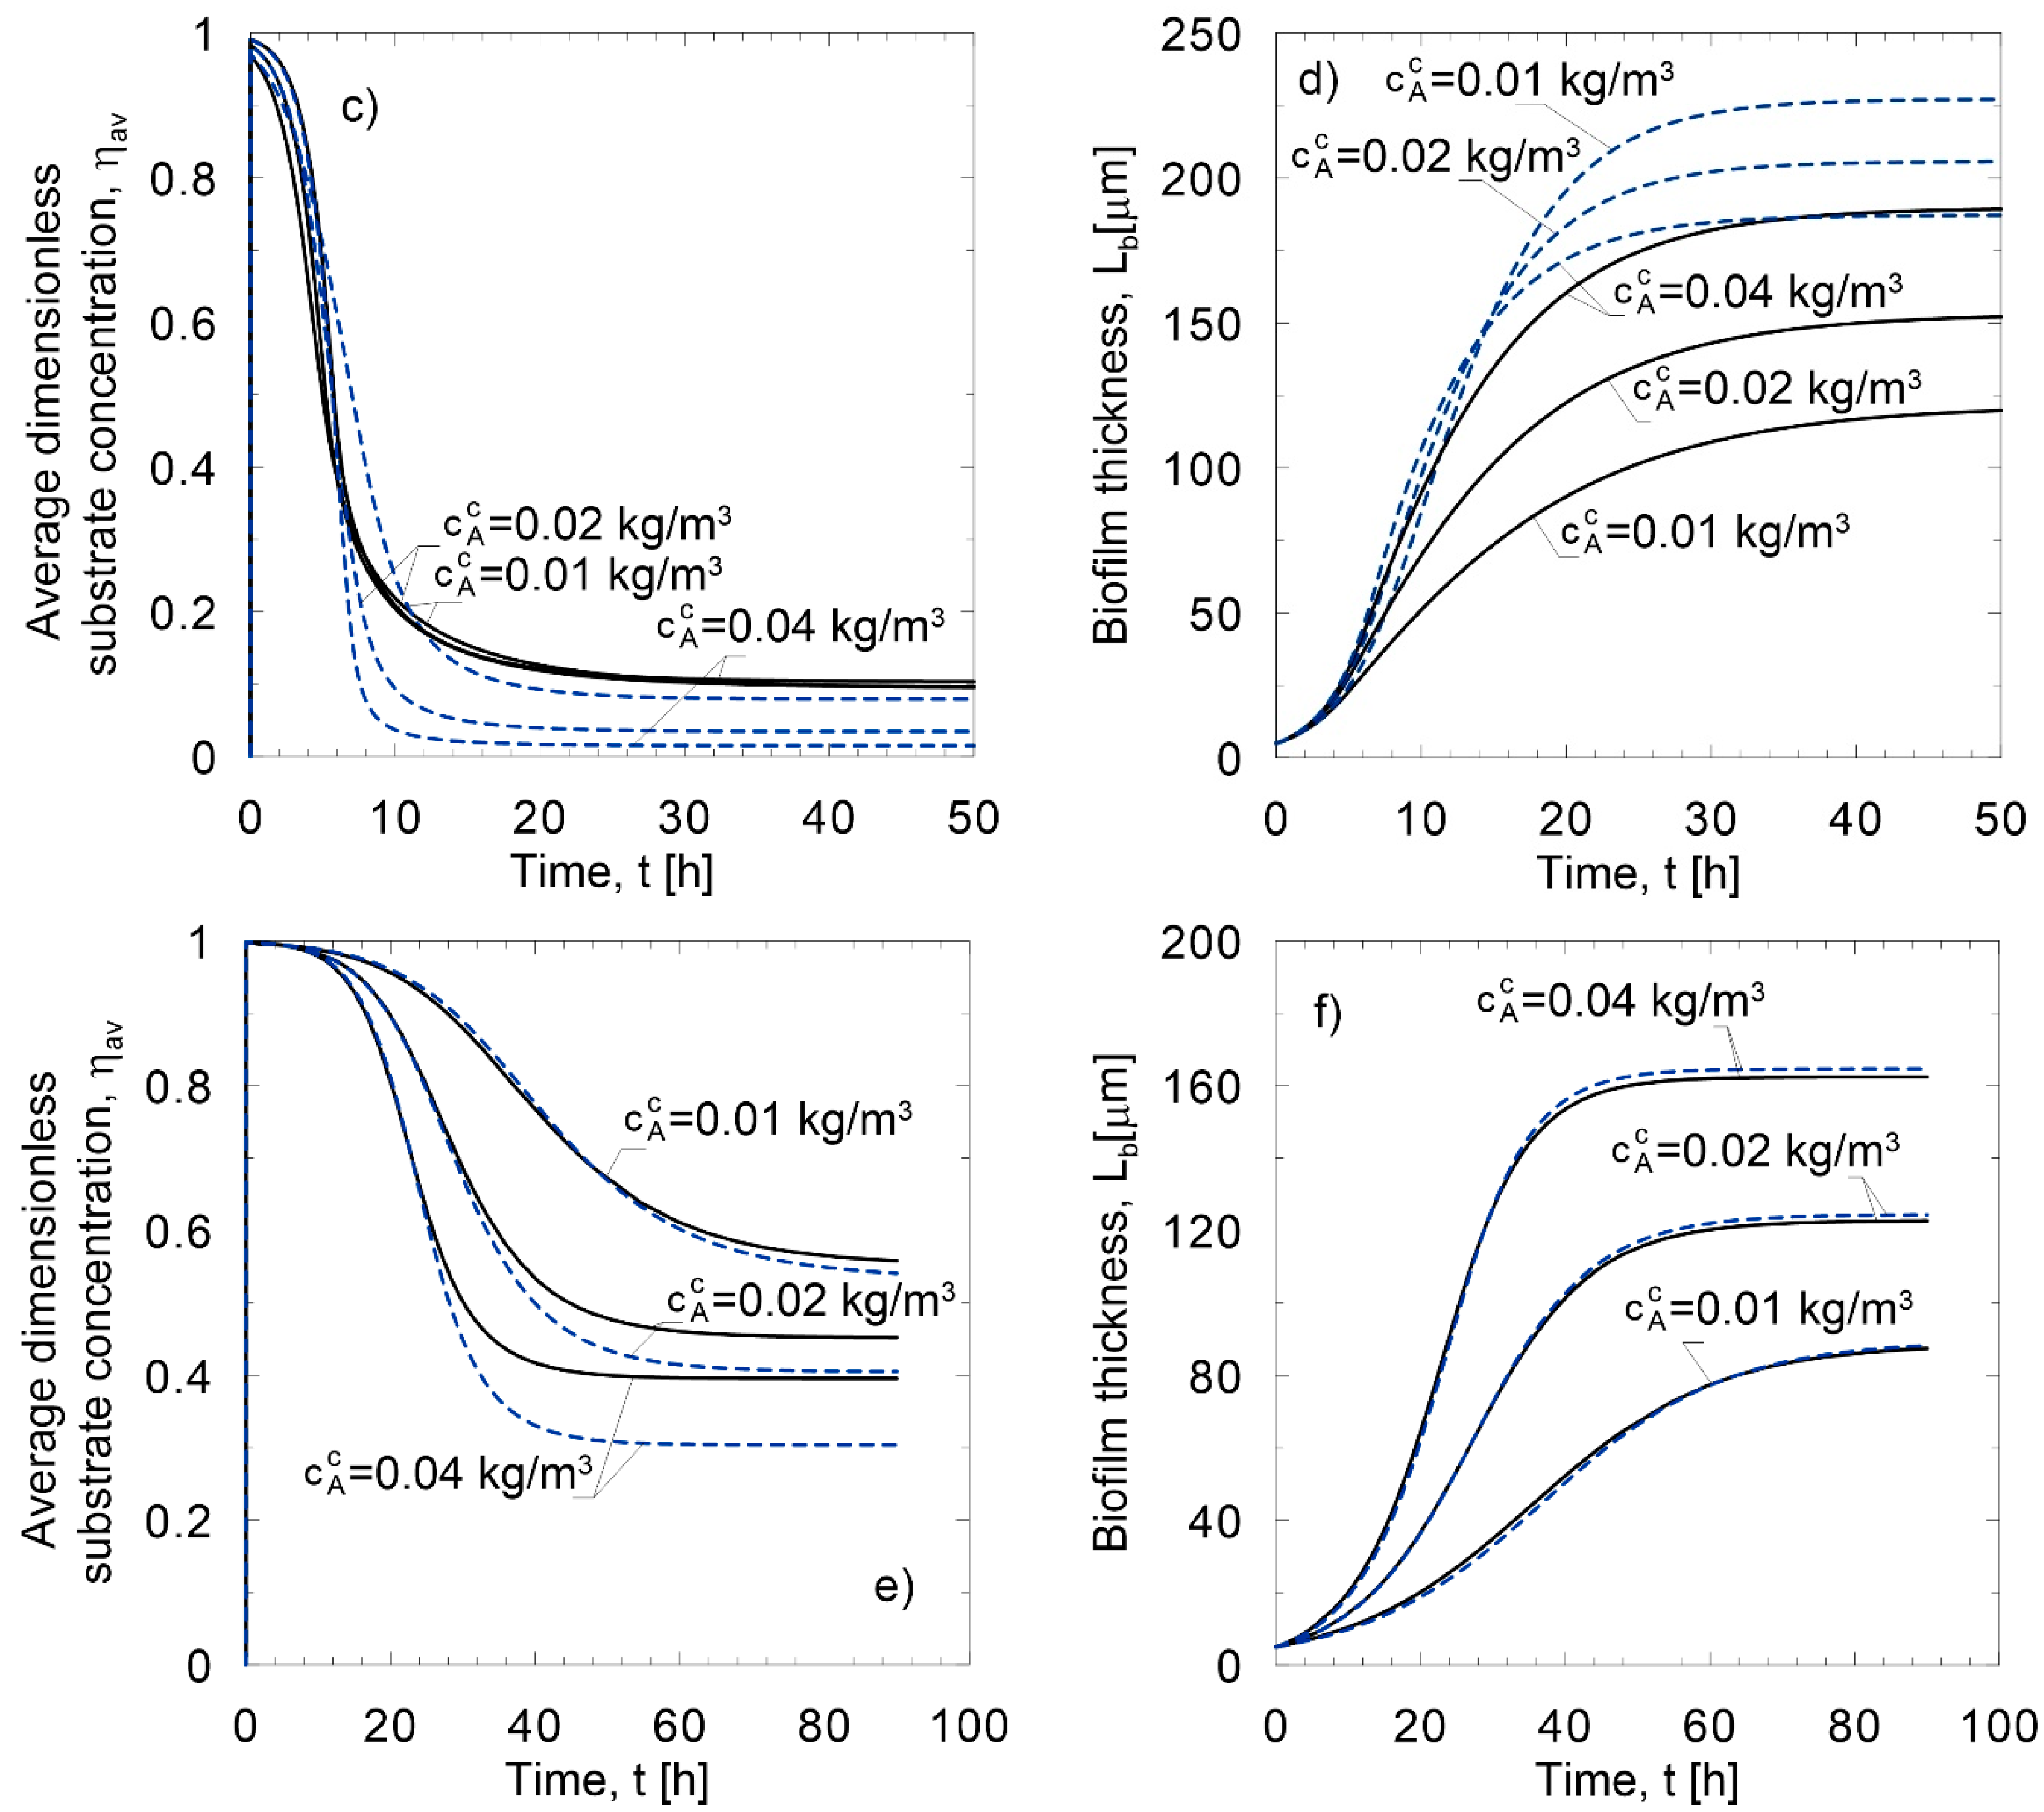
Figure 5 presents the results of the dynamical simulations of the biofilm growth that were obtained with the use of the exact model and the approximate models AM1 for three different values of the substrate concentration in bulk liquid. Figure 5a,b illustrate the average substrate concentration in the biofilm and biofilm thickness that were obtained for the process of nitrite oxidation that was performed by the nitrifying bacteria. It can be seen that very low values of biofilm thicknesses were obtained, a result which arises from the low value of the maximum specific growth rate of this process. Due to low internal mass transfer resistances, excellent accuracy of the approximate model was obtained. Figure 5c,d present the results that were obtained from the glucose utilization by Pseudomonas aeruginosa bacteria (the kinetic parameters of which are shown in Table 4). This process follows Monod kinetics, so too does the nitrite oxidation process; however, the maximum specific growth rate was over 50 times greater. Significantly larger biofilm thicknesses were obtained for this than for the nitrite oxidation. The values of parameter Φ ¯ at a steady-state condition (i.e., for a sufficiently long time) equal Φ ¯ = 70.1 for c A c = 0.01 kg / m 3 , Φ ¯ = 56.5 for c A c = 0.02 kg / m 3 and Φ ¯ = 43.7 for c A c = 0.04 kg / m 3 . Due to the very large internal mass transfer resistances, the accuracy of the approximate model AM1 was significantly lower than that of the nitrite oxidation. The values of Φ ¯ considerably exceeded the ones for which the distributions of the dimensionless substrate concentration in biofilm were obtained with good accuracy (see Figure 3). Figure 5d,e show the results that were obtained for phenol degradation by Pseudomonas putida. In this process, good accuracy was obtained for the smaller values of the substrate concentration in the liquid. The values of parameter Φ ¯ at a steady-state condition were significantly lower than those of the glucose utilization process, equaling Φ ¯ = 9.76 for c A c = 0.01 kg / m 3 , Φ ¯ = 9.58 for c A c = 0.02 kg / m 3 and Φ ¯ = 8.40 for c A c = 0.04 kg / m 3 . The lower values of this parameter were related to the biokinetic parameters. The phenol degradation was characterized by a smaller value of the specific growth rate and a larger value of the growth yield coefficient than glucose utilization.
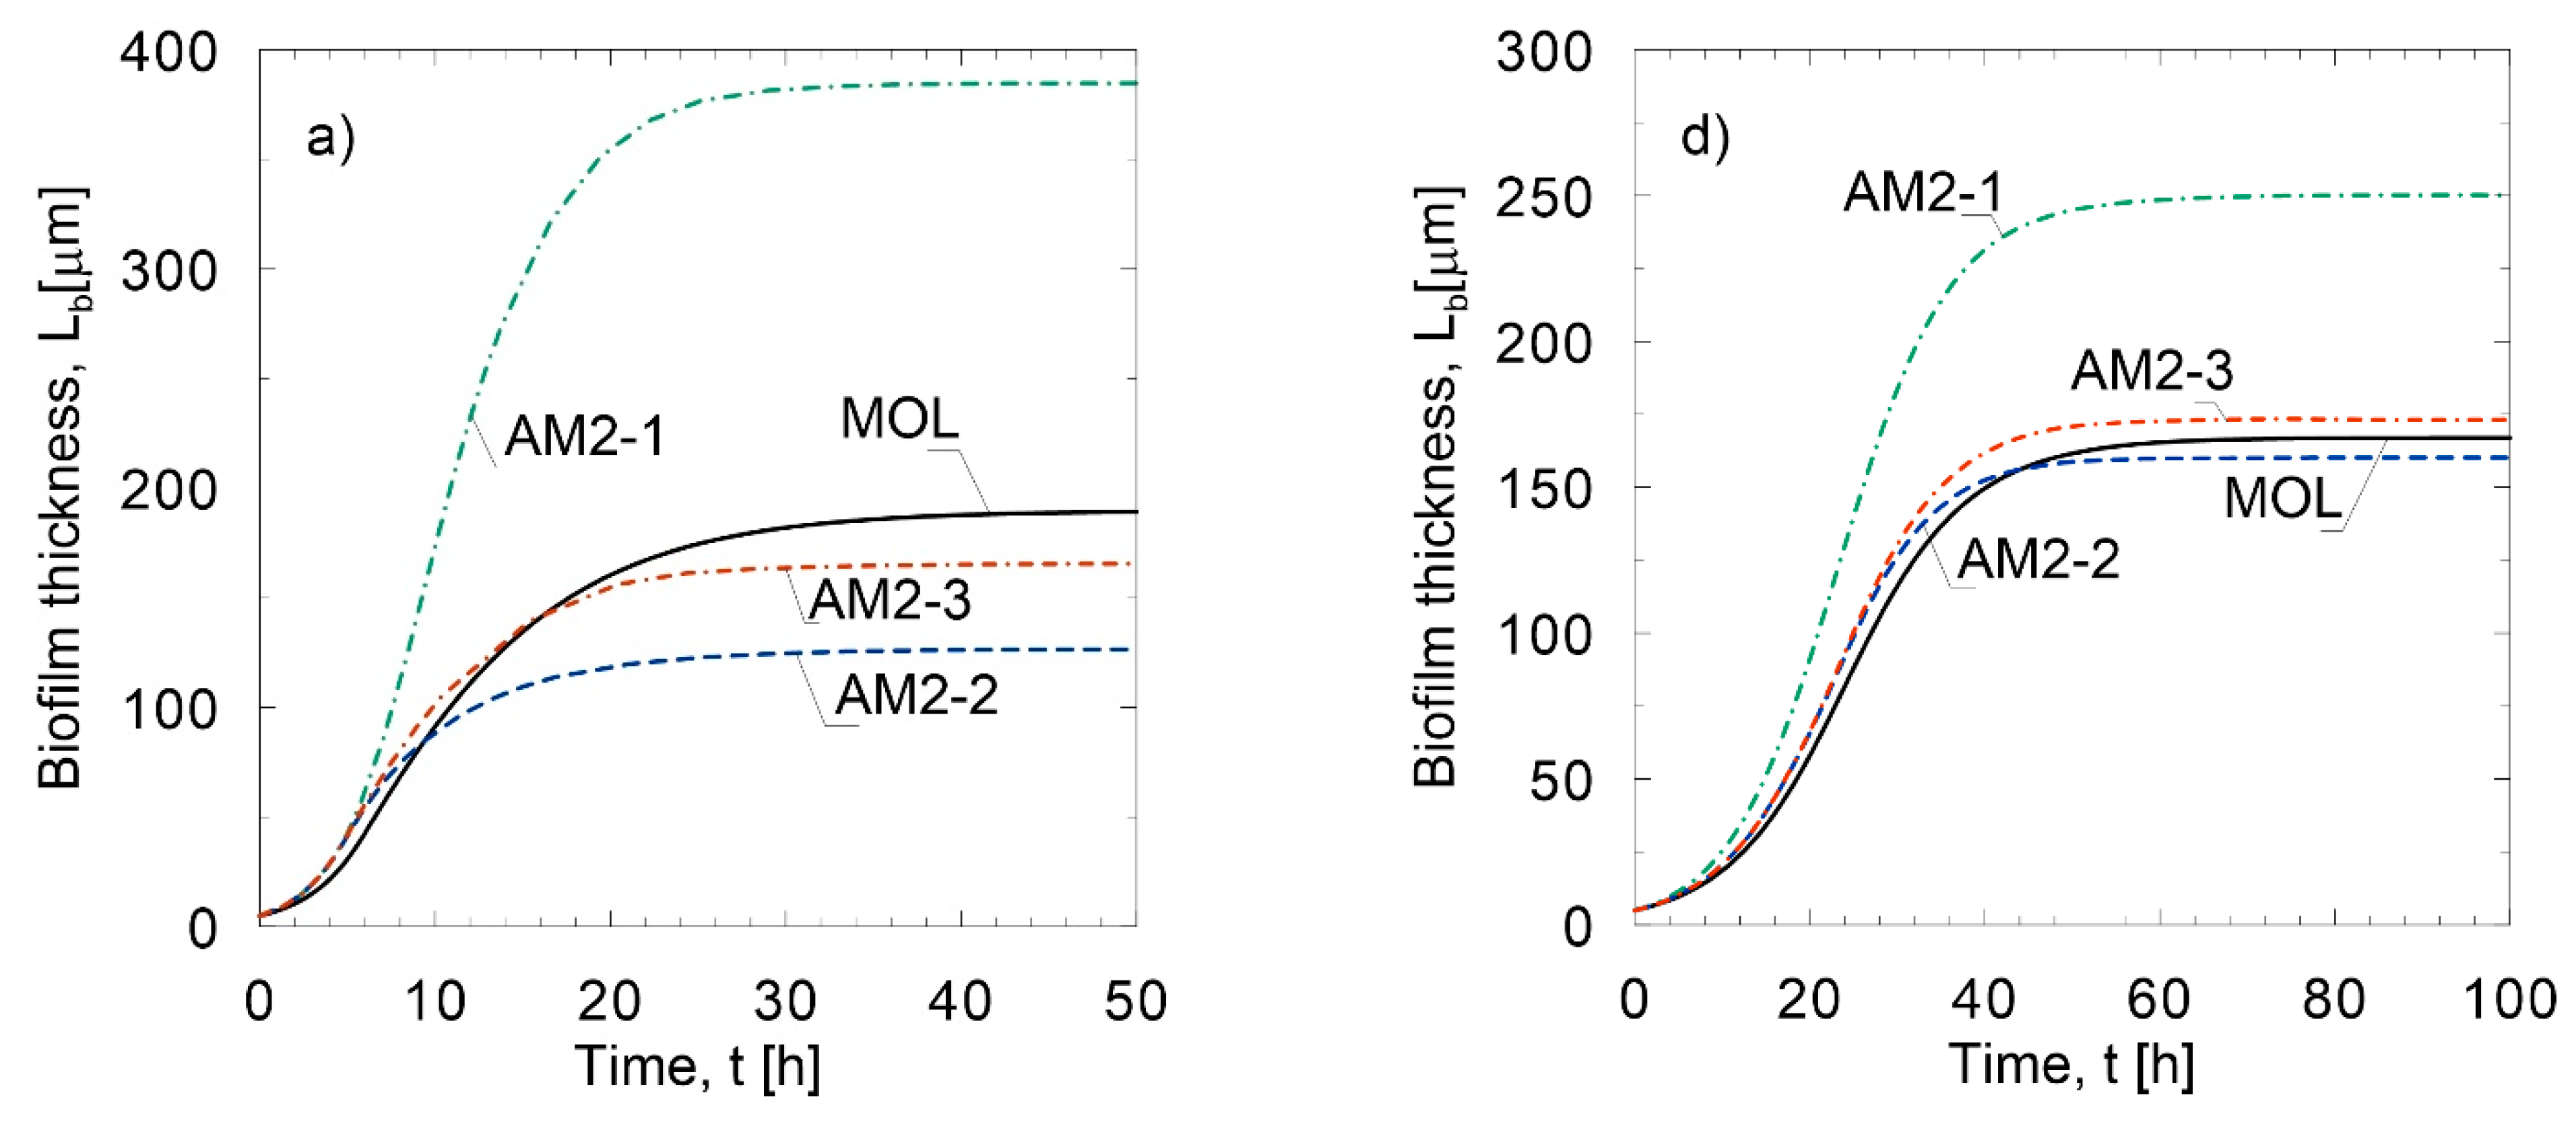
Figure 6 presents the results that were obtained with the use of the AM2 models and the results that were obtained with the use of MOL, for comparison. The glucose utilization (Figure 6a–c) and phenol degradation (Figure 6d–f), with different values of substrate concentration in the liquid, were taken into consideration. It can be seen that the highest accuracy for both processes was obtained with the AM2-3 model, which makes it suitable for modeling microbiological processes following various kinetic models.
Abbas and Eberl [39] derived an analytical approximate model of a microbiological process in a biofilm by using an original method that was based on the homotopy analysis method. The obtained substrate profile in the biofilm can be expressed as:
c A b ( z ) = c A c + ρ b k w BA D e A L b 2 ( z 2 1 ) 2 c A c K + c A c
The above model was used afterwards by the quoted authors in order to determine the diffusive flux into a biofilm and to obtain the equation of the biofilm dynamics. It can be presented in the following way:
d L b d t = k c A c L b K + c A c k d e t L b 2
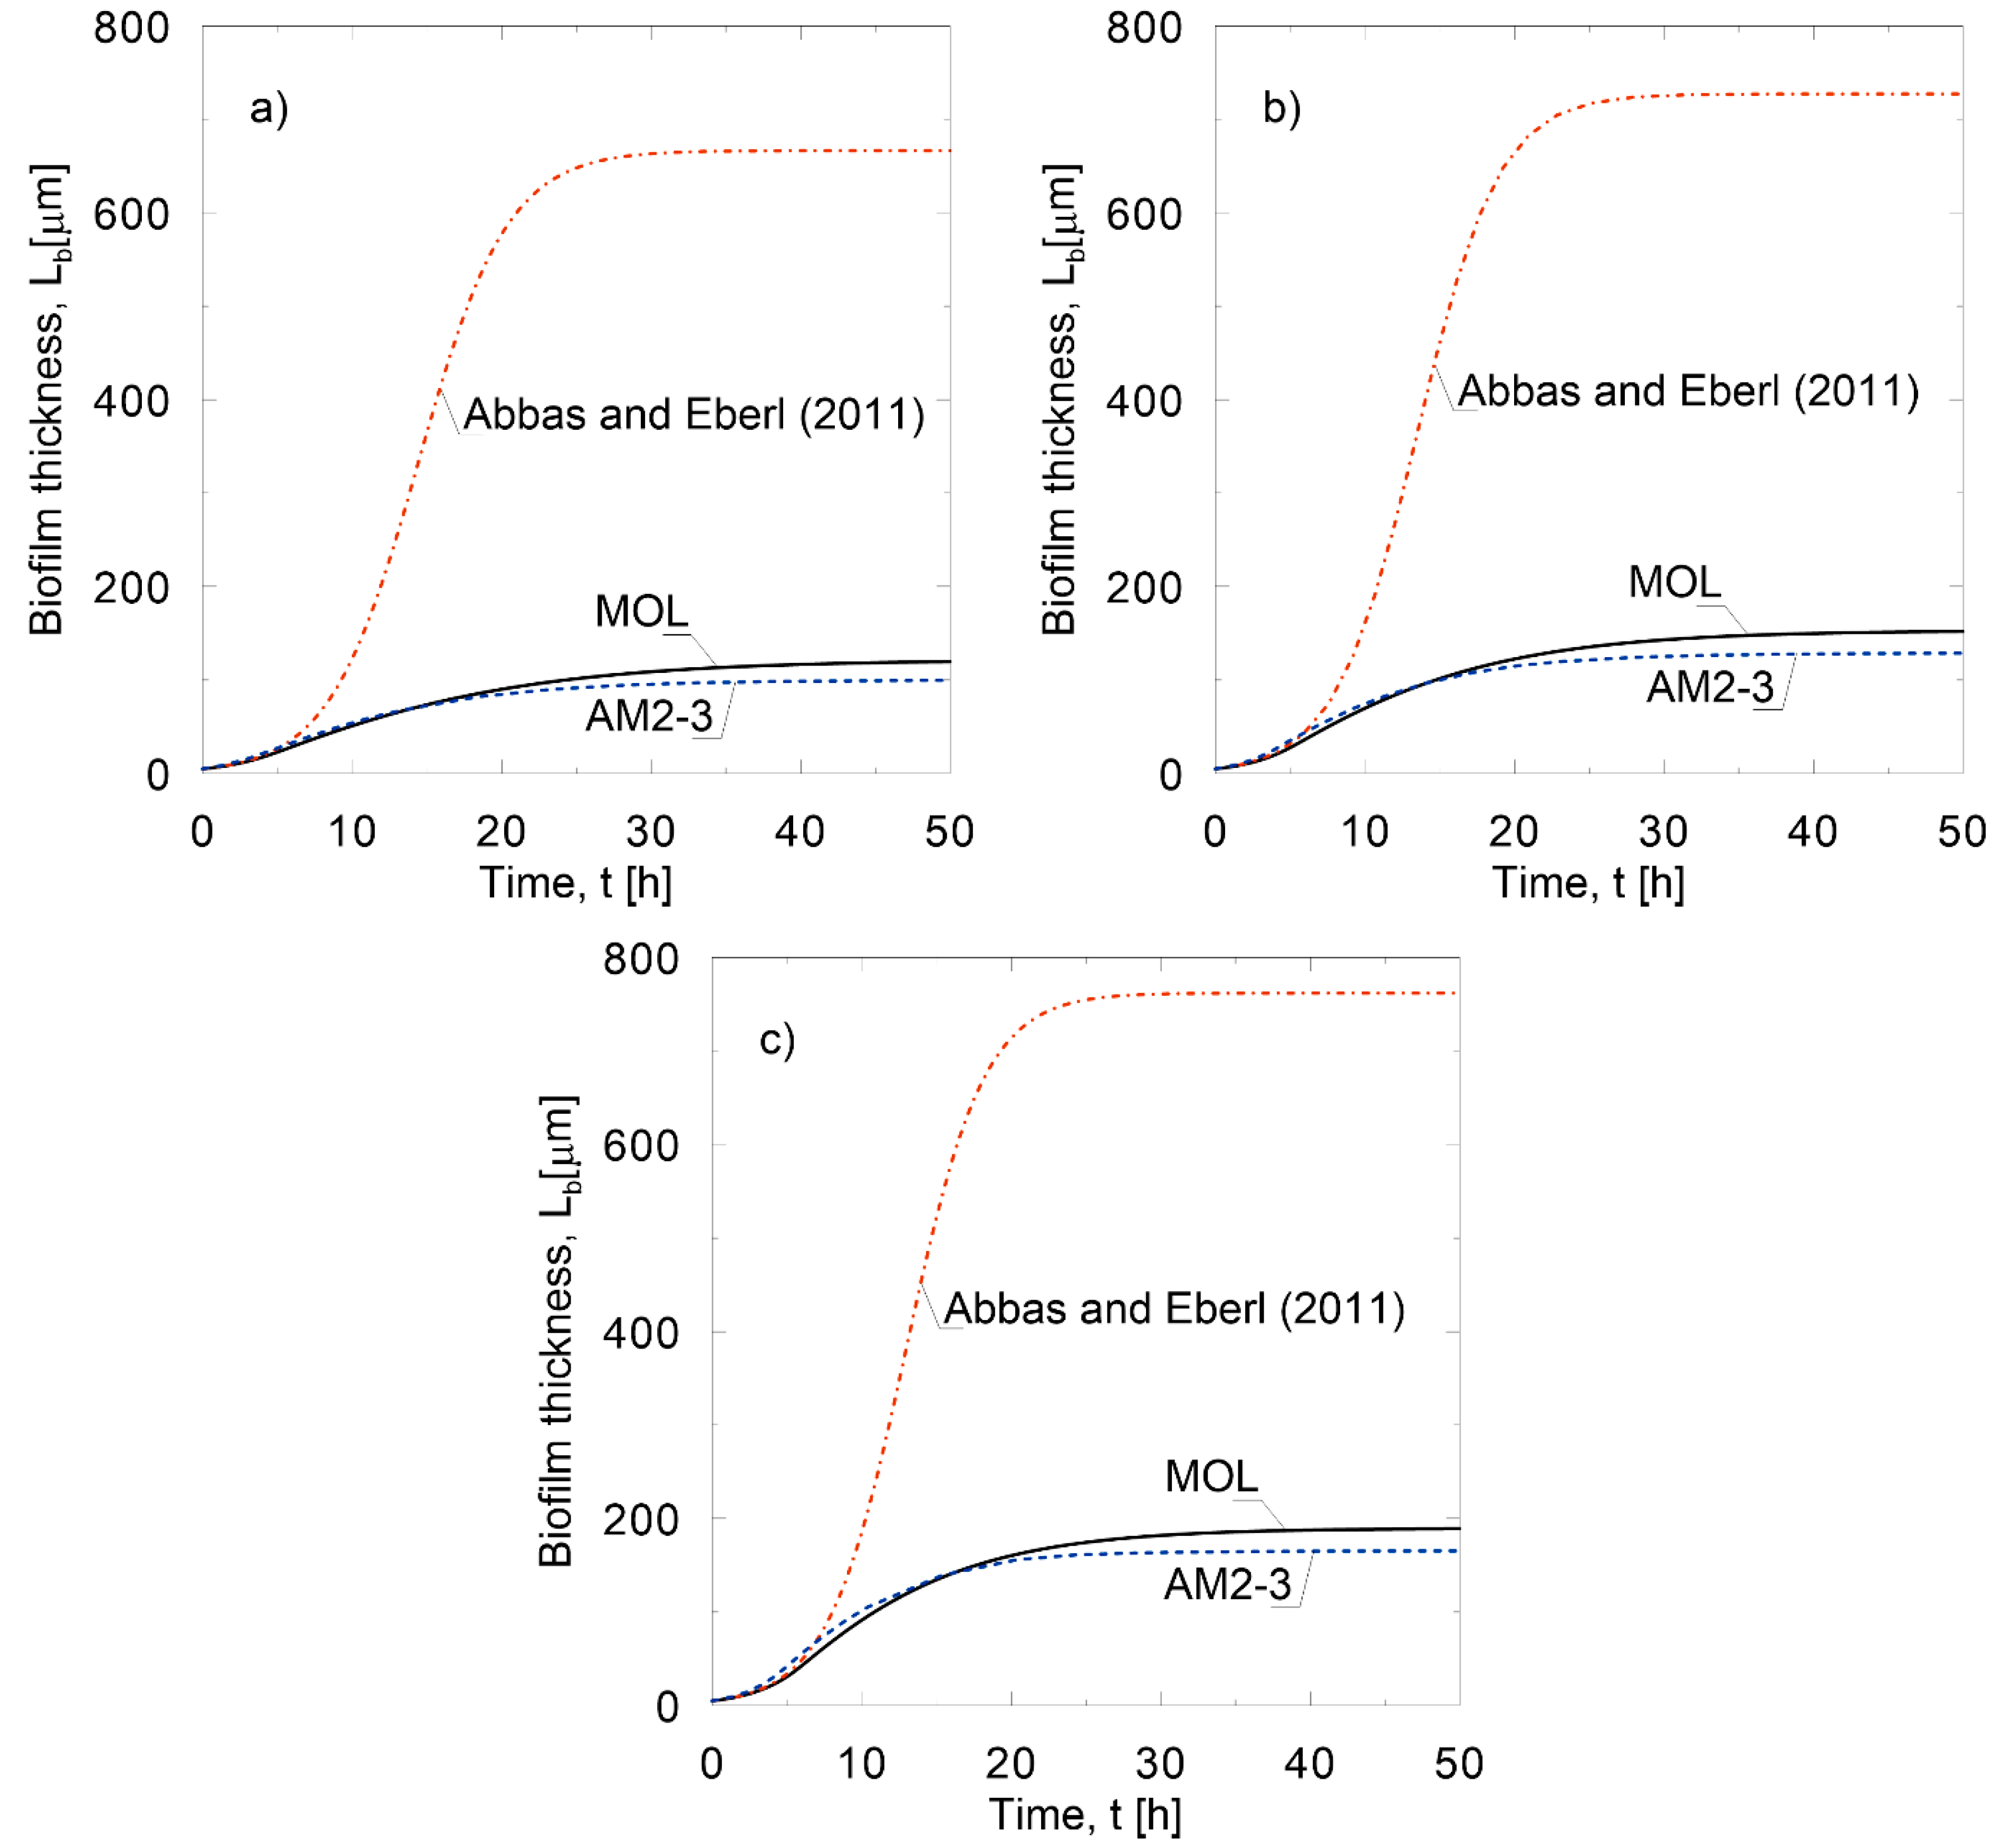
The disadvantage of the above model is that it can only be used for Monod kinetics and for flat biofilm geometry. The simulations of the biofilm growth in the present study were performed using the method of lines, model of Abbas and Eberl and AM2-3. The dynamical changes of the biofilm thickness are presented in Figure 7. The low accuracy of the model that was formulated by Abbas and Eberl was caused by the large internal mass transfer resistances that are present in the biofilm. It was shown in a previous study [13] that solutions that are obtained using the homotopy analysis method require a very large number of terms in the approximate series in order to achieve acceptable accuracy. The approximate series in the solution that was formulated by Abbas and Eberl takes into account only two terms. It can be seen that a significantly higher level of accuracy can be obtained by using the model AM2-3 that is proposed in this study.

7. Conclusions

This paper presents original approximate models for the dynamics of the microbiological processes that occur in a biofilm that is formed on fine spherical particles. The model that was based on the Laplace–Carson transform can be used for the modeling of processes following any single-substrate kinetics. Good accuracy of the model was obtained when it was used for low and internal mass transfer resistances. However, it could not be applied to thick biofilms that are characterized by large internal mass transfer resistances. It was shown that, for such conditions, significantly higher accuracy was obtained with the use of the proposed models, based on the concept of the pseudo-stationary substrate concentration profile in the biofilm.
The advantage of the dynamical biofilm growth model that is based on the pseudo-stationary concept is that it can be modified by using any approximate analytical solution of stationary substrate concentration profile. The approach that has been presented in this study was compared with a previously published dynamical biofilm model. It was shown that significantly higher accuracy was obtained by using the proposed model.
The application of the approximate models simplifies the computations significantly and eliminates the stiffness from the exact model, solved by the method of lines. These models can be used for the modeling and analysis of microbiological processes and for the design of automatic control systems.

Author Contributions

Conceptualization, S.S. and M.C.-S.; methodology, S.S. and M.C.-S.; software, S.S. and M.C.-S.; validation, S.S. and M.C.-S.; investigation, S.S. and M.C.-S.; writing—original draft preparation, S.S. and M.C.-S.; writing—review and editing, S.S. and M.C.-S.; visualization, S.S. and M.C.-S. All authors have read and agreed to the published version of the manuscript.

Funding

Not applicable.

Institutional Review Board Statement

Not applicable.

Informed Consent Statement

Not applicable.

Data Availability Statement

Not applicable.

Conflicts of Interest

The authors declare no conflict of interest.

Abbreviations

CLaplace–Carson transform of limiting substrate concentration in the biofilm
c A b ,   c ˜ A b mass concentration of limiting substrate in the biofilm (kg∙m−3)
c A c mass concentration of limiting substrate in the liquid phase (kg∙m−3)
DeAeffective diffusion coefficient in biofilm (m2∙h−1)
kmaximum specific growth rate (h−1)
KAsaturation constant in kinetic equation (kg∙m−3)
kdetdetachment rate coefficient (m−1∙h−1)
K ¯ dimensionless saturation constant in kinetic equation
Kininhibition constant (kg∙m−3)
K ¯ i n dimensionless inhibition constant in kinetic equation
Lbthickness of the biofilm (m)
L b , t derivative of thickness of the biofilm with respect to time
pcomplex variable
r A ,   r ˜ A substrate uptake rate (kg A/m3∙h)
rA,avaverage substrate uptake rate (kg A/m3∙h)
rBbiomass growth rate (kg B/m3∙h)
rB,avaverage biomass growth rate (kg B/m3∙h)
rbbioparticle radius (rb = r0 + Lb)
r0inert particle radius
SRstiffness ratio
ttime (h)
wBAgrowth yield coefficient (kg B∙kg A−1)
xspace coordinate in the biofilm, m
zdimensionless coordinate in the biofilm
δrelative error
ηdimensionless substrate concentration
λdegree of nonlinearity of the model
μparameter defined by Equation (33)
ρbbiomass concentration in the biofilm (kg∙m−3)
τdimensionless time
ΦAThiele modulus
Φ ¯ A modified Thiele modulus
Superscripts
bbiofilm phase
cliquid (continuous) phase
*steady-state value
sbiofilm surface
Subscripts
appvalue obtained using the approximate model
avaverage value
exexact value
sbiofilm surface
0initial value

Appendix A. Derivation of Equation (12)

A microbiological process that is limited by a single substrate has been described by Equations (1)–(4), as referred to in Section 2:
The derivatives of the substrate concentration with respect to x and t were transformed according to the relationships (10):
After introducing Equation (10) to Equation (1), the following formula was obtained:
z L b , t L b c ˜ A b z + c ˜ A b t = D e A 2 c ˜ A b L b 2 z 2 + D e A 2 ( r 0 + z L b ) c ˜ A b L b z r A b ( c ˜ A b )
It was then transformed to:
c ˜ A b t = D e A 2 c ˜ A b L b 2 z 2 + D e A 2 ( r 0 + z L b ) c ˜ A b L b z + z L b , t L b c ˜ A b z r A b ( c ˜ A b )
The term D e A / L b 2 was then put outside the brackets:
c ˜ A b t = D e A L b 2 [ 2 c ˜ A b z 2 + 2 L b ( r 0 + z L b ) c ˜ A b z + ( z L b ) L b , t D e A c ˜ A b z L b 2 D e A r A b ( c ˜ A b ) ]
Finally, after a simple rearrangement, Equation (12) was obtained.

Appendix B. Solution of the Exact Model Using the Method of Lines

The dynamic changes of the substrate concentrations in the biofilm have been described by Equation (12). After introducing the dimensionless substrate concentration η (Equation (47)), the following formula was obtained:
η t = 1 c A c d c A c d t η + D e A L b 2 [ 2 η z 2 + η z ( 2 L b ( r 0 + z L b ) + z L b D e A L b , t ) Φ ¯ r ˜ A b ( η ) ]
According to the method of lines, the space coordinate z was divided into N + 1 sub-intervals. The partial space derivatives in the Equation (A4) were approximated by different quotients of the form:
η ( z i ) z = η i η i 1 Δ z
2 η ( z i ) z 2 = η i + 1 2 η i + η i 1 Δ z 2
where ηi denotes the dimensionless concentration in the i-th node.
In this way, the equation of the limiting substrate balance in a dimensionless form was transformed to the system of ordinary differential equations:
d η i d t = 1 c A c d c A c d t η i + D e A L b 2 [ η i + 1 2 η i + η i 1 Δ z 2 + η i η i 1 Δ z ( 2 L b ( r 0 + z L b ) + z L b D e A L b , t ) Φ ¯ r ˜ A b ( η i ) ]
The index i in the system of Equation (A6) corresponds to the inner points in the z range, i.e., excluding i = 0 (z = 0) and i = N+1 (z = 1). The expression for z = 0 was formulated using the boundary condition at the inert carrier surface. By approximation of the first derivative with respect to z by the forward difference quotient of the second order, one obtains:
d η 0 d z = η 2 + 4 η 1 3 η 0 2 Δ z = 0
From Equation (B4), it arises that:
η 0 = 4 η 1 η 2 3
The relationship (A8) was introduced to the Equation (A6) for i = 1. The boundary condition ηN+1 = ηs was introduced to the differential equation for i = N. The system of N ordinary differential equations was completed by Equation (13) of the biofilm thickness dynamics.

References

  1. Abbasbandy, S. The application of homotopy analysis method to nonlinear equations arising in heat transfer. Phys. Lett. A 2006, 360, 109–113. [Google Scholar] [CrossRef]
  2. Stryjewski, W.S.; Tabiś, B.; Boroń, D. Dynamic behaviour of stirred tank bioreactors based on structured and unstructured kinetic models. A comparative study. Chem. Eng. Res. Des. 2015, 104, 541–550. [Google Scholar] [CrossRef]
  3. Skoneczny, S.; Tabiś, B. Dynamic properties of a continuous stirred tank biofilm bioreactor for aerobic processes. AIChE J. 2017, 63, 1818–1829. [Google Scholar] [CrossRef]
  4. Skoneczny, S.; Cioch, M. Modeling of continuous-flow bioreactors with a biofilm with the use of orthogonal collocation on finite elements. Chem. Eng. Commun. 2018, 205, 929–946. [Google Scholar] [CrossRef]
  5. Mera, N.S.; Elliott, L.; Ingham, D.B.; Lesnic, D. The boundary element solution of the Cauchy steady heat conduction problem in an anisotropic medium. Int. J. Numer. Methods Eng. 2000, 49, 481–499. [Google Scholar] [CrossRef]
  6. Liu, F.-B. A hybrid method for the inverse heat transfer of estimating fluid thermal conductivity and heat capacity. Int. J. Therm. Sci. 2011, 50, 718–724. [Google Scholar] [CrossRef]
  7. Kim, D.H. Approximations for unsteady-state diffusion and reaction in porous catalyst and their application to packed-bed reactor. AIChE J. 2008, 54, 2423–2431. [Google Scholar] [CrossRef]
  8. Wanner, O.; Eberl, H.J.; Morgenroth, E.; Noguera, D.R.; Picioreanu, C.; Rittmann, B.E.; van Loosdrecht, M.C.M. Mathematical Modeling of Biofilms; WA Scientific and Technical Report No. 18; IWA Task Group on Biofilm Modeling: London, UK, 2006. [Google Scholar]
  9. Nicolella, C.; van Loosdrecht, M.C.M.; Heijnen, S.J. Particle-based biofilm reactor technology. Trends Biotechnol. 2000, 18, 312–320. [Google Scholar] [CrossRef]
  10. Szukiewicz, M.K. An approximate model for diffusion and reaction in a porous pellet. Chem. Eng. Sci. 2002, 57, 1451–1457. [Google Scholar] [CrossRef]
  11. Sun, Y.-P.; Liu, S.-B.; Keith, S. Approximate solution for the nonlinear model of diffusion and reaction in porous catalysts by the decomposition method. Chem. Eng. J. 2004, 102, 1–10. [Google Scholar] [CrossRef]
  12. Abbasbandy, S. Approximate solution for the nonlinear model of diffusion and reaction in porous catalysts by means of the homotopy analysis method. Chem. Eng. J. 2008, 136, 144–150. [Google Scholar] [CrossRef]
  13. Skoneczny, S.; Cioch-Skoneczny, M. Mathematical modelling and approximate solutions for microbiological processes in biofilm through homotopy-based methods. Chem. Eng. Res. Des. 2018, 139, 309–320. [Google Scholar] [CrossRef]
  14. Russo, M.E.; Maffettone, P.L.; Marzocchella, A.; Salatino, P. Bifurcational and dynamical analysis of a continuous biofilm reactor. J. Biotechnol. 2008, 135, 295–303. [Google Scholar] [CrossRef]
  15. Dokianakis, S.N.; Kornaros, M.; Lyberatos, G. Effect of wall growth on the kinetic modeling of nitrite oxidation in a CSTR. Biotechnol. Bioeng. 2006, 93, 718–726. [Google Scholar] [CrossRef] [PubMed]
  16. Ajbar, A. Classification of stability behavior of bioreactors with wall attachment and substrate-inhibited kinetics. Biotechnol. Bioeng. 2000, 72, 166–176. [Google Scholar] [CrossRef]
  17. Kornaros, M.; Dokianakis, S.N.; Lyberatos, G. Sensitivity analysis of a biofilm model describing mixed growth of nitrite oxidisers in a CSTR. Water Sci. Technol. 2006, 53, 313–320. [Google Scholar] [CrossRef] [PubMed]
  18. Mašić, A.; Eberl, H. Persistence in a Single Species CSTR Model with Suspended Flocs and Wall Attached Biofilms. Bull. Math. Biol. 2012, 74, 1001–1026. [Google Scholar] [CrossRef] [PubMed]
  19. Jones, D.; Kojouharov, H.V.; Le, D.; Smith, H. The Freter model: A simple model of biofilm formation. J. Math. Biol. 2003, 47, 137–152. [Google Scholar] [CrossRef]
  20. De Beer, D.; Stoodley, P.; Roe, F.; Lewandowski, Z. Effects of biofilm structures on oxygen distribution and mass transport. Biotechnol. Bioeng. 1994, 43, 1131–1138. [Google Scholar] [CrossRef]
  21. Hibiya, K.; Nagai, J.; Tsuneda, S.; Hirata, A. Simple prediction of oxygen penetration depth in biofilms for wastewater treatment. Biochem. Eng. J. 2004, 19, 61–68. [Google Scholar] [CrossRef]
  22. Skoneczny, S. Nonlinear Steady-State Characteristics of Continuous Flow Bioreactors with Immobilized Biofilm. Ph.D. Thesis, Politechnika Krakowska, Kraków, Poland, 2013. [Google Scholar]
  23. Rittmann, B.E.; McCarty, P.L. Model of steady-state-biofilm kinetics. Biotechnol. Bioeng. 1980, 22, 2343–2357. [Google Scholar] [CrossRef]
  24. Zeng, A.-P.; Deckwer, W.-D. A kinetic model for substrate and energy consumption of microbial growth under substrate-sufficient conditions. Biotechnol. Prog. 1995, 11, 71–79. [Google Scholar] [CrossRef]
  25. Kumar, A.; Kumar, S.; Kumar, S. Biodegradation kinetics of phenol and catechol using Pseudomonas putida MTCC 1194. Biochem. Eng. J. 2005, 22, 151–159. [Google Scholar] [CrossRef]
  26. Skoneczny, S.; Stryjewski, W.; Bizon, K.; Tabiś, B. Three-phase fluidized bed bioreactor modelling and simulation. Biochem. Eng. J. 2017, 121, 118–130. [Google Scholar] [CrossRef]
  27. Kumar, P.; Qureshi, S. Laplace-Carson integral transform for exact solutions of non-integer order initial value problems with Caputo operator. J. Appl. Math. Comput. Mech. 2020, 19, 57–66. [Google Scholar] [CrossRef]
  28. Makarov, A.M. Application of the laplace-carson integral transform method to the theory of nonstationary flows of a viscoplastic medium. J. Eng. Phys. 1970, 19, 870–874. [Google Scholar] [CrossRef]
  29. Aggarwal, S.; Sharma, S.D.; Vyas, A. Laplace-Carson Transform for the Primitive of Convolution Type Volterra Integro-Differential Equation of First Kind. Int. J. Res. Innov. Appl. Sci. 2020, V, 2454–6194. [Google Scholar]
  30. Szukiewicz, M.K. New approximate model for diffusion and reaction in a porous catalyst. AIChE J. 2000, 46, 661–665. [Google Scholar] [CrossRef]
  31. Szukiewicz, M.; Petrus, R. Approximate Model for Diffusion and Reaction in a Porous Pellet and an Effectiveness Factor. Chem. Eng. Sci. 2004, 59, 479–483. [Google Scholar] [CrossRef]
  32. Picioreanu, C.; van Loosdrecht, M.C.M.; Heijnen, J.J. A new combined differential-discrete cellular automaton approach for biofilm modeling: Application for growth in gel beads. Biotechnol. Bioeng. 1998, 57, 718–731. [Google Scholar] [CrossRef]
  33. Pawlowsky, U.; Howell, J.A. Mixed culture biooxidation of phenol. I. Determination of kinetic parameters. Biotechnol. Bioeng. 1973, 15, 889–896. [Google Scholar] [CrossRef]
  34. Dormand, J.R.; Prince, P.J. A family of embedded Runge-Kutta formulae. J. Comput. Appl. Math. 1980, 6, 19–26. [Google Scholar] [CrossRef] [Green Version]
  35. Gear, C.W. Algorithm 407: DIFSUB for solution of ordinary differential equations [D2]. Commun. ACM 1971, 14, 185–190. [Google Scholar] [CrossRef]
  36. Lardon, L.A.; Merkey, B.V.; Martins, S.; Dötsch, A.; Picioreanu, C.; Kreft, J.-U.; Smets, B.F. iDynoMiCS: Next-generation individual-based modelling of biofilms. Environ. Microbiol. 2011, 13, 2416–2434. [Google Scholar] [CrossRef] [PubMed]
  37. Tabiś, B.; Grzywacz, R. Numerical and technological properties of bubble column bioreactors for aerobic processes. Comput. Chem. Eng. 2011, 35, 212–219. [Google Scholar] [CrossRef]
  38. Bakke, R.; Trulear, M.G.; Robinson, J.A.; Characklis, W.G. Activity of Pseudomonas aeruginosa in biofilms: Steady state. Biotechnol. Bioeng. 1984, 26, 1418–1424. [Google Scholar] [CrossRef]
  39. Abbas, F.; Eberl, H.J. Analytical substrate flux approximation for the Monod boundary value problem. Appl. Math. Comput. 2011, 218, 1484–1494. [Google Scholar] [CrossRef]
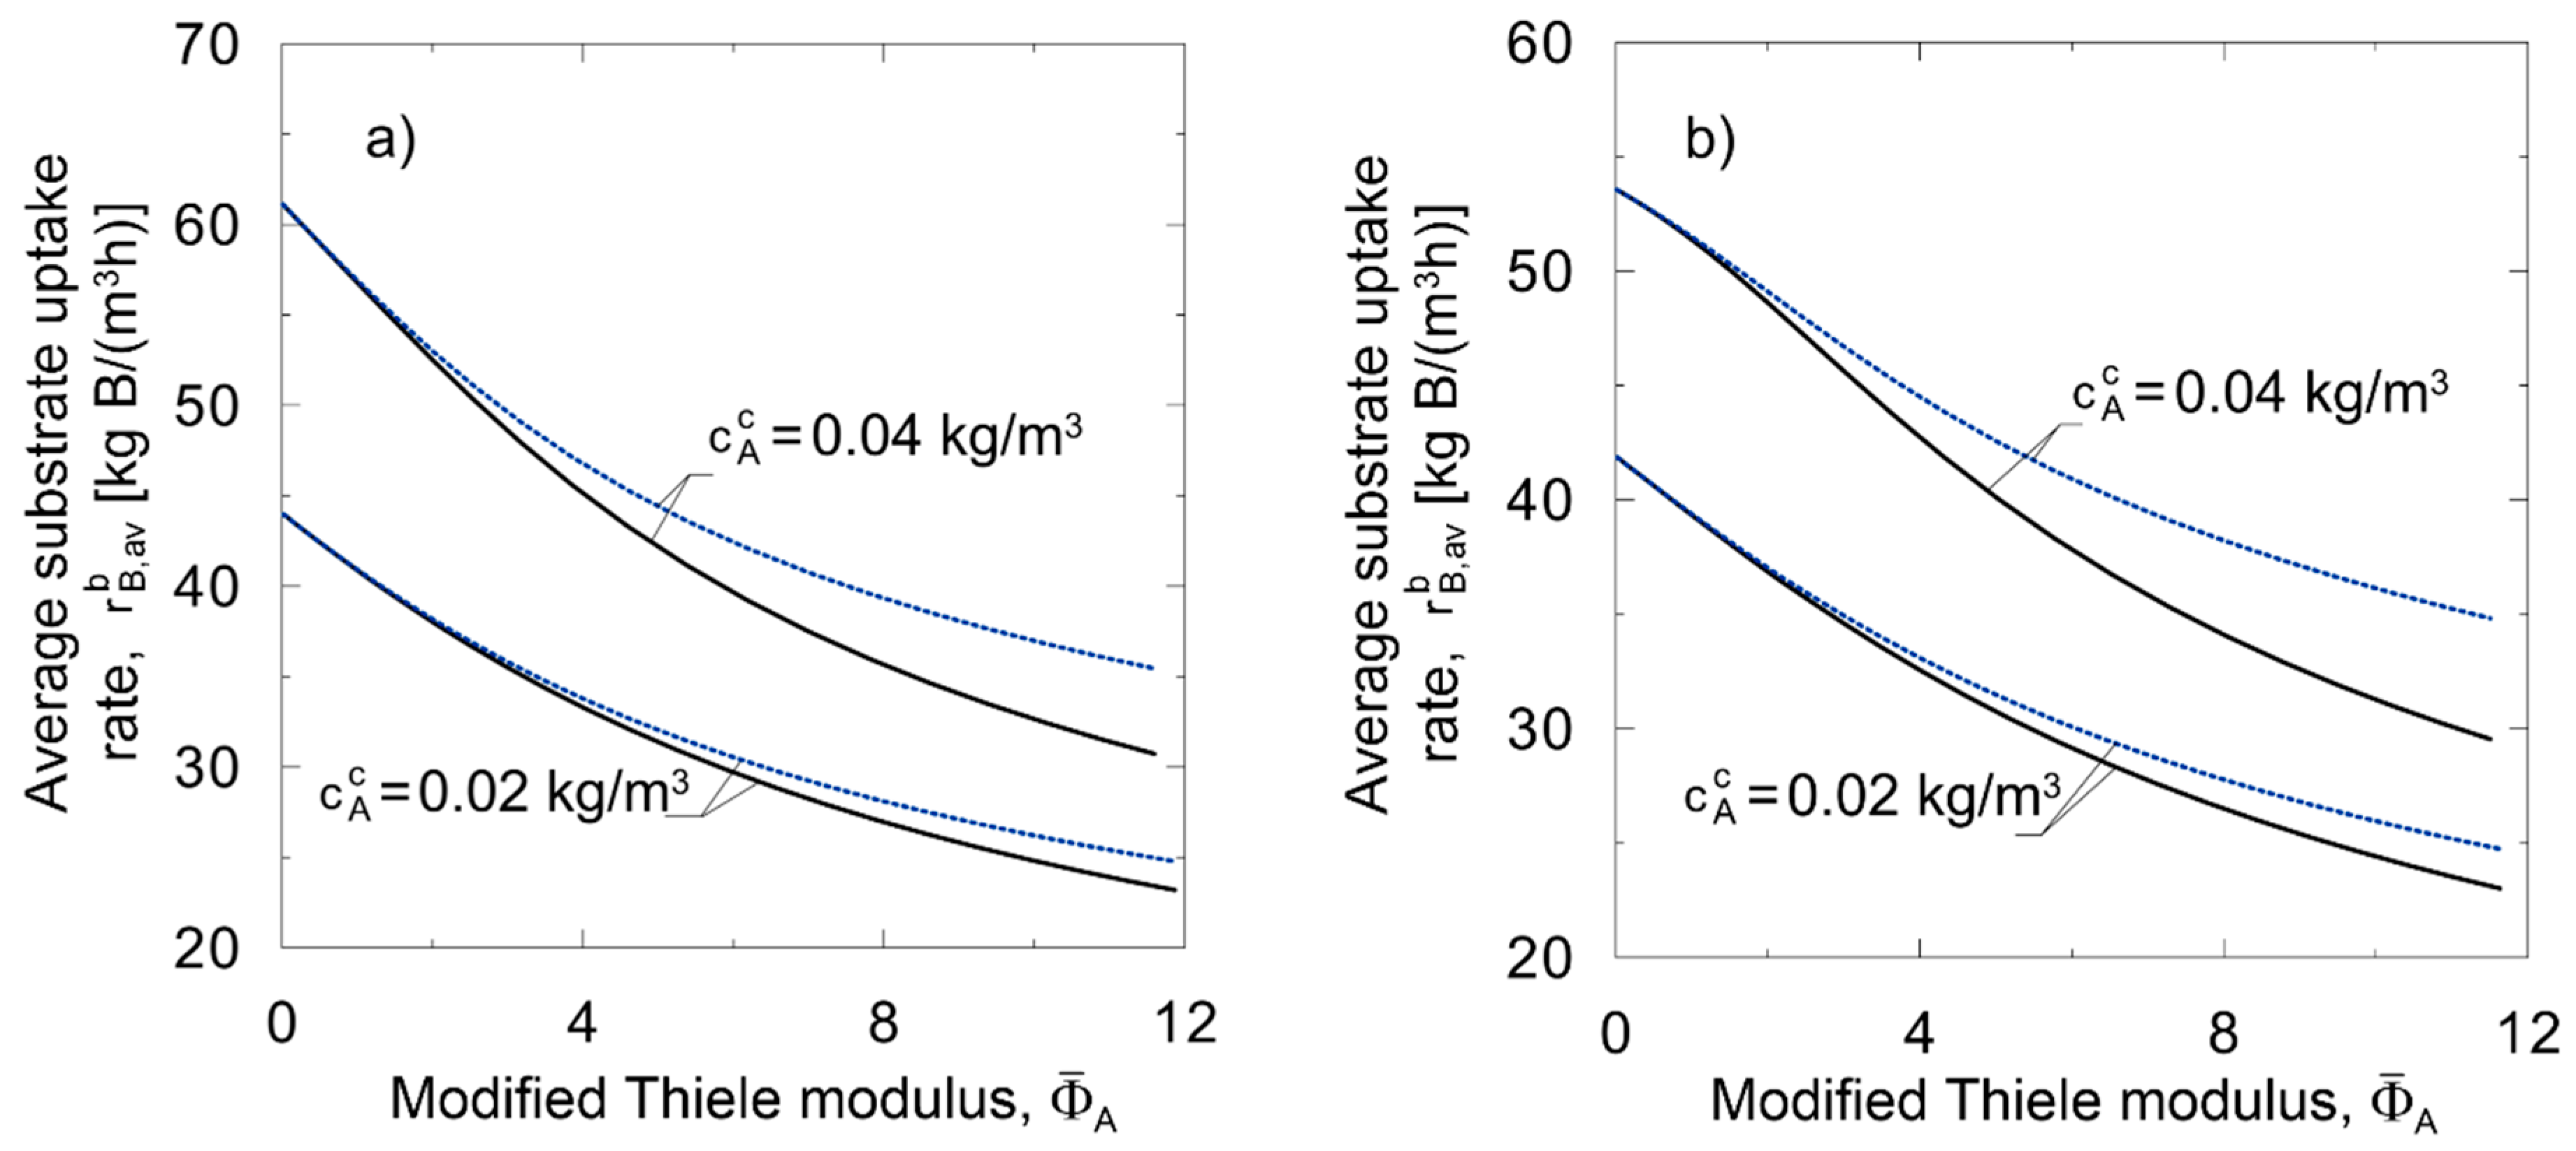
Figure 1. Illustration of the accuracy of the approximate formula for average biomass growth rate (53); solid lines—exact expression; dashed lines—approximate expression; (a) Monod kinetics; (b) Haldane kinetics.
Processes 10 00048 g001
Figure 2. Relative difference between average biomass growth rate calculated for spherical and flat biofilm.
Processes 10 00048 g002
Figure 3. Illustration of the accuracy of linear and nonlinear approximate models AM1 for Monod kinetics (a) and Haldane kinetics (b); Processes 10 00048 i001 Method of lines; Processes 10 00048 i002 Linear approximate model; Processes 10 00048 i003 Nonlinear approximate model; (a) oxidation of nitrite; (b) glucose utilization.
Processes 10 00048 g003
Figure 4. Stiffness ratio of the system of differential equations obtained from the application of method of lines to the exact model.
Processes 10 00048 g004
Figure 5. Comparison of average dimensionless substrate concentration (left column), biofilm thickness obtained in the dynamical simulation of biofilm growth with the use of the exact model (solid lines) and approximate model AM1 (dashed lines); (a,b) nitrite oxidation by nitrifying bacteria; (c,d) glucose utilization by Pseudomonas aeruginosa; (e,f) phenol degradation by Pseudomonas putida.
Processes 10 00048 g005aProcesses 10 00048 g005b
Figure 6. Illustration of the accuracy of the approximate model family AM2; left (ac)—glucose utilization; right (df)—phenol degradation; top— c A c = 0.04 kg / m 3 ; middle— c A c = 0.02 kg / m 3 ; bottom— c A c = 0.01 kg / m 3 .
Processes 10 00048 g006aProcesses 10 00048 g006b
Figure 7. Comparison of AM2-3 model and model of Abbas and Eberl [39] accuracy (MOL—method of lines); (a) c A c = 0.01 kg / m 3 ; (b) c A c = 0.02 kg / m 3 ; (c) c A c = 0.04 kg / m 3 .
Processes 10 00048 g007
Table 1. Values of kinetic parameters for processes following Monod kinetic model [15].
Processk [1/h]KA [kg/m3]wBA [kg B/kg A]
Nitrite oxidation7.917 × 1032.4 × 1040.23
Table 2. Values of kinetic parameters for biodegradation of phenol following Haldane kinetic model [33].
k [1/h]KA [kg/m3]Kin [kg/m3]wBA [kg B/kg A]
0.260.02540.1730.616
Table 3. Execution times of computer programs solving the exact model and the approximate models.
ModelExact ModelLinear Approximate ModelNonlinear Approximate Model
Integration algorithmDormand-Prince (4/5) (MOL)Dormand-Prince (4/5)
Normalized time of execution10.04680.0327
Integration algorithmGear’s method (MOL)Gear’s method
Normalized time of execution0.08160.05610.0535
Table 4. Values of kinetic parameters for glucose utilization following Monod kinetic model [38].
k [1/h]KA [kg/m3]wBA [kg B/kg A]
0.40.0020.34
Publisher’s Note: MDPI stays neutral with regard to jurisdictional claims in published maps and institutional affiliations.