Article

A Short-Cut Data Mining Method for the Mass Spectrometric Characterization of Block Copolymers

1
Department of Applied Chemistry, Faculty of Science and Technology, University of Debrecen, Egyetem tér 1, H-4032 Debrecen, Hungary
2
Doctoral School of Chemistry, University of Debrecen, Egyetem tér 1, H-4032 Debrecen, Hungary
*
Author to whom correspondence should be addressed.
Processes 2022, 10(1), 42; https://doi.org/10.3390/pr10010042
Submission received: 9 December 2021 / Revised: 22 December 2021 / Accepted: 22 December 2021 / Published: 27 December 2021
(This article belongs to the Section Materials Processes)

Abstract

:
A new data mining approach as a short cut method is given for the determination of the copolymer composition from mass spectra. Our method simplifies the copolymer mass spectra by reduction of the number of mass peaks. The proposed procedure, namely the selection of the mass peaks, which is based on the most abundant peak of the mass spectrum, can be performed manually or more efficiently using our recently invented Mass-remainder analysis (MARA). The considerable reduction of the MS spectra also simplifies the calculation of the copolymer quantities for instance the number- and weight-average molecular weights (Mn and Mw, respectively), polydispersity index (Đ = Mw/Mn), average molar fraction (cA) and weight fraction (wA) of the comonomer A and so on. These copolymer properties are in line with those calculated by a reference method taking into account all the mass peaks of the copolymer distribution. We also suggest a highly efficient method and template for the determination of the composition drift by processing the reduced mass spectra.

Graphical Abstract

1. Introduction

For a thorough understanding of the influence of the copolymer structure on the copolymer properties, accurate and detailed characterization of the copolymer chains at molecular level is crucial. The soft ionization mass spectrometry techniques such as matrix-assisted laser desorption/ionization (MALDI) [1,2] or electrospray ionization (ESI) [3] can give detailed information on the composition of the individual copolymer chains. However, the large number of m/z peaks makes the evaluation of the mass spectra of copolymers difficult, time and labor-consuming. Although the application of coupled methods, such as HPLC-MS [4], LAC-MS [5], LACCC-MS [6], SEC-MS and IM-MS [7], decrease the complexity of a spectrum, the number of spectra to be evaluated increases significantly. The manual identification of hundreds or thousands of peaks is not feasible; hence, the compositional assignment of the individual copolymer molecules requires the use of computer software tools. Therefore, several data processing approaches and algorithms have been developed and implemented to determine the elemental composition of the numerous m/z peaks of the copolymer mass spectra [8,9,10,11,12,13]. After all, some issues are not yet completely resolved: (i) many of the methods merely assign the chemical composition to the mass spectral peaks; however, they do not or only partly compute the essential copolymer quantities (e.g., the averaged molecular weights of the repeat units, the composition drift [14] and so forth); (ii) the implementation of the mass spectral processing algorithms requires special skills or software development experts; (iii) the general algorithms are not capable of handling the specific copolymer systems.
Recently, we developed the Mass-remainder analysis (MARA), which is capable of handling the mass spectra of copolymers, even those obtained by low-resolution mass spectrometer. The capability of our method was proved by analyzing copolymers [15], epoxidized vegetable oils [16], crude oil [17], copolymer blends [18] and even for the analysis of flavonoids [19]. The further development of such a filtering method is of paramount importance for the processing of complex mass spectra.
In this work, we report a new data mining approach, which significantly simplifies the copolymer mass spectra and consequently substantially reduces the required computational resources and speeds up the data-interpretation process. Nevertheless, it allows the accurate, reliable and comprehensive characterization of the copolymer mass spectra, for example, the construction of the compositional drift plots.
We demonstrate our new short cut data mining approach for copolymer analysis through the characterization of poly(ethylene oxide)-block-poly(propylene oxide)-block-poly(ethylene oxide) (PEO−PPO−PEO) copolymers and the reversed PPO−PEO−PPO structures. These block copolymers have extensive industrial applications as surface active agents in detergency, cosmetics, pharmaceuticals and so on [20,21,22].

2. Experimental

2.1. Chemicals

The RPE2520, RPE1720-1, PE6100-1, PE6100-2, RPE1720-2, PE6200, RPE1740 and RPE3110 copolymers were gifts of BASF (Ludwigshafen, Germany). RPE1720-1 and PE6100-1 copolymers were acquired in 2006, RPE1720-2 and PE6100-2 were received in 2021. Pure water was produced by a Direct-Q system (Millipore, Molsheim, France). Methyl alcohol was obtained from VWR Chemicals (Leuven, Belgium). Table 1 shows the analyzed copolymers and their EO content.

2.2. Matrix-Assisted Laser Desorption/Ionization Time-of-Flight Mass Spectrometry

An Autoflex Speed MALDI-TOF mass spectrometer (Bruker Daltonik, Bremen, Germany) was used for the MS analysis. The reflector mode was used with the voltages ionsource-1, ionsource-2, reflector-1 and reflector-2: 19 kV, 16.65 kV, 21 kV and 9.55 kV, respectively. The spectrometer is equipped with a solid state laser (355 nm). Internal calibration was applied using various polyethylene oxides. The matrix was trans-2-[3-(4-tert-Butylphenyl)-2-methyl-2-propenylidene] malononitrile (DCTB) and sodium trifluoroacetate (NaTFA) was used as an ionization agent. The concentrations of the samples, matrix and ionization agent were 10 mg/mL, 15 mg/mL and 5 mg/mL, respectively (the solvent was methanol). The sample, matrix and ionization agent were mixed in the ratio of 2:5:1, individually.

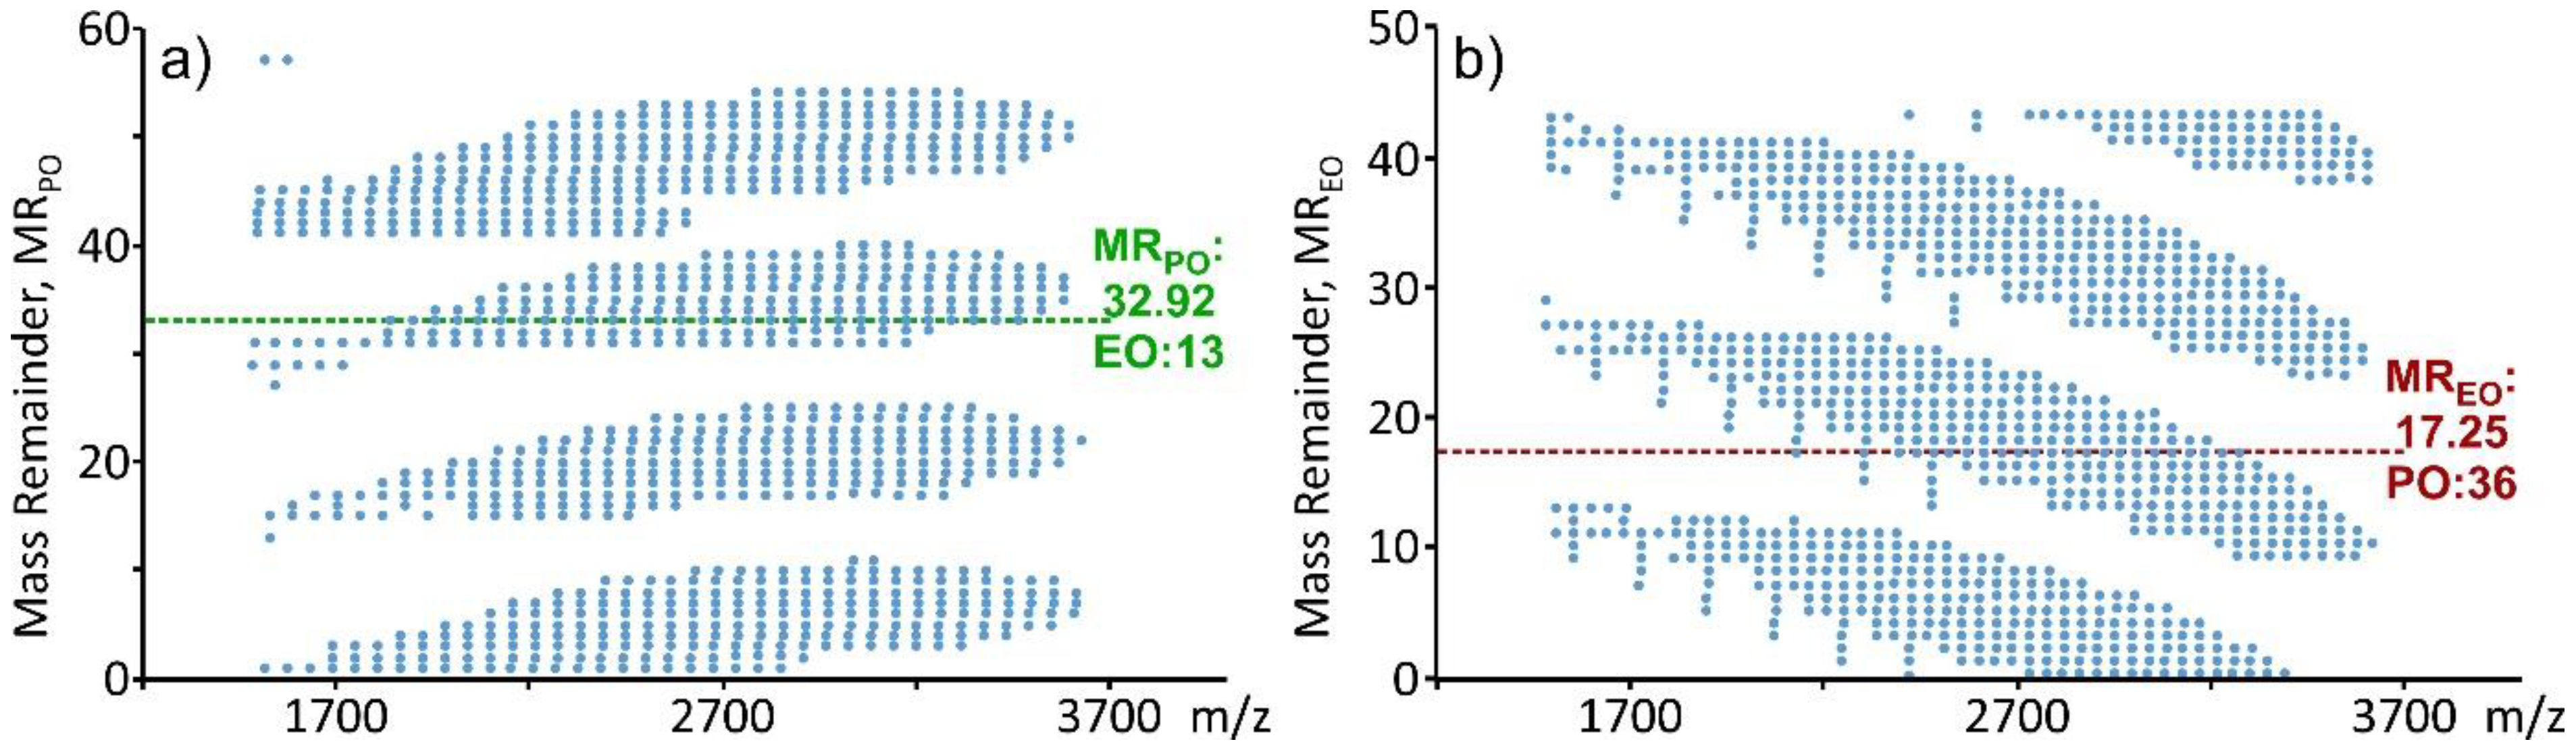
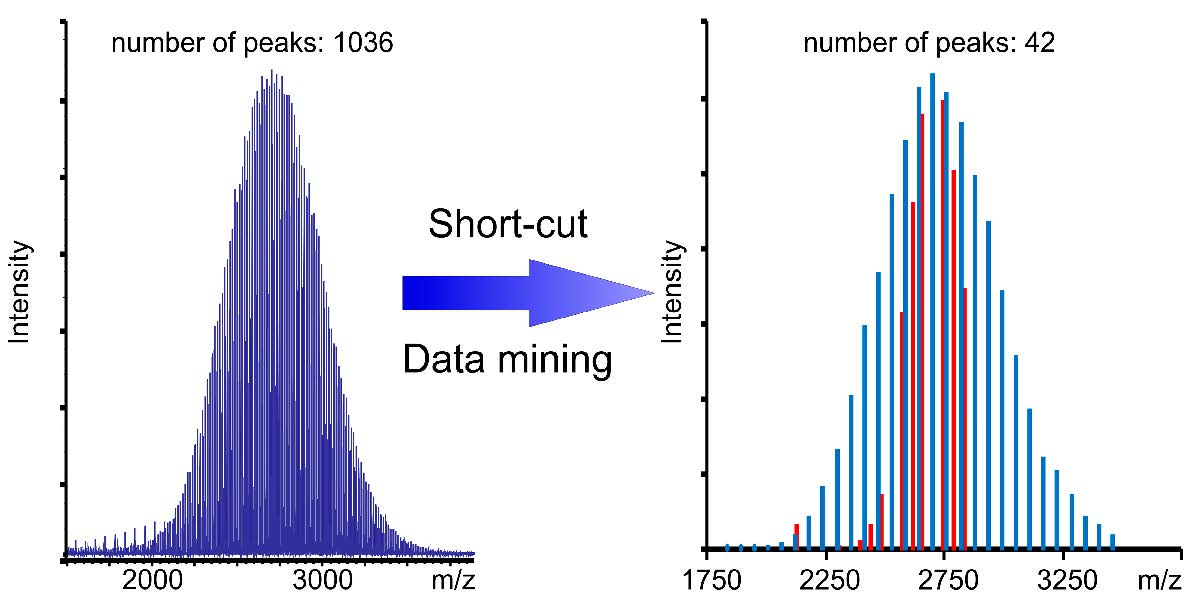
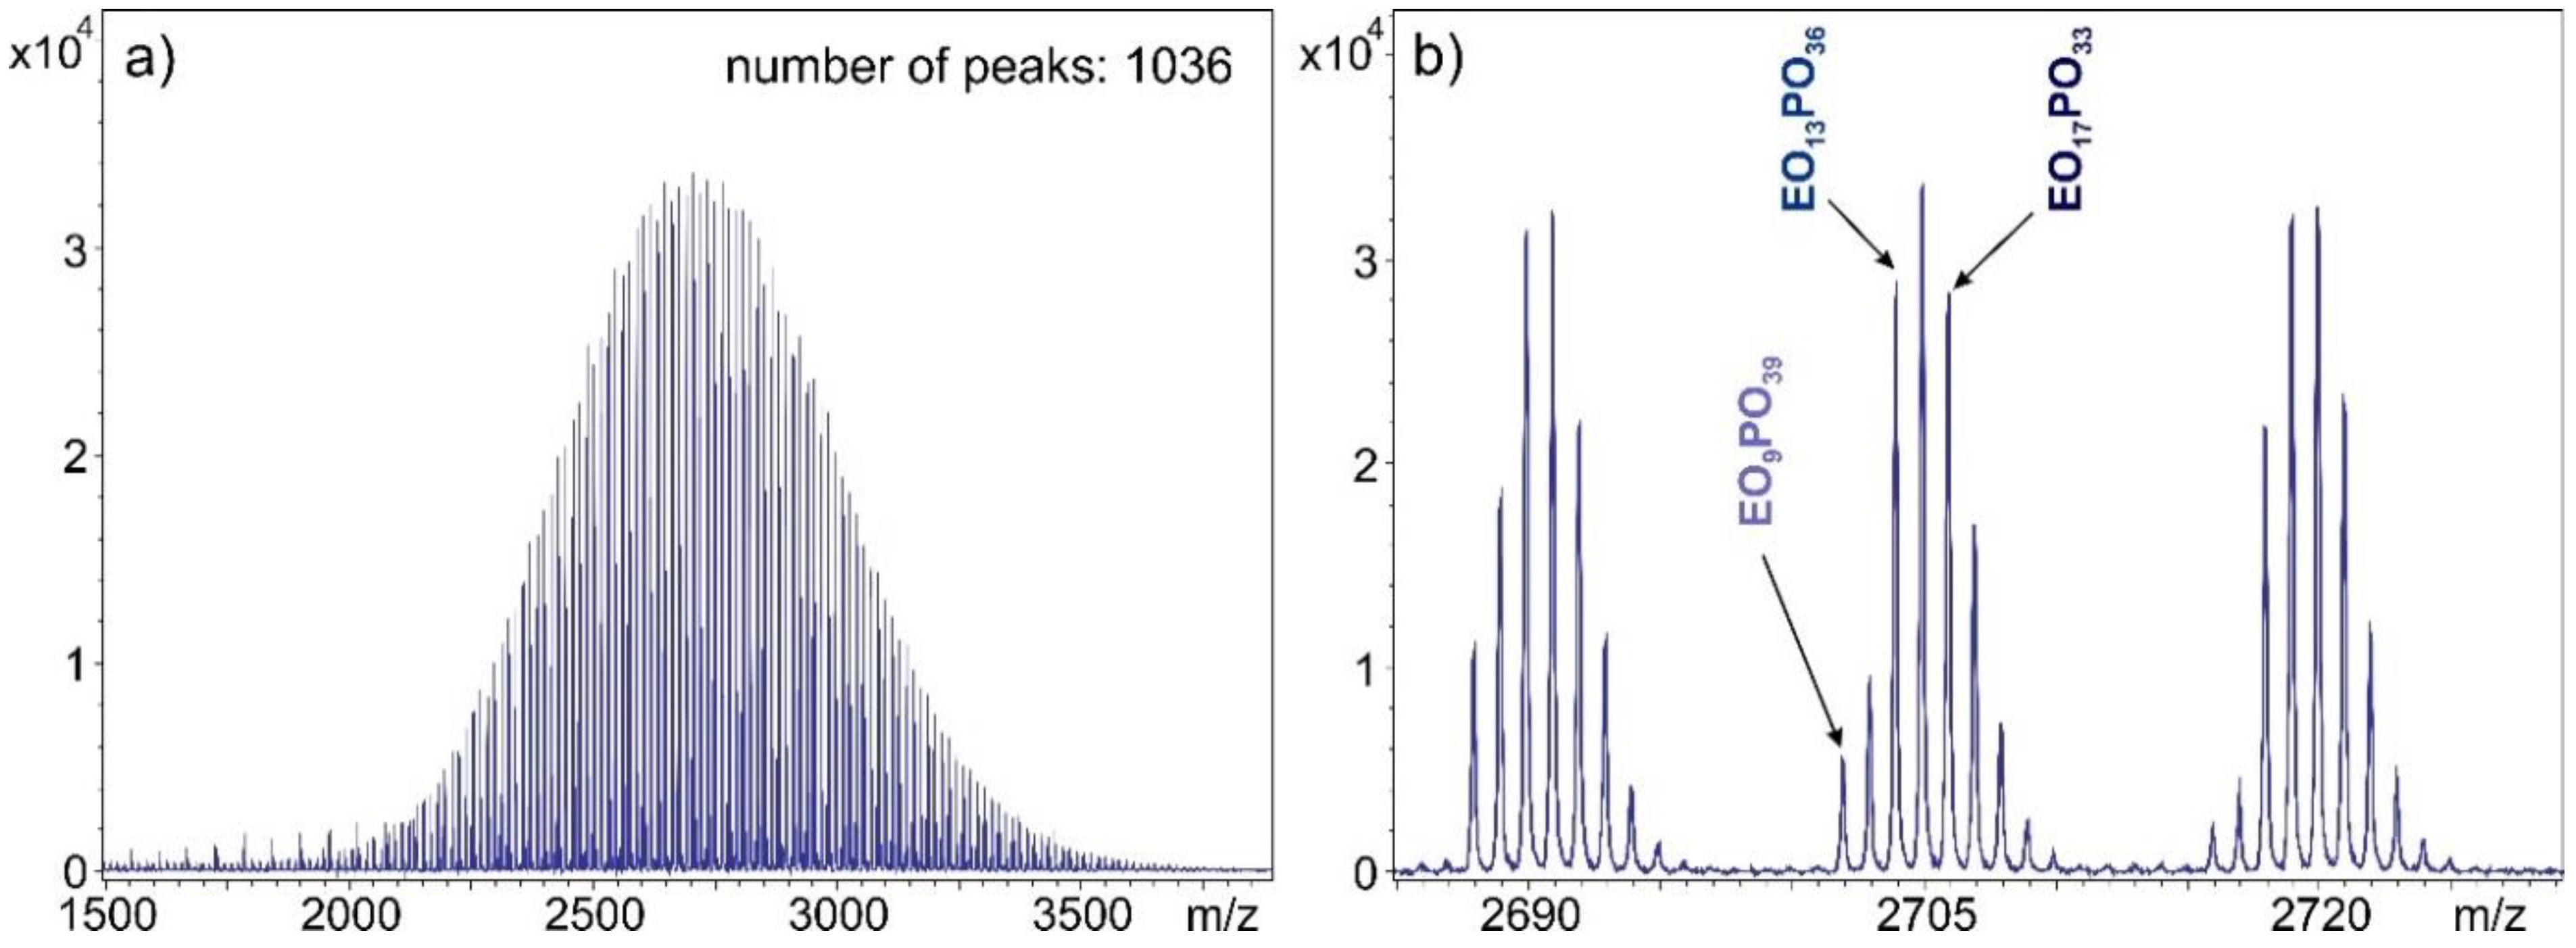
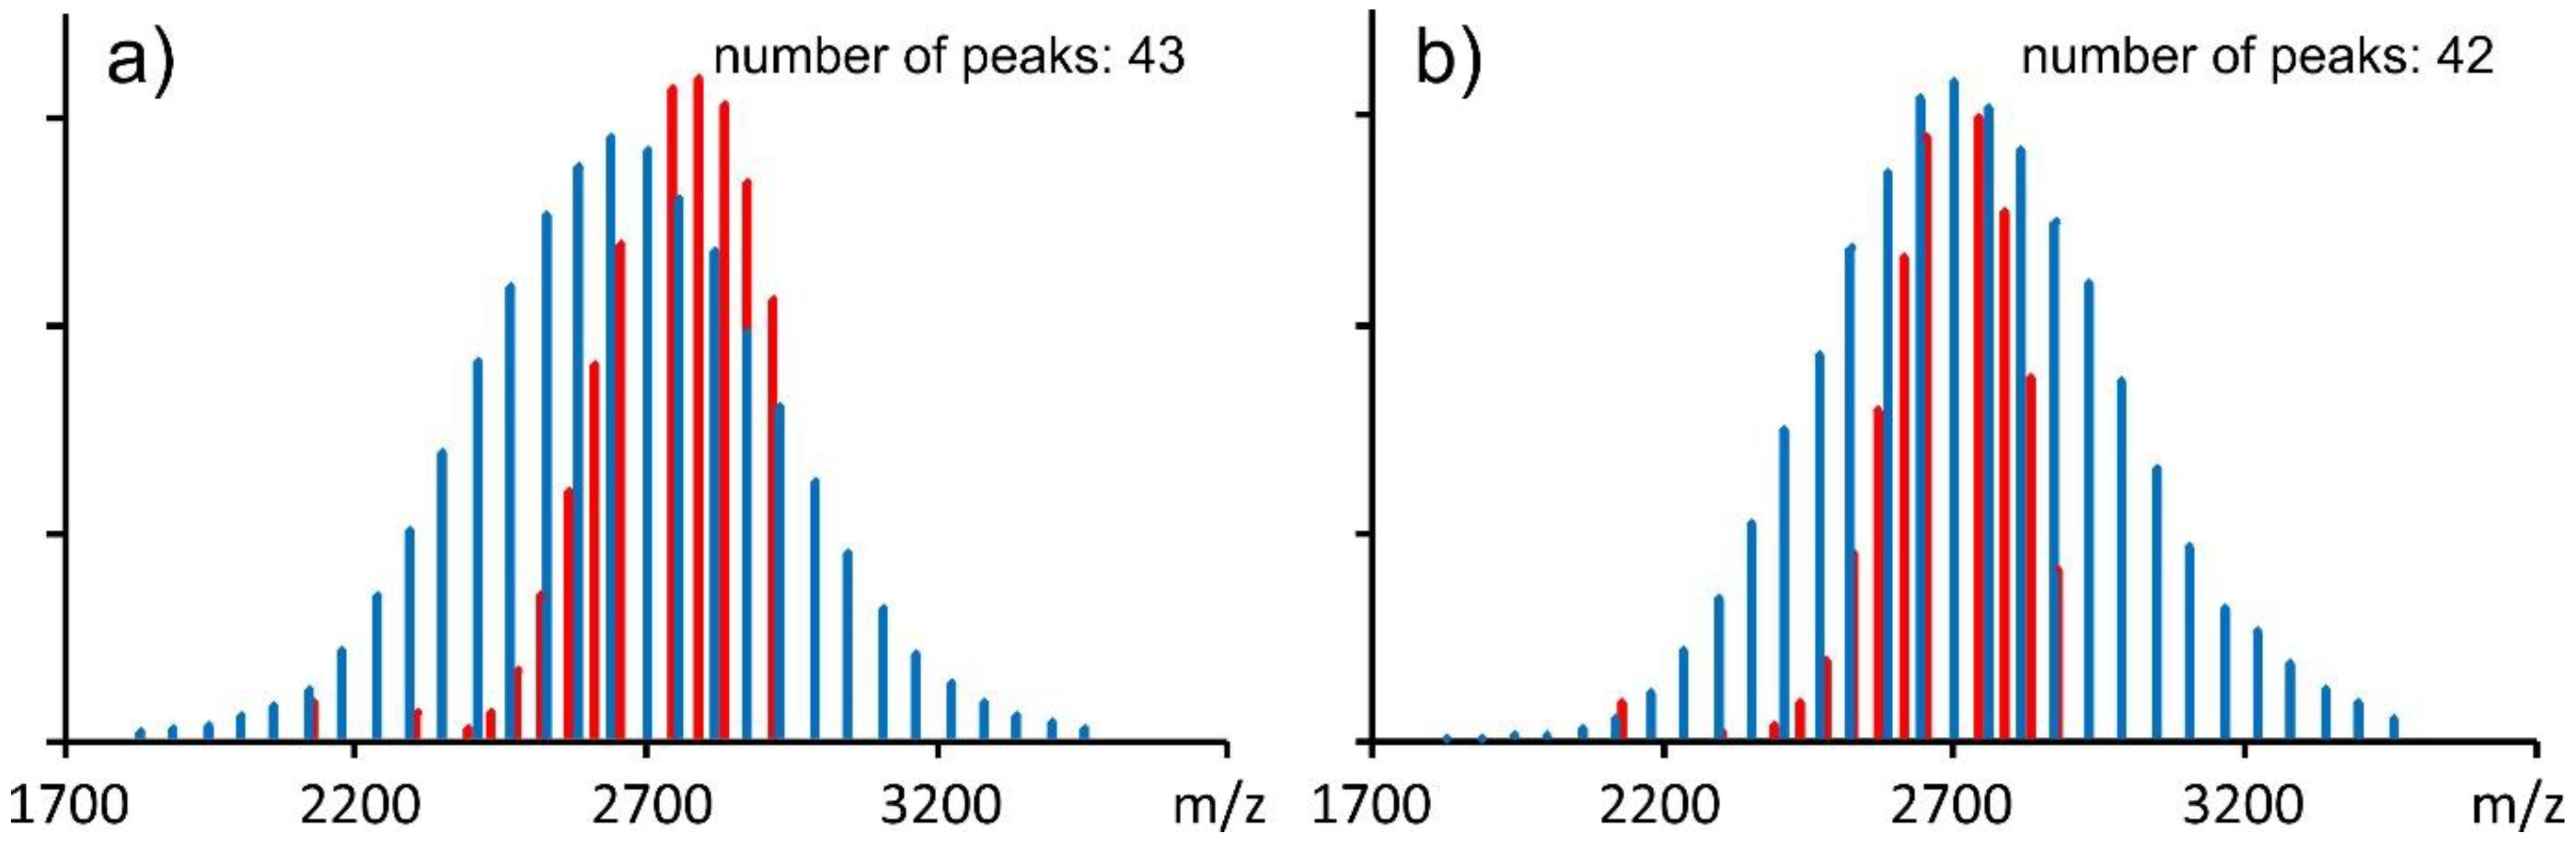
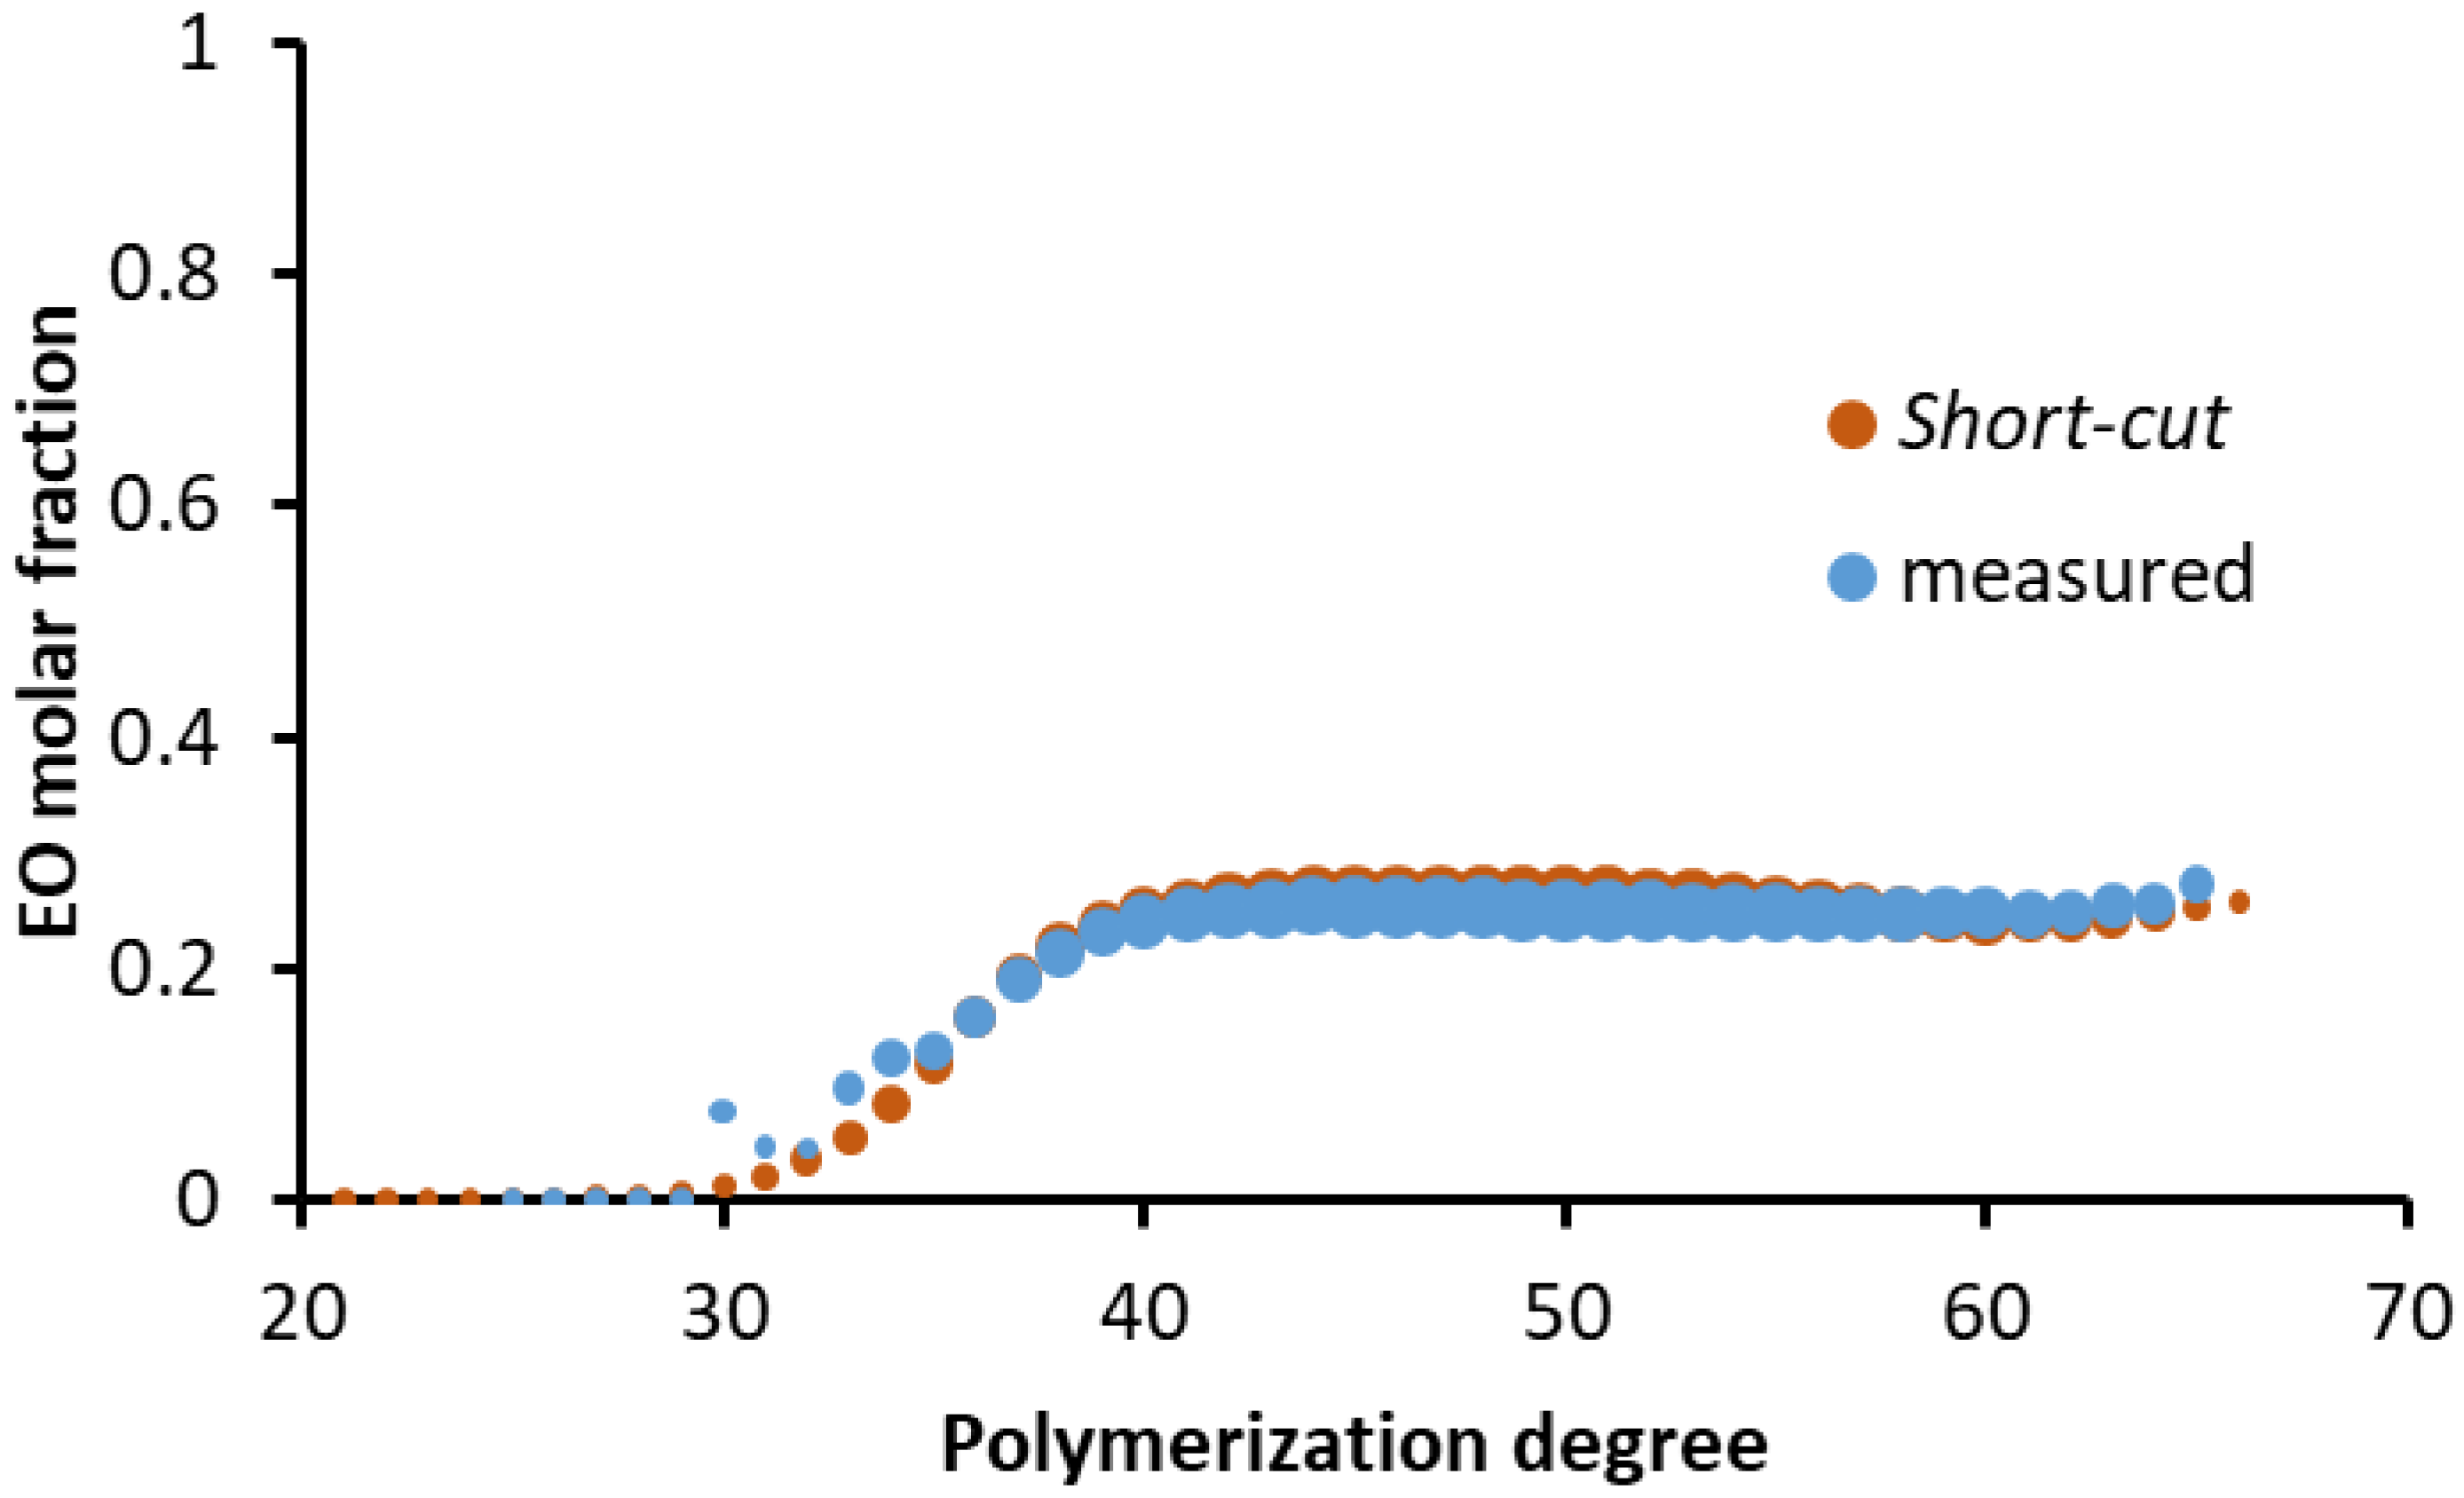
3. Results and Discussion

Ethylene oxide (EO)—propylene oxide (PO)-based amphiphilic block copolymers—is widely used in the chemical industry. Their diverse applications emphasize the importance of the mass spectrometric characterization of these copolymers. Figure 1a depicts the MALDI-TOF mass spectrum of an amphiphilic PPO–PEO–PPO copolymer with 20 wt% ethylene oxide (EO) content and number-average molecular weight (Mn) of approximately 2700 g/mol (RPE2520). Additional MALDI-TOF MS spectra of triblocks with various number-average molecular weights and EO weight fractions are shown in Figures S1–S7 in the electronic supplementary material.
The large number of mass peaks in Figure 1a proves the need for special algorithms or software for the evaluation of these complex mass spectra. Moreover, the zoom of each single line in the mass spectra reveals a peak cluster consisting of partially overlapped isotopic peaks of several EOnPOm cooligomers (see Figure 1b), which make the interpretation of the spectra even more challenging. It is specific to the EO/PO copolymers that EOnPOm overlaps the second isotope of EOn−4POm+3 (see e.g., EO17PO33 and EO13PO36 in Figure 1b).
The basic idea of our short cut method is the simplification of the copolymer mass spectrum, i.e., the reduction of the number of mass peaks with a minimal loss or distortion of information on the copolymer structure. The steps of our method are as follows:
(1) Selecting and identifying the most intense peak of the mass spectrum. The number of EO and PO units (nEO and nPO, respectively) of the most intense m/z peak are determined by the Mass-remainder analysis (MARA) [15]. The mass remainder value MRPO is calculated using the exact mass of the propylene oxide comonomer (C3H6O = 58.04187 Da) as the base unit R of the MARA division (Equation (1)):
MRPO = m/z MOD R
where MOD is the modulo operation.
Then, nEO can easily be obtained by the bijective nEOMRPO mapping and subsequently nPO can be calculated as detailed in our previous report [15]. For the mass spectrum presented in Figure 1 the composition of the most intense peak is EO13PO36.
(2) Reduction of the mass spectrum. The simplified mass spectrum contains only the EOxPOy peaks corresponding to the condition x = 13 or y = 36, that are the nEO and nPO values of the most intense peak. This reduction is done by MARA filtering, as follows: Figure 2 shows the MRPO vs. m/z and MREO vs. m/z plots of the mass spectrum presented in Figure 1a. MREO can be obtained by a formula analogous to Equation (1), with the base unit R = C2H4O = 44.02622 Da. Each dot row represents an EOnPOx series with constant n values and an EOyPOm series with constant m values in Figure 2a,b, respectively. Accordingly, we reduce the mass spectrum keeping only two series: (a) EO13POx, the peaks having MRPO values corresponding to nEO = 13 (see Figure 2a, MRPO = 32.92 = (13 × 44.02622 + x × 58.04187 + 40.99979) MOD 58.04187, where [H2O + Na]+ = 40.99979 Da is the mass of the end group plus the ionizing agent) and (b) EOyPO36, the peaks having MREO values corresponding to nPO = 36 (see Figure 2b). The reduced mass spectrum contains only two series, EO13POx and EOyPO36, represented by blue and red colors, respectively, (see Figure 3a.) As the peak numbers indicate (1036 of the original and 42 of the reduced), a remarkable reduction ratio (0.04) can be achieved.
(3) Intensity correction. Each peak of the reduced mass spectrum (Figure 3a) is a member of a peak cluster in the raw spectrum, each containing partially overlapped isotopic peaks, as seen in Figure 1b. Therefore, in order to compute valid copolymer quantities, the peak intensities of the reduced mass spectrum must be corrected to reflect the abundance of the polymer chains of various chemical compositions. This correction is an essential part of the MARA algorithm, as detailed in our previous paper [15]. The intensity corrections were made applying polynomial functions calculated from the natural abundance of 13C and 18O isotopes. The parameters of the polynomials are shown in the electronic supplementary material in Tables S1 and S2. Figure 3b shows the reduced mass spectrum after the intensity correction step.
(4) Statistical description of the copolymer composition. The significant reduction of the number of peaks also simplifies the calculation of the usual copolymer quantities such as the number-average and weight-average molecular weights (Mn and Mw), polydispersity index (Đ = Mw/Mn), average molar fraction (cA) and weight fraction (wA) of repeat unit A, number-average number of comonomers A and B (nnA, nnB), weight-average number of comonomers A and B (nwA, nwB) and the polydispersity index for the repeat units (ĐA = nwA/nnA, ĐB = nwB/nnB) [23], as it is exemplified in the electronic supporting material Short-Cut.xlsx.
Furthermore, it is obvious that our short cut method is very effective in data reduction, but the essential question remains open as to whether the information on the copolymer structure is valid or distorted. To answer this question, various copolymer mass spectra were evaluated by two different ways: by this novel short cut method and by our recently invented and reported robust algorithm, as a reference method that is implemented into a homemade software [8]. The latter technique was validated by nuclear magnetic resonance (NMR) spectroscopy [8]. Table 2 contains the detailed chemical compositions of 8 industrially important EO/PO copolymers determined by both the short cut and the reference method used for processing their MALDI-TOF spectra.
Comparing the corresponding reference and short cut quantities in Table 2, it can be concluded that our short cut method correctly determines the composition of the Pluronic-type triblock copolymers. For example, one of the most important parameters, the average molar fraction of the EO units (cEO, that fundamentally determines the micelle formation of the Pluronics necessary, e.g., for drug delivery systems) shows only 0.49% average relative difference between the Short cut (S) and the reference (R) values (calculated as the average of abs(SR)/R × 100 for all the eight triblock copolymers). Moreover, the paired two-sample t-test has determined that the mean difference between the corresponding cEO values is zero (p = 0.65).
For the comprehensive characterization of the copolymers, it is often necessary to determine—in addition to the distribution parameters summarized in Table 2—the variation of the composition with the polymer chain length, called the composition drift [14]. The number of peaks of the reduced mass spectrum (e.g., 42, see Figure 3) is not enough to construct the composition drift plot, but the original mass spectrum can be modelled (“restored”) by constructing the outer product of the intensities of the two series of the reduced spectrum as two vectors. In our example, the EO13POx series has 29; the EOyPO36 series has 14 elements, resulting in a 29 × 14 outer product matrix. The construction of this model mass spectrum and the subsequent composition drift plot calculation can be easily implemented by a common spreadsheet application, as demonstrated in the electronic supporting material Short-Cut.xlsx. Figure 4 shows the composition drift plot of the PPO–PEO–PPO copolymer with about 20 wt% EO content (RPE2520) created by the reference and the short cut method.
As seen in Figure 4, the curves constructed by the reference and short cut method coincides with each other, especially in the middle polymerization degree (PD) domain. The zero EO molar fraction in the low PD region, revealed by both methods, indicates the presence of PPO homopolymers in the copolymer sample. A small deviance in the range of 30–35 polymerization degrees is the result of higher intensity deviation of small intensity peaks as it turns out from the size of the dots in Figure 4. In this region the intensity of the peaks is close to the detection limit; thus, the acceptance or the decline of even one peak during the peak-picking has a high effect on the resulting EO molar fraction. The good agreement between the composition drift determined by the two methods justifies the capability of our short-cut method for copolymer analysis.

4. Conclusions

A novel, short cut method was proposed for processing of the copolymer mass spectra. The key was to considerably reduce the number of mass peaks in order to facilitate peak assignment and calculation of the characteristic copolymer parameters. Our method was tested by evaluating of the MALDI-TOF MS spectra of various EO/PO copolymers. It was concluded that the short cut method determines very well the compositional properties of the Pluronic-type triblock copolymers. The simplification of the mass spectra keeps only two series (42 peaks in the example of this paper) that can be identified and assigned manually or by our previously reported MARA method. A large benefit of our method is that all the subsequent calculations can be implemented in a common spreadsheet application in a very plain and straightforward way. The construction of the composition drift plot merely requires a sophisticated spreadsheet implementation, but we propose a “easy to follow and apply” template for it in the electronic supplementary material. The proposed short cut method can also be applied for the analysis of other copolymers.

Supplementary Materials

The following supporting information can be downloaded at: https://www.mdpi.com/article/10.3390/pr10010042/s1, Figure S1. MALDI-TOF mass spectrum of sample RPE-1720-1, Figure S2. MALDI-TOF mass spectrum of sample PE-6100-1, Figure S3. MALDI-TOF mass spectrum of sample PE-6100-2, Figure S4. MALDI-TOF mass spectrum of sample RPE-1720-2, Figure S5. MALDI-TOF mass spectrum of sample PE-6200, Figure S6. MALDI-TOF mass spectrum of sample RPE-1740, Figure S7. MALDI-TOF mass spectrum of sample RPE-3110, Table S1. The constants of the polynomials originated from the intensities of isotopic peaks as a function of C atom number., Table S2. The constants of polynomials originated from the intensities of isotopic peaks as a function of O atom number.

Author Contributions

Conceptualization; Á.K., S.K., T.N., methodology; Á.K., G.R., A.N., T.N., data curation; Á.K., G.R., A.N., T.N., formal analysis; Á.K., G.R., A.N., T.N., supervision; Á.K., M.Z., S.K., T.N., visualization; Á.K., G.R., T.N., roles/writing—original draft; Á.K., T.N., writing—review and editing; Á.K., M.Z., S.K., T.N. All authors have read and agreed to the published version of the manuscript.

Funding

The work was supported by the Thematic Excellence Program (TKP2020-NKA-04) of the Ministry for Innovation and Technology in Hungary and by the grant No. FK-132385 from National Research, Development and Innovation Office (NKFI). T.N. also acknowledge the János Bolyai Research Scholarship of the Hungarian Academy of Sciences (BO/00212/20/7) and ÚNKP-21-05-DE-476 from the New National Excellence Program of the Ministry for Innovation and Technology.

Institutional Review Board Statement

Not applicable.

Informed Consent Statement

Not applicable.

Data Availability Statement

Data is contained within the article or supplementary material.

Conflicts of Interest

The authors declare no conflict of interest.

References

  1. Karas, M.; Hillenkamp, F. Laser desorption ionization of proteins with molecular masses exceeding 10,000 daltons. Anal. Chem. 1988, 60, 2299–2301. [Google Scholar] [CrossRef]
  2. Tanaka, K.; Waki, H.; Ido, Y.; Akita, S.; Yoshida, Y.; Yoshida, T.; Matsuo, T. Protein and polymer analyses up to m/z 100 000 by laser ionization time-of-flight mass spectrometry. Rapid Commun. Mass Spectrom. 1988, 2, 151–153. [Google Scholar] [CrossRef]
  3. Wong, S.F.; Meng, C.K.; Fenn, J.B. Multiple charging in electrospray ionization of poly(ethylene glycols). J. Phys. Chem. 1988, 92, 546–550. [Google Scholar] [CrossRef]
  4. Weidner, S.M.; Falkenhagen, J.; Bressler, I. Copolymer Composition Determined by LC-MALDI-TOF MS Coupling and “MassChrom2D” Data Analysis. Macromol. Chem. Phys. 2012, 213, 2404–2411. [Google Scholar] [CrossRef]
  5. Pasch, H. Hyphenated separation techniques for complex polymers. Polym. Chem. 2013, 4, 2628–2650. [Google Scholar] [CrossRef]
  6. Crotty, S.; Gerişlioğlu, S.; Endres, K.J.; Wesdemiotis, C.; Schubert, U.S. Polymer architectures via mass spectrometry and hyphenated techniques: A review. Anal. Chim. Acta 2016, 932, 1–21. [Google Scholar] [CrossRef] [Green Version]
  7. Wesdemiotis, C. Multidimensional Mass Spectrometry of Synthetic Polymers and Advanced Materials. Angew. Chem. Int. Ed. 2017, 56, 1452–1464. [Google Scholar] [CrossRef] [Green Version]
  8. Róth, G.; Nagy, T.; Kuki, Á.; Hashimov, M.; Vonza, Z.; Timári, I.; Zsuga, M.; Kéki, S. Polydispersity Ratio and Its Application for the Characterization of Poloxamers. Macromolecules 2021, 54, 9984–9991. [Google Scholar] [CrossRef]
  9. Fouquet, T.; Sato, H. Extension of the Kendrick Mass Defect Analysis of Homopolymers to Low Resolution and High Mass Range Mass Spectra Using Fractional Base Units. Anal. Chem. 2017, 89, 2682–2686. [Google Scholar] [CrossRef] [Green Version]
  10. Fouquet, T.N.J. The Kendrick analysis for polymer mass spectrometry. J. Mass Spectrom. 2019, 54, 933–947. [Google Scholar] [CrossRef]
  11. Suen, W.; Percy, J.; Hsu, S.L.; Kaltashov, I.A.; Stidham, H.D. Influence of Polyether Copolymer Configuration on Polyurethane Reaction: A Mass Spectrometry Analysis. Cell. Polym. 2003, 22, 23–42. [Google Scholar] [CrossRef]
  12. Terrier, P.; Buchmann, W.; Cheguillaume, G.; Desmazières, B.; Tortajada, J. Analysis of Poly(oxyethylene) and Poly(oxypropylene) Triblock Copolymers by MALDI-TOF Mass Spectrometry. Anal. Chem. 2005, 77, 3292–3300. [Google Scholar] [CrossRef] [PubMed]
  13. Engler, M.S.; Crotty, S.; Barthel, M.J.; Pietsch, C.; Knop, K.; Schubert, U.S.; Böcker, S. COCONUT—An Efficient Tool for Estimating Copolymer Compositions from Mass Spectra. Anal. Chem. 2015, 87, 5223–5231. [Google Scholar] [CrossRef]
  14. Montaudo, M.S.; Adamus, G.; Kowalczuk, M. Bivariate distribution in copolymers: A new model. J. Polym. Sci. Part A Polym. Chem. 2002, 40, 2442–2448. [Google Scholar] [CrossRef]
  15. Nagy, T.; Kuki, Á.; Zsuga, M.; Kéki, S. Mass-Remainder Analysis (MARA): A New Data Mining Tool for Copolymer Characterization. Anal. Chem. 2018, 90, 3892–3897. [Google Scholar] [CrossRef] [PubMed]
  16. Kuki, Á.; Nagy, T.; Hashimov, M.; File, S.; Nagy, M.; Zsuga, M.; Kéki, S. Mass Spectrometric Characterization of Epoxidized Vegetable Oils. Polymers 2019, 11, 394. [Google Scholar] [CrossRef] [Green Version]
  17. Nagy, T.; Kuki, Á.; Nagy, M.; Zsuga, M.; Kéki, S. Mass-Remainder Analysis (MARA): An Improved Method for Elemental Composition Assignment in Petroleomics. Anal. Chem. 2019, 91, 6479–6486. [Google Scholar] [CrossRef] [PubMed]
  18. Nagy, T.; Kuki, Á.; Hashimov, M.; Zsuga, M.; Kéki, S. Multistep Mass-Remainder Analysis and its Application in Copolymer Blends. Macromolecules 2020, 53, 1199–1204. [Google Scholar] [CrossRef]
  19. Nagy, T.; Róth, G.; Kuki, Á.; Zsuga, M.; Kéki, S. Mass Spectral Filtering by Mass-Remainder Analysis (MARA) at High Resolution and Its Application to Metabolite Profiling of Flavonoids. Int. J. Mol. Sci. 2021, 22, 864. [Google Scholar] [CrossRef]
  20. Liu, T.; Wu, C.; Xie, Y.; Liang, D.; Zhou, S.; Nace, V.M.; Chu, B. Amphiphilic polyoxyalkylene triblock copolymers: Self-assembly, phase behaviors, and new applications. In Associative Polymers in Aqueous Media; American Chemical Society: Washington, DC, USA, 2000; Volume 765, pp. 2–20. [Google Scholar]
  21. Yokoyama, M. Block copolymers as drug carriers. Crit. Rev. Ther. Drug Carrier Syst. 1992, 9, 213–248. [Google Scholar]
  22. Edens, M.W. Applications of polyoxyalkylene block copolymer surfactants. In Nonionic Surfactants Polyoxyalkylene Block Copolymers; Nace, V., Ed.; Taylor & Francis: Abingdon-on-Thames, UK, 1996; p. 26. [Google Scholar]
  23. Van Rooij, G.J.; Duursma, M.C.; de Koster, C.G.; Heeren, R.M.A.; Boon, J.J.; Schuyl, P.J.W.; van der Hage, E.R.E. Determination of Block Length Distributions of Poly(oxypropylene) and Poly(oxyethylene) Block Copolymers by MALDI-FTICR Mass Spectrometry. Anal. Chem. 1998, 70, 843–850. [Google Scholar] [CrossRef]
Figure 1. (a) MALDI-TOF mass spectrum of PPO–PEO–PPO copolymer with about 20 wt% EO content (RPE2520). (b) Zoomed MALDI-TOF mass spectrum showing the peak clusters around the most abundant peak.
Processes 10 00042 g001
Figure 2. (a) The MRPO vs. m/z and (b) MREO vs. m/z plots of the MALDI-TOF mass spectra of PPO–PEO–PPO copolymer with about 20 wt% EO content (RPE2520). The green and red horizontal lines illustrate the MARA filtering process.
Processes 10 00042 g002
Figure 3. Simplified mass spectrum as the result of our data reduction method of the MALDI-TOF mass spectrum of PPO–PEO–PPO copolymer with about 20 wt% EO content (RPE2520) (a) before and (b) after intensity correction. EO13POx and EOyPO36 represented by blue and red colors, respectively.
Processes 10 00042 g003
Figure 4. Composition drift plots of the PPO–PEO–PPO copolymer with about 20 wt% EO content (RPE2520) calculated by the short cut (red) and measured by the reference (blue) method. The size of the dots represents the sum of intensity correspond to each polymerization degree in logarithmic scale.
Processes 10 00042 g004
Table 1. List of the analyzed copolymers. EO content is provided by the vendor.
NameEO Weight Fraction (m/m %)Blocks
RPE 252020PPO-PEO-PPO
RPE 1720-120PPO-PEO-PPO
PE 6100-110PEO-PPO-PEO
PE 6100-210PEO-PPO-PEO
RPE 1720-220PPO-PEO-PPO
PE 620020PEO-PPO-PEO
RPE 174040PPO-PEO-PPO
RPE311010PPO-PEO-PPO
Table 2. Chemical composition of various triblock copolymers determined by the short cut and the reference method [8].
NameProcess MethodMnMwĐcEOwEOnnEOnwEOĐEOnnPOnwPOĐPO
RPE2520 reference 272727581.0110.2560.20712.613.21.0536.737.21.01
short cut 267826941.0060.2590.21012.713.31.0436.637.11.01
RPE1720 reference 210221421.0190.2990.24111.412.21.0626.827.51.03
short cut 208221021.0100.2990.24511.712.41.0626.727.41.03
PE6100 reference 180118631.0340.0720.0552.24.72.1428.629.51.03
short cut 162316751.0320.0710.0562.44.61.9327.328.31.04
PE6100 reference 193019751.0230.0910.0713.05.41.7830.230.91.02
short cut 176317991.0200.0910.0713.25.41.7029.630.61.03
RPE1720 reference 229123241.0150.3000.24512.513.31.0629.229.71.02
short cut 225922741.0070.3020.24812.813.41.0529.229.91.02
PE6200 reference 252825771.0190.3690.30717.419.81.1429.730.21.02
short cut 243124581.0110.3690.30917.219.31.1229.630.01.02
RPE1740 reference 244524681.0090.5100.44124.124.51.0223.123.61.02
short cut 238924011.0050.5090.44124.124.61.0222.823.31.02
RPE3110 reference 344034711.0090.2100.16812.913.71.0648.749.31.01
short cut 340234221.0060.2090.16712.813.41.0548.549.01.01
Publisher’s Note: MDPI stays neutral with regard to jurisdictional claims in published maps and institutional affiliations.

