Article

Plasma Surface Modification of Epoxy Polymer in Air DBD and Gliding Arc

by
Panagiotis Dimitrakellis
1,2,*,
François Faubert
1,
Maxime Wartel
1,
Evangelos Gogolides
2 and
Stéphane Pellerin
1,*
1
GREMI, Orleans University/CNRS, UMR 7344, CEDEX, F-18020 Bourges, France
2
Institute of Nanoscience and Nanotechnology, NCSR “Demokritos”, Aghia Paraskevi, 15341 Attica, Greece
*
Authors to whom correspondence should be addressed.
Processes 2022, 10(1), 104; https://doi.org/10.3390/pr10010104
Submission received: 30 October 2021 / Revised: 16 December 2021 / Accepted: 29 December 2021 / Published: 5 January 2022
(This article belongs to the Section Chemical Processes and Systems)

Abstract

:
We studied the epoxy polymer surface modification using air plasma treatment in a Gliding Arc (GA) plasma reactor and a pulsed Dielectric Barrier Discharge (DBD). We employed optical emission spectroscopy (OES) measurements to approximate the vibrational and rotational temperatures for both plasma sources, as well as surface temperature measurements with fiber optics and IR thermography to corelate with the corresponding hydrophilization of the epoxy material. Water contact angle measurements revealed a rapid hydrophilization for both plasma sources, with a slightly more pronounced effect for the air DBD treatment. Ageing studies revealed stable hydrophilicity, with water contact angle saturating at values lower than 50°, corresponding to a >50% decrease compared to the untreated epoxy polymer. ATR-FTIR spectroscopy studies showed an additional absorption band assigned to carbonyl group, with its peak intensity being higher for the DBD treated surfaces. The spectra were also correlated with the surface functionalization via the relative peak area ratio of carbonyl to oxirane and benzene related bands. According to SEM imaging, GA plasma treatment led to no apparent morphological change, contrary to DBD treatment, which resulted in nano-roughness formation. The enhanced surface oxidation as well as the nano-roughness formation on epoxy surface with the air DBD treatment were found to be responsible for the stable hydrophilization.

1. Introduction

Epoxy most commonly refers to the thermosetting polymer coming from the curing (cross-linking) of epoxy resins (polyepoxides). Epoxy polymers exhibit outstanding mechanical strength as well as high thermal and chemical resistance and they are extensively used as insulating materials in electrical/electronic equipment, bonding materials and adhesives, fiber-reinforced composite materials, printed circuit boards (PCBs), and marine coatings [1,2,3].
Surface modification is often required for epoxy polymer to enhance its functionality. Cold plasma treatment has been widely applied for surface functionalization of polymeric materials as it represents a versatile and environmentally friendly technique, able to tailor the surface properties of the polymer without affecting its bulk. Atmospheric pressure plasmas are specifically attractive due to the potential for rapid, uniform, and cost-effective continuous processing of polymers and composites [4,5,6,7,8,9,10]. Several plasma sources operating in atmospheric pressure have been proposed such as corona discharges [11,12], plasma jets [13,14], hollow cathode discharges [15,16], dielectric barrier discharges (DBDs), [17,18,19,20] and gliding arcs [21,22]. The last two configurations are very promising for polymer surface modification as they can operate effectively in air without compromising the treatment uniformity [23,24,25,26,27].
Contrary to the vast literature in thermoplastic materials (mostly polyolefins), only a few works have reported on atmospheric pressure plasma treatments of epoxy-based materials. Some of those studies focus on the hydrophobic treatments of epoxy resin to enhance its insulation performance [28,29]. Hydrophilic surface modification has also been studied in fiber reinforced epoxy composites for enhancement of their adhesion properties [30,31,32]. Concerning the epoxy polymer modification, Sangprasert et al. applied atmospheric pressure plasma jet in different gas mixtures and obtained the optimum wettability using helium/nitrogen discharges [33]. Shao et al. applied air DBD and managed an intense hydrophilization of epoxy resin, which translated into a sharp drop of water contact angle from about 101° to about 12°; however, no ageing data are presented to evaluate the stability of the hydrophilic treatment [34].
Although the air DBD plasma treatment has emerged as a promising means of epoxy surface modification, the study of other air-based plasma sources like Gliding Arcs has hardly been explored. In our preliminary work, we studied the surface modification of epoxy resin using Gliding Arc discharges in dry air and we showed the potential for rapid hydrophilization [35]. Herein, we investigate the plasma treatment on epoxy surface with two plasma sources, i.e., a Gliding Arc reactor fed with dry air and a newly designed, ambient-air pulsed DBD. Aiming to assess the thermal effect of the different plasmas on the treated surfaces, we initially perform an in-depth optical emission spectroscopy (OES) analysis to approximate the gas temperature, and corelate with the temperature measurements conducted with optical fiber and IR thermography. We investigate then the water contact angle (WCA) evolution and stability, and we apply Fourier transform infrared (FTIR) analysis and scanning electron microscopy (SEM) to record the effect of the different plasma treatments on the epoxy surface chemistry and morphology, respectively.

2. Experimental Details

2.1. Materials

Commercial Bisphenol A diglycidyl ether (DGEBA) epoxy/glass fiber reinforced composite was used in this study. All samples were cut into small pieces (24 × 14 mm area and 3 mm thickness) and were cleaned with deionized (DI) water and isopropyl alcohol prior to plasma treatment.

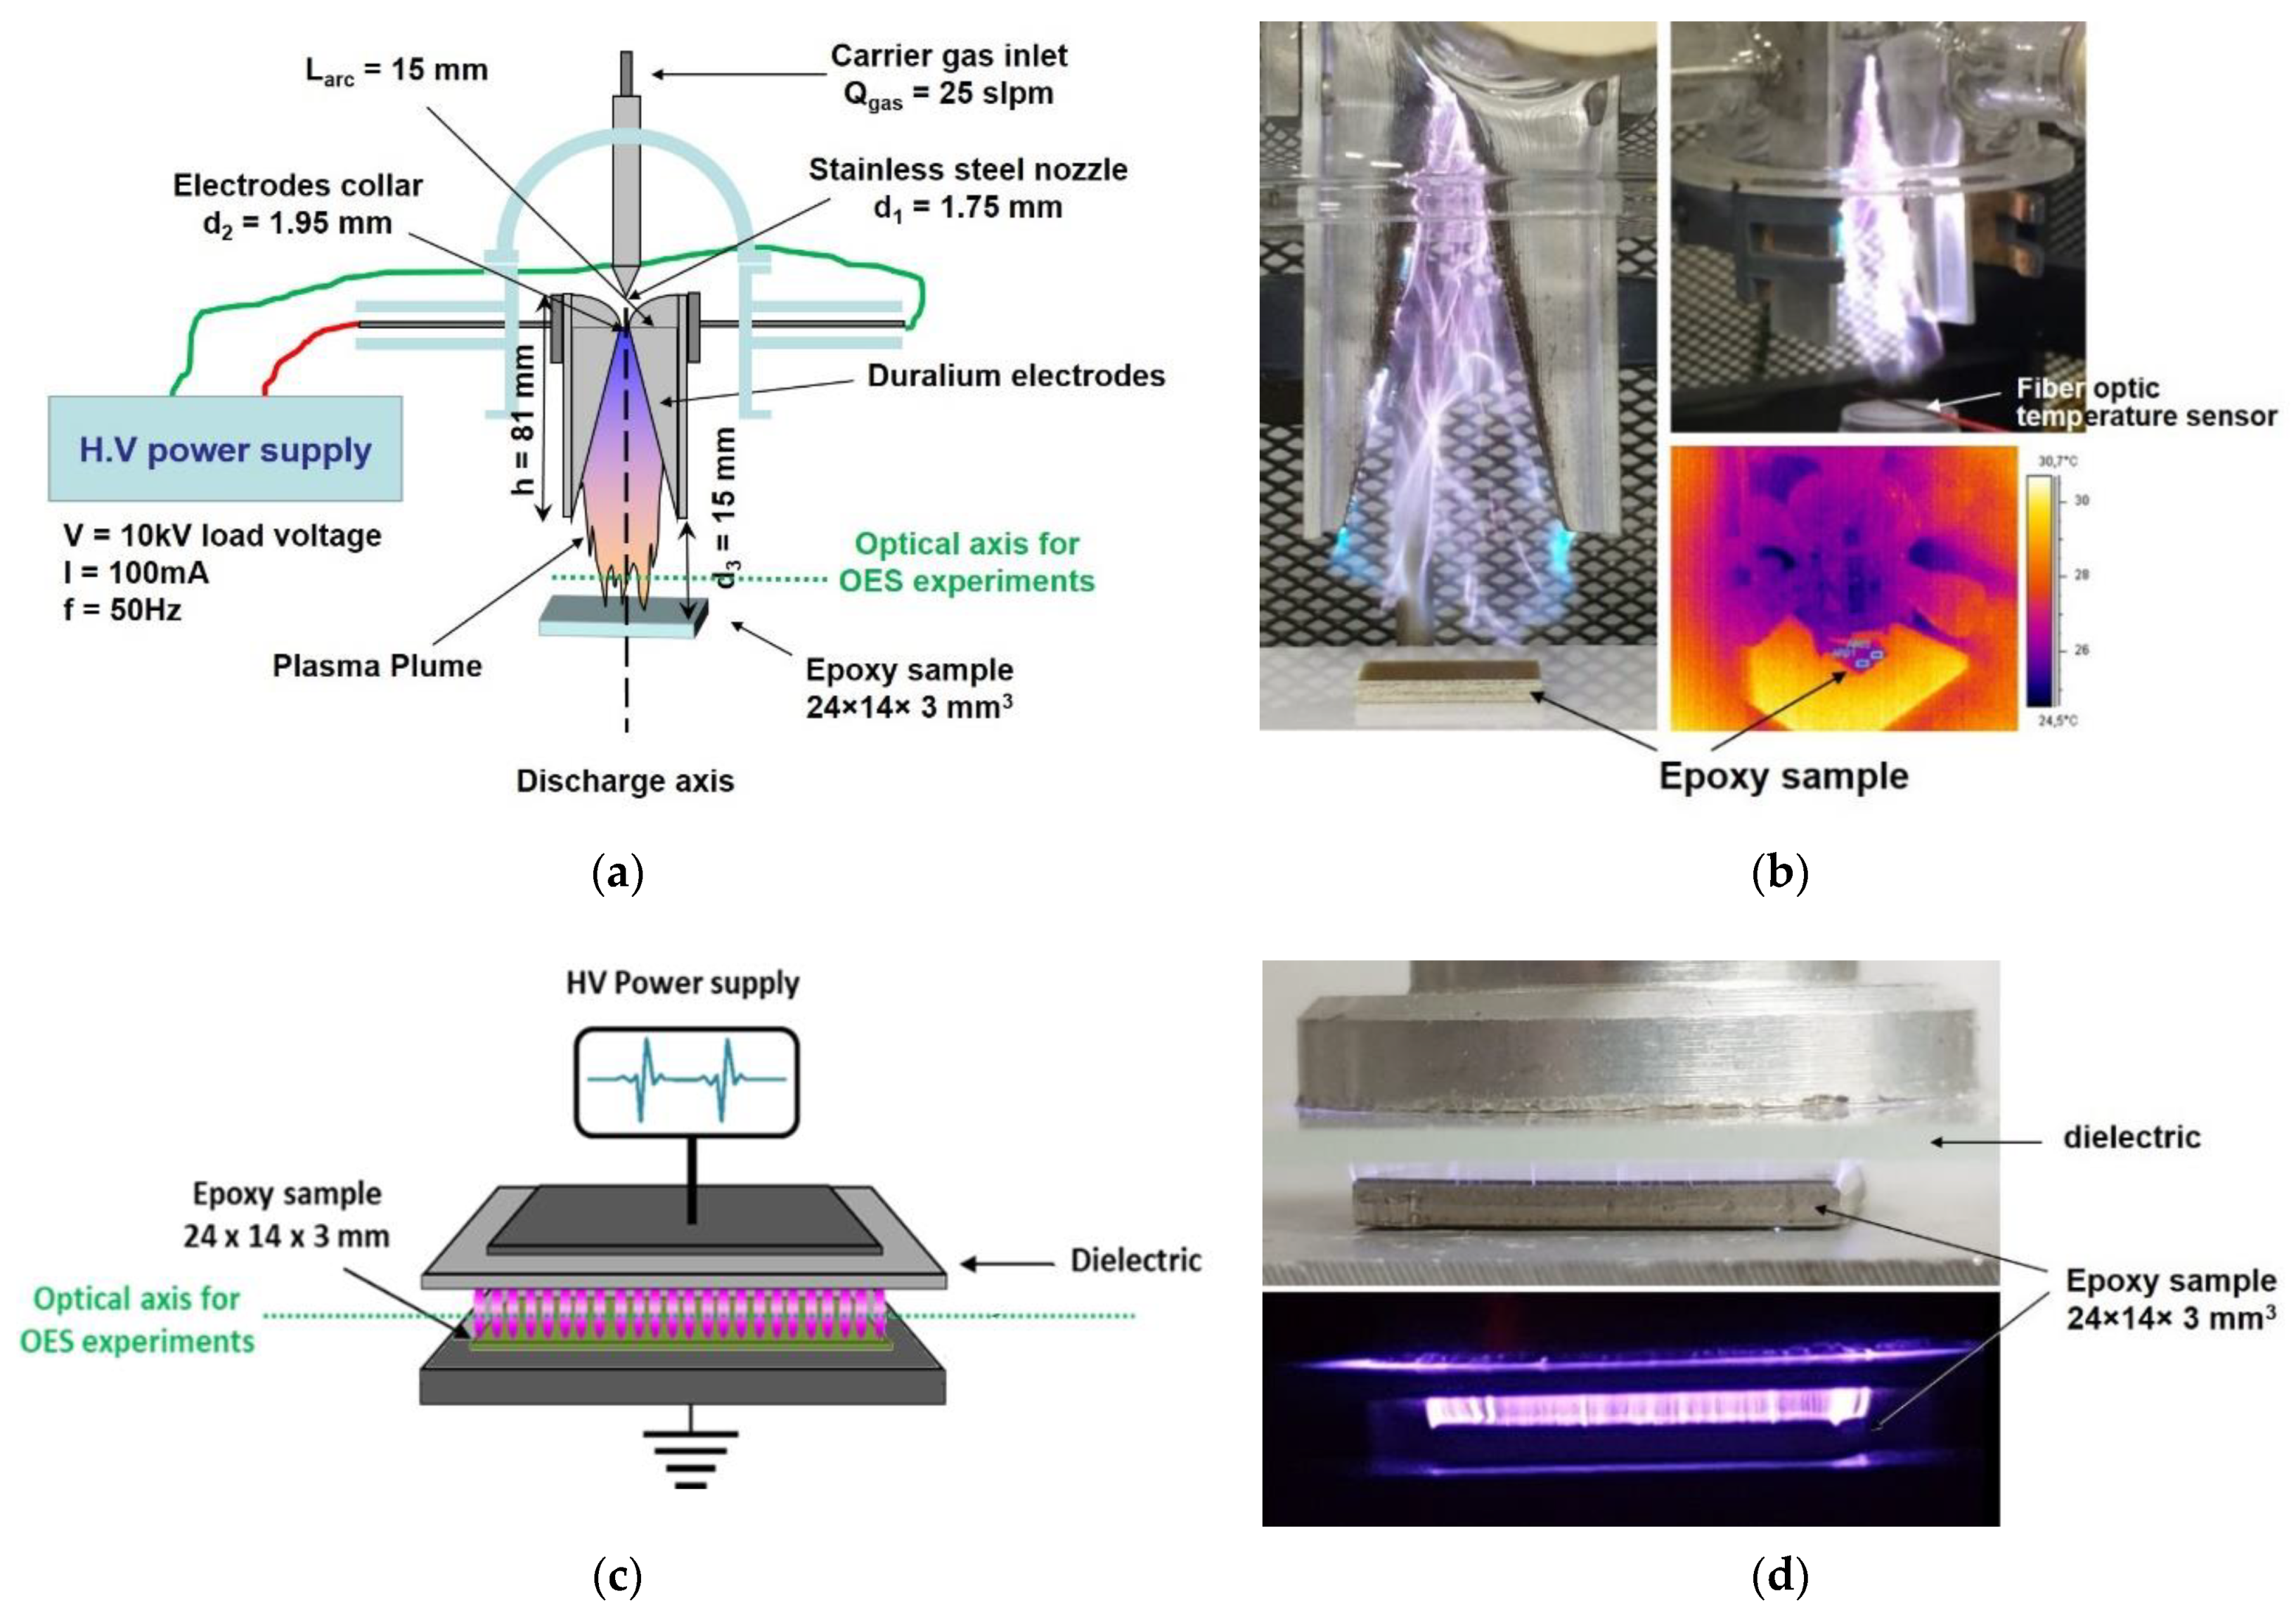
2.2. Atmospheric Plasma Treatment

The experiments in this study were performed using two different plasma reactors operating in dry air at atmospheric pressure: a Gliding Arc reactor and a Dielectric Barrier Discharge (DBD).
Figure 1a,b presents the Gliding Arc reactor, which comprises two divergent blade-shaped electrodes subjected to a high voltage power supply (AC 50 Hz, 100 mA, 10 kV peak-to-peak for no-load voltage). Dry air is injected at the top of the reactor at a constant flow rate of 25 standard liters per minute (slpm). The high voltage applied to the electrodes creates a small diameter plasma channel in which reactive species are generated and pushed downstream of the discharge by the high air flow. The arc voltage progressively increases until it attains the breakdown voltage value of the starting gap: a new arc appears at the bottom of the reactor, which extinguishes the first arc at the top of the electrodes, so that the Gliding Arc is periodically submitted to the ignition–lengthening–extinction cycle. More details about the source configuration can be found elsewhere [35]. Epoxy samples were placed downstream at a fixed distance of 15 mm from the reactor nozzle so that successive discharges impinge on the surface (direct treatment).
Figure 1c,d show the open-air dielectric barrier discharge (DBD) reactor. The configuration is a typical parallel-plate DBD where 1 mm thick glass plate was used as dielectric barrier in the high voltage electrode. The filamentary discharge was driven through a home-made pulsed power supply delivering high voltage (HV) pulses of 15 kV at 500 Hz frequency (pulse duration of the order of 1 ms), applied across the parallel electrodes. The discharge operated in ambient air (20% relative humidity at 19 °C) and the epoxy samples were placed at the bottom (grounded) electrode inside the discharge (direct treatment) with the distance between the HV electrode and the epoxy surface fixed at 2 mm.

2.3. Optical Emission Spectroscopy (OES)

Optical emission spectroscopy (OES) measurements were conducted for both plasma sources. Emission spectra in the UV–visible region were recorded through a 10 μm optical fiber connected to a Czerny Turner Spectrometer (ACTON SP2750i, ACTON, Hong Kong, China) equipped with different gratings and an iCCD camera (Princeton instrument PIMAX Gen2, Princeton Instrument, Inc., Trenton, NJ, USA) in its outlet. The entrance slit of the spectrometer was set to 15 µm, allowing for a high spectral resolution. The detailed experimental setup for the OES measurements in the Gliding Arc is shown in Figure S1. The less selective 150 grooves/mm grating was employed to record the wide-band spectrum (200–800 nm), whilst a 1200 grooves/mm holographic grating, representing a good compromise in terms of sensitivity and selectivity for spectroscopic analysis (spectral resolution Δλ < 0.05 nm between two adjacent points of the spectrum), was used to record high resolution spectra at the UV region.
Rotational (Trot) and vibrational (Tvib) temperatures of the two plasma discharges were estimated by fitting the experimental spectra with the commercial software Specair® (Specair, Rhode-Saint-Genèse, Belgium), calculating theoretical emission spectra based on excitation equilibrium of the molecular and atomic species. Then, the code uses Boltzmann distributions at the electronic, vibrational, and rotational temperature to determine the population of the internal energy levels and compute global emission spectra of plasma radiation [36]. The plasma generated in such discharges at atmospheric pressure induces efficient low energy transfer and fast relaxation processes due to the high collision frequency leading to near complete equilibrium in the rotational and vibrational states. The calculated rotational temperature approximates the translational temperature of the neutral gas (Tgas) in the vicinity of the treated epoxy samples.

2.4. Temperature Measurements

The temperature Tgas of the ambient gas close to the surface was determined using a fiber optic temperature sensor (FOTEMP-FTH from Optocon, Dresden, Germany) equipped with a non-conductive fiber optic temperature probe TS3, able to record temperature in in presence of high electromagnetic interference (resolution: 0.1 °C, system-accuracy for instrument and probe, ± 1 °C in the temperature range 0–300 °C, and time constant <2 s in case of temperature fluctuations). The measurements were performed with the probe almost in contact with the sample surface (See Figure 1b for the case of Gliding Arc reactor). The gas temperature was found to increase rapidly upon discharge initiation, reaching asymptotic value after ~15 s.
In the case of Gliding Arc, it is possible to have optical access to the discharge as well. Hence, the surface temperature Tsurf of the sample was also measured via infrared thermography, using a ThermaCAM-S 45 infrared camera from FLIR SYSTEMS (temperature range −40° C to +120° C, accuracy: ±2%). The camera is controlled by the ThermaCAM RESEARCHER-2.8 SR-1 software that allows the temporal evolution of the mean temperature of the sample surface during processing to be recorded. The emissivity ε ~0.94 of the epoxy was predetermined using a calibrated thermoemissive tape adjusted to its surface. Upon discharge ignition the surface temperature increases very rapidly for ~1 min, and then slows down stabilizing at an asymptotic value after 4 min plasma treatment (see Figure S2).

2.5. Surface Characterization

Water contact angle (WCA) measurements were performed via a homemade apparatus based on a digital camera focused on the nozzle of a 50 µL Hamilton syringe that delivers manually 5 µL DI water droplets. The contact angle was determined by using the free software “Image J” and every measurement was the average of three measurements at different positions on sample surface.
The surface chemistry of the treated samples was investigated via Fourier Transform Infrared (FTIR) Spectroscopy (Thermo Scientific Nicolet iS10, Thermo Scientific, Waltham, MA, USA) using an Attenuated Total Reflectance (ATR) module (Smart Omni Sampler). Three different samples were treated for the same condition, and for each sample FTIR measurements were carried out at three different positions on the sample surface. In turn, each FTIR spectrum obtained for one plasma treatment condition corresponds to an averaging of 100 elementary spectra.
Epoxy surface morphology was observed by scanning electron microscope (SEM) (Zeiss Sigma 300, Zeiss, Jena, Germany). Prior to SEM imaging, all samples were sputter-coated with gold in argon plasma for 140 s. All images were recorded at 5 kV to minimize the electron energy.

3. Results and Discussion

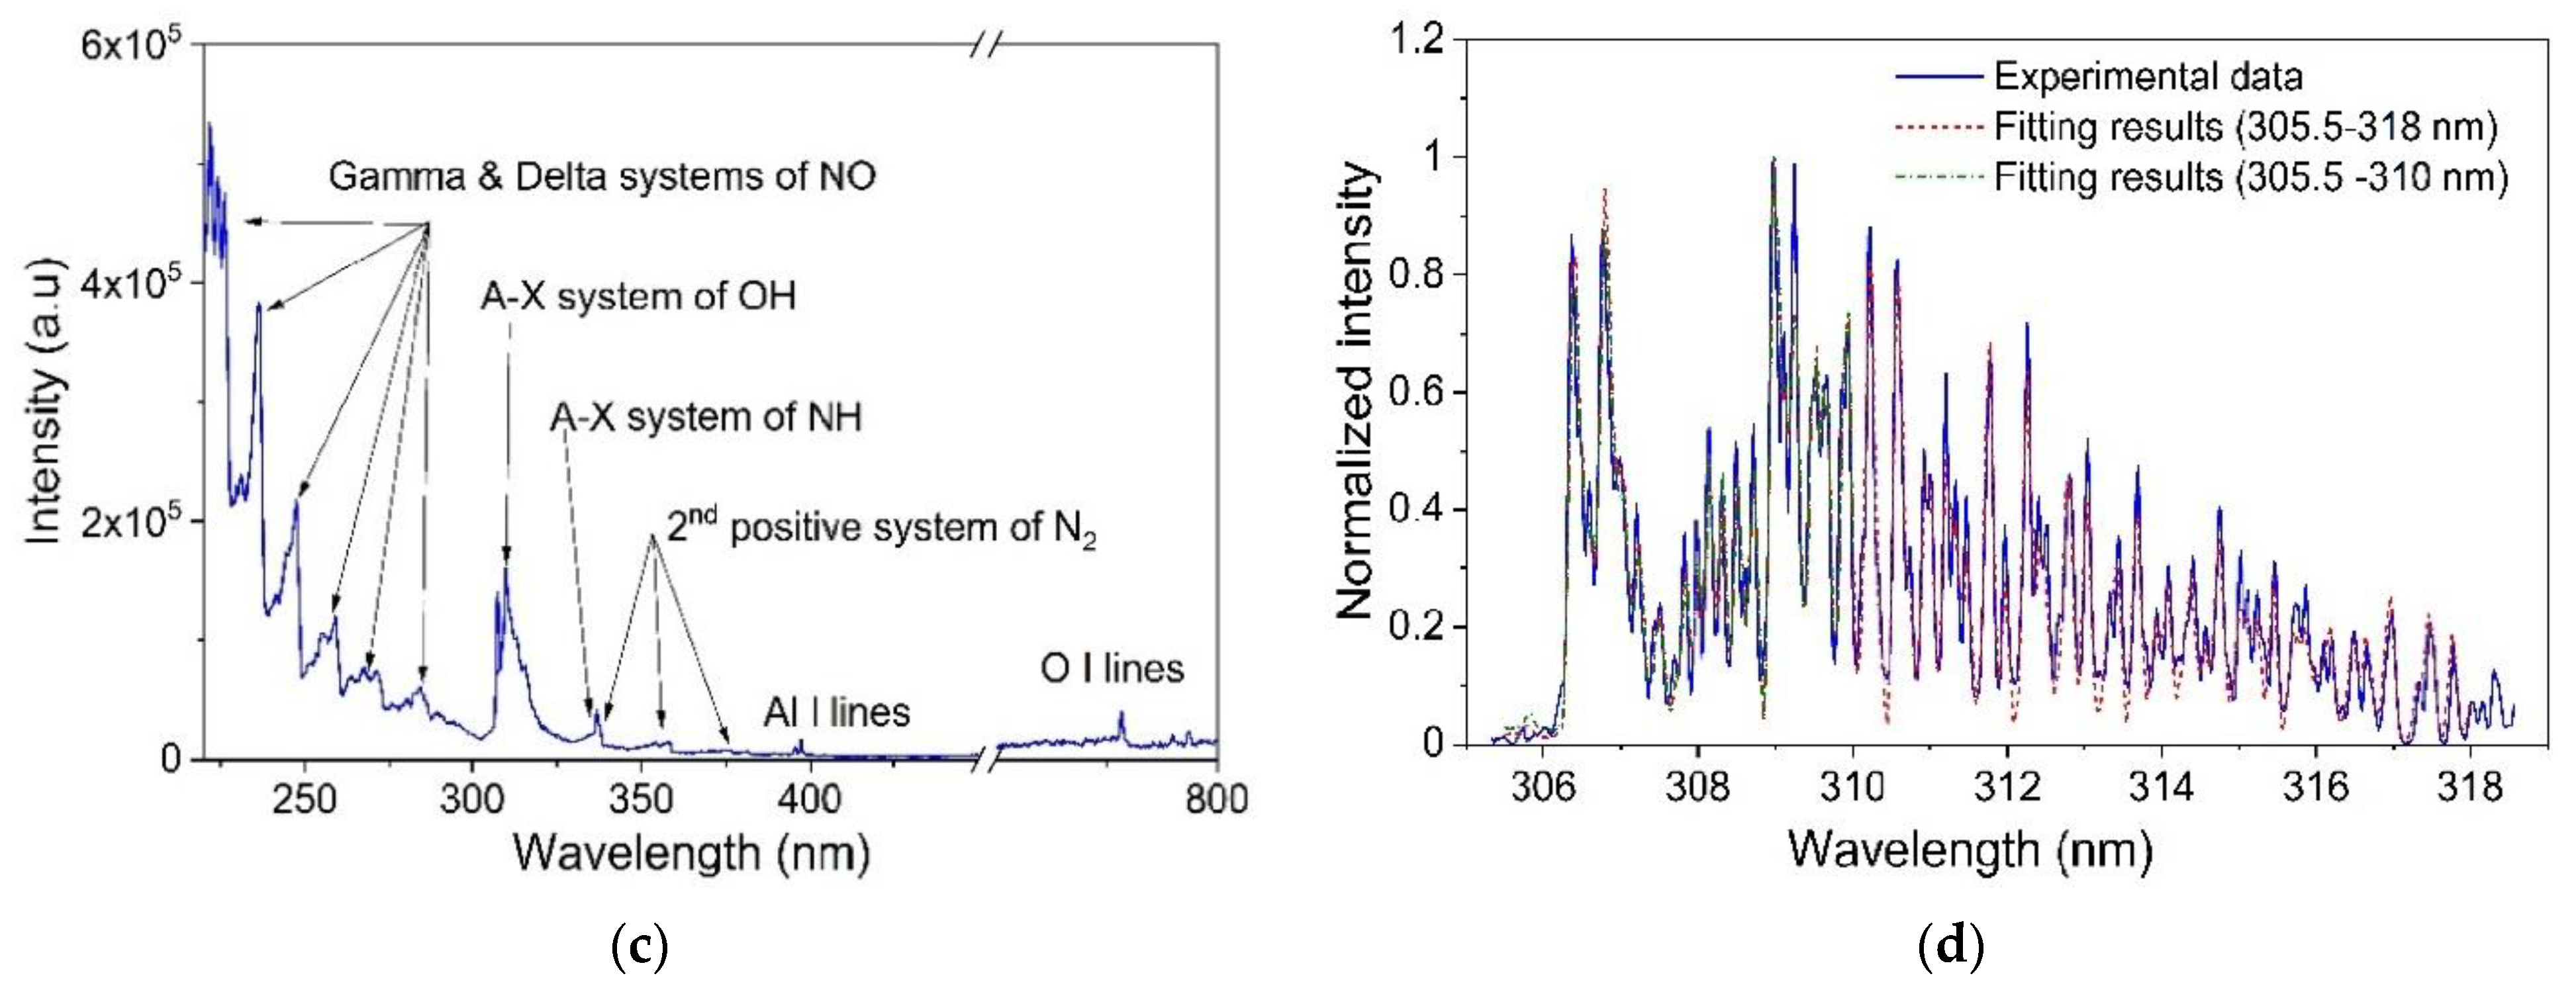
3.1. Optical Emission Spectroscopy

The OES experiments for the DBD plasma were performed along the horizontal axis in the 2 mm gap between the HV electrode and the epoxy surface. The wide-band measurements showed no peak appearing above 450 nm; thus, we focused on the spectral region 250–450 nm. As shown in Figure 2a, the emission spectrum is over dominated by the second positive system (SPS) N2(C-B) molecular ro-vibrational bands in the 300–410 nm range [37,38,39]. The OH(A-X) molecular band in the 306–310 nm range was also detected; however, its intensity was too low compared to the N2(C-B). Thus, the vibrational (Tvib) and rotational (Trot) temperatures were determined for N2(C). The results for the Δν = −1 vibrational band presented in Figure 2b show a relatively good agreement between the experimental data and the theoretical spectrum, suggesting that the excitation equilibrium is reached for both rotational and vibrational levels in the DBD plasma. The vibrational and rotational temperatures have been estimated as Tvib = 3145 ± 100 K and Trot = 605 ± 50 K, respectively. The significant difference between rotational and vibrational temperature indicates that the DBD plasma does not have sufficient relaxation processes to reach a local thermal equilibrium (LTE) in these experimental conditions.
For the Gliding Arc the OES experiments were carried out along the discharge axis as shown on Figure S1. According to previous results in similar conditions [35], significant variations in the plasma composition and temperatures were clearly observed along the discharge axis. In this study the OES was performed at the 15 mm gap between the electrode base and the sample surface. The wide-band spectrum over the UV–visible spectral region (220–800 nm) presented in the Figure 2c is characterized by the presence of both atomic lines and molecular structures. A doublet of the Al I atoms coming from erosion of the electrodes at 394.4 and 396.2 nm and the usual triplet of the O I atoms close to 777 nm are observed [40]. The high intensity peaks in the 220–280 nm spectral range correspond to the Gamma and Delta systems of the NO radicals, [37,38,39] whilst the intense band at 300–320 nm accounts for the OH(A-X). Low intensity emission bands corresponding to NH(A-X) at 336 nm and N2(C-B) were observed as well.
The emission spectrum for the Gliding Arc plasma provides interesting possibilities for analysis based on several emissive species; however, several limitations were observed during the analysis. The atomic lines presented herein cannot bring any useful information about the plasma and NO bands in the UV region were not considered as well due to the lack of knowledge about the NO mole fraction, the electron temperature, or the electron density. Experiments with the 1200 grooves/mm grating showed an overlap between N2 and NH vibrational bands around 336 nm, hindering any temperature calculation without the knowledge of electron density and temperature. Therefore, we focused our analysis on the OH(A-X) transition at 300–320 nm and the Δν = −1 and −2 vibrational bands of N2(C-B) at 340–385 nm.
The molecular emission spectra of the 306.36 nm OH band allows to roughly estimate the rotational temperature from the ratio of several well isolated rotational lines, knowing the apparatus function [41,42]; such a procedure allows to get Trot ≈ 3928 ± 455 K. The calculation of Trot based on the fit of the OH(A-X) band with Specair® software is more difficult due to the weak overlap with N2 (C-B) and probably the presence of other Al I atomic lines [37,38,39,40]. An example of fitting curves is presented on the Figure 2d. A comparison was performed for different wavelength range used in the fitting process and results showed only a slight change on the Trot values (see Table S2); however, the most representative temperature values were assumed for the narrow spectral range (305.5 to 310 nm). Additional calculations for the N2(C-B) vibrational bands for the Δν = −1 resulted in a similar value of Trot = 3508 ± 800 K. All the calculated Trot values are compatible with each other and consistent to those measured in a previous study [35]. Estimation of Tvib values is discussed in Supplementary Material and values are also shown in Table S2. Based on our estimations, Gliding Arc plasma also has sufficient thermal energy transfer to ensure an equilibrium in the rotational states highlighting at minima a partial equilibrium.
The weighted average values of the estimated Trot and Tvib, as well as the measured values of the Tgas with the optical fiber and IR thermography are summarized in Table 1. The translational temperature of a discharge, i.e., the gas temperature Tgas, strongly influences the plasma chemistry (e.g., reaction rates among heavy particles) in the plasma region and, thus, close to the epoxy surface. In highly collisional regime it approximates the Trot, assuming a rapid rotational–translational relaxation [43], but this assumption is not always valid in non-thermal plasmas [44], and its determination from emission spectra should be done with caution. This was verified in a Gliding Arc by Zhu et al. [45], who showed that the translational temperature of the discharge, measured directly by planar laser-induced Rayleigh scattering, was significantly lower than the rotational temperature, showing that the degrees of freedom of translation and of rotation are far from equilibrium in this type of discharge. That discrepancy was also observed here since the direct measurement of Tgas was lower than the Trot (Table 1). The more or less accurate gas temperature values assimilated to the thermal temperatures highlight the non-thermal character of the plasma and thermal effect cannot explain the surface modification of the sample. In case of Gliding Arc plasma, one would expect the enhanced radical production associated with a higher rotational temperature should induce a significant effect on surface modification on the sample by thermal effect or chemical reactivity. However, the high value of the gas flow rate and the blowing effect on the surface of the sample make it possible to maintain a relatively low average gas temperature in the vicinity of the epoxy sample, and thus protect it from heating.

3.2. Surface Analysis

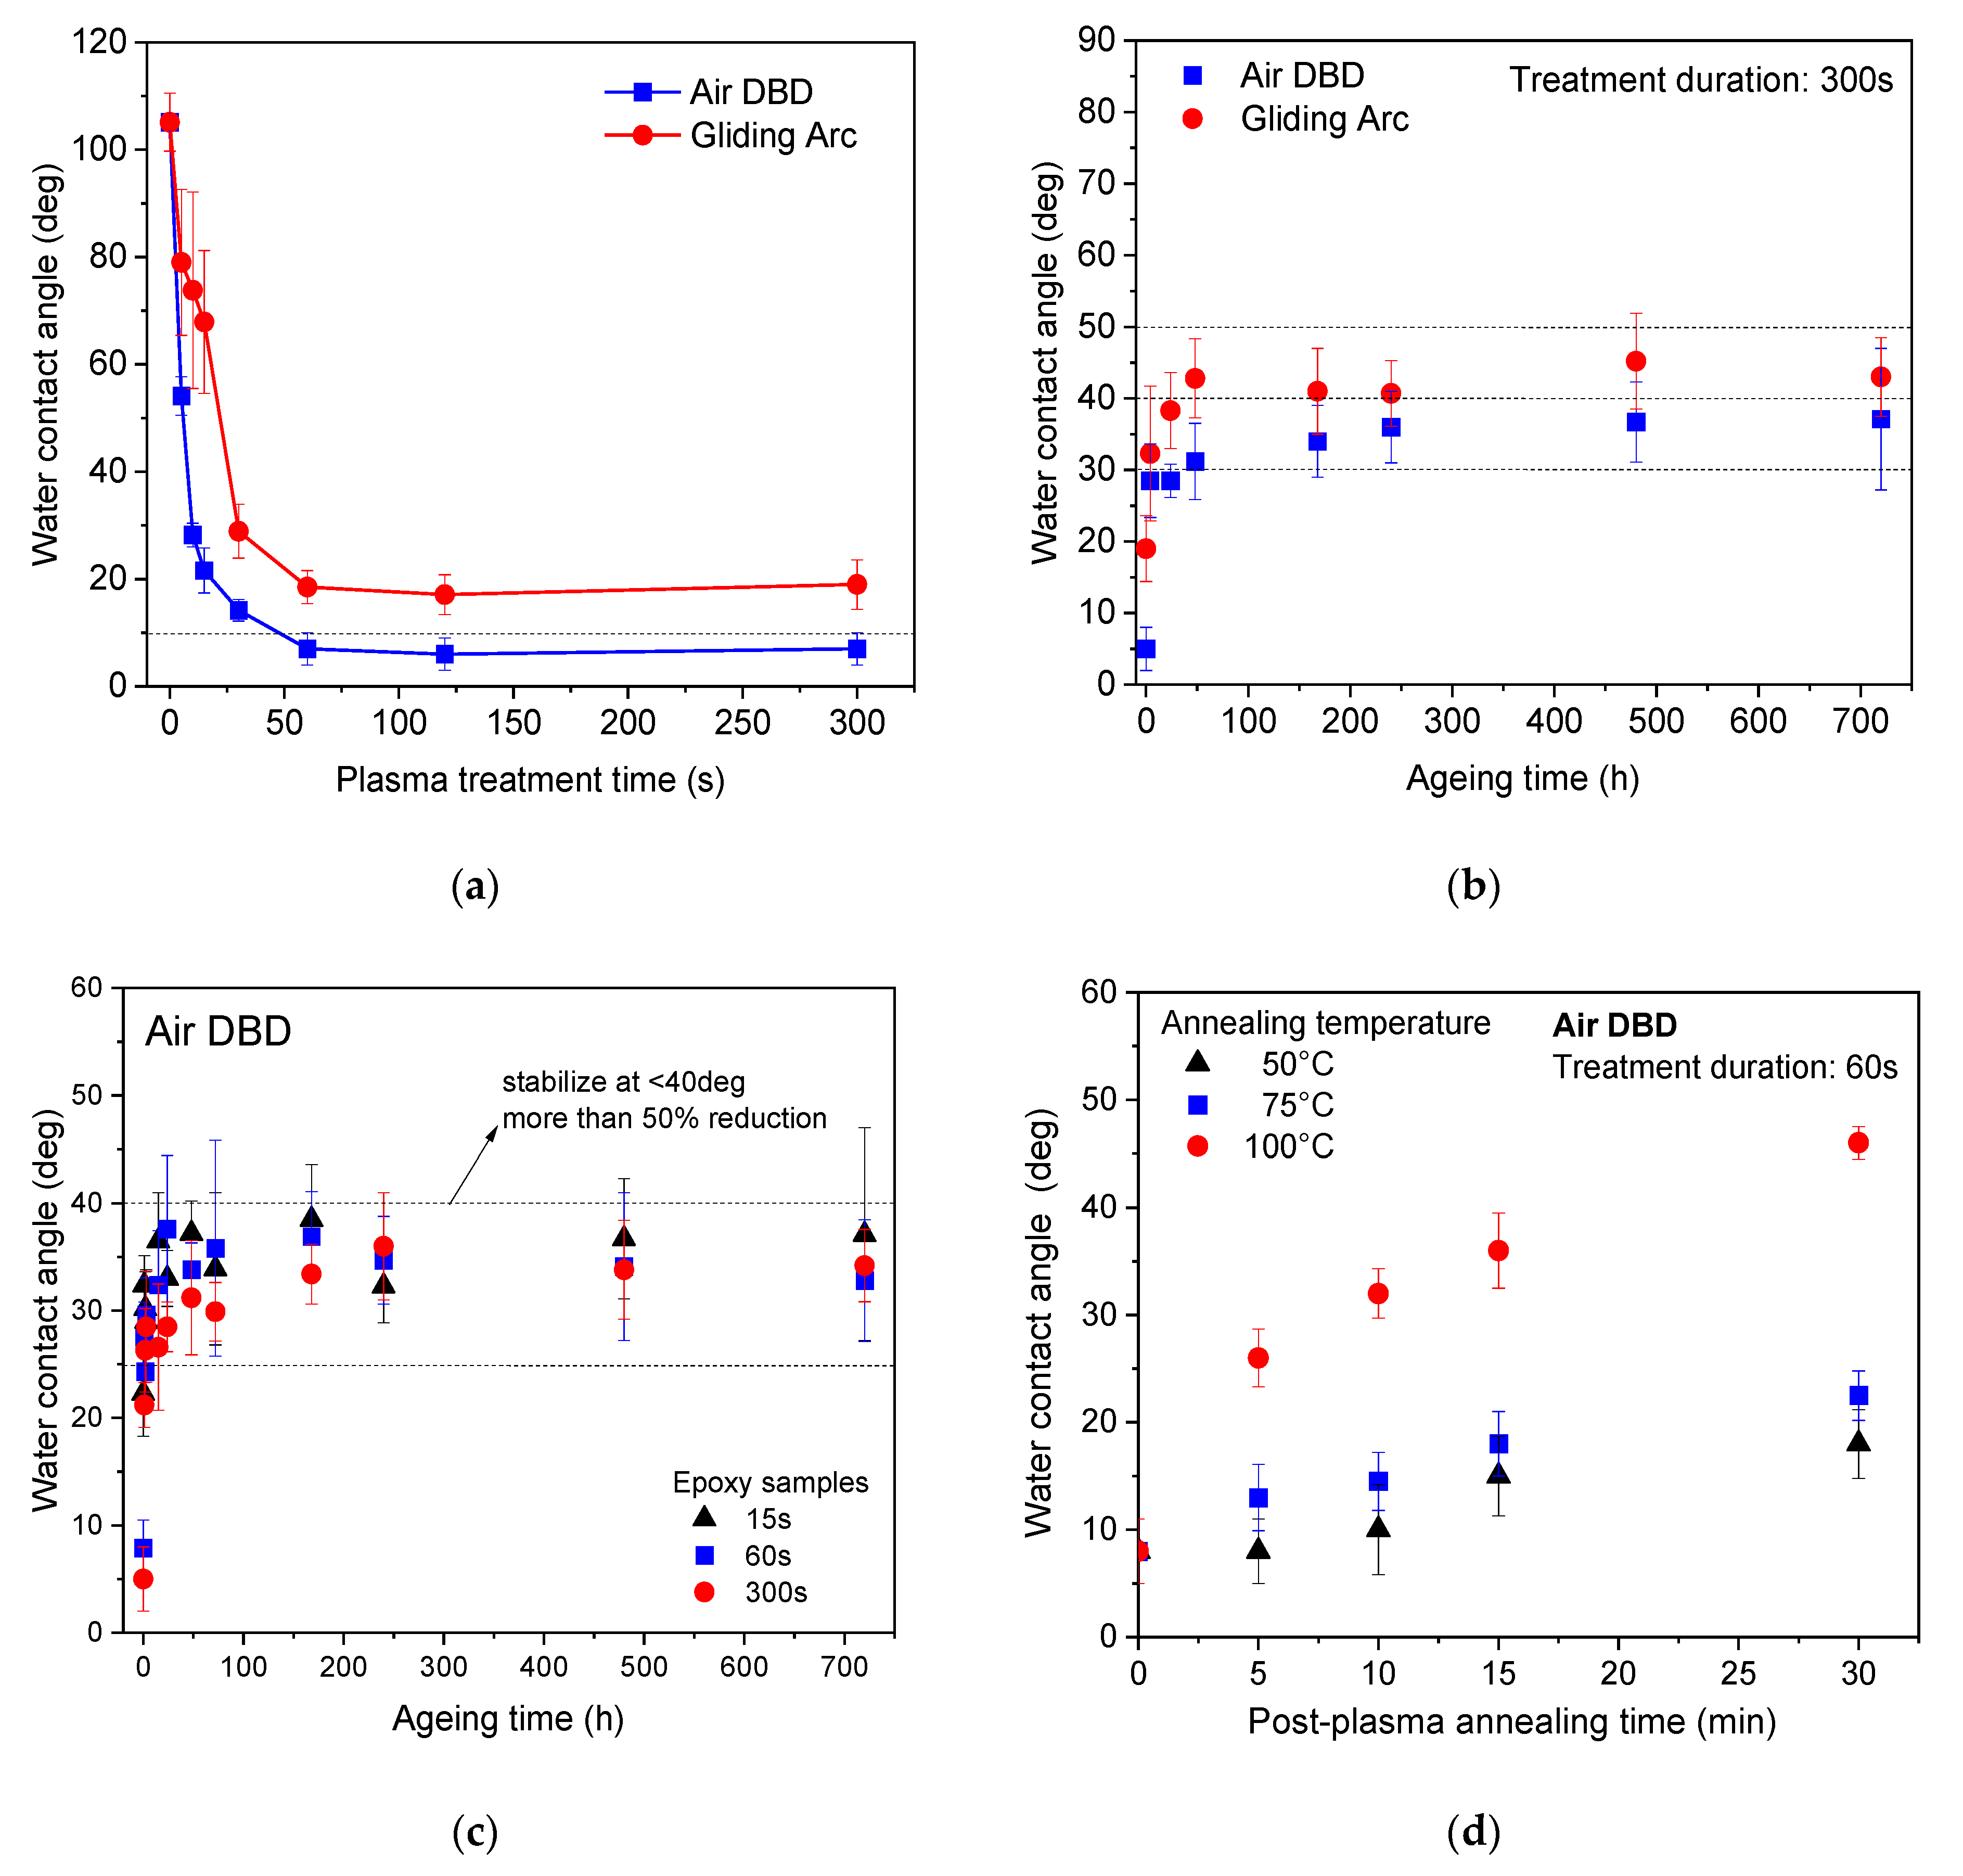
3.2.1. Water Contact Angle

Figure 3a shows the evolution of the water contact angle (WCA) of epoxy surface as a function of the plasma treatment time for the air DBD and the Gliding Arc plasma source. We observe the rapid hydrophilization of the epoxy surface, with this being more pronounced in case of air DBD, where the water contact angle drops to ~55° (less than half compared to the untreated) in 5 s treatment. Moreover, with the air DBD we obtain also superhydrophilic surfaces as evidenced by the very low (<10°) contact angles after 60 s treatment. For both treatments, the contact angle saturates after 60 s treatment.
Figure 3b presents the corresponding comparison of air DBD and Gliding Arc treatments concerning the hydrophilization stability upon ageing, as derived from the contact angle variation with storage time in ambient conditions for 300 s plasma treated samples. We observe a rapid increase in water contact angle after treatment, even in one hour, which saturates to values between 30° and 50° after 24 h of storage for both plasma treatments. Stabilized values are more than 50% lower than the contact angle value of the untreated surface, signifying the suitability of both atmospheric plasma processes in preparing stable hydrophilic epoxy surfaces. Moreover, the time dynamic of hydrophilization maintenance seems similar between the two plasma treatments, even if the air DBD treatment leads to slightly lower stabilized contact angles compared to Gliding Arc.
In Figure 3c, we are investigating the effect of plasma treatment time on the WCA behavior upon storage. We realize that for all plasma treatment durations, namely, a short (15 s—long before saturation), an intermediate (60 s—beginning of saturation) and a long (300 s—long after saturation), the stabilized contact angle values fluctuate between 25° and 40°. Considering the relatively high error of such measurements, one can conclude that the plasma treatment time is not so critical for the air DBD treatment and a stable hydrophilization can be obtained even for very short treatments.
Figure 3d shows the accelerated ageing of WCA upon storage at elevated temperatures. Namely, the epoxy samples treated with DBD plasma for 60 s (corresponding to blue rectangles in Figure 3c for room temperature ageing) were placed in a furnace at 50, 75, and 100 °C for 15 and 30 min. WCA measurements showed a rapid decrease in hydrophilicity, which became more significant at higher temperature values. The surface heating leads to rapid diffusion of chemisorbed functional groups into the bulk of the epoxy material, as well as a rapid desorption of weekly bound polar groups. However, even after 30 min of annealing at 100 °C the WCA is still in the order of 40°, way lower than the initial value; therefore, the air DBD treatment can lead to a prolonged and stable functionalization of the epoxy material. The hydrophobic recovery under thermal stress, could also explain the higher contact angle values with the treatment by Gliding Arc compared to DBD, possibly due to the higher heating of the surface of the sample during treatment.

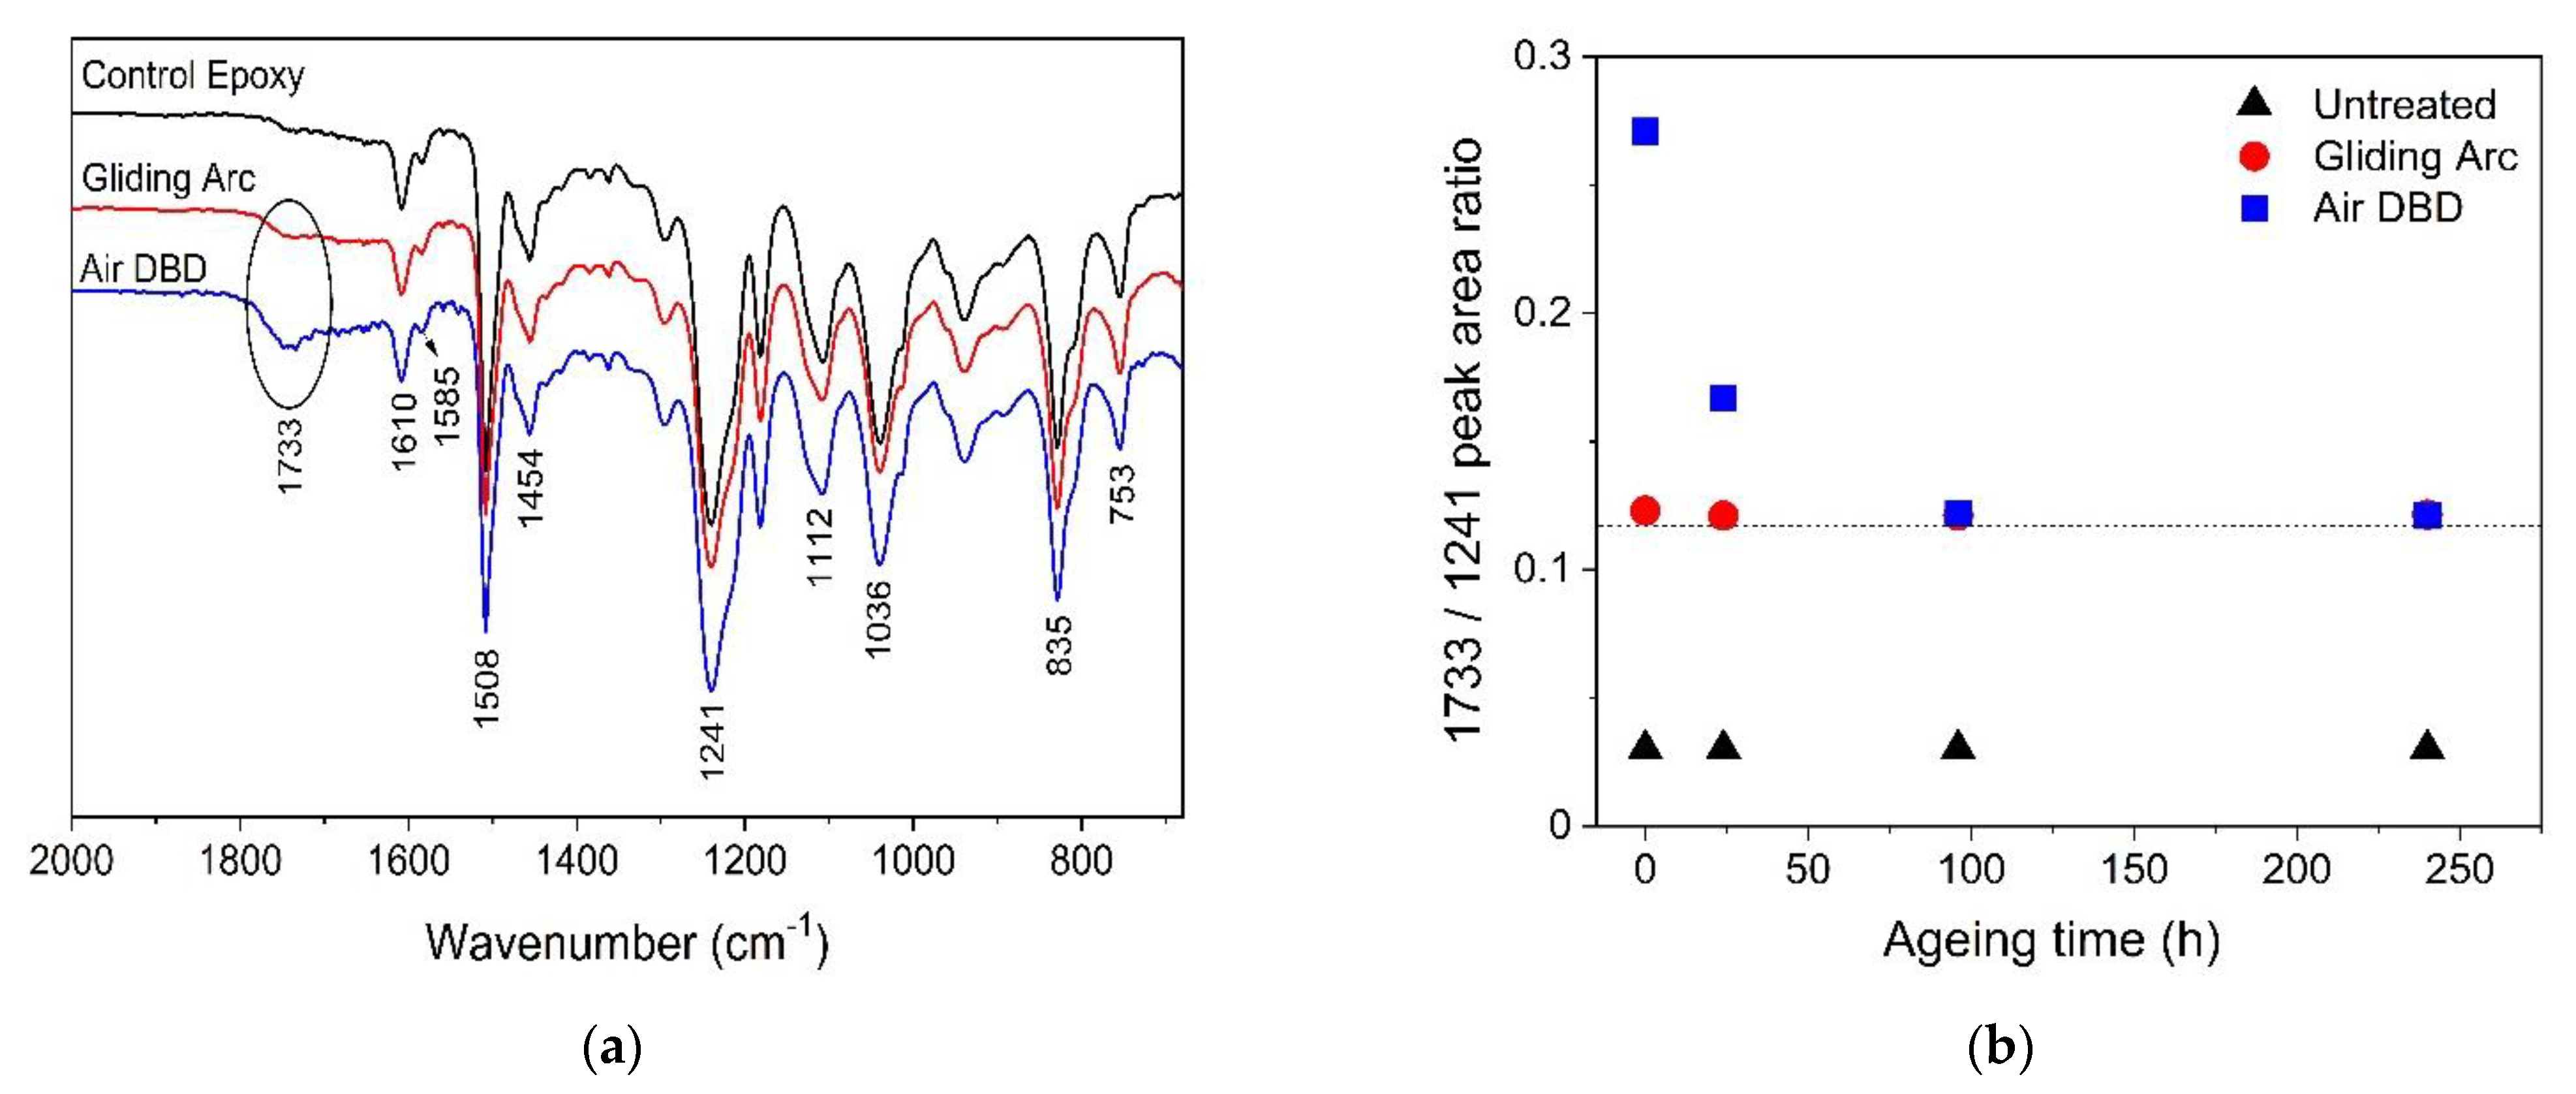
3.2.2. Surface Chemistry

The effect of plasma treatment on epoxy surface chemistry for the two plasma sources was evaluated through ATR-FTIR measurements. The ATR-FTIR spectra of the untreated and 300 s plasma treated epoxy samples are presented in Figure 4a. We identified all the characteristic absorption bands related to epoxy polymer [35,46,47]. The bands at 1610 and 1585 cm−1 are assigned to C-C stretching and the bands at 1508 and 1454 cm−1 to C=C stretching vibration in the benzene ring. The bands recorded at 1241, 943, and 835 cm−1 are attributed to C-O symmetrical stretching, C-O asymmetrical stretching and C-O-C stretching in the oxirane ring, respectively. Ether group is identified from the intense absorption band at 1036 cm−1, which corresponds to C-O stretching vibration in aliphatic chain. The bands appearing at 1112 and 753 cm−1 are attributed to the C-C stretching in aliphatic chain and C-H rocking vibration, respectively. The results showed that an additional absorption band is appearing at 1733 cm−1, attributed to carbonyl groups C=O grafted on epoxy surface after atmospheric plasma treatment [32,33]. The C=O peak is more intense in the case of DBD treatment, which indicates a more pronounced surface oxidation and justifies the more intense and rapid hydrophilization in case of DBD treatment.
We attempted a semi-quantitative analysis of ATR-FTIR spectra by studying the relative peak area ratio for different absorption bands appearing in the spectra and its variation with the ageing time and means of plasma treatment. We selected two absorption bands that are typically not affected by plasma treatment, namely, the bands related to the benzene ring (1610 cm−1) and oxirane ring (1241 cm−1), as well as the band assigned to the carbonyl group (1733 cm−1) that appears after plasma treatment. The relative ratios for the 1610/1241, 1733/1241, and 1733/1610 peak areas of the untreated epoxy samples and the air plasma treated ones are presented in Table 2. The presented results are obtained from FTIR spectra recorded just after plasma treatment. We observe that the peak area ratio 1610/1241 that corresponds to relative changes in the band intensities of benzene and oxirane rings of epoxy, is not affected by plasma treatment. On the contrary, both peak area ratios that represent the relative change in carbonyl band at 1733 cm−1 with regards to the benzene or oxirane ring show a sharp increase just after plasma treatment. Plasma treatment with the Gliding Arc reactor leads to an increase of more than double the 1733/1241 and 1733/1610 ratios compared to the control epoxy surface. Both peak area ratios become more than four times higher in case of DBD treatment. Figure 4b presents the 1733/1241 peak area ratio as a function of the storage time in ambient conditions. Over the period of observation, the effect of Gliding Arc treatment seems to have a certain remanence as shown by the small variation depicted in terms in the peak area ratio. On the other hand, the 1733/1241 peak area ratio due to the DBD treatment, presents a sharp drop in the first 24 h and then saturates after 4 days to values like those of the Gliding Arc treated samples. It is thus possible to correlate surface wettability with FTIR spectra and the epoxy surface oxidation is clearly represented by the increase in carbonyl content.

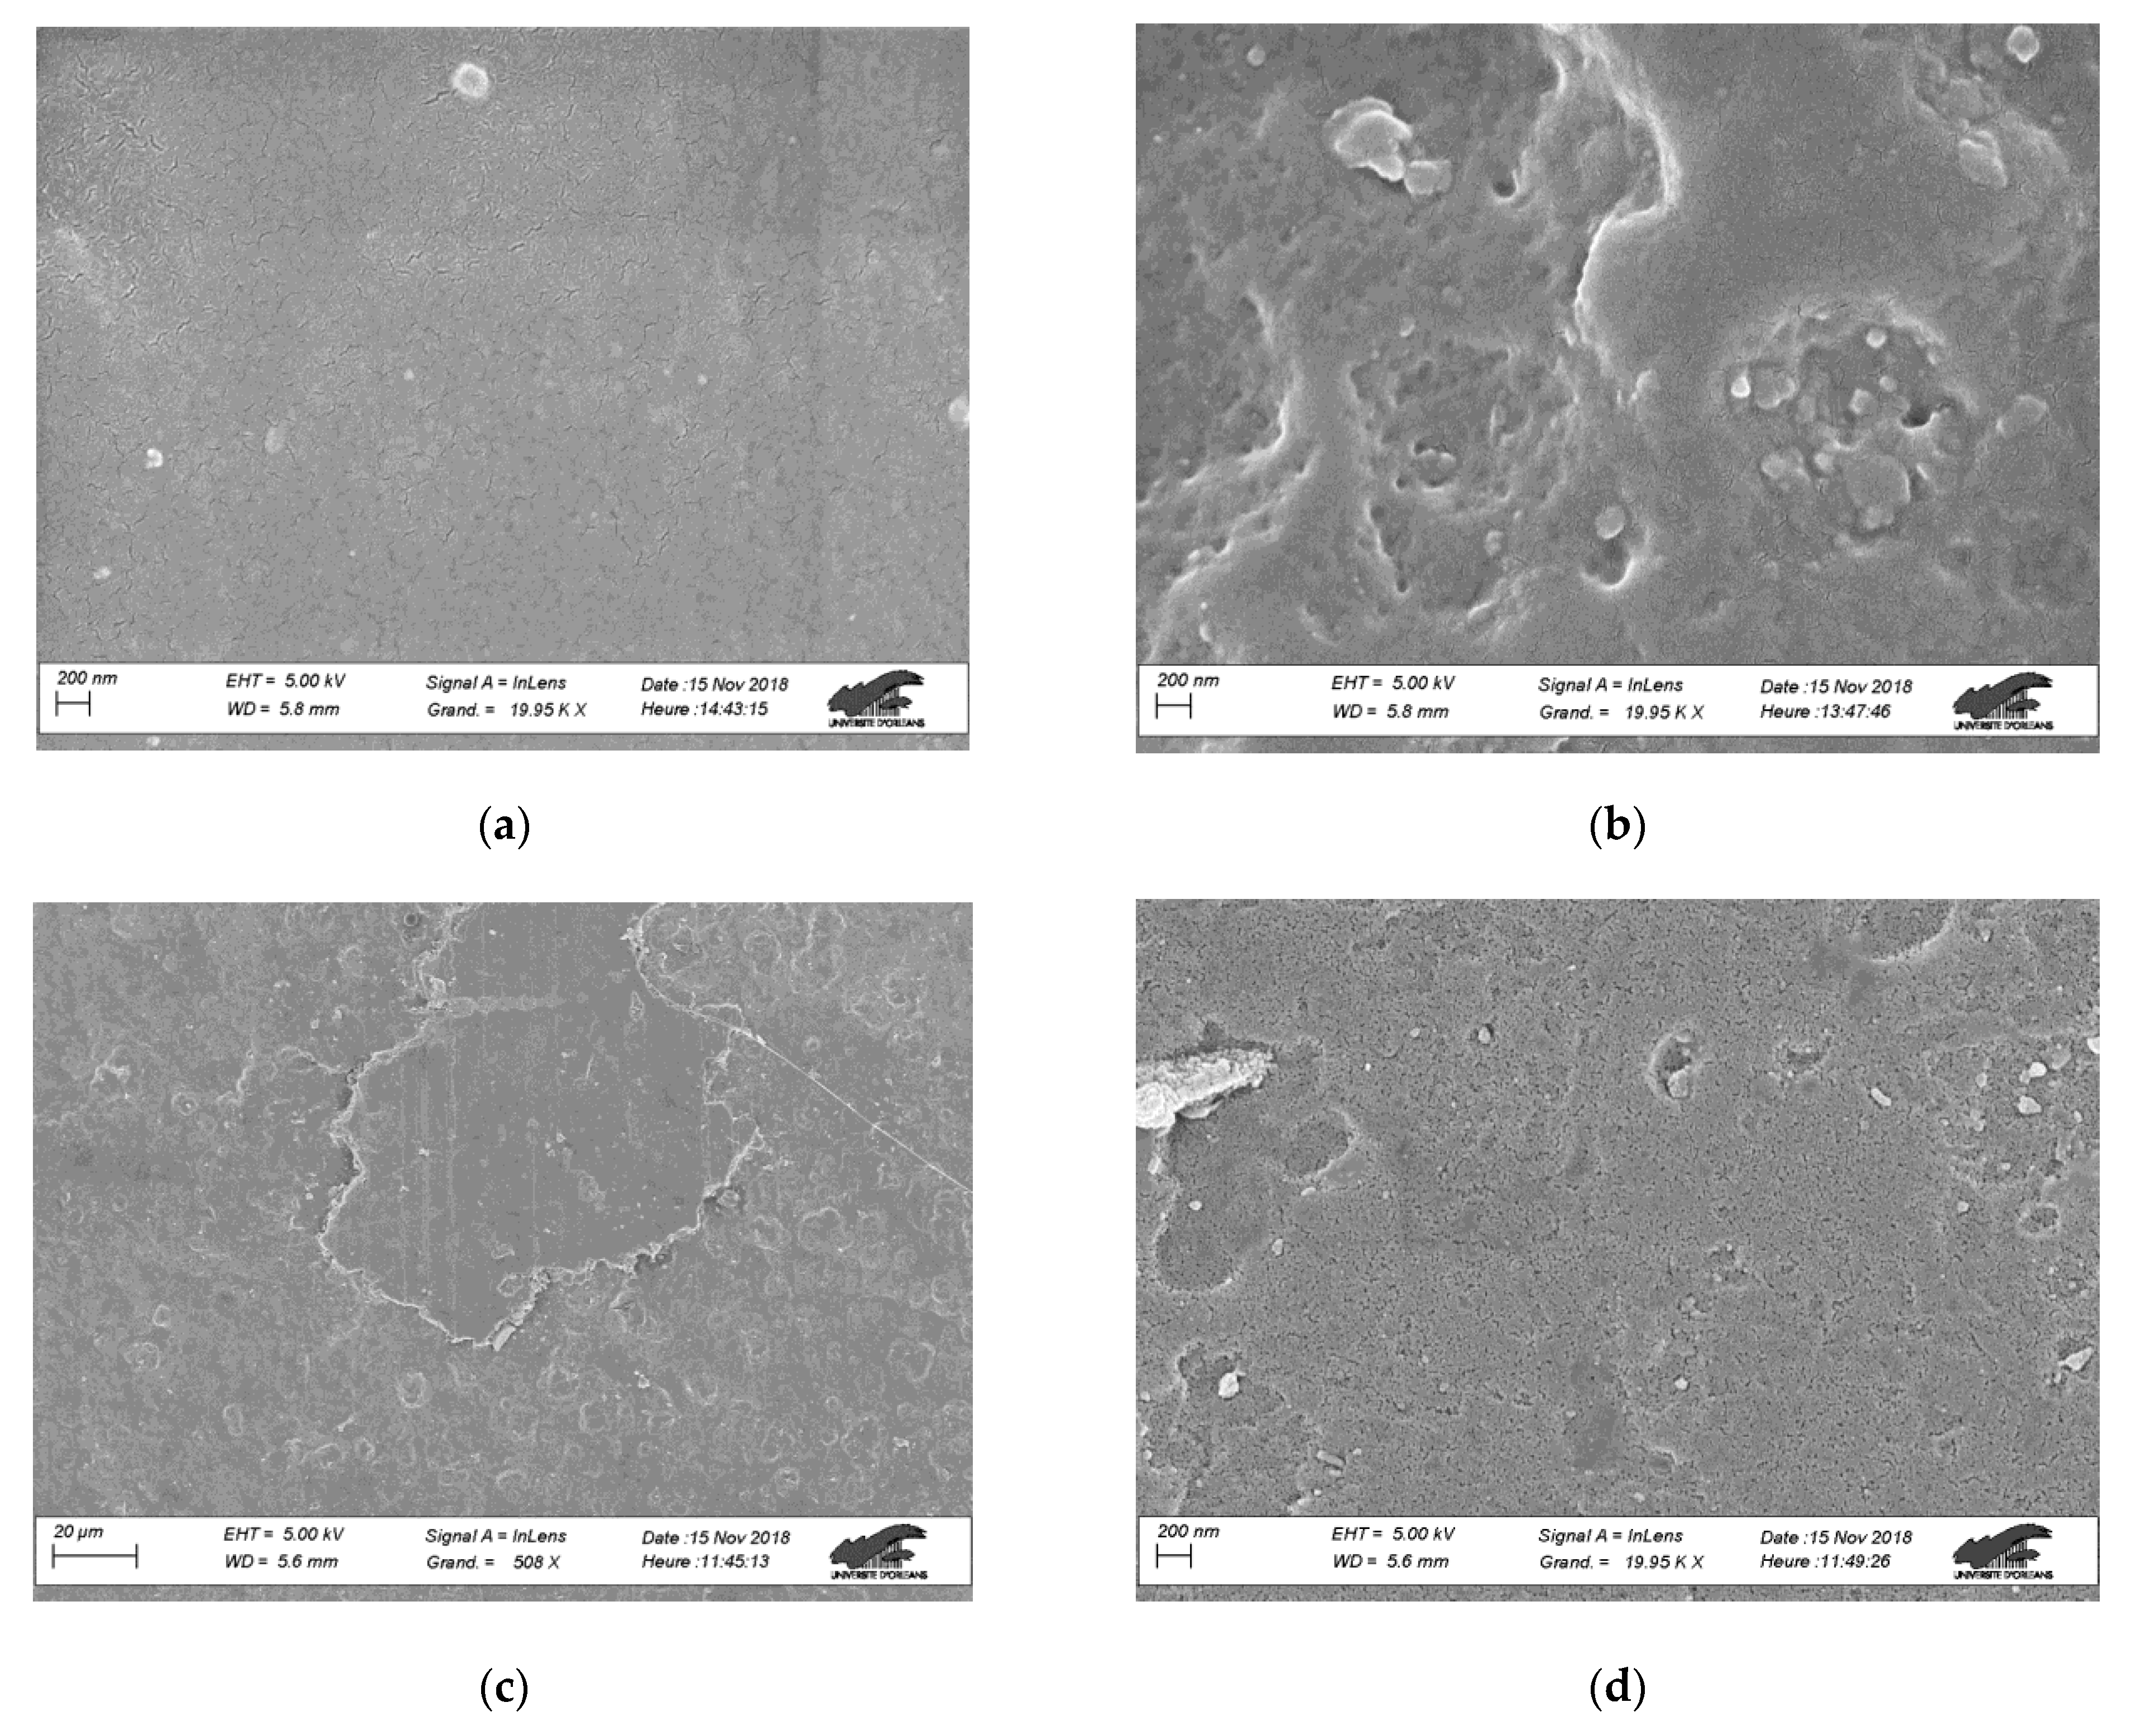
3.2.3. Surface Morphology

Scanning electron microscopy (SEM) was applied to evaluate the effect of plasma treatments on epoxy surface morphology. Figure 5 presents the SEM images of untreated epoxy as well as 300 s treated samples with Gliding Arc and DBD plasma devices. For each condition we selected two images at different magnification to be presented, namely, ×500 and ×20,000, aiming to distinguish the possible effect of plasma treatment in micro and nano-scale. Figure 5a,b shows the surface of the untreated epoxy sample where we observe the almost smooth morphology despite the material spatial in-homogeneities. Similar morphologies are observed for the Gliding Arc treated samples as well, as shown in Figure 5c,d. This result is quite reasonable considering that the sample treatment takes place in the downstream of the Gliding Arc reactor. Concerning the air DBD treated samples, although Figure 5e shows no significant effect on the surface morphology in the micro-scale, the higher magnification image in Figure 5f revealed nano-roughness formation. The nano-topography combined with the enhanced oxidation of air DBD treated epoxy surfaces are mostly responsible for the initial superhydrophilic and the stable in-time hydrophilic properties.

4. Conclusions

We have studied the epoxy polymer surface modification with a Gliding Arc plasma reactor operating in dry air and a DC-pulse driven Dielectric Barrier Discharge operating in ambient air. We applied optical emission spectroscopy (OES) for the two considered plasma sources to approximate the gas temperature close to the sample surface based on estimation of the rotational temperature. The analysis of the emission spectra by the commercial software Specair® was complex according to the only partial equilibrium a priori limited to the rotational temperatures. We demonstrated a low thermal effect of the DBD plasma as indicated by the low rotational temperature values (Trot ≅ 600 K), while a high thermal effect of the Gliding Arc plasma was observed, as indicated by the higher rotational temperature (Trot ≅ 4000 K). However, gas temperature estimations based on optical fiber measurements and IR thermography (around 310 and 328 K, respectively) close to substrate surface indicated low temperature operation.
Water contact angle measurements on plasma treated epoxy samples showed a fast hydrophilization with both plasma discharges. Especially in the case of DBD-treated samples, superhydrophilic surfaces were obtained in less than 60 s of treatment. The ageing studies revealed stabilized water contact angle values < 50° for plasma treated samples, which represent a more than 50% decrease compared to the untreated epoxy surface. Surface chemistry study based on ATR-FTIR spectroscopy revealed the existence of an additional absorption band assigned to carbonyl group. The peak intensity was higher in the case of the DBD-treated epoxy, indicating a more efficient surface oxidation. The FTIR spectra were also successfully correlated with the surface hydrophilization by studying the relative peak area ratio of carbonyl to oxirane and benzene related bands that are not affected by plasma treatments. SEM images showed no remarkable effect on surface morphology after treatment with the Gliding Arc plasma, contrary to DBD treatment, which resulted in nano-roughness formation. The stable hydrophilization was attributed to the enhanced surface oxidation as well as the roughness formation on epoxy surface with the air DBD treatment. Further investigations are needed to bring some more explicit hypotheses about the plasma heating versus plasma chemistry effects on the prolonged stability of the surface-functionalized epoxy polymers.

Supplementary Materials

The following are available online at https://www.mdpi.com/article/10.3390/pr10010104/s1, Figure S1: Overview of the optical setup for OES experiments: measurements for the Gliding Arc analysis, Figure S2: Evolution of the surface temperature of the epoxy sample under treatment with Gliding Arc as measured by infrared thermography, Table S1: Results for the vibrational (Tvib) and rotational (Trot) temperatures determination for the ambient air DBD, Table S2: Results for the vibration (Tvib) and rotation (Trot) temperatures determination for the Gliding Arc experiments.

Author Contributions

Conceptualization, P.D., F.F. and S.P.; methodology, P.D., F.F. and M.W.; investigation, P.D., F.F., M.W. and S.P.; data curation, P.D., F.F. and M.W.; writing—original draft preparation, P.D.; writing —review and editing, P.D., F.F., M.W., E.G. and S.P.; supervision, E.G. and S.P. All authors have read and agreed to the published version of the manuscript.

Funding

This research received no external funding.

Acknowledgments

The scientific stay of Panagiotis Dimitrakellis in GREMI Institute in Bourges was totally supported by the Fund of Mobility for the Greek youth of the French Embassy in Greece.

Conflicts of Interest

The authors declare no conflict of interest.

References

  1. Jin, F.L.; Li, X.; Park, S.J. Synthesis and application of epoxy resins: A review. J. Ind. Eng. Chem. 2015, 29, 1–11. [Google Scholar] [CrossRef]
  2. Mohan, P. A Critical Review: The Modification, Properties, and Applications of Epoxy Resins. Polym.-Plast. Technol. Eng. 2013, 52, 107–125. [Google Scholar] [CrossRef]
  3. Gu, H.; Ma, C.; Gu, J.; Guo, J.; Yan, X.; Huang, J.; Zhang, Q.; Guo, Z. An overview of multifunctional epoxy nanocomposites. J. Mater. Chem. C 2016, 4, 5890–5906. [Google Scholar] [CrossRef]
  4. Pappas, D. Status and potential of atmospheric plasma processing of materials. J. Vac. Sci. Technol. A Vac. Surf. Film. 2011, 29, 020801. [Google Scholar] [CrossRef] [Green Version]
  5. Bárdos, L.; Baránková, H. Cold atmospheric plasma: Sources, processes, and applications. Thin Solid Films 2010, 518, 6705–6713. [Google Scholar] [CrossRef]
  6. Cvelbar, U.; Walsh, J.L.; Černák, M.; de Vries, H.W.; Reuter, S.; Belmonte, T.; Corbella, C.; Miron, C.; Hojnik, N.; Jurov, A.; et al. White paper on the future of plasma science and technology in plastics and textiles. Plasma Process. Polym. 2019, 16, 1700228. [Google Scholar] [CrossRef] [Green Version]
  7. Fanelli, F. Thin film deposition and surface modification with atmospheric pressure dielectric barrier discharges. Surf. Coat. Technol. 2010, 205, 1536–1543. [Google Scholar] [CrossRef]
  8. Dimitrakellis, P.; Gogolides, E.; Zeniou, A.; Awsiuk, K.; Rysz, J.; Marzec, M.M. Transition between stable hydrophilization and fast etching/hydrophilization of poly(methyl)methacrylate polymer using a novel atmospheric pressure dielectric barrier discharge source. J. Vac. Sci. Technol. A Vac. Surf. Film. 2017, 35, 041303. [Google Scholar] [CrossRef]
  9. Dimitrakellis, P.; Smyrnakis, A.; Constantoudis, V.; Tsoutsou, D.; Dimoulas, A.; Gogolides, E. Atmospheric pressure plasma directed assembly during photoresist removal: A new route to micro and nano pattern formation. Micro Nano Eng. 2019, 3, 15–21. [Google Scholar] [CrossRef]
  10. Dimitrakellis, P.; Patsidis, A.C.; Smyrnakis, A.; Psarras, G.C.; Gogolides, E. Atmospheric Plasma Nanotexturing of Organic-Inorganic Nanocomposite Coatings for Multifunctional Surface Fabrication. ACS Appl. Nano Mater. 2019, 2, 2969–2978. [Google Scholar] [CrossRef]
  11. Goldman, M.; Goldman, A.; Sigmond, R.S. The corona discharge, its properties and specific uses. Pure Appl. Chem. 1985, 57, 1353–1362. [Google Scholar] [CrossRef] [Green Version]
  12. Chang, J.S.; Lawless, P.A.; Yamamoto, T. Corona Discharge Processes. IEEE Trans. Plasma Sci. 1991, 19, 1152–1166. [Google Scholar] [CrossRef] [Green Version]
  13. Puač, N.; Maletić, D.; Lazović, S.; Malović, G.; Dordević, A.; Petrović, Z.L.J. Time resolved optical emission images of an atmospheric pressure plasma jet with transparent electrodes. Appl. Phys. Lett. 2012, 101, 1–5. [Google Scholar] [CrossRef]
  14. Lu, X.; Laroussi, M.; Puech, V. On atmospheric-pressure non-equilibrium plasma jets and plasma bullets. Plasma Sources Sci. Technol. 2012, 21, 034005. [Google Scholar] [CrossRef]
  15. Schoenbach, K.H.; Moselhy, M.; Shi, W.; Bentley, R. Microhollow cathode discharges. J. Vac. Sci. Technol. A Vac. Surf. Film. 2003, 21, 1260–1265. [Google Scholar] [CrossRef] [Green Version]
  16. Bárdoš, L.; Baránková, H. Radio frequency hollow cathode source for large area cold atmospheric plasma applications. Surf. Coat. Technol. 2000, 133–134, 522–527. [Google Scholar] [CrossRef]
  17. Brandenburg, R. Corrigendum: Dielectric barrier discharges: Progress on plasma sources and on the understanding of regimes and single filaments. Plasma Sources Sci. Technol. 2018, 26, 053001. [Google Scholar] [CrossRef]
  18. Wagner, H.E.; Brandenburg, R.; Kozlov, K.V.; Sonnenfeld, A.; Michel, P.; Behnke, J.F. The barrier discharge: Basic properties and applications to surface treatment. Vacuum 2003, 71, 417–436. [Google Scholar] [CrossRef] [Green Version]
  19. Dimitrakellis, P.; Zeniou, A.; Stratakos, Y.; Gogolides, E. Radio frequency atmospheric plasma source on a printed circuit board for large area, uniform processing of polymeric materials. Plasma Sources Sci. Technol. 2016, 25, 25015. [Google Scholar] [CrossRef]
  20. Zeniou, A.; Puač, N.; Škoro, N.; Selaković, N.; Dimitrakellis, P.; Gogolides, E.; Petrović, Z.L. Electrical and optical characterization of an atmospheric pressure, uniform, large-area processing, dielectric barrier discharge. J. Phys. D Appl. Phys. 2017, 50, 135204. [Google Scholar] [CrossRef]
  21. Fridman, A.; Chirokov, A.; Gutsol, A. Non-thermal atmospheric pressure discharges. J. Phys. D Appl. Phys. 2005, 38, R1. [Google Scholar] [CrossRef]
  22. Czernichowski, A. Gliding arc. Applications to engineering and environment control. Pure Appl. Chem. 1994, 66, 1301–1310. [Google Scholar] [CrossRef]
  23. Kostov, K.G.; Hamia, Y.A.A.; Mota, R.P.; Dos Santos, A.L.R.; Nascente, P.A.P. Treatment of polycarbonate by dielectric barrier discharge (DBD) at atmospheric pressure. J. Phys. Conf. Ser. 2014, 511, 012075. [Google Scholar] [CrossRef] [Green Version]
  24. Borcia, G.; Anderson, C.A.; Brown, N.M.D. Dielectric barrier discharge for surface treatment: Application to selected polymers in film and fibre form. Plasma Sources Sci. Technol. 2003, 12, 335–344. [Google Scholar] [CrossRef]
  25. Dimitrakellis, P.; Gogolides, E. Atmospheric plasma etching of polymers: A palette of applications in cleaning/ashing, pattern formation, nanotexturing and superhydrophobic surface fabrication. Microelectron. Eng. 2018, 194, 109–115. [Google Scholar] [CrossRef]
  26. Shao, T.; Zhang, C.; Long, K.; Zhang, D.; Wang, J.; Yan, P.; Zhou, Y. Surface modification of polyimide films using unipolar nanosecond-pulse DBD in atmospheric air. Appl. Surf. Sci. 2010, 256, 3888–3894. [Google Scholar] [CrossRef]
  27. Fang, Z.; Liu, Y.; Liu, K.; Shao, T.; Zhang, C. Surface modifications of polymethylmetacrylate films using atmospheric pressure air dielectric barrier discharge plasma. Vacuum 2012, 86, 1305–1312. [Google Scholar] [CrossRef]
  28. Fang, Z.; Ding, Z.; Shao, T.; Zhang, C. Hydrophobic surface modification of epoxy resin using an atmospheric pressure plasma jet array. IEEE Trans. Dielectr. Electr. Insul. 2016, 23, 2288–2293. [Google Scholar] [CrossRef]
  29. Chen, S.; Wang, S.; Wang, Y.; Guo, B.; Li, G.; Chang, Z.; Zhang, G.J. Surface modification of epoxy resin using He/CF 4 atmospheric pressure plasma jet for flashover withstanding characteristics improvement in vacuum. Appl. Surf. Sci. 2017, 414, 107–113. [Google Scholar] [CrossRef]
  30. Li, H.; Liang, H.; He, F.; Huang, Y.; Wan, Y. Air dielectric barrier discharges plasma surface treatment of three-dimensional braided carbon fiber reinforced epoxy composites. Surf. Coat. Technol. 2009, 203, 1317–1321. [Google Scholar] [CrossRef]
  31. Coulon, J.F.; Tournerie, N.; Maillard, H. Adhesion enhancement of Al coatings on carbon/epoxy composite surfaces by atmospheric plasma. Appl. Surf. Sci. 2013, 283, 843–850. [Google Scholar] [CrossRef]
  32. Encinas, N.; Lavat-Gil, M.; Dillingham, R.G.; Abenojar, J.; Martínez, M.A. Cold plasma effect on short glass fibre reinforced composites adhesion properties. Int. J. Adhes. Adhes. 2014, 48, 85–91. [Google Scholar] [CrossRef]
  33. Sangprasert, W.; Nimmanpipug, P.; Yavirach, P.; Lee, V.S.; Boonyawan, D. Epoxy resin surface functionalization using atmospheric pressure plasma jet treatment. Jpn. J. Appl. Phys. 2012, 51, 01AJ04. [Google Scholar] [CrossRef]
  34. Shao, T.; Liu, F.; Hai, B.; Ma, Y.; Wang, R.; Ren, C. Surface modification of epoxy using an atmospheric pressure dielectric barrier discharge to accelerate surface charge dissipation. IEEE Trans. Dielectr. Electr. Insul. 2017, 24, 1557–1565. [Google Scholar] [CrossRef]
  35. Faubert, F.; Wartel, M.; Pellerin, N.; Pellerin, S.; Cochet, V.; Regnier, E.; Hnatiuc, B. Treatment by gliding arc of epoxy resin: Preliminary analysis of surface modifications. In Advanced Topics in Optoelectronics, Microelectronics, and Nanotechnologies VIII; International Society for Optics and Photonics: Bellingham, WA, USA, 2016; Volume 10010, p. 100103G. [Google Scholar]
  36. Laux, C.O. Radiation and Nonequilibrium Collisional-Radiative Models; Von Karman Institute Lecture Series 2002-07, Physico-Chemical Modeling of High Enthalpy and Plasma Flows; Fletcher, D., Charbonnier, J.-M., Sarma, G.S.R., Magin, T., Eds.; Von Karman Institute for Fluid Dynamics: Rhode-Saint-Genèse, Belgium, 2002. [Google Scholar]
  37. Bourcier, S. Tables Internationales de Constantes Sélectionnées: Données Spectroscopiques Relatives aux Molécules Diatomiques; Pergamon Press: Oxford, NY, USA, 1970. [Google Scholar]
  38. Harrison, G.R. M.I.T Wavelength Tables; Technology, M.I., Ed.; The M.I.T Press: Cambridge, MA, USA, 1969. [Google Scholar]
  39. Pearse, R.W.B.; Gaydon, A.G. The Identification of Molecular Spectra, 3rd ed.; Chapman & Hall: London, UK, 1965. [Google Scholar]
  40. NIST Atomic Spectra Database. Available online: https://nist.gov/pml/atomic-spectra-database (accessed on 10 November 2021).
  41. Pellerin, S.; Cormier, J.M.; Richard, F.; Musiol, K.; Chapelle, J.P. A spectroscopic diagnostic method using UV OH band spectrum. J. Phys. D Appl. Phys. 1996, 29, 726–739. [Google Scholar] [CrossRef]
  42. de Izarra, C. UV OH spectrum used as a molecular Pyrometer. J. Phys. D Appl. Phys. 2000, 33, 1697–1704. [Google Scholar] [CrossRef]
  43. Czernichowski, A.; Nassar, N.; Ranaivosoloarimanana, A.; Fridman, A.A.; Simek, M.; Musiol, K.; Pawelec, E.; Dittrichova, L. Spectral and electrical diagnostics of gliding arc. Acta Phys. Pol. A 1996, 89, 595–603. [Google Scholar] [CrossRef]
  44. Bruggeman, P.; Sadeghi, N.; Schram, D.C.; Linss, V. Gas temperature determination from rotational lines in non-equilibrium plasmas: A review. Plasma Sources Sci. Technol. 2014, 23, 023001. [Google Scholar] [CrossRef] [Green Version]
  45. Zhu, J.; Ehn, A.; Gao, J.; Kong, C.; Aldén, M.; Salewski, M.; Leipold, F.; Kusano, Y.; Li, Z. Translational, rotational, vibrational and electron temperatures of a gliding arc discharge. Opt. Express 2017, 25, 20243–20257. [Google Scholar] [CrossRef] [Green Version]
  46. Nikolic, G.; Zlatkovic, S.; Cakic, M.; Cakic, S.; Lacnjevac, C.; Rajic, Z. Fast fourier transform IR characterization of epoxy GY systems crosslinked with aliphatic and cycloaliphatic EH polyamine adducts. Sensors 2010, 10, 684. [Google Scholar] [CrossRef]
  47. Saba, N.; Jawaid, M.; Alothman, O.Y.; Paridah, M.; Hassan, A. Recent advances in epoxy resin, natural fiber-reinforced epoxy composites and their applications. J. Reinf. Plast. Compos. 2015, 35, 447–470. [Google Scholar] [CrossRef]
Figure 1. Schematics of the reactor configurations used in this study: (a,b) Gliding Arc plasma reactor and (c,d) Parallel-plate, open-air DBD plasma reactor.
Processes 10 00104 g001
Figure 2. Optical emission spectra of air DBD and dry air Gliding Arc discharges: (a) wide-band emission spectrum (250–450 nm) and (b) comparison between experimental and theorical spectrum using Specair® software for the Δν = −1 vibration band of the 2nd positive system of N2 in air DBD; (c) wide-band emission spectrum (220–800 nm) and (d) comparison between experimental and theoretical spectrum using Specair® software for the rovibration structure of the A-X transition of OH radical in air Gliding Arc discharge.
Processes 10 00104 g002aProcesses 10 00104 g002b
Figure 3. (a) Water contact angle of epoxy polymer surface as a function of the plasma treatment for air DBD and Gliding Arc, (b) Comparison of ageing effect on epoxy surface in air DBD and Gliding Arc, (c) WCA ageing for air DBD at different plasma treatment durations, and (d) Temperature effect on WCA ageing for 60 s of air DBD treatment (accelerated ageing).
Processes 10 00104 g003
Figure 4. (a) FTIR spectra and (b) variation of 1733/1241 FTIR peak area ratio with storage time of untreated and atmospheric plasma treated epoxy samples with Gliding Arc and Air DBD reactors.
Processes 10 00104 g004
Figure 5. SEM images at different magnifications of untreated and plasma treated epoxy polymer surfaces with air DBD and Gliding Arc: (a) untreated—x500, (b) untreated—×20,000, (c) Gliding Arc—×500, (d) Gliding Arc—×20,000, (e) air DBD—×500, and (f) air DBD—×20,000.
Processes 10 00104 g005aProcesses 10 00104 g005b
Table 1. Results for the different measured temperatures close to the epoxy samples. IR thermography was not possible in the case of DBD.
Tvib (K)
Optical Emission
Trot (K)
Optical Emission
Tgas (K)
FOTEMP-FTH
Tsurf (K)
IR Thermography
DBD3064 ± 294598 ± 105310 ± 1.5N/A
Gliding Arc5493 ± 20003963 ± 570328.2 ± 1.5326.2 ± 2
Table 2. Relative peak area for different transmission bands appearing in FTIR spectra for samples measured just after 5 min atmospheric plasma treatment.
1610/12411733/12411733/1610
Control epoxy0.0770.0450.59
Gliding Arc0.0750.1211.51
Air DBD0.0780.2713.49
Publisher’s Note: MDPI stays neutral with regard to jurisdictional claims in published maps and institutional affiliations.

