
Health Literacy for the General Public: Making a Case for Non-Trivial Visualizations


Abstract
1. Introduction and Rationale
2. Background
2.1. Health Literacy
2.2. Visualizations for Health Literacy
2.3. Visualization Literacy
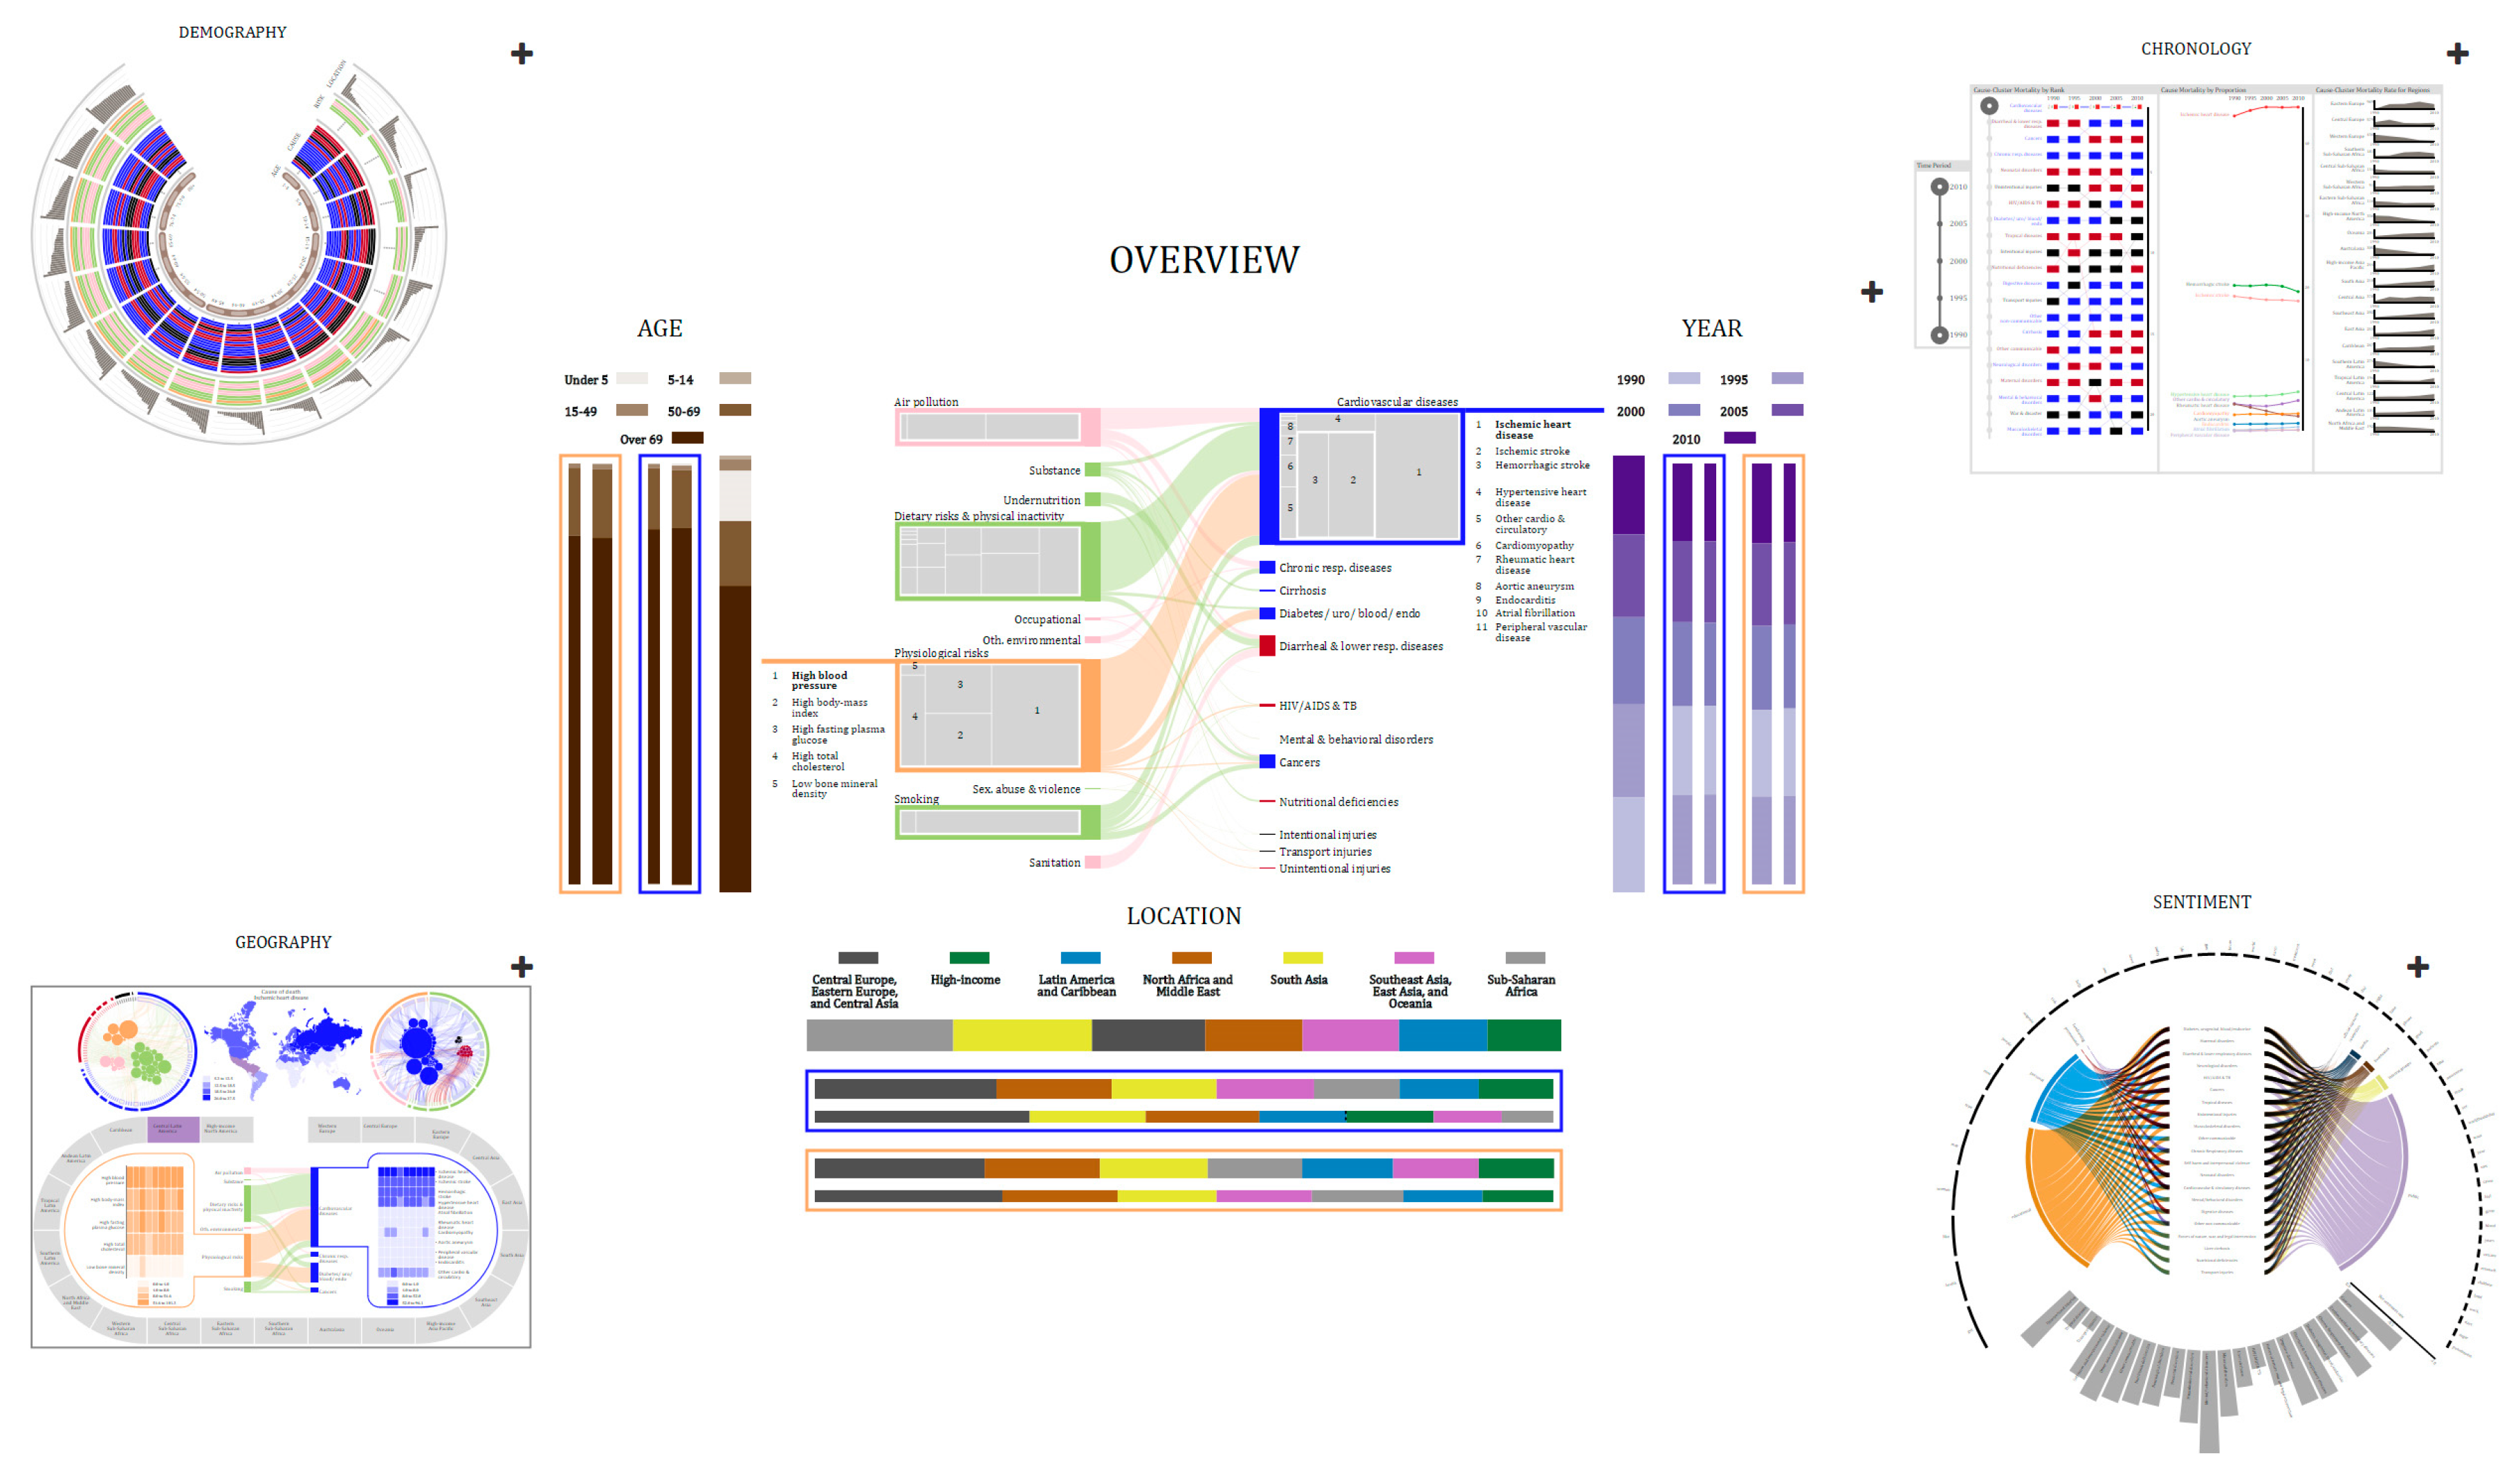
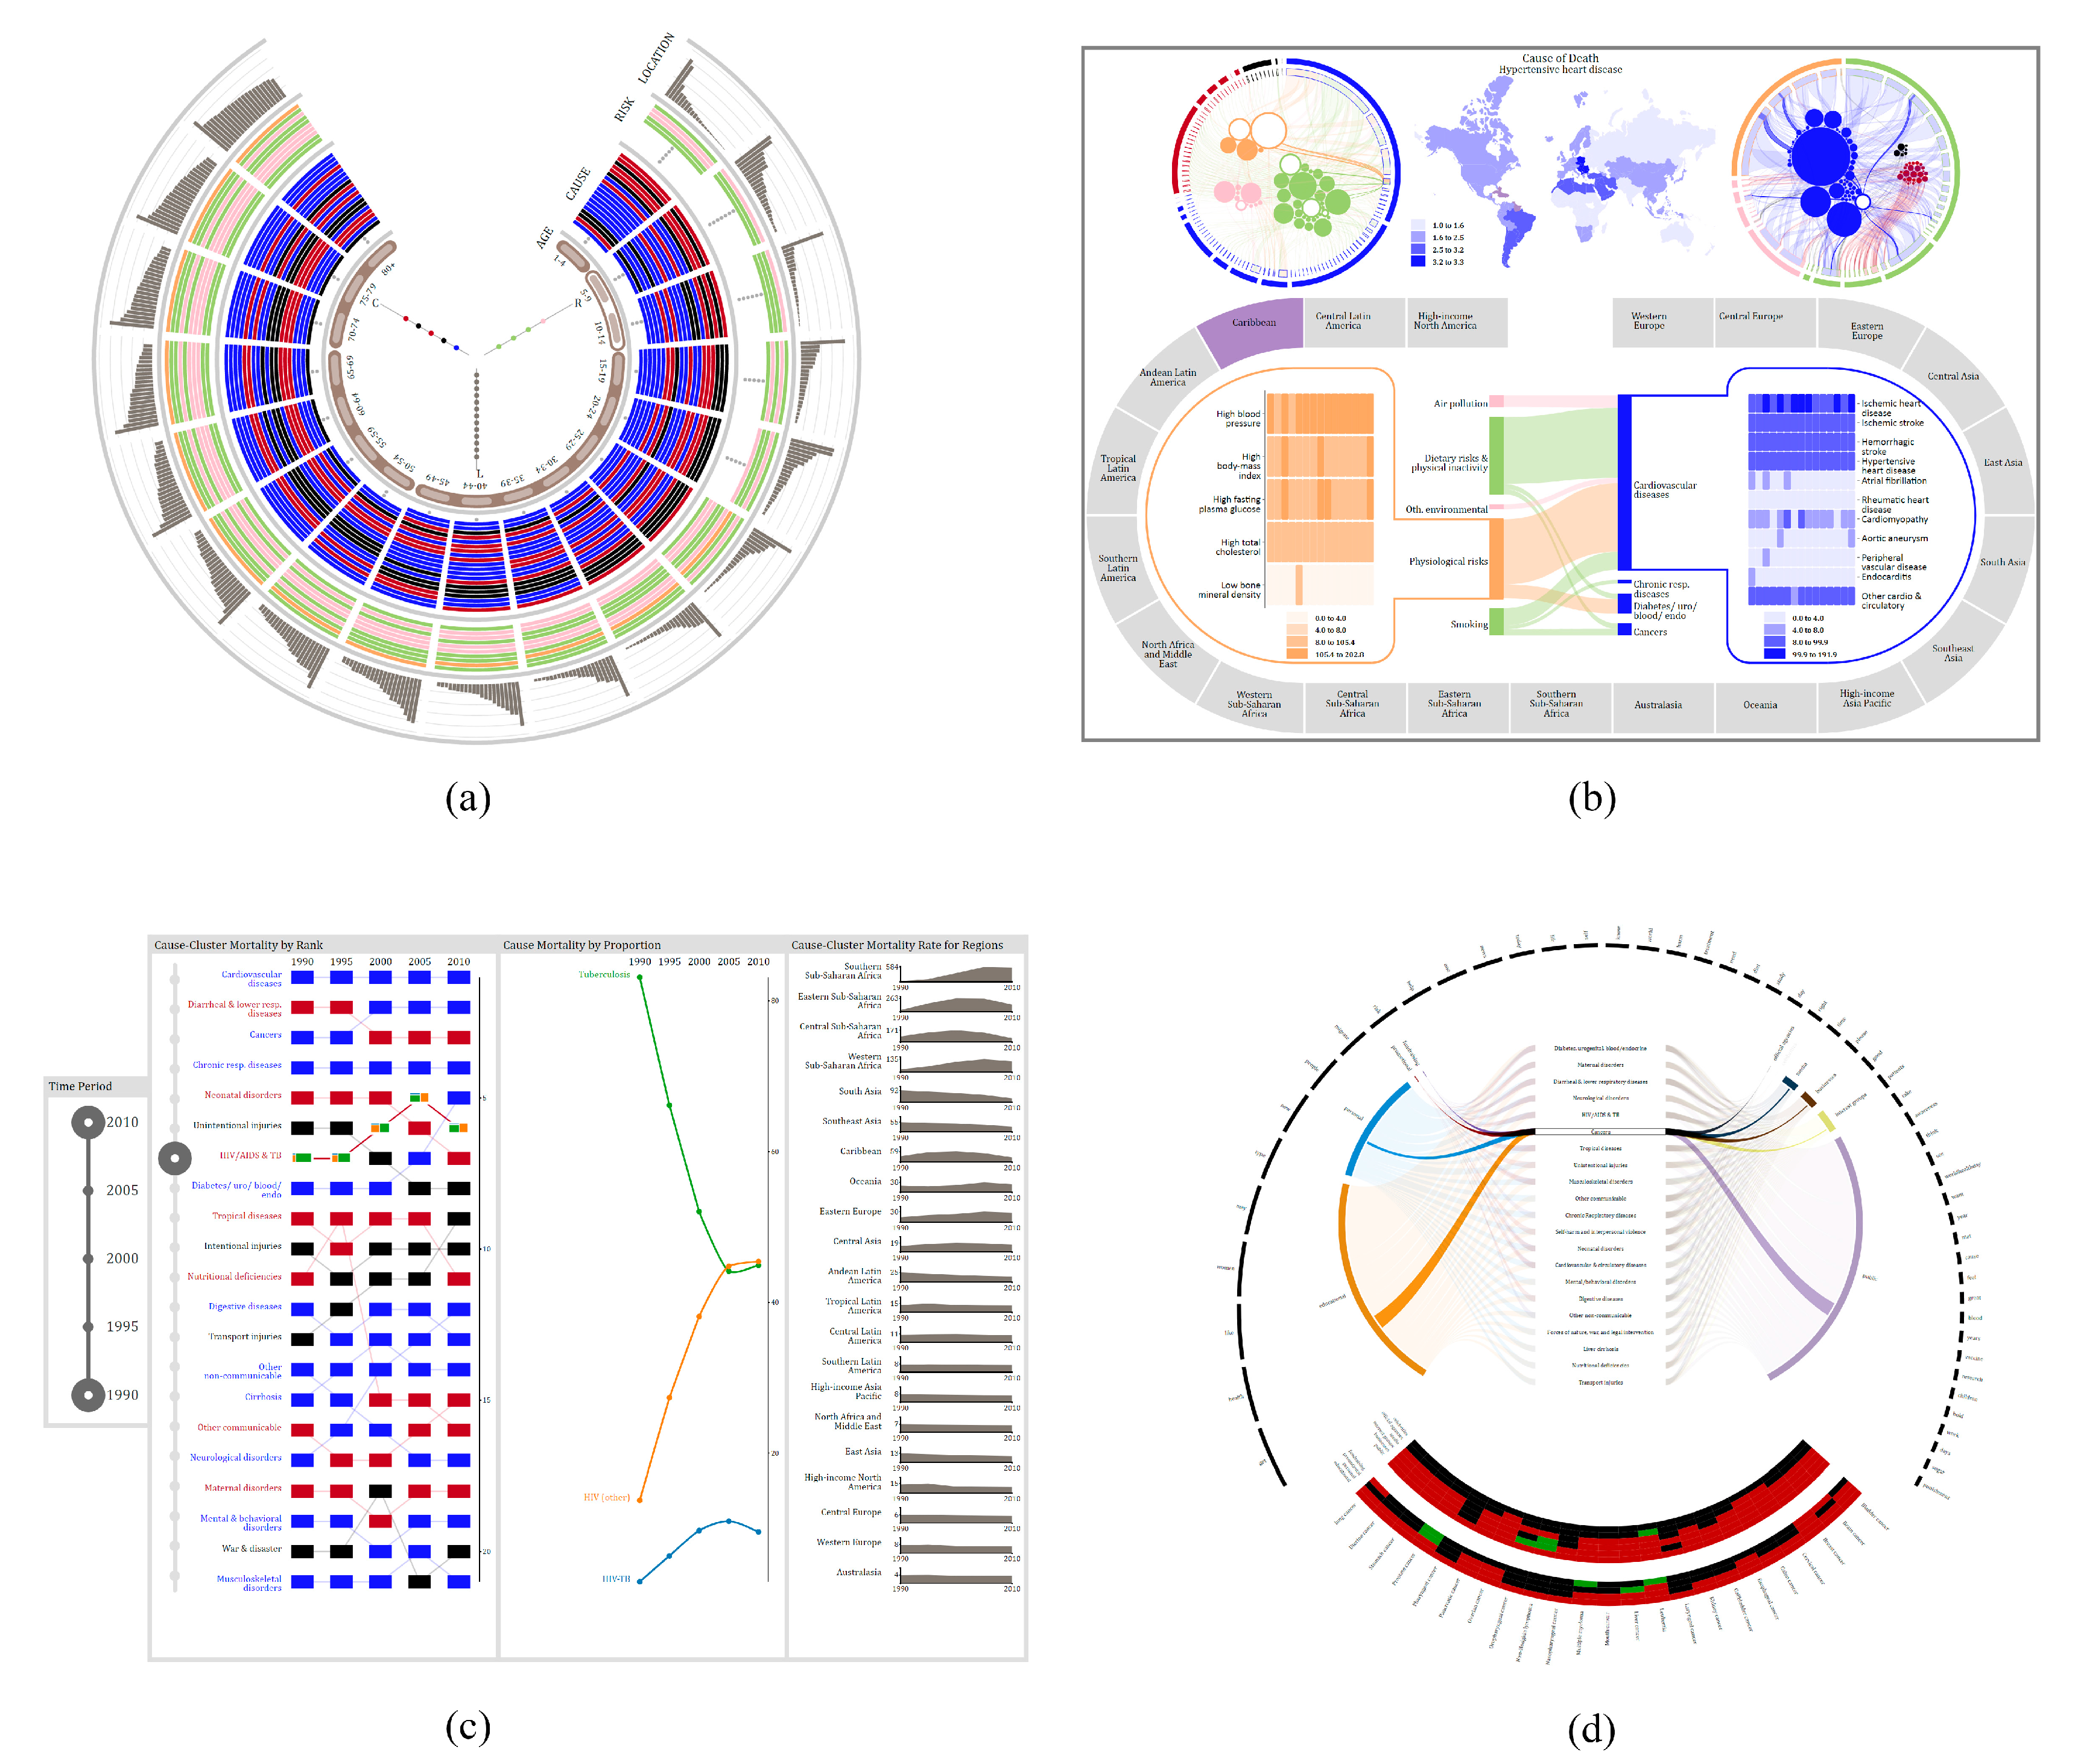
3. HealthConfection
4. Visualization Literacy Study
4.1. Research Methodology
4.1.1. Participants
4.1.2. Procedure
4.1.3. Sources of Data
4.1.4. Hypotheses
4.2. Results
4.2.1. Analysis of Quantitative Results
4.2.2. Analysis of Qualitative Results
Effect of the Tutorial
- “I had never seen a Demography visualization before so the video introduced it to me and taught me how to use it. The video, although short, really explained how to use the visualization and made it clear where to find the things I needed to find.” (PT06)
- “Simply looking at the 2 circles was a bit offputting; with the tutorial it was made clear what the purpose was. I was immediately confused about the lines; however the tutorial cleared that up.” (PT10)
- “Being told how to interpret complex diagrams is very helpful when presented with a wide array of options/buttons to click. Being told what things meant and how to find them was very helpful.” (PT13)
- “Without any instructions on how the data is organized, it is difficult to get the hang of it yourself without spending lots of time.” (PT15)
Strategy for Making Sense without Aid
- “My process was just to click around until something happened and then try to understand what happened. I was able to figure out the second one because of the color scheme; the reserved colors help me to know that they were related.” (PC06)
- “Explore and understand it step by step. So, I break it down and go through the different sections to try and understand how they work together. It is kinda of funny. I didn’t notice the legend on the side until I had already gone through it and figured out what the categories meant on my own.” (PC10)
- “I started looking at the headings and just stared at it for a while. I did not realize that you could click or interact with it. And then when I started looking at the questions and answering them it started to make sense. Then I saw the + sign at the top and all the other things that started popping up.” (PC12)
Experience of Participants without the Tutorial
- “It would have potentially helped me to find the other elements a little more easily. The things in the tutorial where things I figured out along the way. Where I struggled was combining different parts to find the answer. Narrowing down to the region or a specific country within an age group for a cause or risk. I think it would have helped me to skim off that part of figuring it out.” (PC02)
- “I would have been more purposeful in my interaction. I wouldn’t have had to click randomly to see the connection.” (PC06)
- “It would have helped me to feel more secure in the knowledge and my understanding of it. I think that in terms of which one was highest or lowest that was definitely something that I had to poke around with to figure it out. To figure out which was highest or lowest, when I clicked on it, I would compare the actual numbers. Understanding how the interactions work, that was something I was iffy on, so that would have been something that the tutorial would have helped with.” (PC10)
- “It would have made it better for me to figure things out. It would have changed my strategy. Cause I would know where to look for things because at first it was going to try and see what pops up and one of the things that I assumed that the causes at the top were the highest but I wasn’t sure if it was that way.” (PC12)
5. Health Literacy Study
5.1. Research Methodology
5.1.1. Participants
5.1.2. Procedure
5.1.3. Tasks
5.1.4. Sources of Data
5.1.5. Hypotheses
5.2. Results
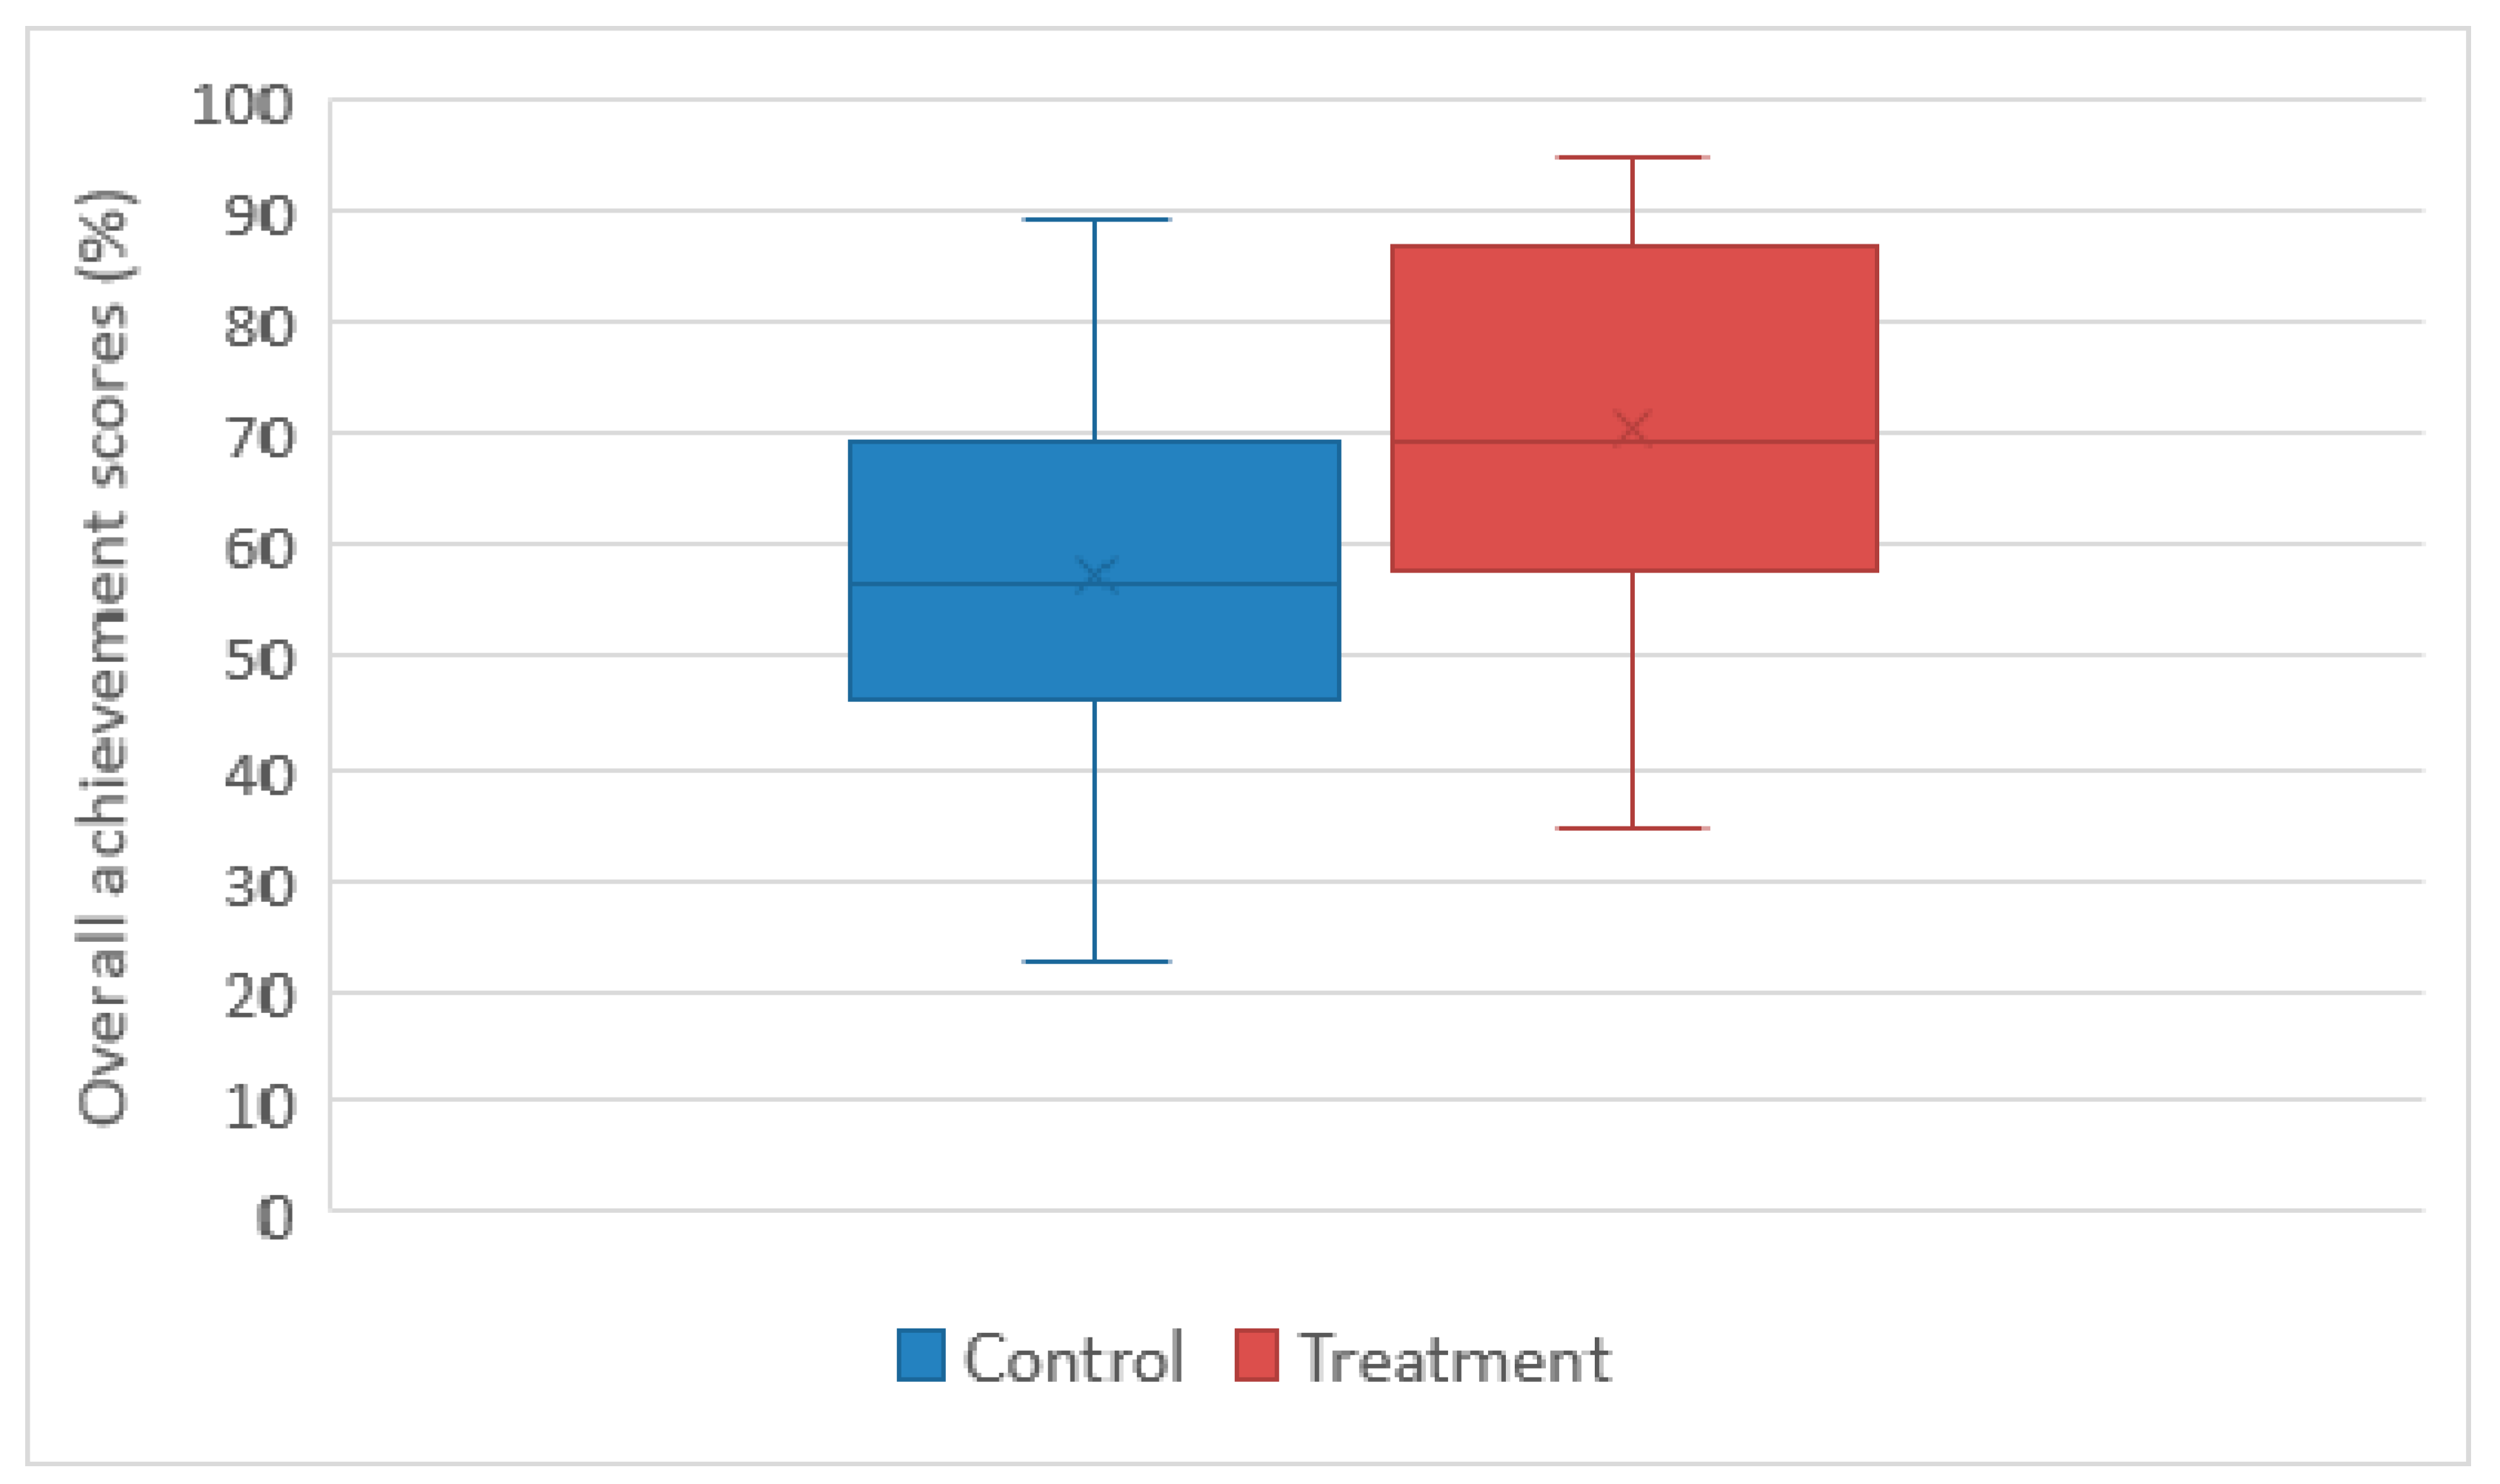
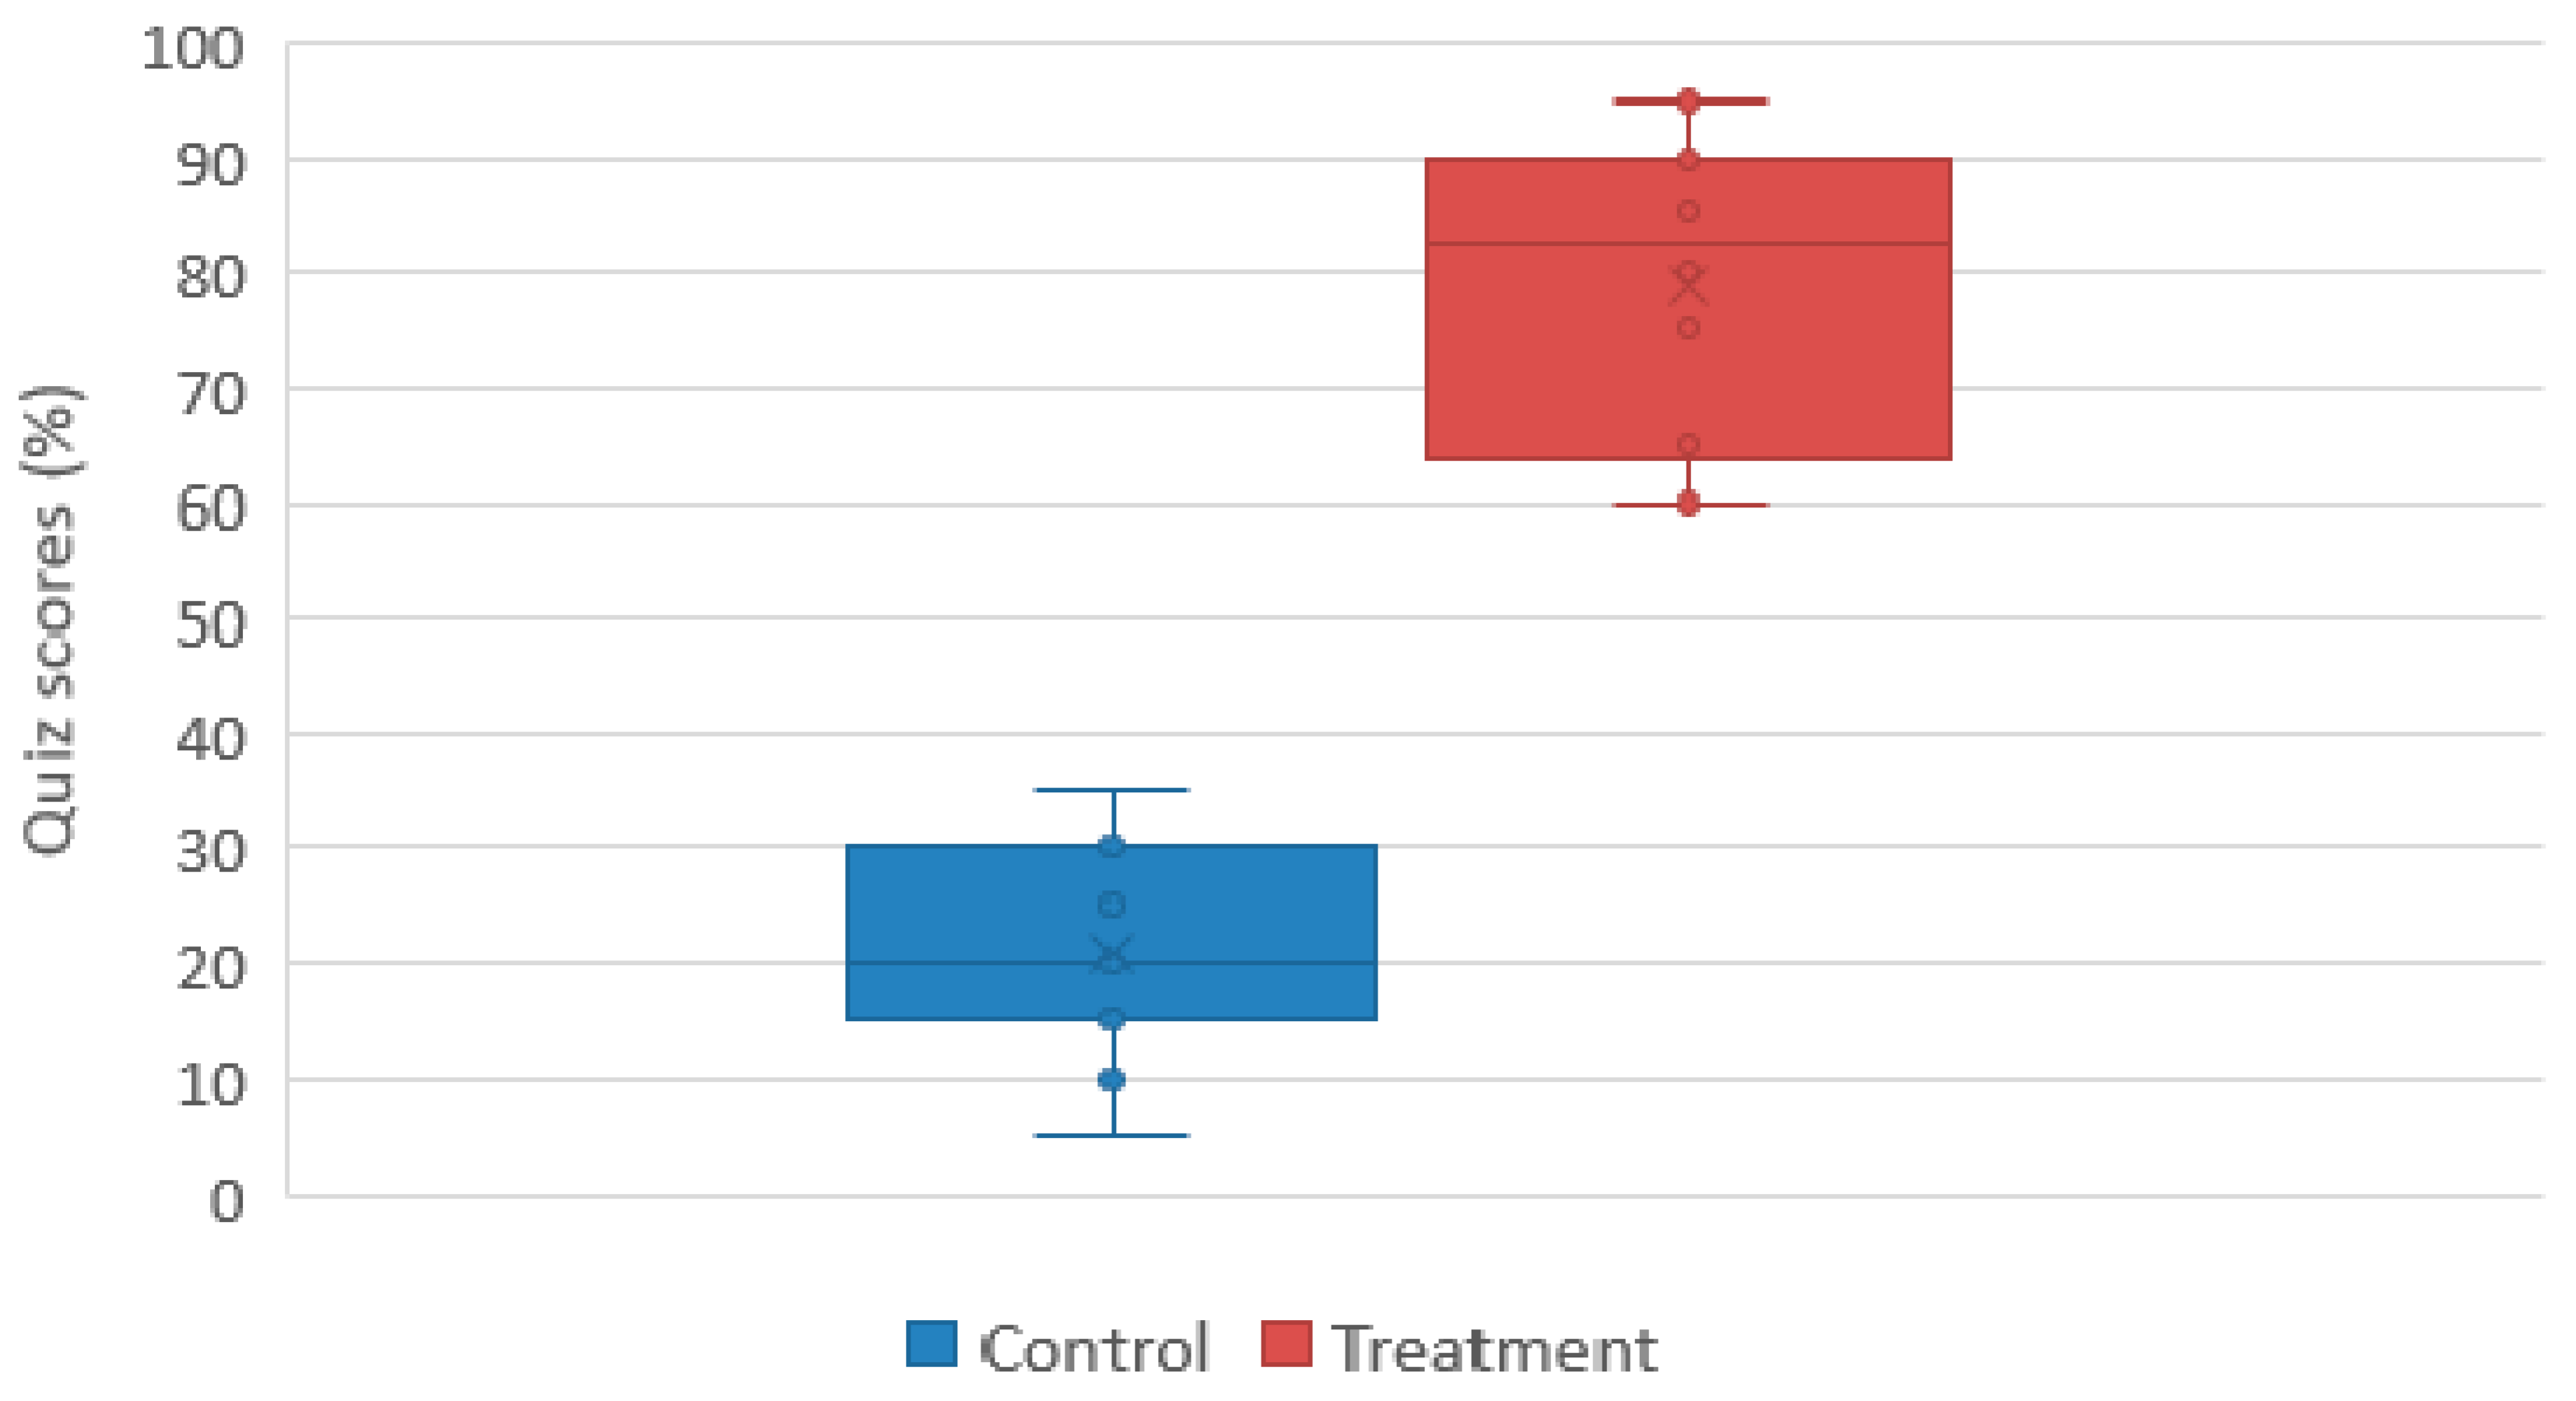
5.2.1. Quiz Results
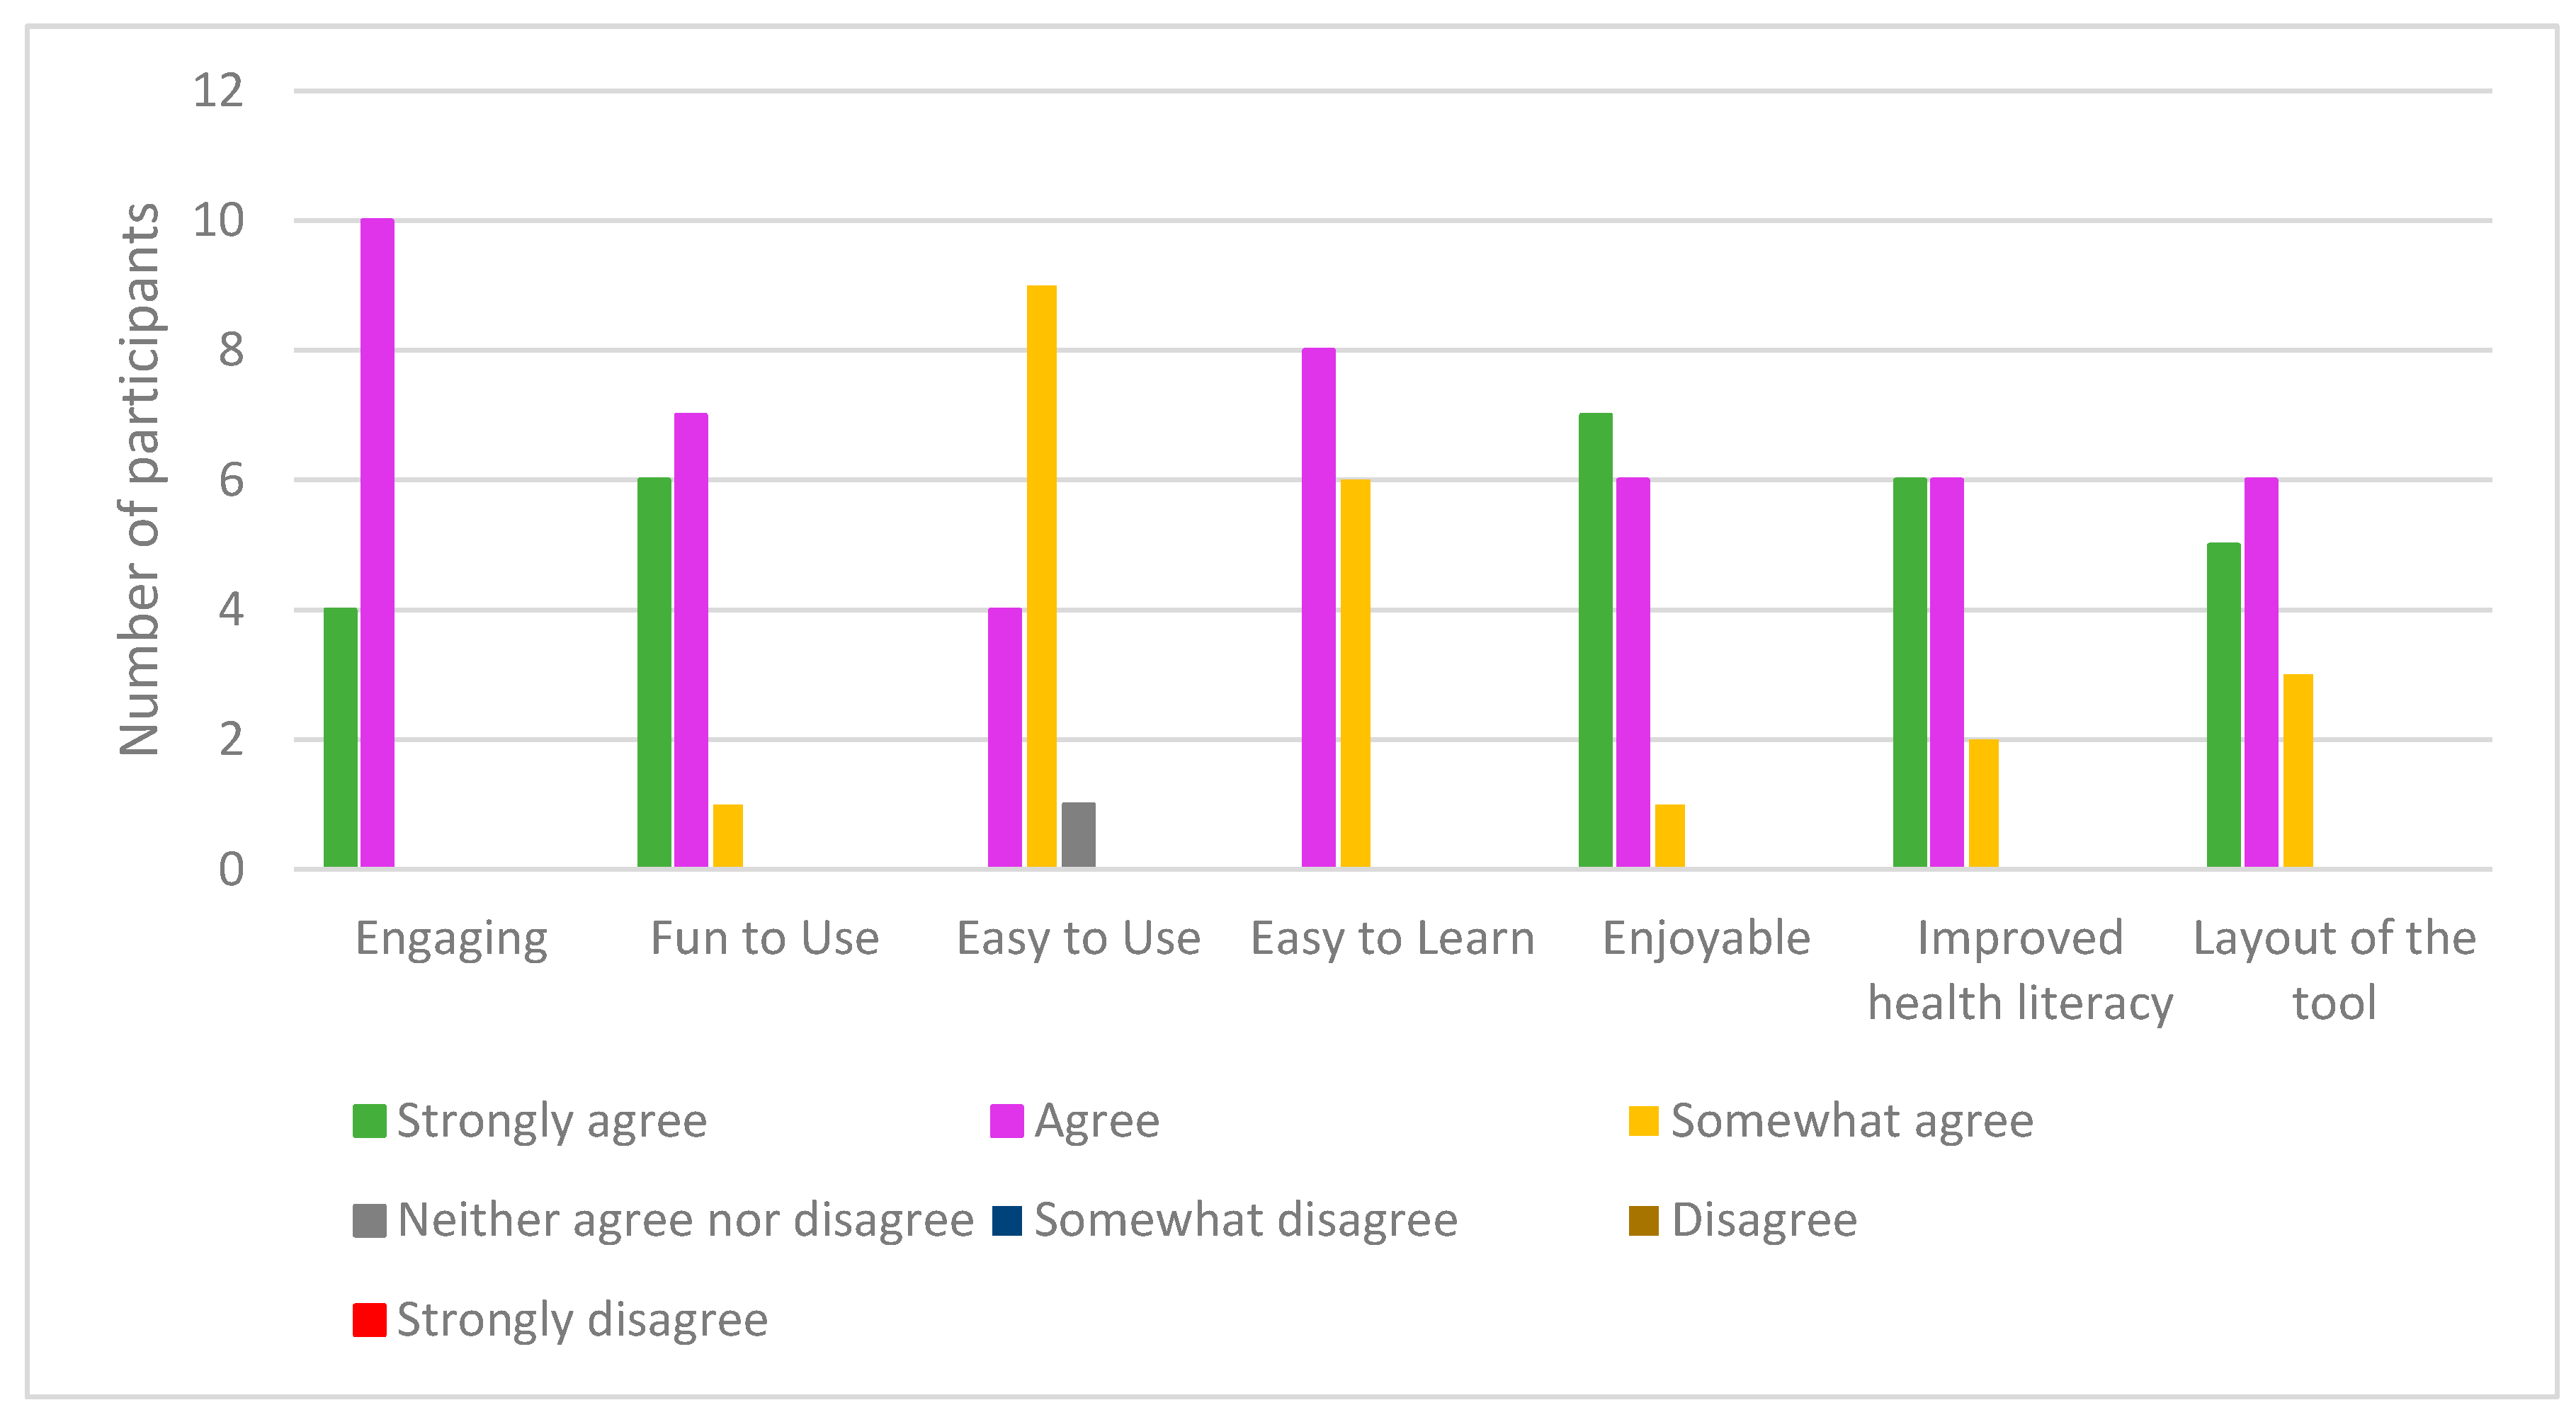
5.2.2. Experience Questionnaire and Interview Feedback
6. Discussion and Conclusions
Author Contributions
Conflicts of Interest
References
- Parker, R.M.; Williams, M.V.; Weiss, B.D.; Baker, D.W.; Davis, T.C.; Doak, C.C.; Doak, L.G.; Hein, K.; Meade, C.D.; Nurss, J.; Schwartzberg, J.G. Health literacy: Report of the Council on Scientific Affairs. Ad Hoc Committee on Health Literacy for the Council on Scientific Affairs, American Medical Association. JAMA 1999, 281, 552–557. [Google Scholar]
- Sørensen, K.; Pelikan, J.M.; Rothlin, F.; Ganahl, K.; Slonska, Z.; Doyle, G.; Fullam, J.; Kondilis, B.; Agrafiotis, D.; Uiters, E.; et al. Health literacy in Europe: Comparative results of the European health literacy survey (HLS-EU). Eur. J. Public Health 2015, 25, 1053–1058. [Google Scholar] [CrossRef] [PubMed]
- Rasu, R.S.; Bawa, W.A.; Suminski, R.; Snella, K.; Warady, B. Health literacy impact on national healthcare utilization and expenditure. Int. J. Health Policy Manag. 2015, 4, 747–755. [Google Scholar] [CrossRef] [PubMed]
- Vernon, J.; Trujillo, A.; Rosenbaum, S.; Debuono, B. Low Health Literacy Implications for National Health Policy. Available online: http://hsrc.himmelfarb.gwu.edu/sphhs_policy_facpubs/172/ (accessed on 13 August 2017).
- Kickbusch, I.; Pelikan, J.; Apfel, F.; Tsouros, A. Health Literacy the Solid Facts; WHO Regional Office: Copenhagen, Denmark, 2013. [Google Scholar]
- Sørensen, K.; Van den Broucke, S.; Fullam, J.; Doyle, G.; Pelikan, J.; Slonska, Z.; Brand, H. Consortium Health Literacy Project, European. Health literacy and public health: A systematic review and integration of definitions and models. BMC Public Health 2012, 12. [Google Scholar] [CrossRef] [PubMed]
- National Research Council. The Future of Public Health; The National Academies Press: Washington, DC, USA, 1988. [Google Scholar]
- Mokdad, A.H.; Marks, J.S.; Stroup, D.F.; Gerberding, J.L. Actual causes of death in the united states. JAMA 2004, 291, 1238–1245. [Google Scholar] [CrossRef] [PubMed]
- Lim, S.S.; Vos, T.; Flaxman, A.D.; Danaei, G.; Shibuya, K.; Adair-Rohani, H.; AlMazroa, M.A.; Amann, M.; Anderson, H.R.; Andrews, K.G.; et al. A comparative risk assessment of burden of disease and injury attributable to 67 risk factors and risk factor clusters in 21 regions, 1990–2010: A systematic analysis for the global burden of disease study 2010. Lancet 2012, 380, 2224–2260. [Google Scholar] [CrossRef]
- Schulz, P.J.; Nakamoto, K. Health literacy and patient empowerment in health communication: The importance of separating conjoined twins. Patient Educ. Couns. 2013, 90, 4–11. [Google Scholar] [CrossRef] [PubMed]
- Lemire, M.; Sicotte, C.; Paré, G. Internet use and the logics of personal empowerment in health. Health Policy (New York) 2008, 88, 130–140. [Google Scholar] [CrossRef] [PubMed]
- Nutbeam, D. Health literacy as a public health goal: A challenge for contemporary health education and communication strategies into the 21st century. Health Promot. Int. 2000, 15, 259–267. [Google Scholar] [CrossRef]
- Liu, E.; Zhao, Y.; Wei, H.; Roumeliotis, S.; Kaldoudi, E. Navigating health literacy using interactive data visualisation. In Proceedings of the 2016 IEEE 16th International Conference on Bioinformatics and Bioengineering (BIBE), Taichung, Taiwan, 31 October–2 November 2016. [Google Scholar]
- Ola, O.; Sedig, K. The challenge of big data in public health: An opportunity for visual analytics. Online J. Public Health Inform. 2014, 5, 223. [Google Scholar] [PubMed][Green Version]
- Gotz, D.; Borland, D. Data-driven healthcare challenges and opportunities for interactive visualization. IEEE Comput. Graph. Appl. 2016, 36, 90–96. [Google Scholar] [CrossRef] [PubMed]
- Herland, M.; Khoshgoftaar, T.M.; Wald, R. A review of data mining using big data in health informatics. J. Big Data 2014, 1. [Google Scholar] [CrossRef]
- Ola, O.; Sedig, K. Beyond simple charts: Design of visualizations for big health data. Online J. Public Health Inform. 2016, 8, e195. [Google Scholar] [CrossRef] [PubMed]
- Ruchikachorn, P.; Mueller, K. Learning visualizations by analogy: Promoting visual literacy through visualization morphing. IEEE Trans. Vis. Comput. Graph. 2015, 21, 1028–1044. [Google Scholar] [CrossRef] [PubMed]
- Lee, S.; Kim, S.H.; Hung, Y.H.; Lam, H.; Kang, Y.A.; Yi, J.S. How do people make sense of unfamiliar visualizations?: A grounded model of novice’s information visualization sensemaking. IEEE Trans. Vis. Comput. Graph. 2016, 22, 499–508. [Google Scholar] [CrossRef] [PubMed]
- Tanahashi, Y.; Leaf, N.; Ma, K.-L. A study on designing effective introductory materials for information visualization. Comput. Graph. Forum 2016, 35, 117–126. [Google Scholar] [CrossRef]
- Börner, K.; Maltese, A.; Balliet, R.N.; Heimlich, J. Investigating aspects of data visualization literacy using 20 information visualizations and 273 science museum visitors. Inform. Vis. 2015, 15, 198–213. [Google Scholar] [CrossRef]
- Gazmararian, J.A.; Curran, J.W.; Parker, R.M.; Bernhardt, J.M.; DeBuono, B.A. Public health literacy in america: An ethical imperative. Am. J. Prev. Med. 2005, 28, 317–322. [Google Scholar] [CrossRef] [PubMed]
- Bostock, S.; Steptoe, A. Association between low functional health literacy and mortality in older adults: Longitudinal cohort study. BMJ 2012, 344, e1602. [Google Scholar] [CrossRef] [PubMed]
- Berkman, N.D.; Sheridan, S.L.; Donahue, K.E.; Halpern, D.J.; Viera, A.; Crotty, K.; Holland, A.; Brasure, M.; Lohr, K.N.; Harden, E.; et al. Health Literacy Interventions and Outcomes: An Updated Systematic Review; Agency for Healthcare Research and Quality: Rockville, MD, USA, 2011.
- Rowlands, G.; Shaw, A.; Jaswal, S.; Smith, S.; Harpham, T. Health literacy and the social determinants of health: A qualitative model from adult learners. Health Promot. Int. 2017, 32, 130–138. [Google Scholar] [CrossRef] [PubMed]
- Occa, A.; Suggs, L.S. Communicating breast cancer screening with young women: An experimental test of didactic and narrative messages using video and infographics. J. Health Commun. 2016, 21, 1–11. [Google Scholar] [CrossRef] [PubMed]
- Cohen, B. Florence nightingale. Sci. Am. 1984, 250, 128–137. [Google Scholar] [CrossRef] [PubMed]
- Freifeld, C.C.; Mandl, K.D.; Reis, B.Y.; Brownstein, J.S. Healthmap: Global infectious disease monitoring through automated classification and visualization of internet media reports. J. Am. Med. Inform. Assoc. 2008, 15, 150–157. [Google Scholar] [CrossRef] [PubMed]
- MacEachren, A.M.; Stryker, M.S.; Turton, I.J.; Pezanowski, S. HEALTHGeoJunction: Place-time-concept browsing of health publications. Int. J. Health Geogr. 2010, 9. [Google Scholar] [CrossRef] [PubMed]
- Purushe, S.; Grinstein, G.; Smrtic, M.B.; Lyons, H. Interactive animated visualizations of breast, ovarian cancer and other health indicator data using weave, an interactive web—Based analysis and visualization environment. In Proceedings of the 2011 15th International Conference on Information Visualisation, London, UK, 13–15 July 2011. [Google Scholar]
- Sopan, A.; Noh, A.S.-I.; Karol, S.; Rosenfeld, P.; Lee, G.; Shneiderman, B. Community health map: A geospatial and multivariate data visualization tool for public health datasets. Gov. Inform. Q. 2012, 29, 223–234. [Google Scholar] [CrossRef]
- Zhao, J.; Exeter, D.; Moss, L.; Hanham, G.; Riddell, T.; Wells, S. Incorporating ringmaps into interactive web mapping for enhanced understanding of cardiovascular disease. In Proceedings of the 2013 21st International Conference on Geoinformatics, Kaifeng, China, 20–22 June 2013. [Google Scholar]
- Institute for Health Metrics and Evaluation. Global Burden of Disease. 2013. Available online: http://www.healthdata.org/gbd. (accessed on 17 April 2017).
- Lee, S.; Kim, S.H.; Kwon, B.C. Vlat: Development of a visualization literacy assessment test. IEEE Trans. Vis. Comput. Graph. 2017, 23, 551–560. [Google Scholar] [CrossRef] [PubMed]
- Tory, M.; Möller, T. Human factors in visualization research. IEEE Trans. Vis. Comput. Graph. 2004, 10, 72–84. [Google Scholar] [CrossRef] [PubMed]
- Kwon, B.C.; Lee, B. A comparative evaluation on online learning approaches using parallel coordinate visualization. In Proceedings of the 2016 CHI Conference on Human Factors in Computing Systems, San Jose, CA, USA, 7–12 May 2016. [Google Scholar]
- Alper, B.; Riche, N.H.; Chevalier, F.; Boy, J.; Sezgin, M. Visualization literacy at elementary school. In Proceedings of the 2017 CHI Conference on Human Factors in Computing Systems, Denver, CO, USA, 6–11 May 2017. [Google Scholar]
- Hornbæk, K.; Hertzum, M. The notion of overview in information visualization. Int. J. Hum. Comput. Stud. 2011, 69, 509–525. [Google Scholar] [CrossRef]
- Spence, R. Information Visualization: An Introduction, 3rd ed.; Springer: Heidelberg, Germany, 2014. [Google Scholar]
- Ziemkiewicz, C.; Kosara, R. The shaping of information by visual metaphors. IEEE Trans. Vis. Comput. Graph. 2007, 14, 1269–1276. [Google Scholar] [CrossRef] [PubMed]
- Tufte, E.R. Visual explanations: Images and Quantities, Evidence and Narrative; Graphics Press: Cheshire, CT, USA, 1997. [Google Scholar]
- Gadanidis, G.; Sedig, K.; Liang, H.-N. Designing online mathematical investigation. J. Comput. Math. Sci. Teach. 2004, 23, 275–298. [Google Scholar]
- Demography Visualization Tutorial. Available online: https://youtu.be/HwKF9Cbozpo. (accessed on 13 August 2017).
- Geography Visualization Tutorial. Available online: https://youtu.be/HaR7sRfaVtY. (accessed on 13 August 2017).


| Gender | |||||||
| Group | Male | Female | |||||
| Control | 6 | 11 | |||||
| Treatment | 7 | 9 | |||||
| Program Level | |||||||
| Undergraduate | Graduate | ||||||
| Control | 15 | 2 | |||||
| Treatment | 14 | 2 | |||||
| Use of Typical Visualizations | |||||||
| Always | Very Frequently | Frequently | Occasionally | Rarely | Very Rarely | Never | |
| Control | 1 | 3 | 0 | 7 | 4 | 1 | 0 |
| Treatment | 2 | 0 | 4 | 3 | 4 | 1 | 0 |
| Use of Non-Typical Visualizations | |||||||
| Always | Very Frequently | Frequently | Occasionally | Rarely | Very Rarely | Never | |
| Control | 0 | 0 | 0 | 2 | 5 | 6 | 3 |
| Treatment | 0 | 1 | 1 | 3 | 2 | 3 | 4 |
| Question Set | Confidence Level | |||
|---|---|---|---|---|
| Control | Treatment | Control | Treatment | |
| Mean | 57.31 | 70.68 | 75.92 | 85.38 |
| Standard Error | 4.16 | 4.16 | 2.85 | 2.43 |
| Median | 56.41 | 69.33 | 80.18 | 85 |
| Mode | 48.68 | 88.49 | 82.14 | N/A |
| Standard Deviation | 17.17 | 16.66 | 11.74 | 9.72 |
| Question Set | Confidence | |
|---|---|---|
| F(1,32) | 5.15 | 6.31 |
| Fcrit | 4.16 | 4.16 |
| p-value | 0.030 | 0.017 |
| Visualization | Task |
|---|---|
| Geography | At a global level, what are the risk factors that contribute to death from tuberculosis? |
| Chronology | Which cause-clusters significantly increased in rank between 1990 and 2010? |
| Demography | For which age groups, is dietary risk factor and physical inactivity the highest ranked risk-cluster that contributes to death? |
| Overview | Which cancer results in the highest number of deaths for adults in sub-Saharan Africa? |
| Gender | |||||||
| Group | Male | Female | |||||
| Control | 5 | 9 | |||||
| Treatment | 5 | 9 | |||||
| Program Level | |||||||
| Undergraduate | Graduate | ||||||
| Control | 8 | 6 | |||||
| Treatment | 9 | 5 | |||||
| Use of Non-Typical Visualizations | |||||||
| Always | Very Frequently | Frequently | Occasionally | Rarely | Very Rarely | Never | |
| Control | 1 | 0 | 0 | 0 | 4 | 4 | 5 |
| Treatment | 1 | 0 | 1 | 2 | 3 | 1 | 6 |
| Exposure to global health concepts in school | |||||||
| Strongly Agree | Agree | Somewhat Agree | Neither Agree nor Disagree | Somewhat Disagree | Disagree | Strongly Disagree | |
| Control | 1 | 3 | 4 | 0 | 4 | 1 | 1 |
| Treatment | 1 | 3 | 5 | 1 | 3 | 1 | 0 |
| Treatment | Control | |
|---|---|---|
| Mean | 78.93 | 21.07 |
| Standard Error | 3.44 | 2.30 |
| Median | 82.50 | 20.00 |
| Mode | 60.00 | 15.00 |
| Standard Deviation | 12.89 | 8.59 |
© 2017 by the authors. Licensee MDPI, Basel, Switzerland. This article is an open access article distributed under the terms and conditions of the Creative Commons Attribution (CC BY) license (http://creativecommons.org/licenses/by/4.0/).
Share and Cite
Ola, O.; Sedig, K. Health Literacy for the General Public: Making a Case for Non-Trivial Visualizations. Informatics 2017, 4, 33. https://doi.org/10.3390/informatics4040033
Ola O, Sedig K. Health Literacy for the General Public: Making a Case for Non-Trivial Visualizations. Informatics. 2017; 4(4):33. https://doi.org/10.3390/informatics4040033
Chicago/Turabian StyleOla, Oluwakemi, and Kamran Sedig. 2017. "Health Literacy for the General Public: Making a Case for Non-Trivial Visualizations" Informatics 4, no. 4: 33. https://doi.org/10.3390/informatics4040033
APA StyleOla, O., & Sedig, K. (2017). Health Literacy for the General Public: Making a Case for Non-Trivial Visualizations. Informatics, 4(4), 33. https://doi.org/10.3390/informatics4040033