Supporting Sensemaking of Complex Objects with Visualizations: Visibility and Complementarity of Interactions
Abstract
:1. Introduction
2. Background
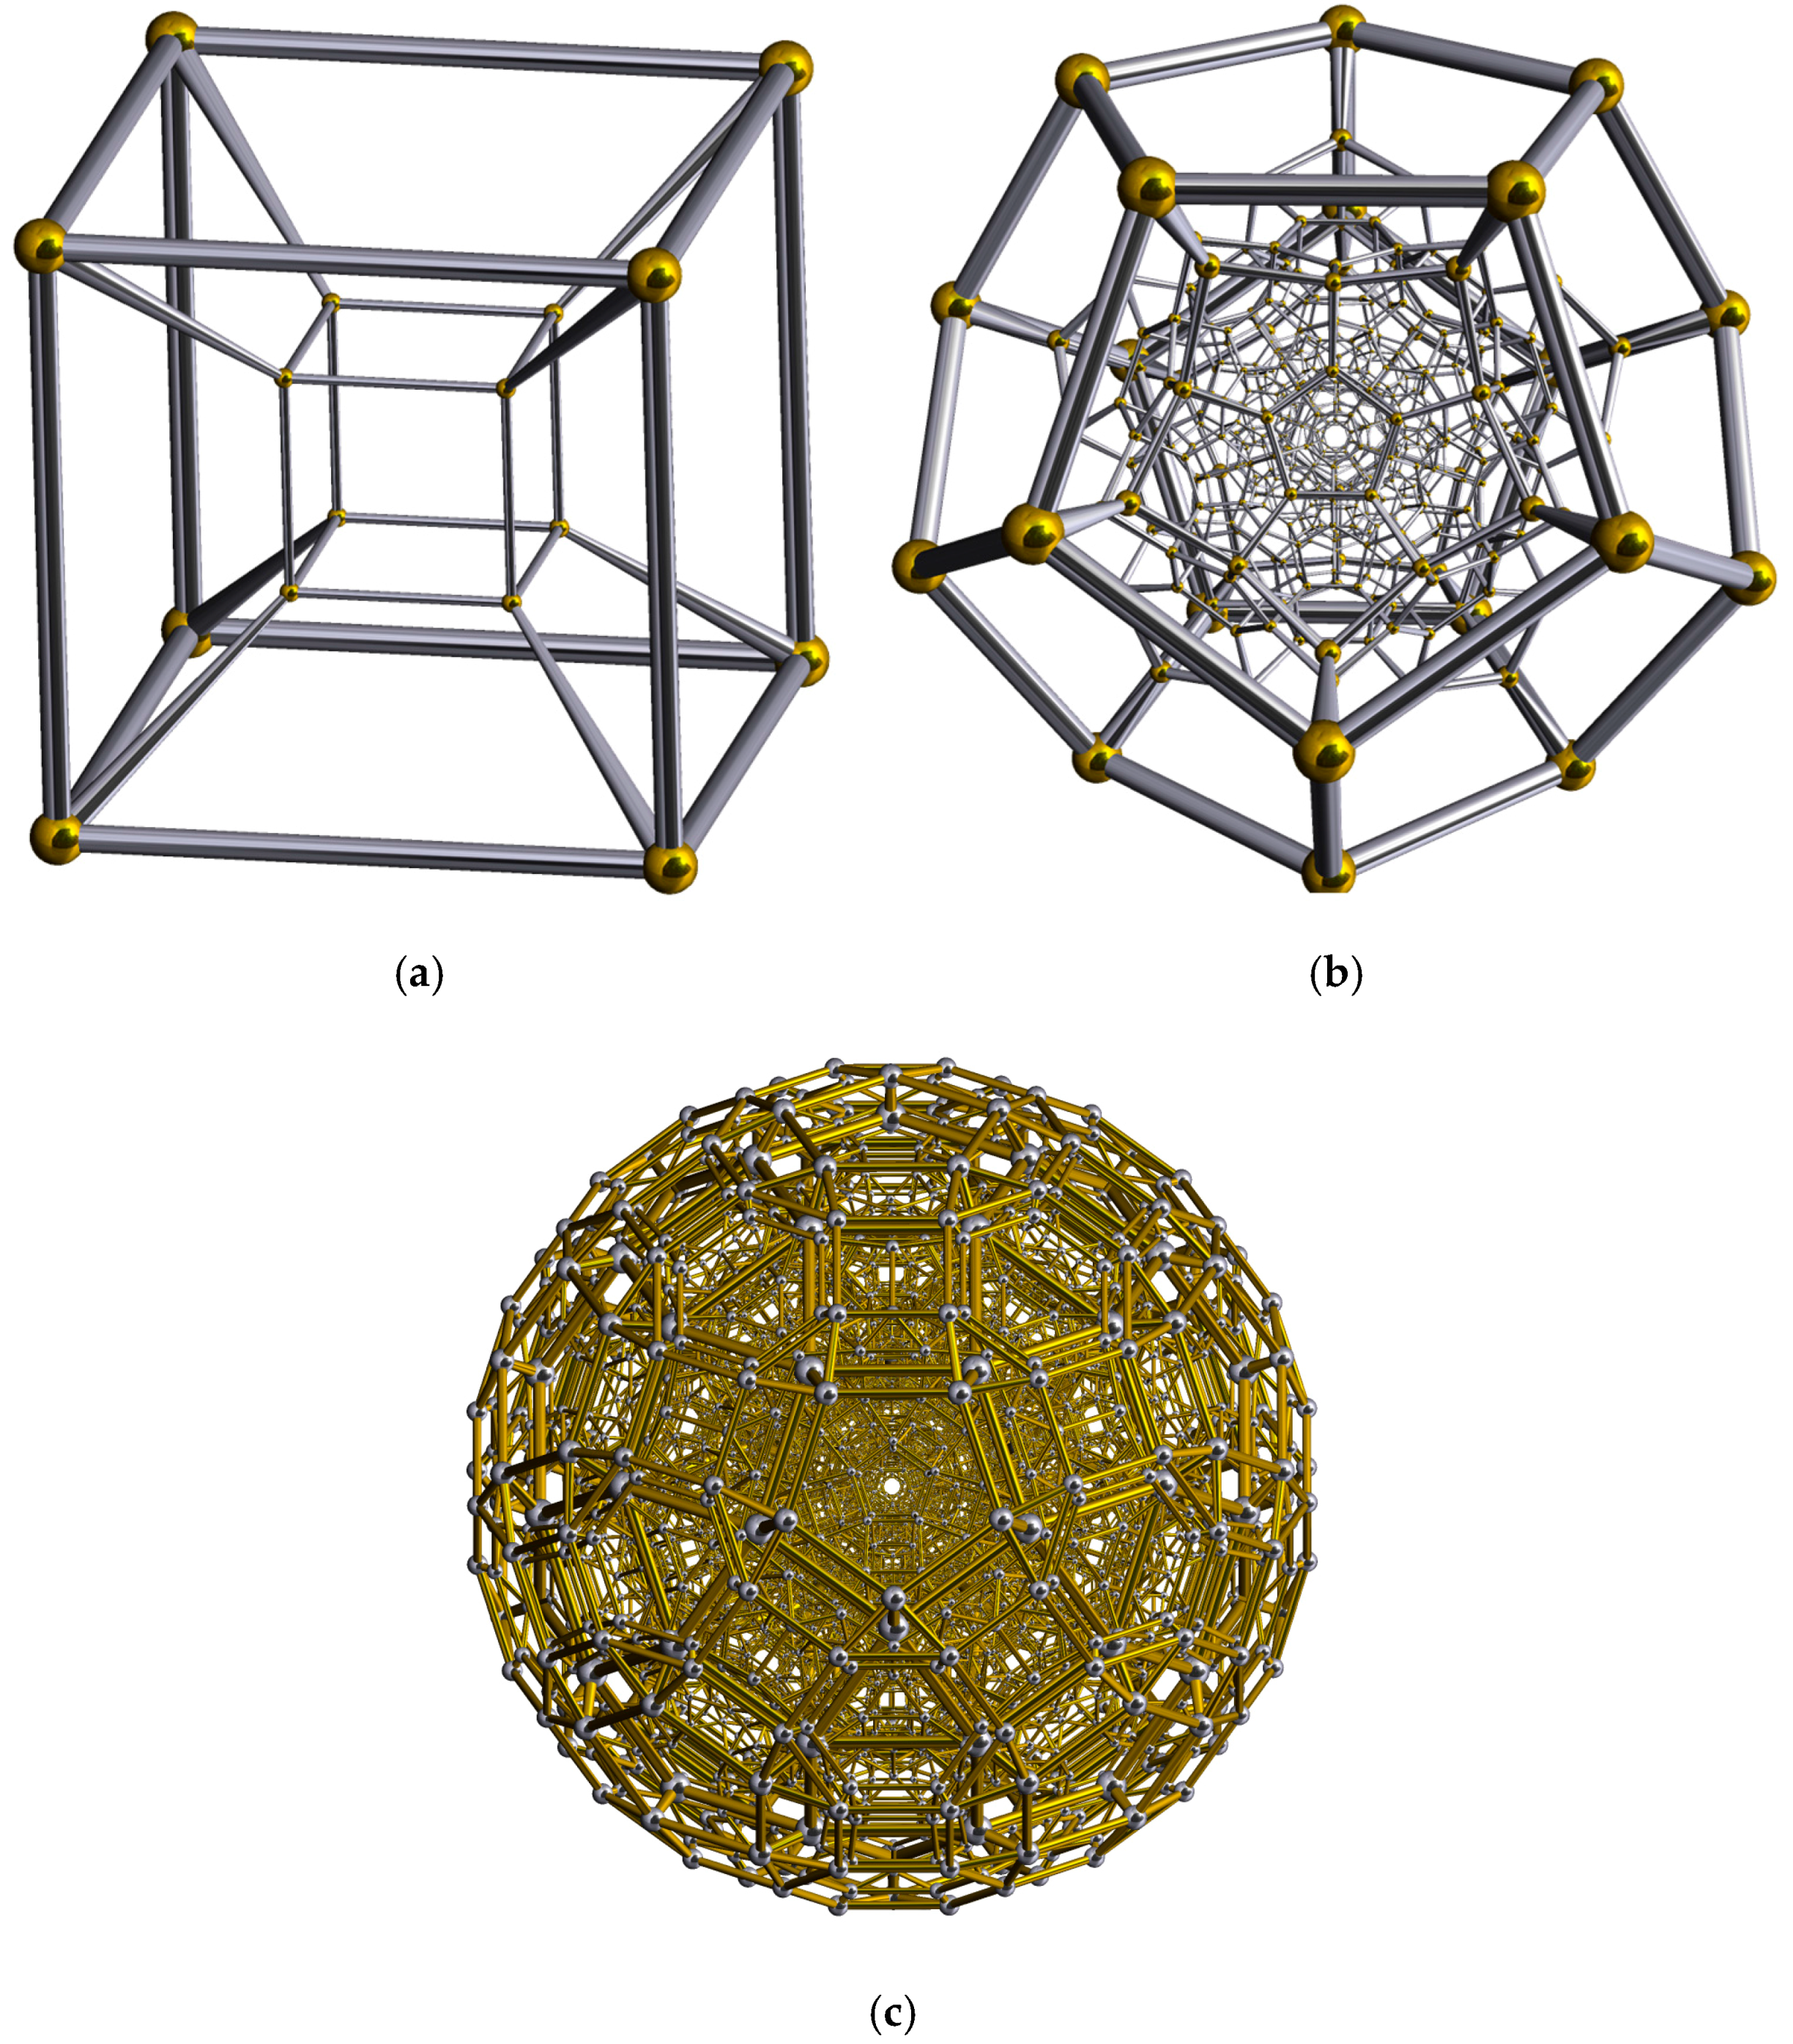
2.1. Complex Objects
2.2. Visibility
2.3. Complementary Interactions
3. Theoretical Framework
3.1. Complex Cognitive Activities
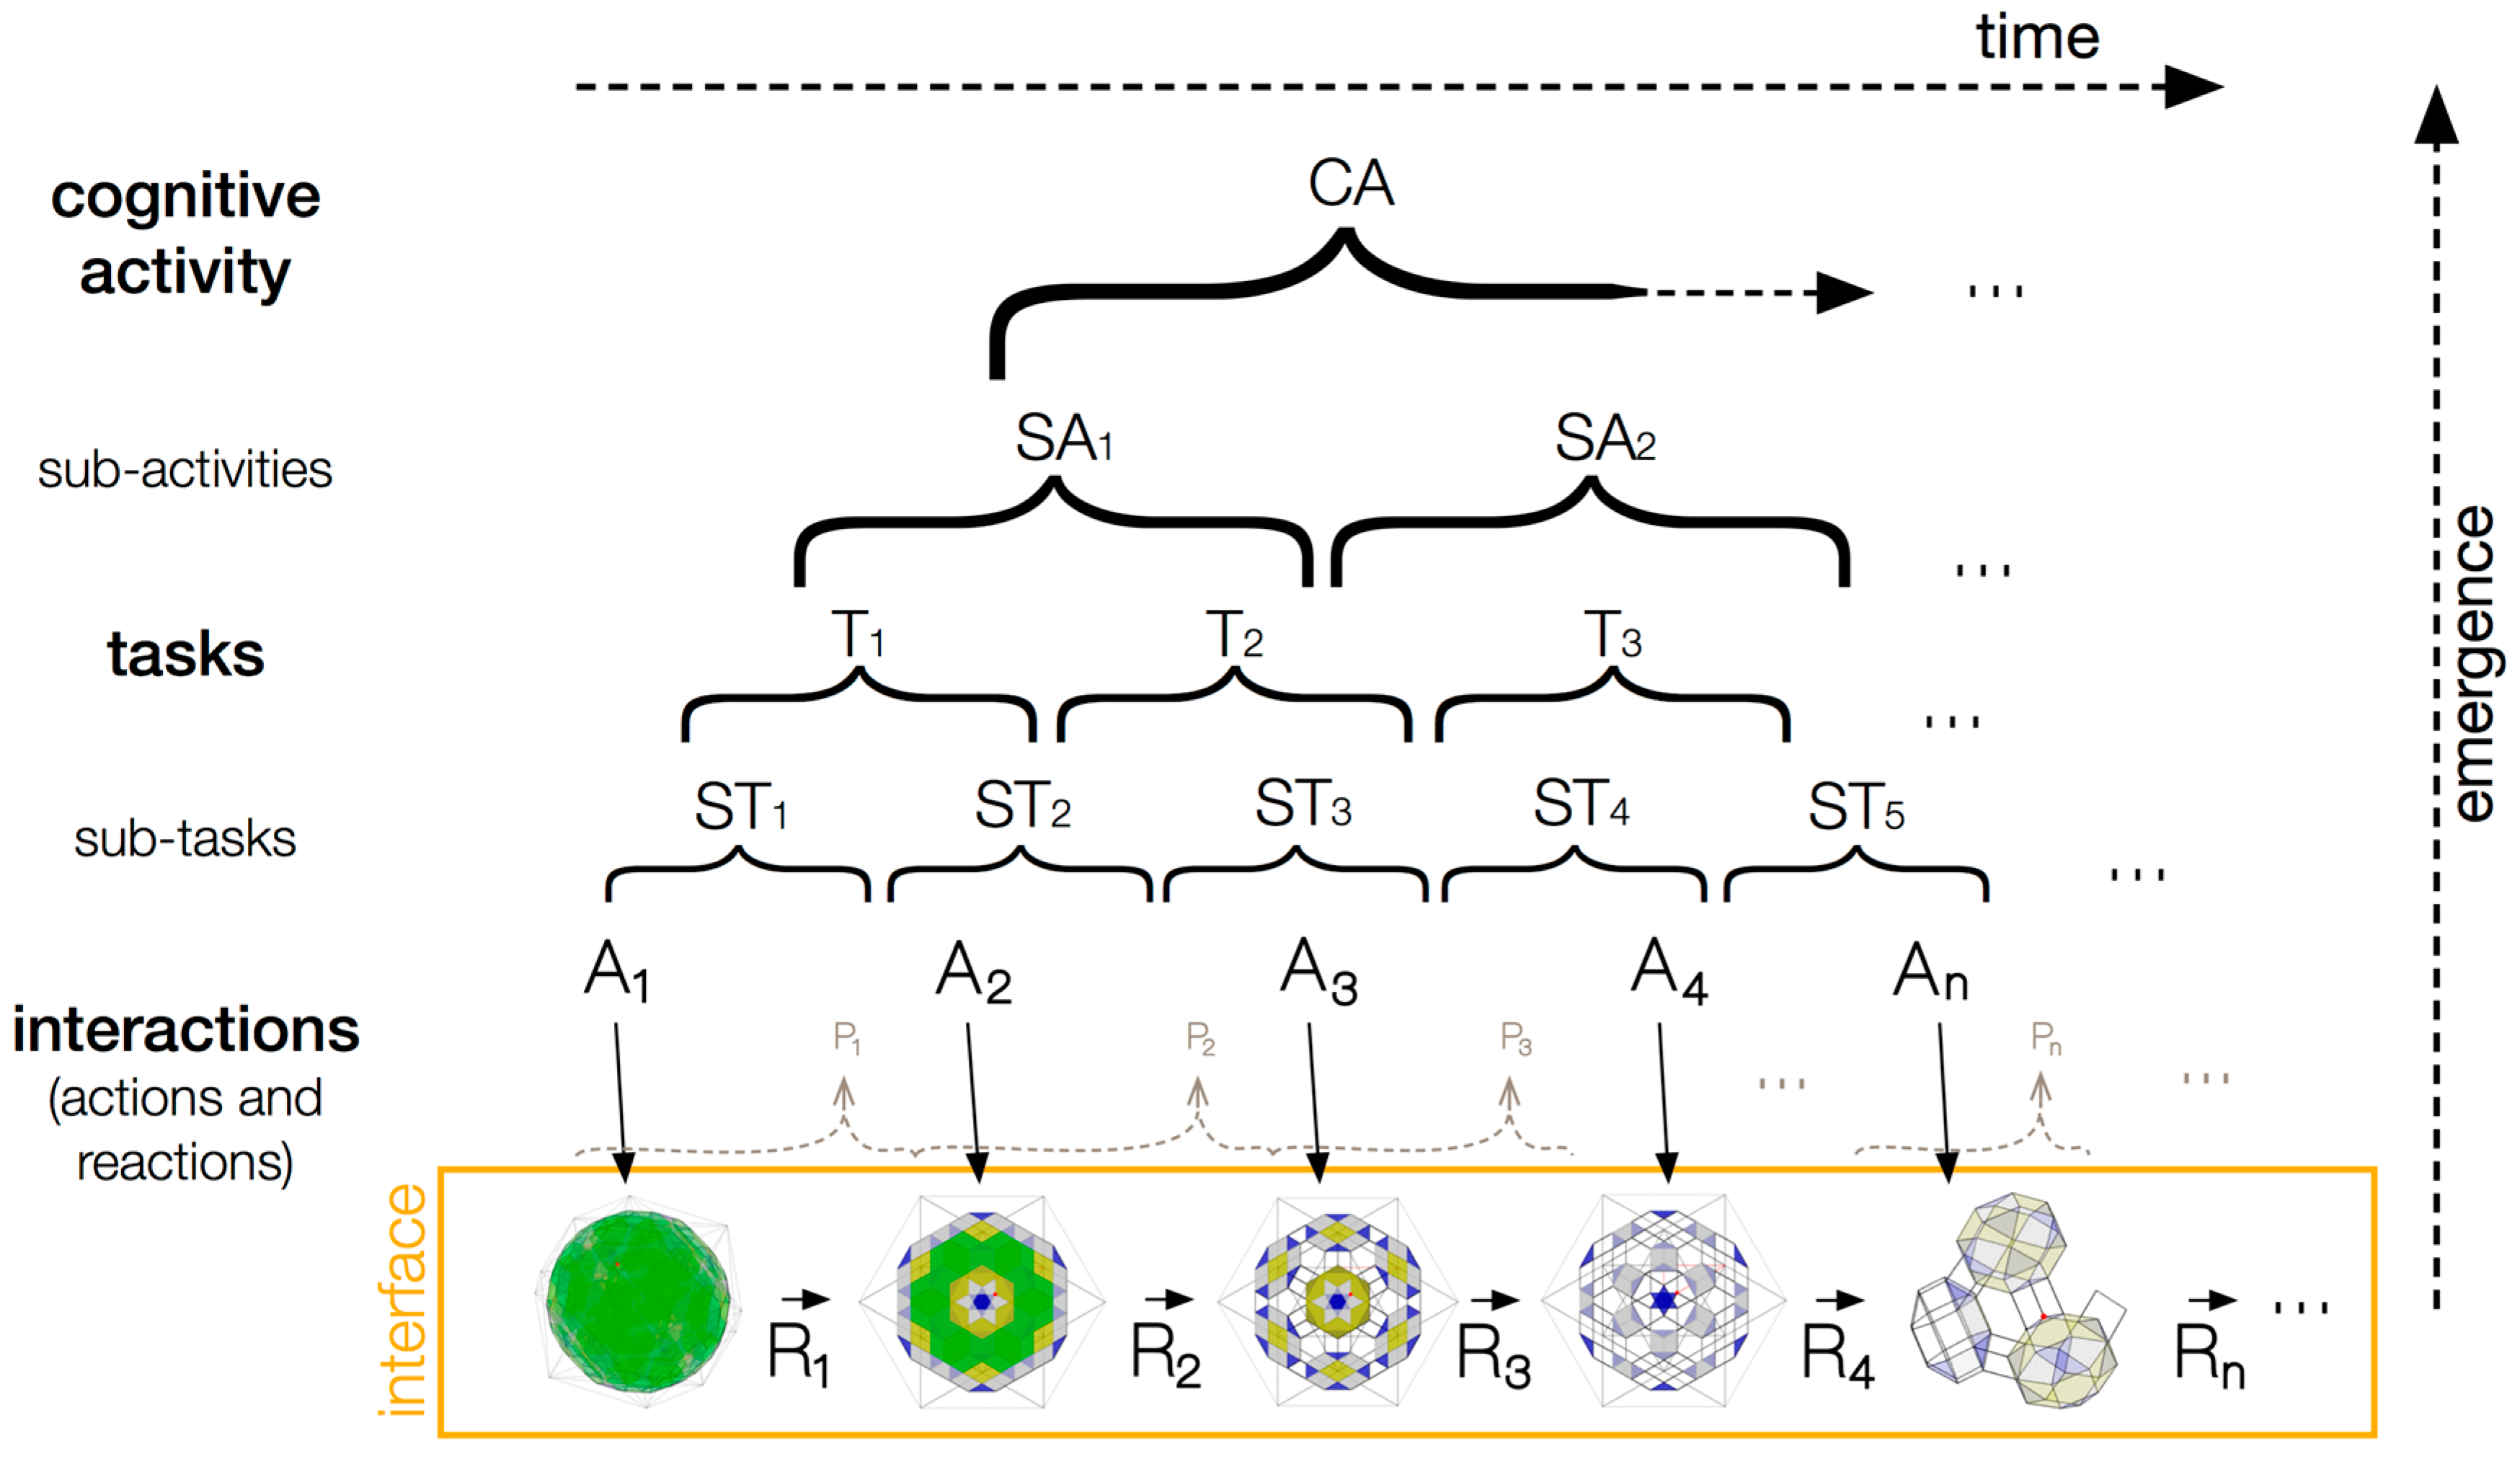
3.2. Conceptual Tools for Interactive Visualization Design
3.3. Application of the Theoretical Framework
4. Problem Domain and Justification
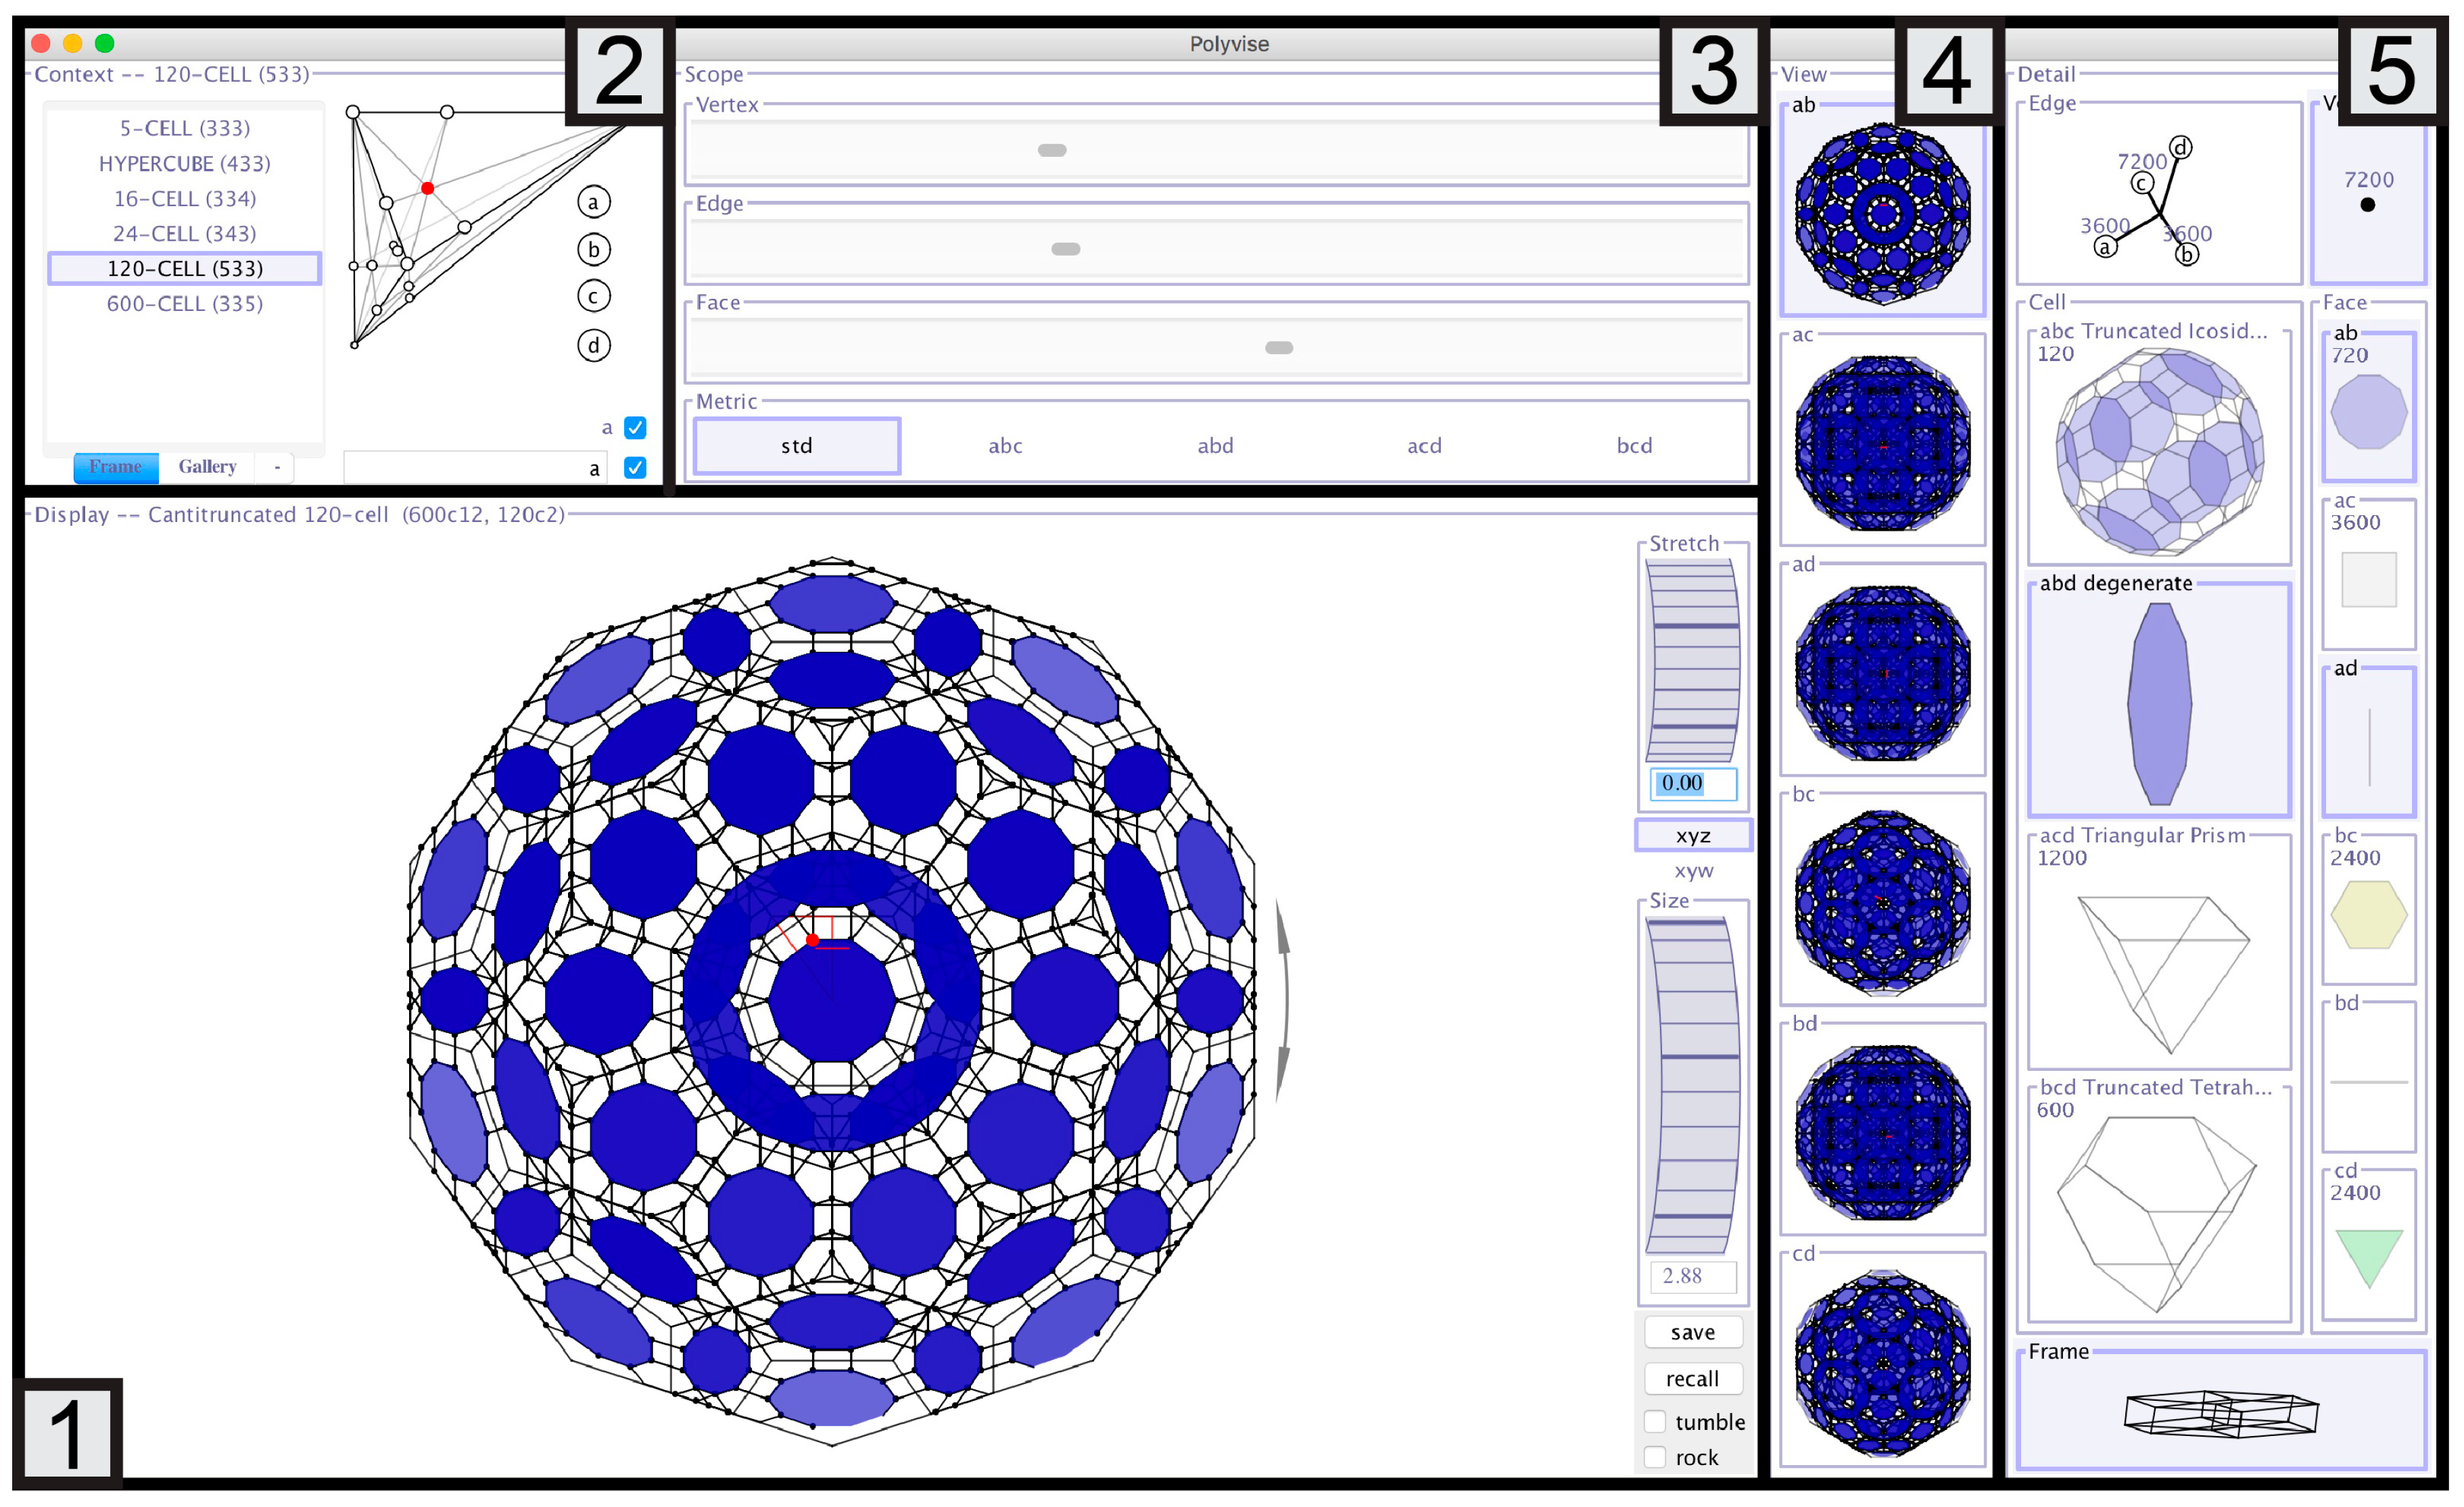
5. Polyvise
5.1. Interaction Techniques
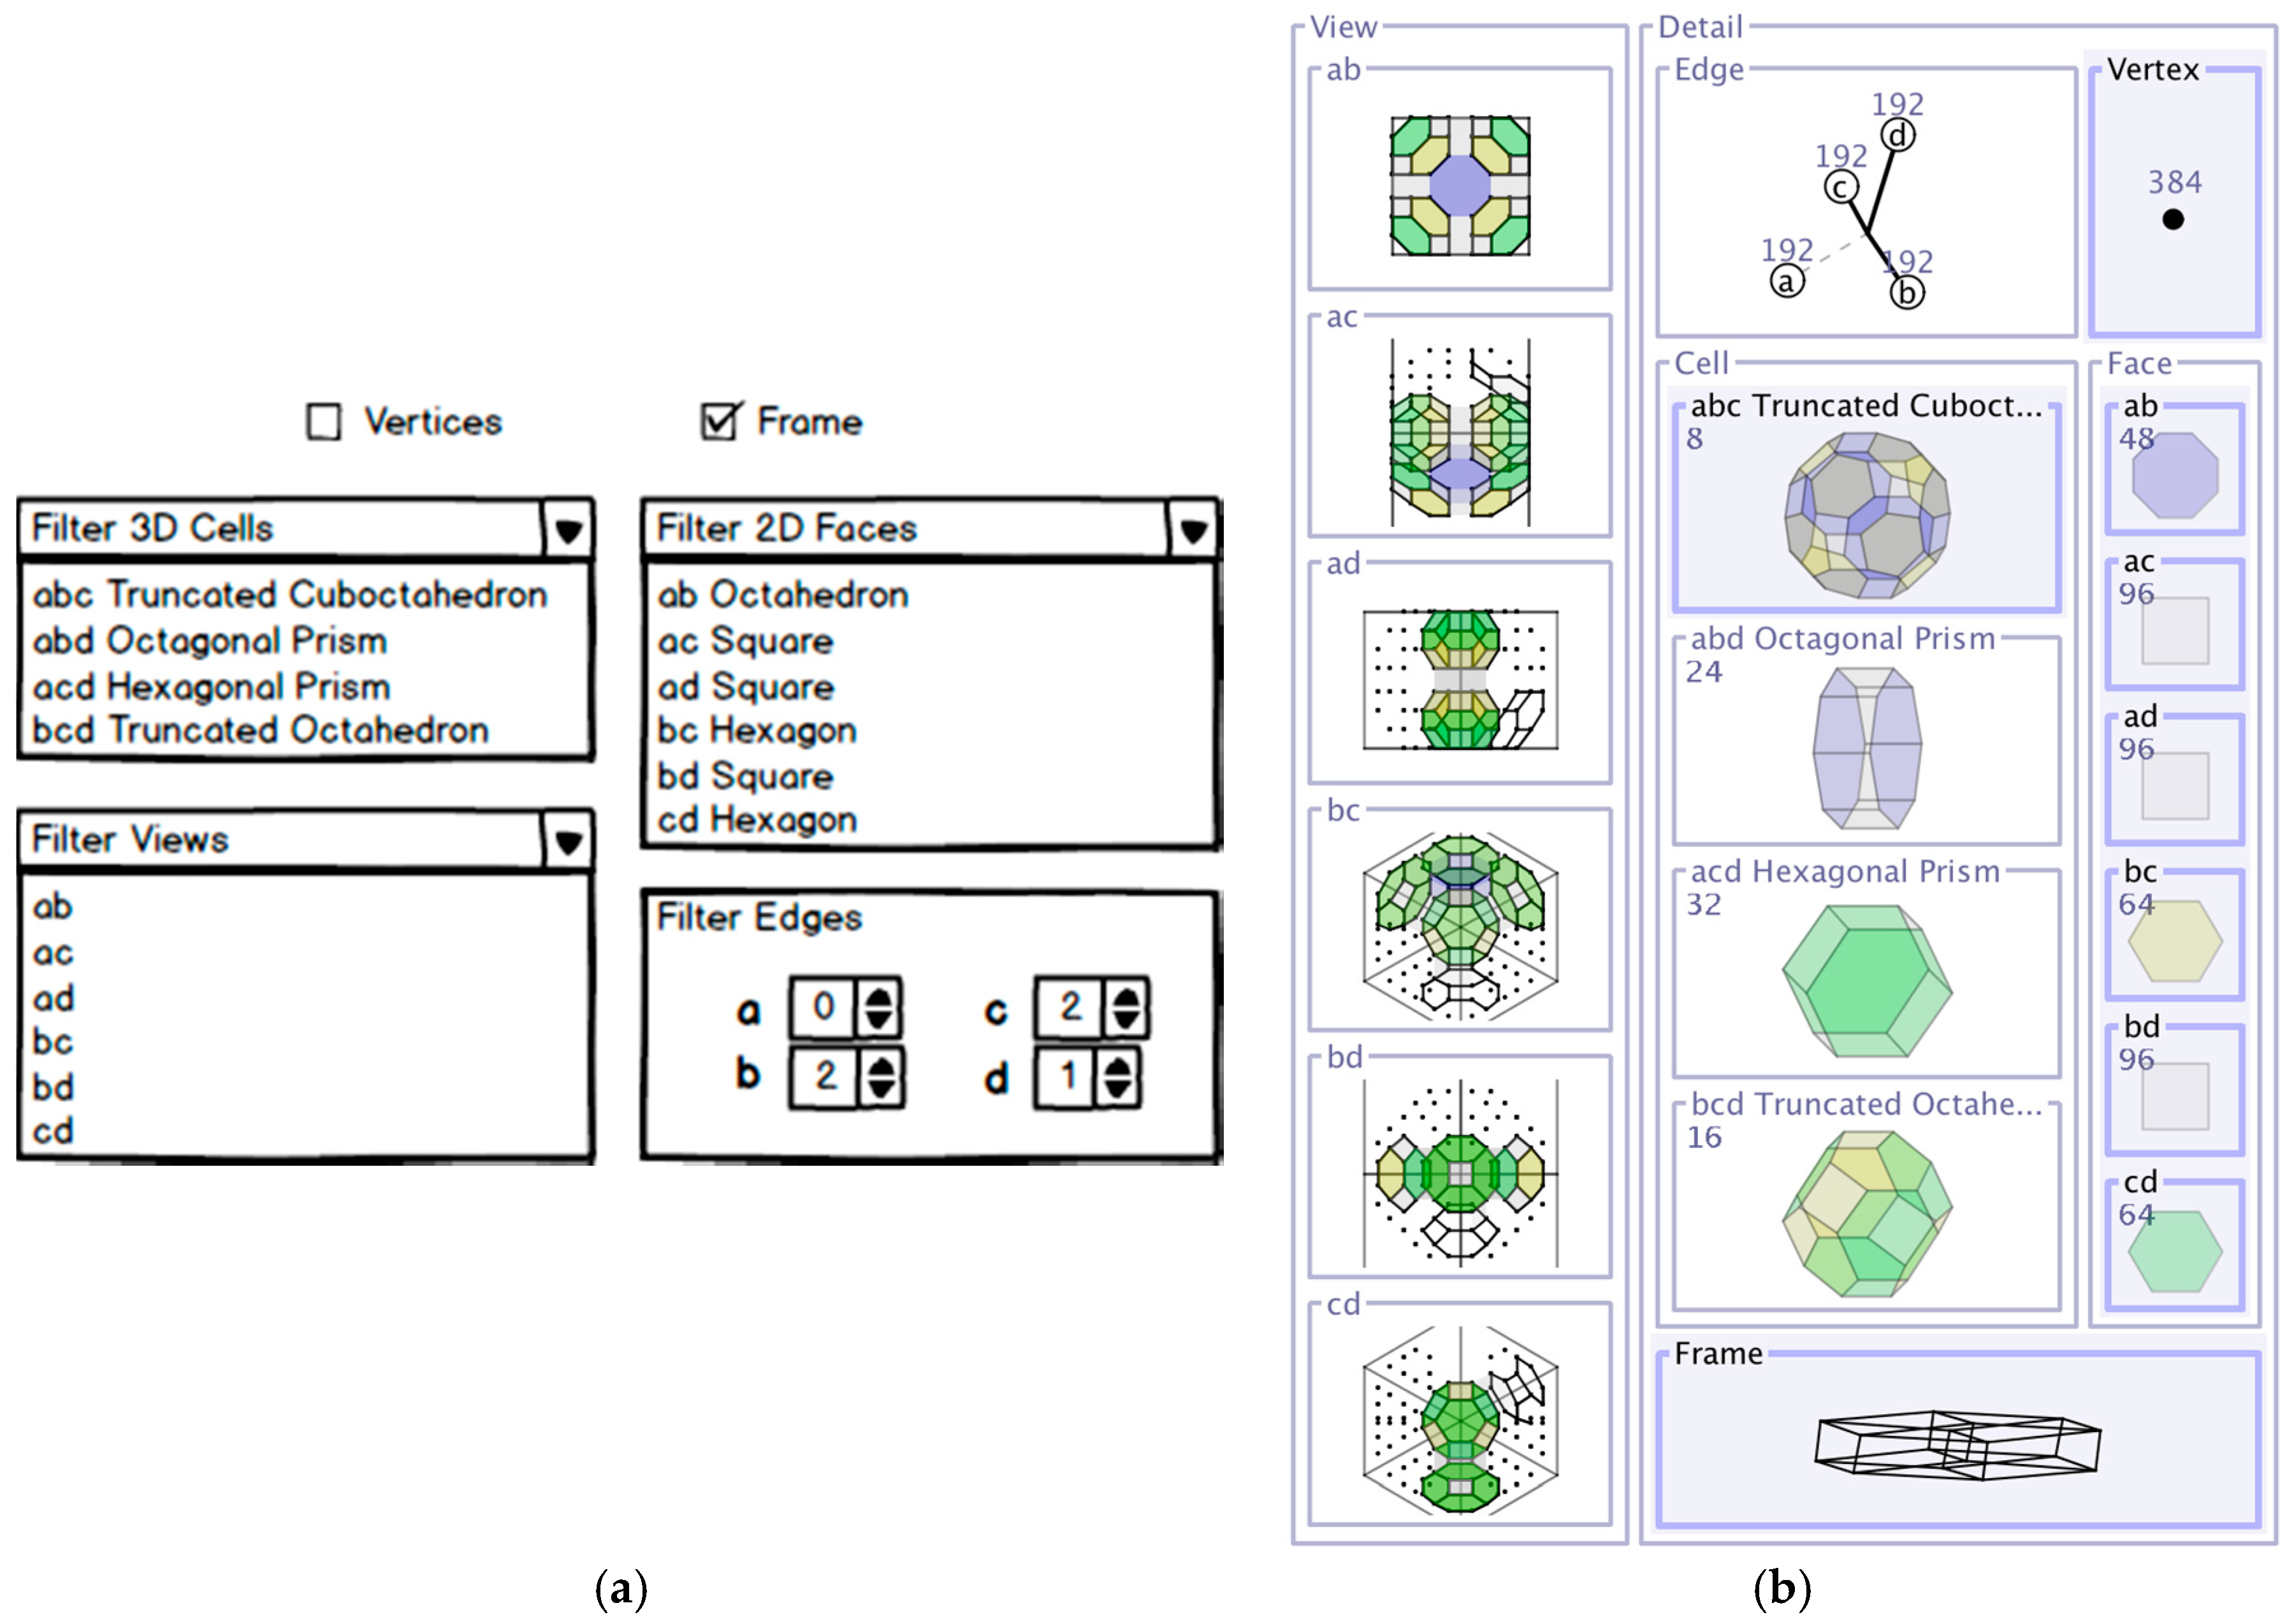
5.1.1. Filtering
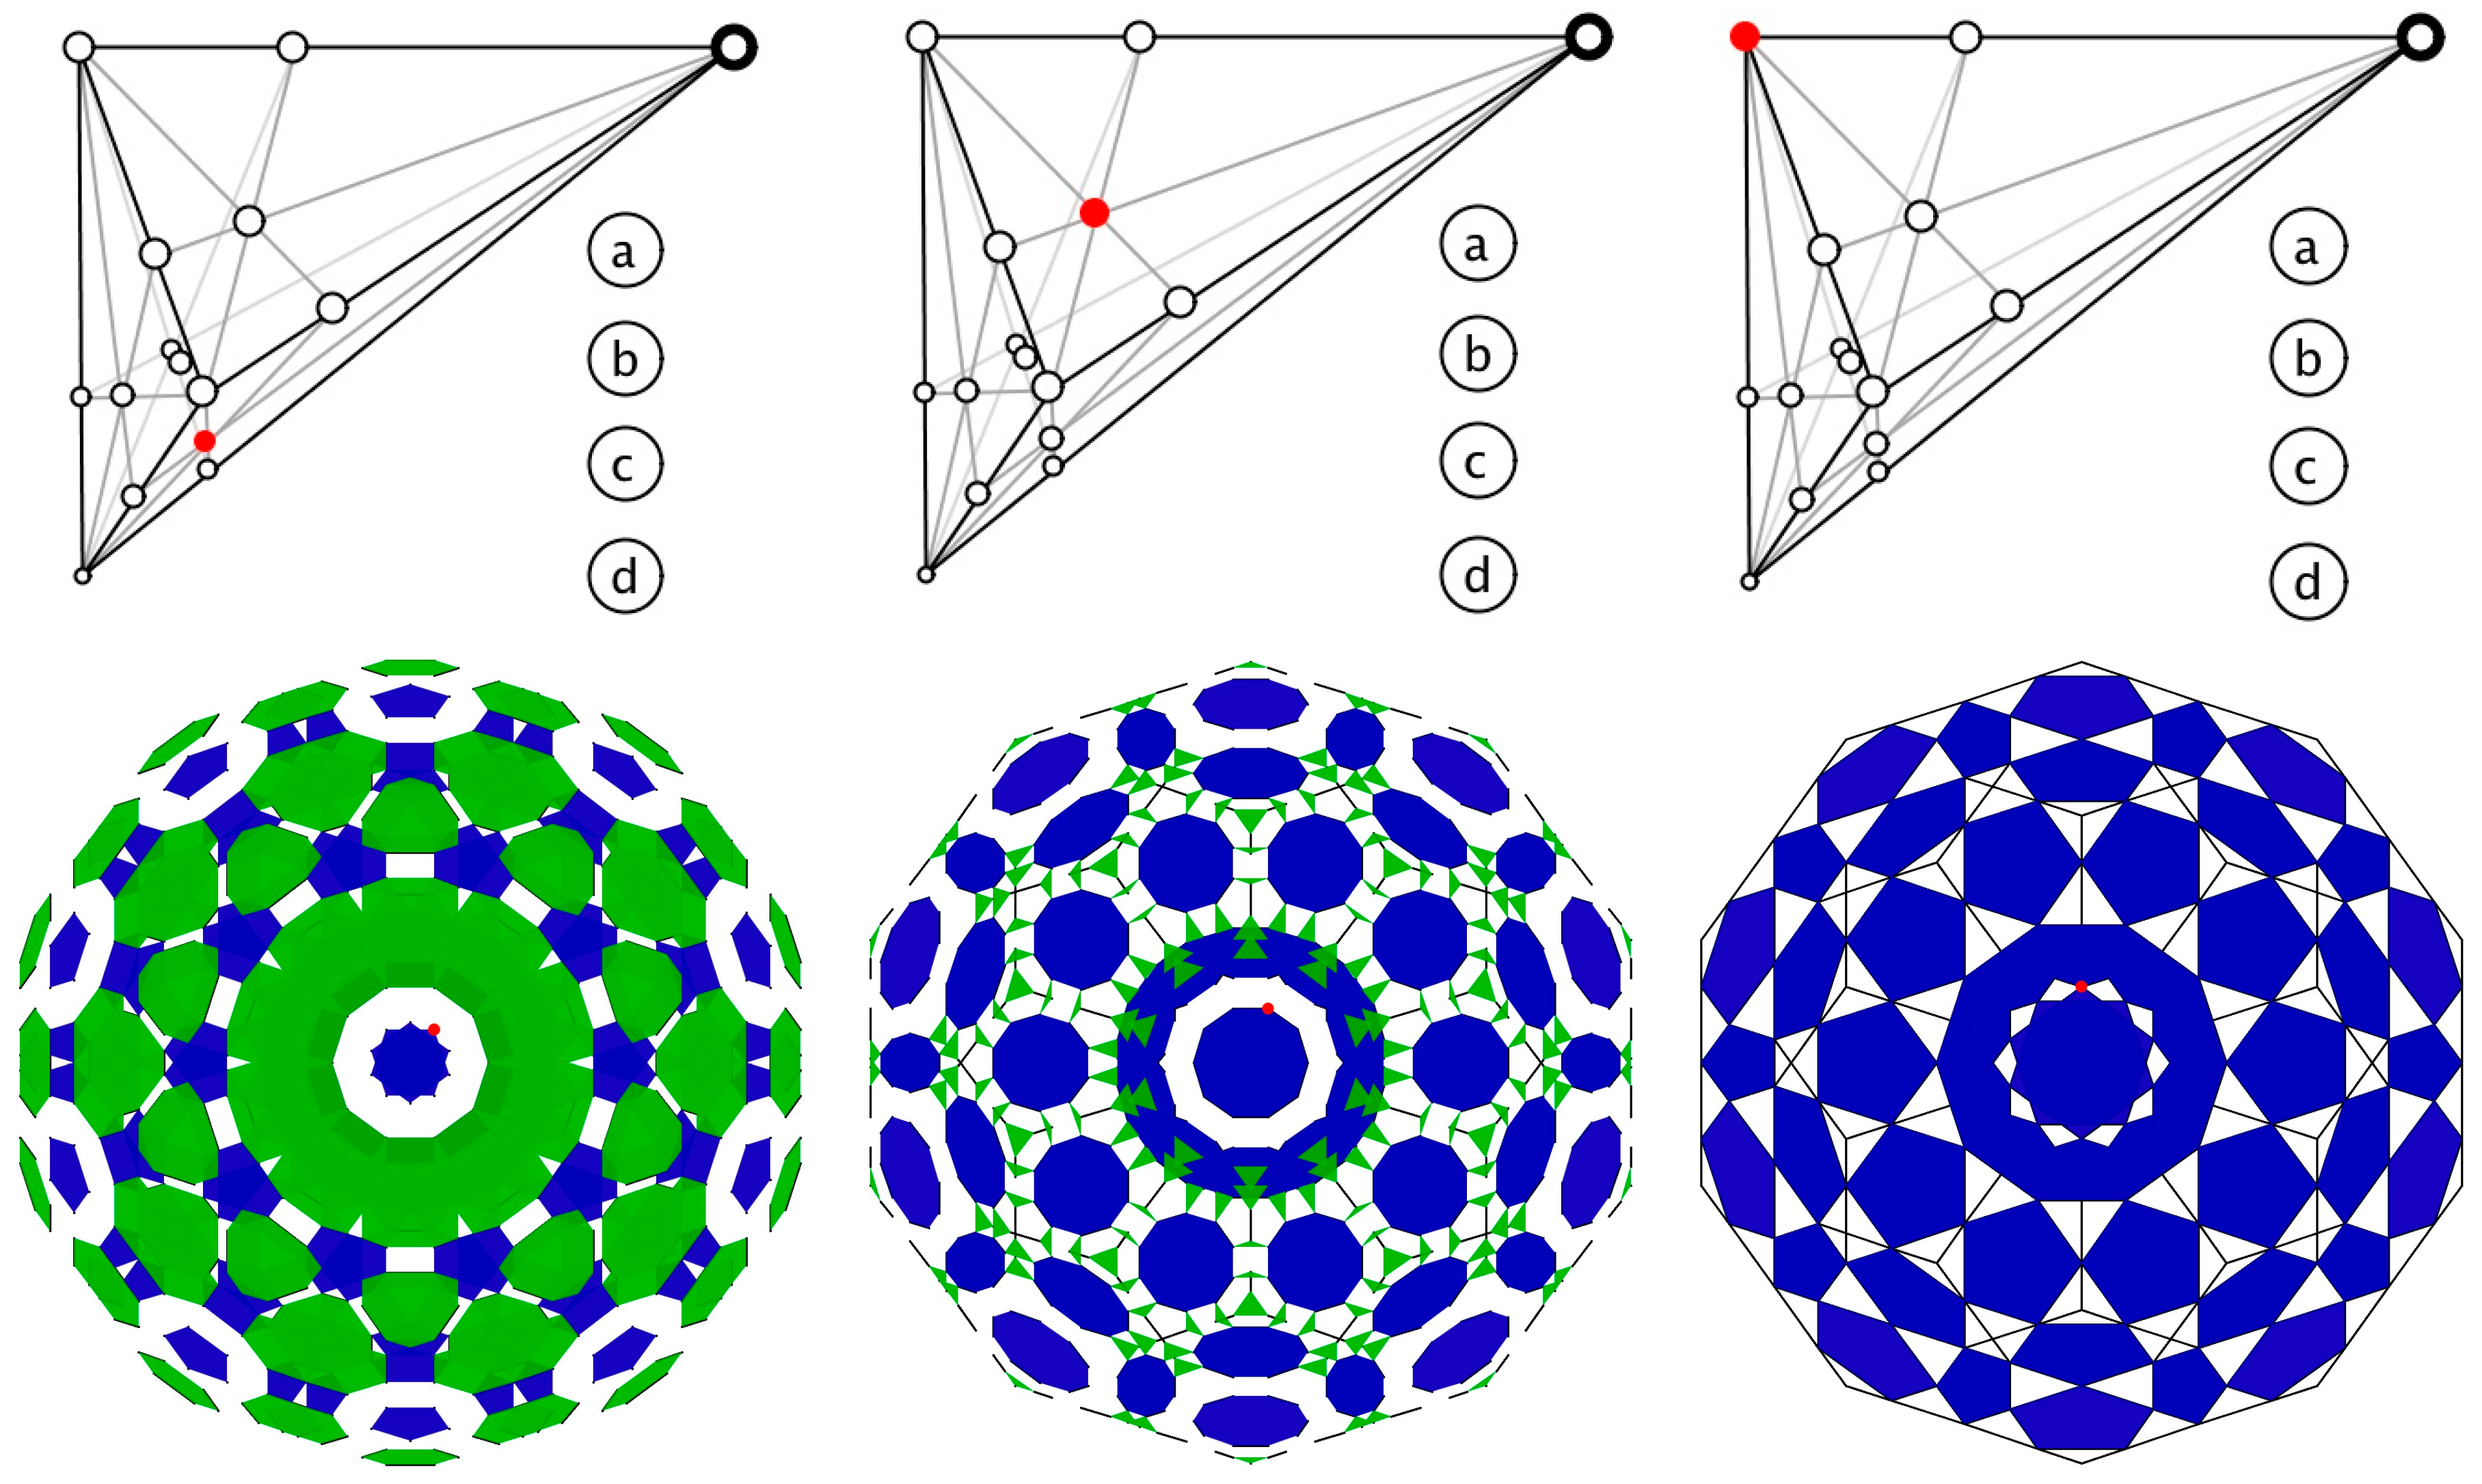
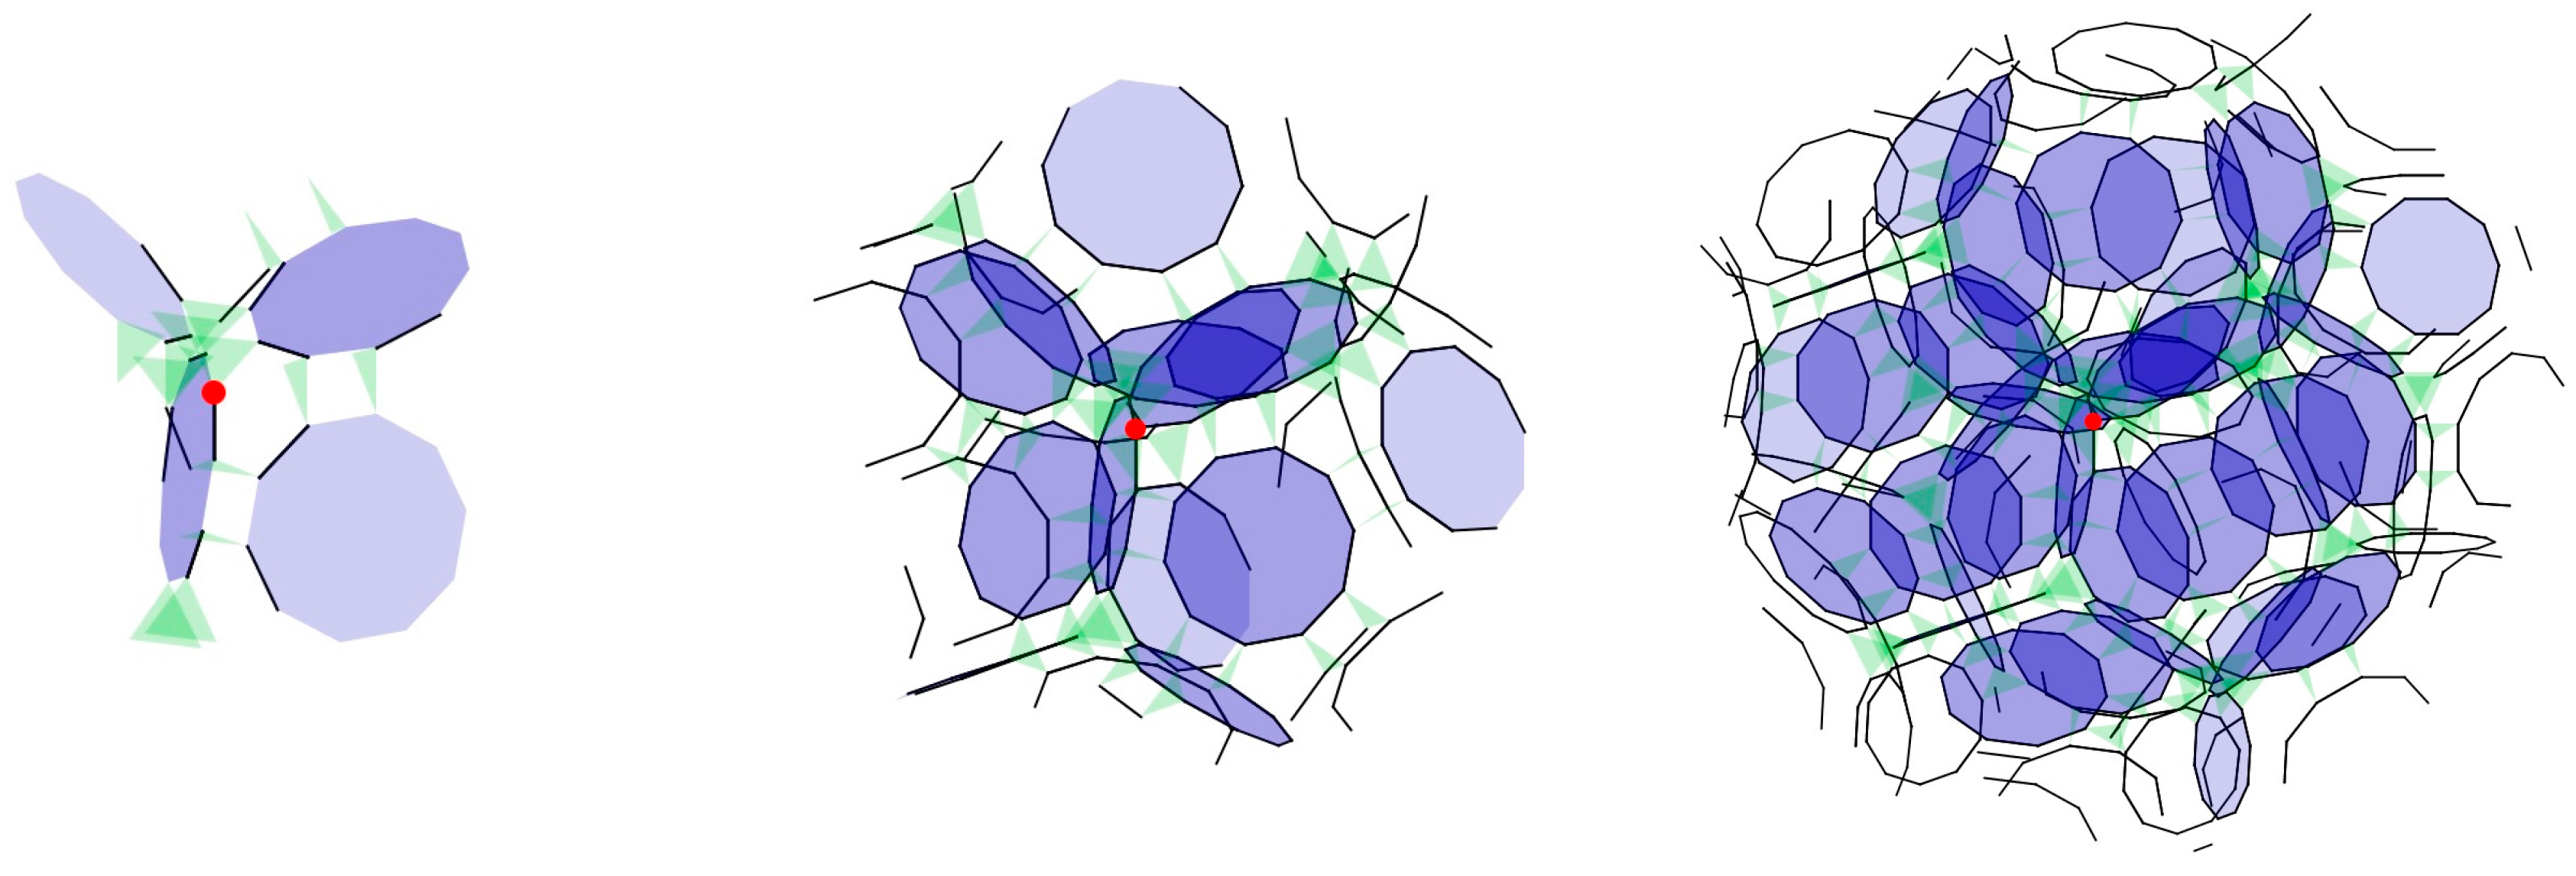
5.1.2. Focus+Scoping
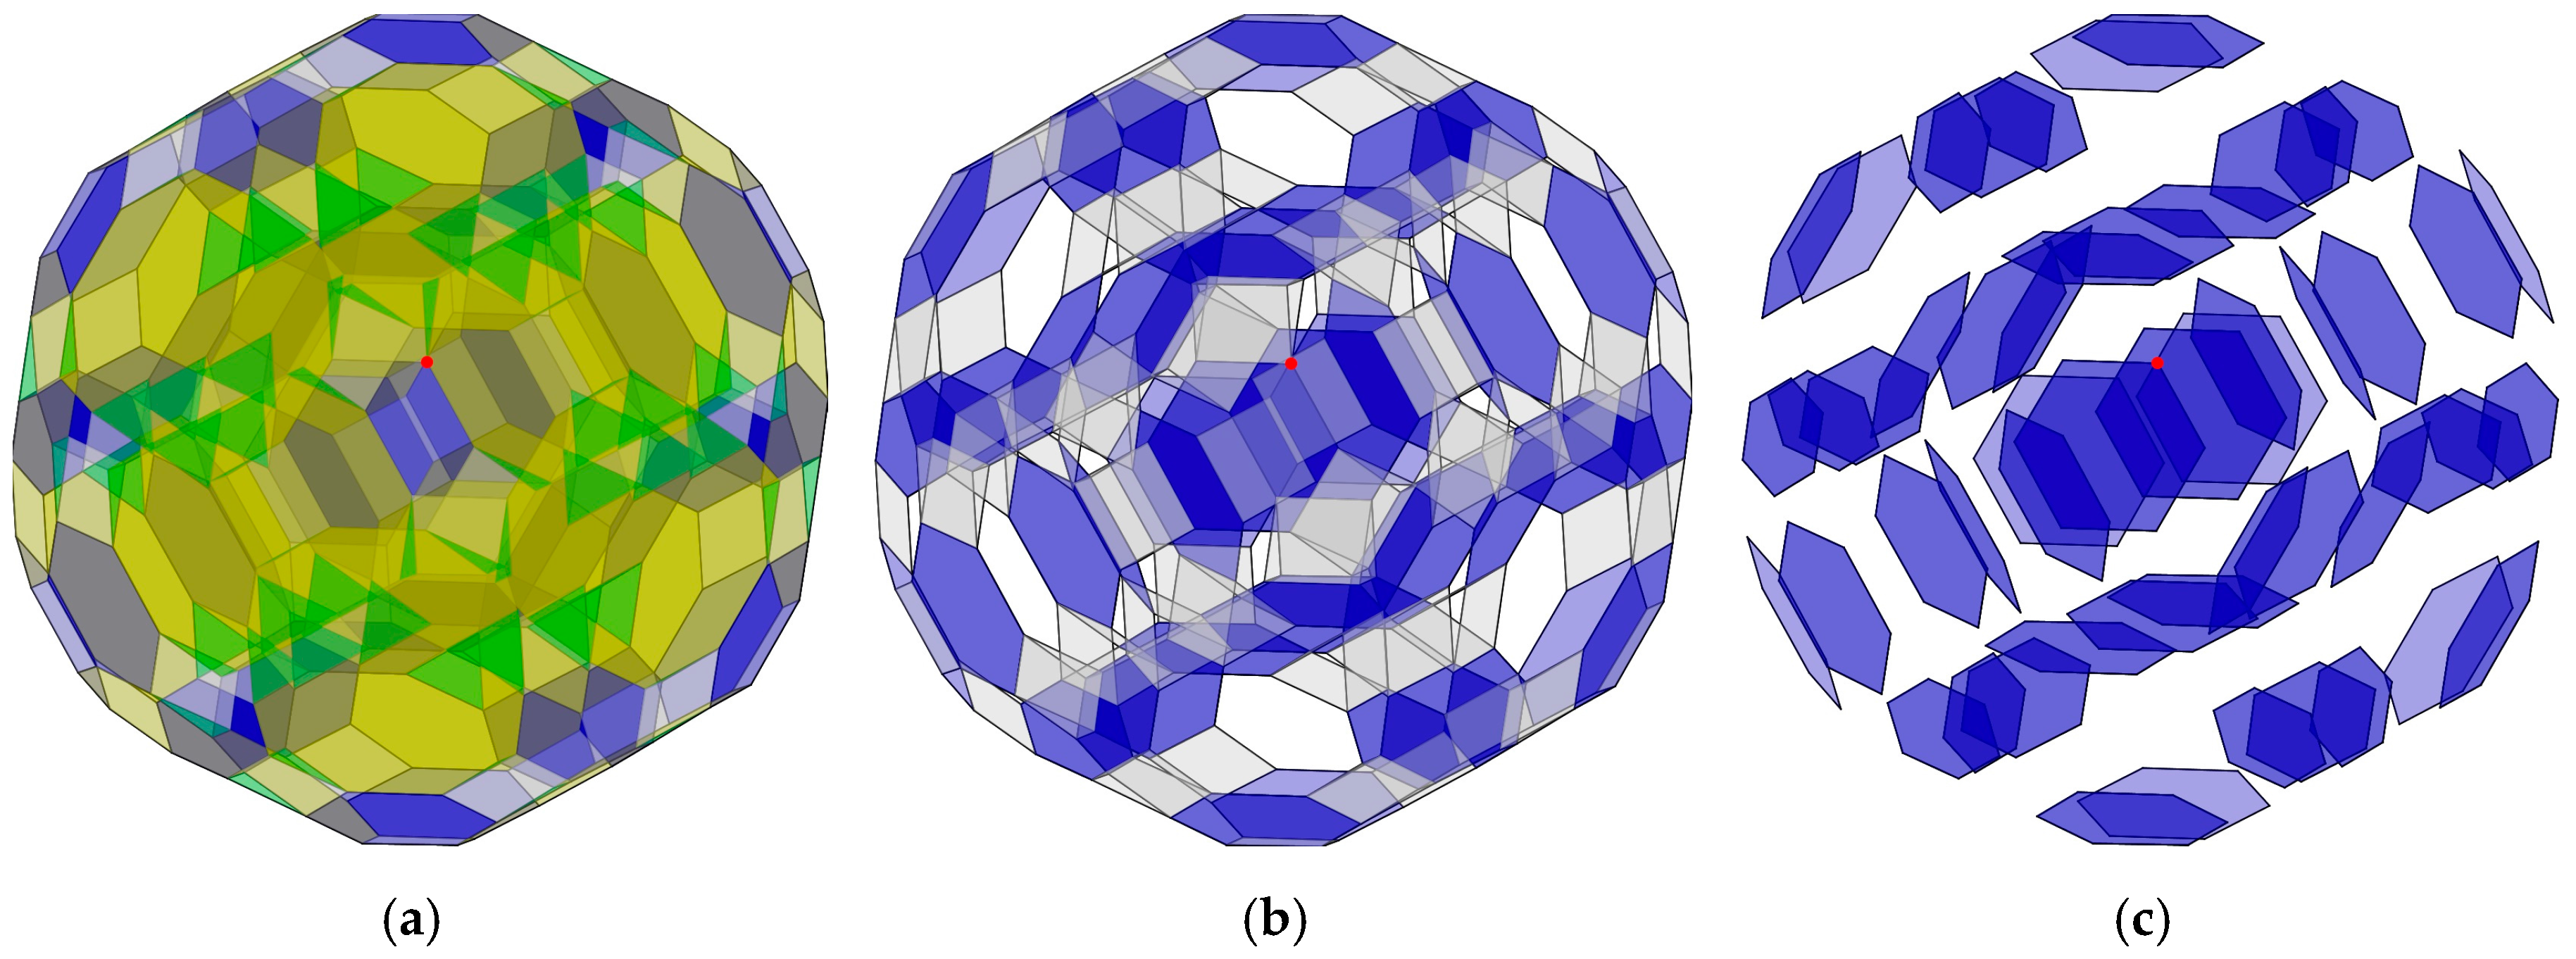
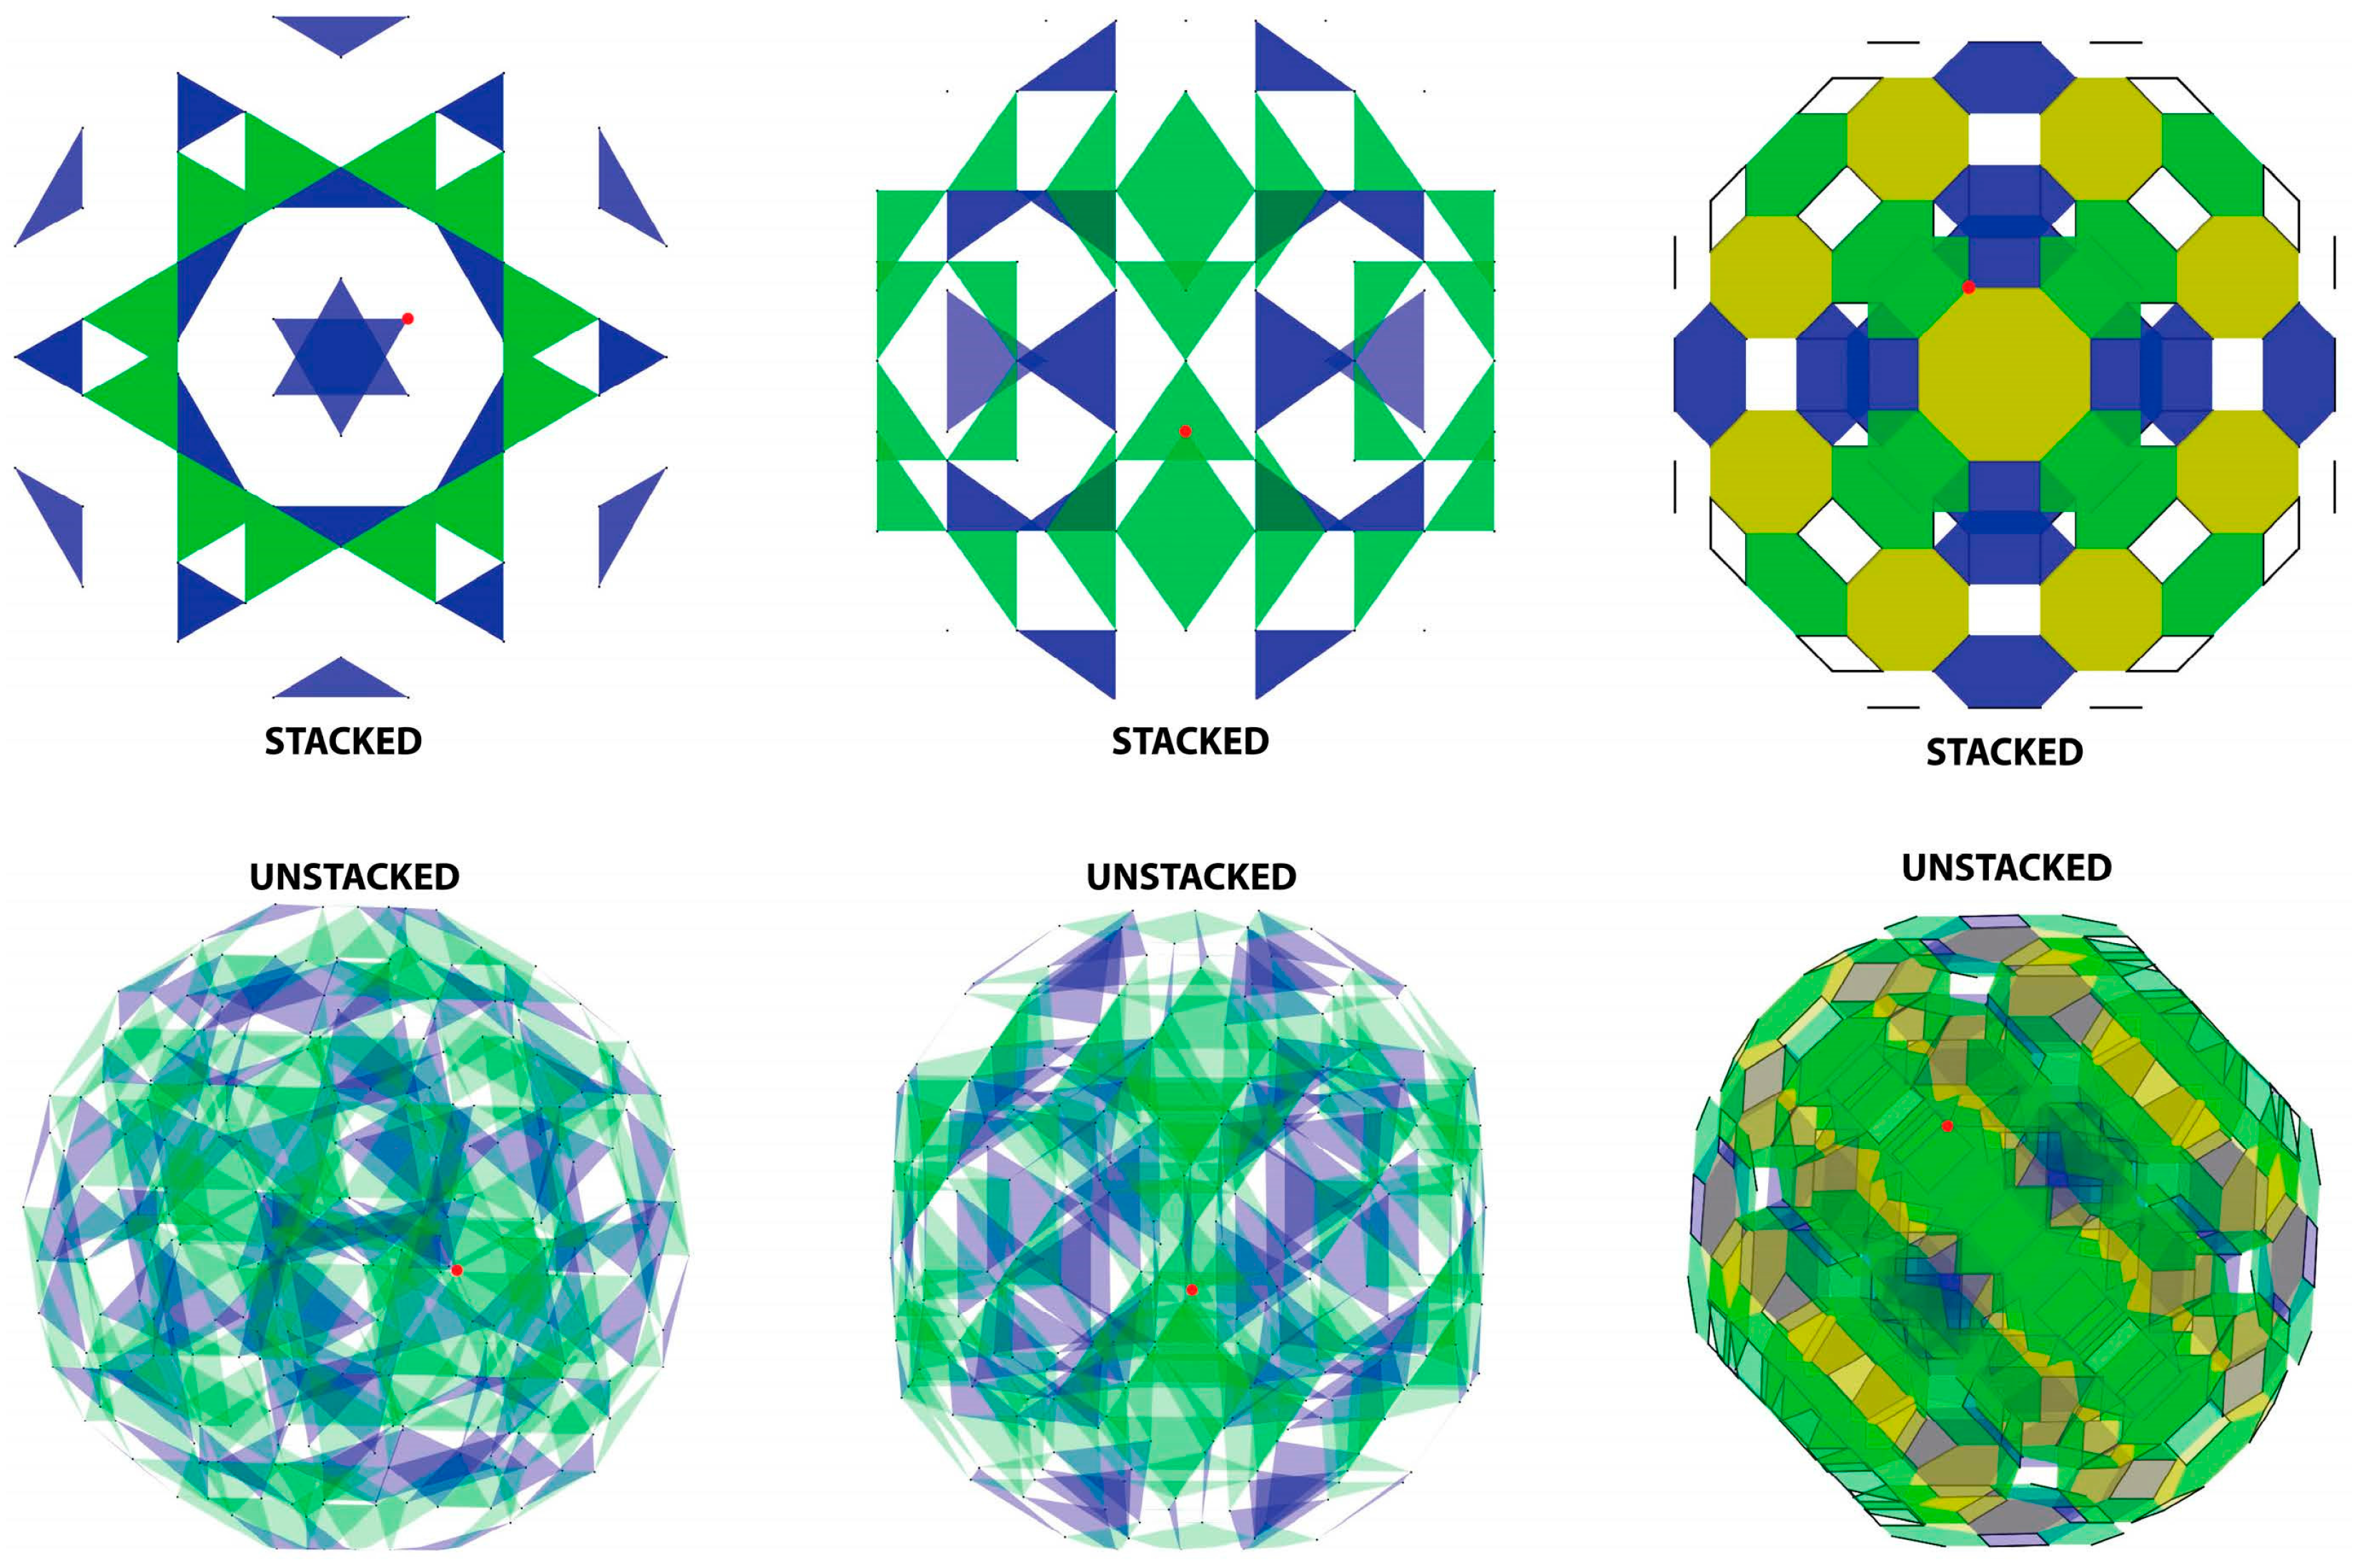
5.1.3. Stacking–Unstacking
5.2. Interaction Design Strategies
5.2.1. Visibility
5.2.2. Complementary Interactions
6. Usability Evaluation
6.1. Design and Participants
6.2. Procedure
6.3. Tasks
7. Results
7.1. Overall Effectiveness and Usability of Polyvise
7.2. Effect of Visibility
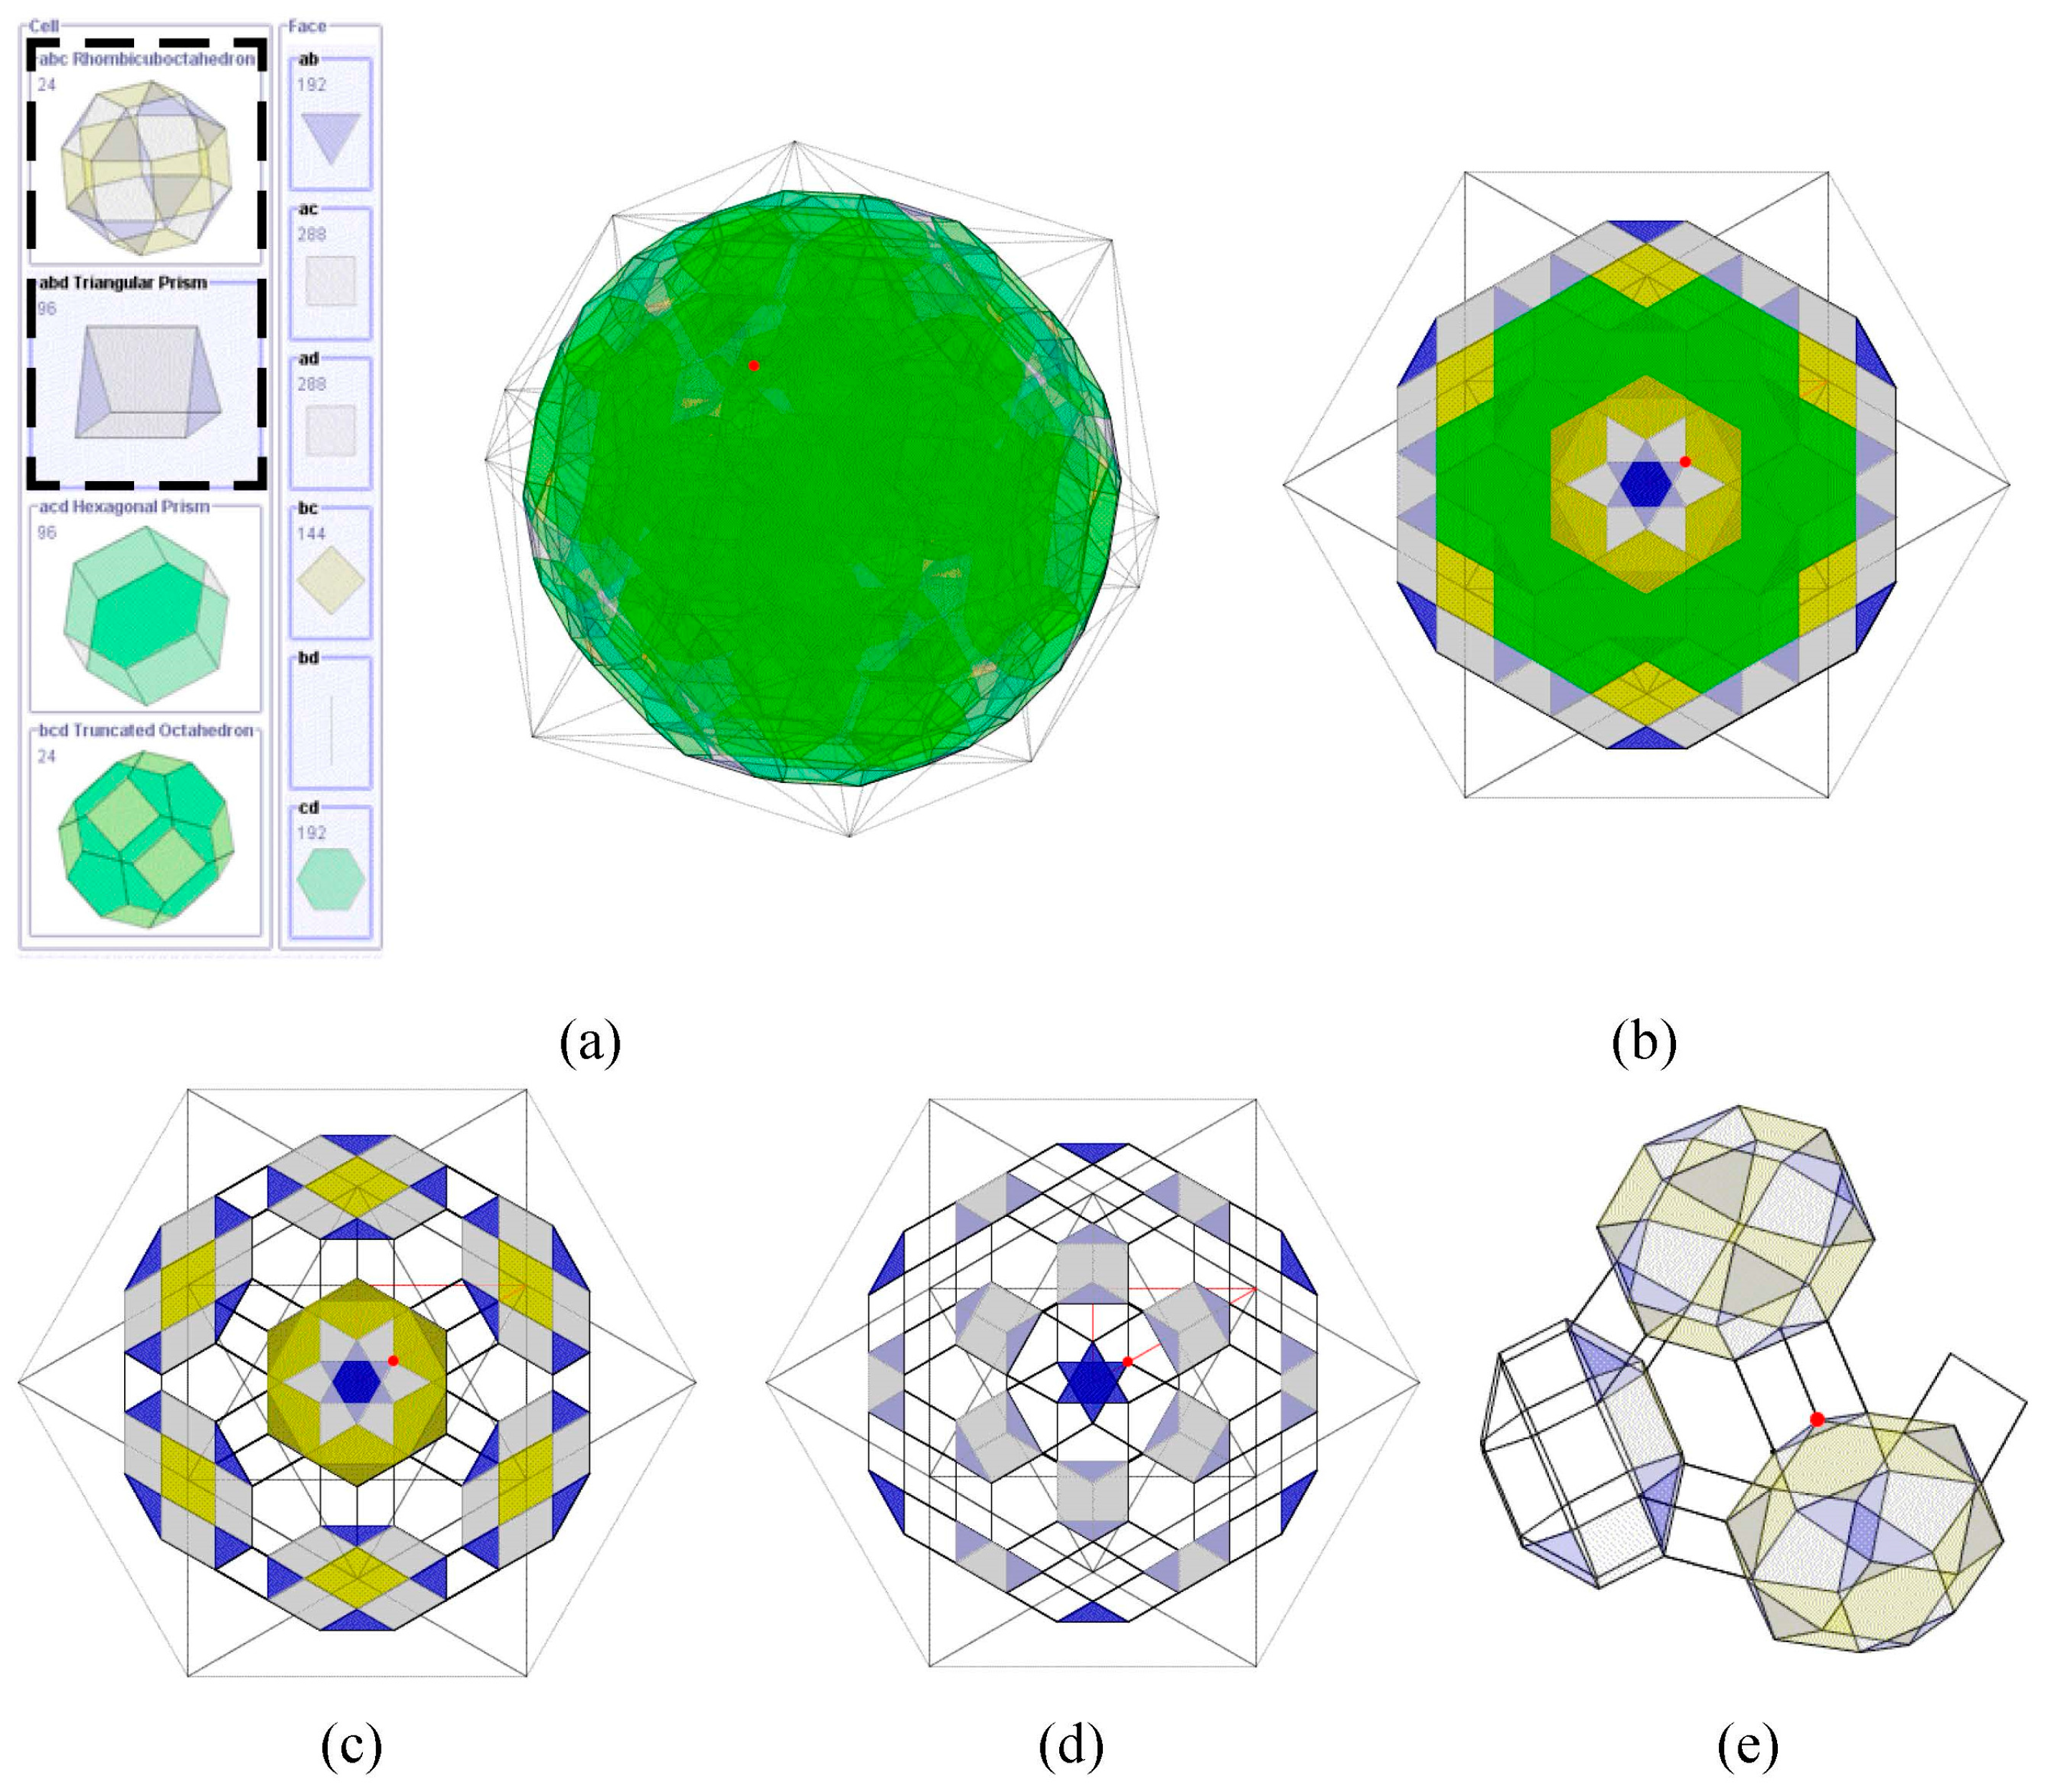
“By rotation, we are able to explore the object and find out its features from different angles. The 3D cells themselves can be complicated. This way, I can first understand the 3D cells, then understand the big picture. Some angles are better than others for understanding the cells.”“The way we can rotate and see different faces with color makes it easier to understand.”“For me it was very important aspect of understanding, to be able to rotate.”“[The cells] were very useful as you can rotate, observe and COUNT basic shapes.”
7.3. Effect of Complementary Interactions
8. Discussion
8.1. Design Guidelines
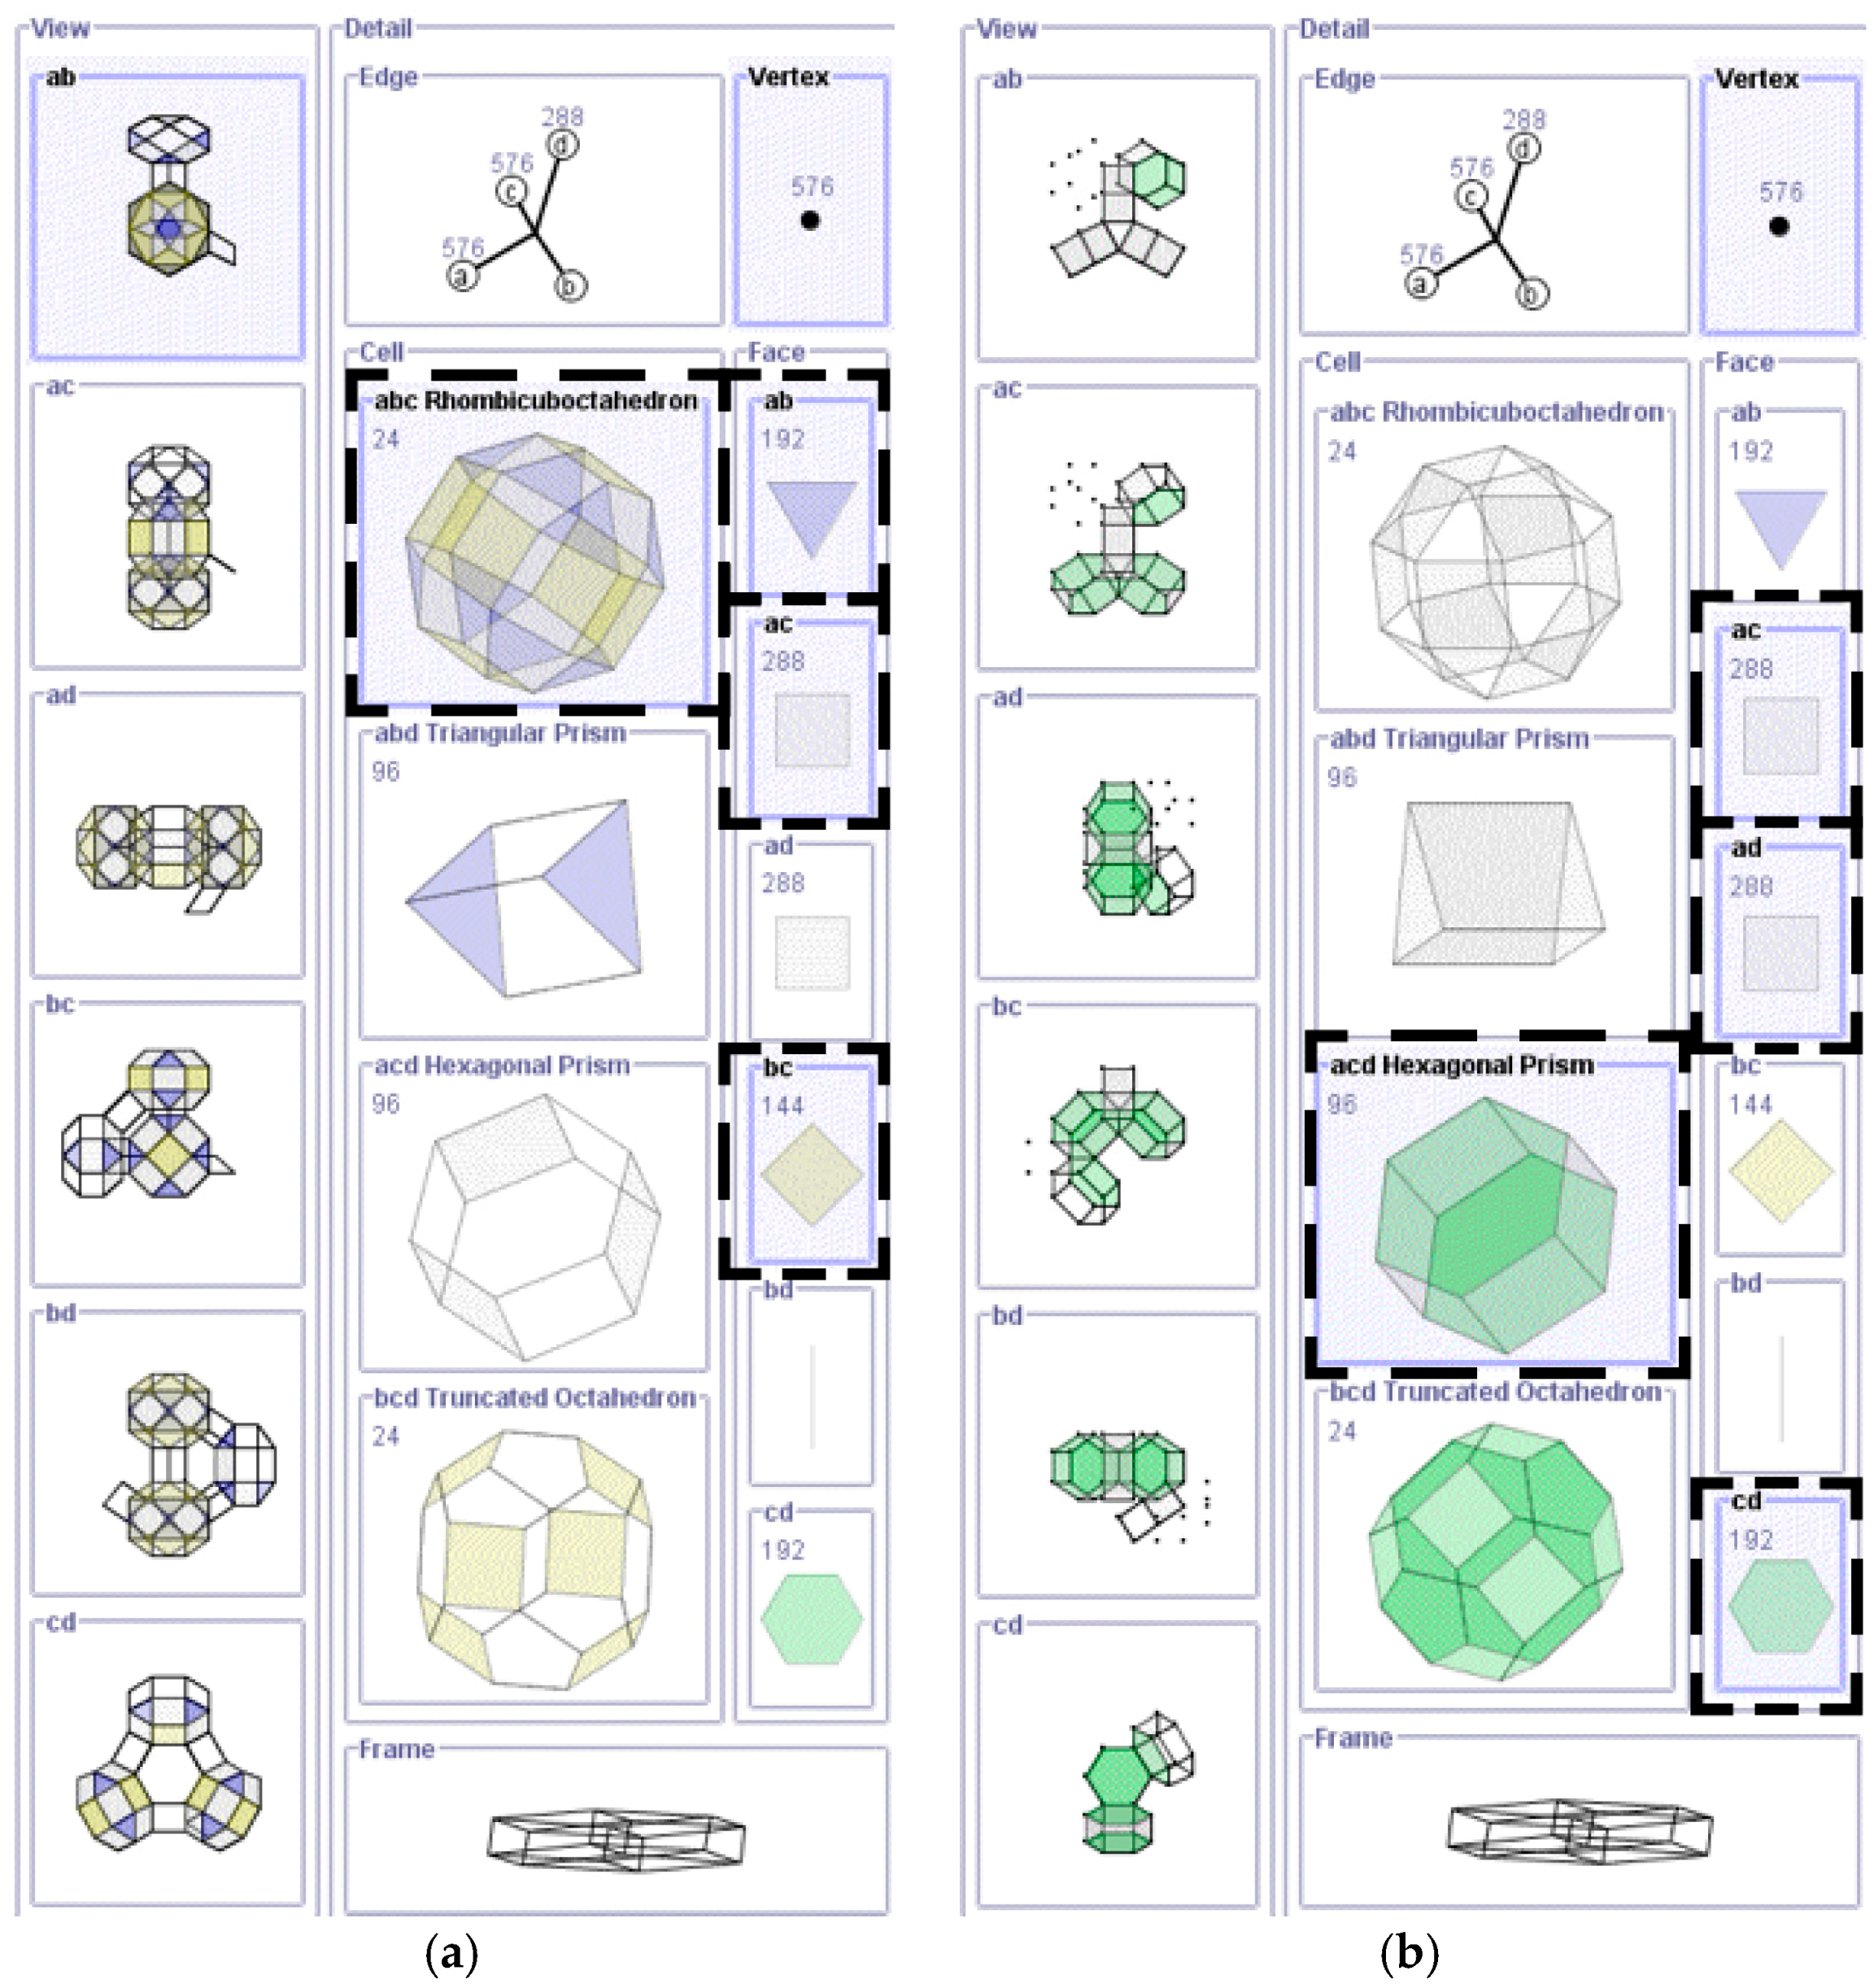
- DG1: Make key sub-components of objects and information spaces visible in the interface. Visualize the sub-components themselves, rather than simply making their existence and/or function visible via textual labels. Additionally, make them interactive and dynamically linked if possible. This was the key to our visibility strategy, which we found to be effective in supporting users’ sensemaking activities.
- DG2: Provide frames of reference that users can access quickly to restart their exploration. The stacked views, along with the stacking–unstacking interaction techniques, supported rapid and easy access to the references for users to restart their exploration and were found to be supportive of users’ tasks.
- DG3: Use varied levels of detail to support continuous back-and-forth comparative visual reasoning. Polyvise allows for decomposing complex 4D objects into their smaller parts that users can manipulate and interact with (e.g., through scoping or filtering). Participants found these features helpful in understanding how elements can come together.
- DG4: Provide different reference points from which the complexity of objects can be adjusted—e.g., with focus+scoping techniques. We found this to be supportive of reasoning through the complexity of the 4D objects and making sense of their composition and structure.
- DG5: Integrate multiple, mutually-supportive interactions to enable fluid and complementary activities. Multiplicity of interactions is essential for exploring complex visualizations. However, they should be chosen carefully such that they are also complementary.
9. Summary and Conclusions
Acknowledgments
Author Contributions
Conflicts of Interest
Appendix A: Tasks given in the study
- The following activity deals with the Hypercube (h0, 16c14).
- How many cubes are there?
- Compare and locate all Cubes of which the polytope is composed.
- The following activities deal with the Truncated hypercube (h1, 16c13).
- There are 16 Tetrahedra in this polytope. This current display (ab view) only shows 8 Tetrahedra. Reveal the remaining 8.
- There are 8 Truncated Cubes in this polytope. Reveal all 8 Truncated Cubes, one by one if possible.
- The following activity deal with the Rectified hypercube (h8, 16c10).
- Describe how the 8 Cuboctahedra and 16 Tetrahedron come together to form this polytope.
- The following activities deal with the previous 3 polytopes you explored (Hypercube (h0, 16c14), Truncated hypercube (h1, 16c13), Rectified hypercube (h8, 16c10)).
- Do you find any common patterns/correlation between them (e.g., how they are obtained from the regular polytope)?
- The following activities deal with the Cantitruncated hypercube (h2, 16c12).
- Locate all the 8 Truncated Cubeoctahedron.
- Identify the polygonal shapes that join two Truncated Tetrahedra.
- Identify the polygonal shapes that join two Truncated Cubeoctahedra.
- Compare the Triangular Prisms and the Truncated Tetrahedra. What common features join them in the polytope?
- Rank the 3D cells of this polytope based on their complexity and/or importance in forming the polytope.
- The following activities deal with the Omnitruncated hypercube (h5, 16c5).
- Can you distinguish (i.e., find their differences) between the two types of prisms present in the polytope?
- How are the 4 types of cells (i.e., Truncated Cuboctahedron, Octagonal Prism, Hexagonal Prism, and Truncated Octahedron) related to each other?
- Rank the 3D cells of this polytope based on their complexity and/or importance in forming the polytope.
- The following activity deals with the 5-cell (5c0, 5c14) and 16-cell (h14, 16c0).
- Compare these two polytopes. What similarities/differences do you find between these two polytopes?
- The following activity deals with the Truncated 5-cell (5c1, 5c13) and Cantic hypercube (h13, 16c1).
- Compare these two polytopes. What similarities/differences do you find between these two polytopes?
- The following activity deals with the Rectified 5-cell (5c8, 5c10) and 24-cell (h10, 16c8, 24c0, 24c14).
- Compare these two polytopes. What similarities/differences do you find between these two polytopes?
- From activities 7, 8, and 9, do you find any patterns between polytopes derived from the 5-cell and those derived from the 16-cell?
- Locate the Cantitruncated 24-cell (24c2, 24c12). Explore this polytope using any interaction available in Polyvise and describe its structural properties.
References
- Mostafa, A.E.; Greenberg, S.; Vital Brazil, E.; Sharlin, E.; Sousa, M.C. Interacting with microseismic visualizations. In Proceedings of the CHI’13, Paris, France, 27 April–2 May 2013; p. 1749.
- Hegarty, M.; Waller, D. Individual differences in spatial abilities. In The Cambridge Handbook of Visuospatial Thinking; Cambridge University Press: Cambridge, UK, 2005; pp. 121–169. [Google Scholar]
- Stull, A.T.; Hegarty, M. Model Manipulation and Learning: Fostering Representational Competence with Virtual and Concrete Models. J. Educ. Psychol. 2015, 108, 509–527. [Google Scholar] [CrossRef]
- Klein, G.; Moon, B.; Hoffman, R. Making sense of sensemaking 1: Alternative perspectives. Intell. Syst. IEEE 2006, 21, 70–73. [Google Scholar] [CrossRef]
- Zhang, P.; Soergel, D.; Klavans, J.L.; Oard, D.W. Extending sense-making models with ideas from cognition and learning theories. In Proceedings of the American Society for Information Science and Technology; John Wiley & Sons: Hoboken, NJ, USA, 2008; Volume 45, pp. 1–12. [Google Scholar]
- Pittalis, M.; Christou, C. Types of reasoning in 3D geometry thinking and their relation with spatial ability. Educ. Stud. Math. 2010, 75, 191–212. [Google Scholar] [CrossRef]
- Chen, S.-C.; Hsiao, M.-S.; She, H.-C. The effects of static versus dynamic 3D representations on 10th grade students’ atomic orbital mental model construction: Evidence from eye movement behaviors. Comput. Human Behav. 2015, 53, 169–180. [Google Scholar] [CrossRef]
- Russell, D.M.; Stefik, M.J.; Pirolli, P.; Card, S.K. The cost structure of sensemaking. In Proceedings of the INTERACT’93 and CHI’93 Conference on Human Factors in Computing Systems, Amsterdam, The Netherlands, 24–29 April 1993; pp. 269–276.
- Kirsh, D. Interaction, external representation and sense making. In Proceedings of the 31st Annual Conference of the Cognitive Science Society, Amsterdam, The Netherlands, 29 July–1 August 2009; pp. 1103–1108.
- Hutchins, E. Cognition, Distributed. Int. Encycl. Soc. Behav. Sci. 2001, 2068–2072. [Google Scholar] [CrossRef]
- Scaife, M.; Rogers, Y. External cognition: How do graphical representations work? Int. J. Hum. Comput. Stud. 1996, 45, 185–213. [Google Scholar] [CrossRef]
- Zhang, J.; Norman, D. Representations in distributed cognitive tasks. Cogn. Sci. A Multidiscip. J. 1994, 18, 87–122. [Google Scholar] [CrossRef]
- Larkin, J.; Simon, H. Why a Diagram is (Sometimes) Worth Ten Thousand Words. Cogn. Sci. 1987, 11, 65–100. [Google Scholar] [CrossRef]
- Sedig, K.; Parsons, P. Interaction Design for Complex Cognitive Activities with Visual Representations: A Pattern-Based Approach. AIS Trans. Human–Computer Interact. 2013, 5, 84–133. [Google Scholar]
- Sedig, K.; Morey, J.; Mercer, R.E. Interactive metamorphic visuals: Exploring polyhedral relationships. In Proceedings of the Fifth International Conference on Information Visualisation, London, UK, 25–27 July 2001; pp. 483–488.
- Jankowski, J.; Hachet, M. Advances in Interaction with 3D Environments. Comput. Graph. Forum 2015, 34, 152–190. [Google Scholar] [CrossRef]
- Tominski, C. Interaction for Visualization. Synth. Lect. Vis. 2015, 3, 1–107. [Google Scholar] [CrossRef]
- Parsons, P.; Sedig, K. Adjustable properties of visual representations: Improving the quality of human–information interaction. J. Assoc. Inf. Sci. Technol. 2014, 65, 455–482. [Google Scholar] [CrossRef]
- Norman, D. The Design of Everyday Things; Basic Books: New York, NY, USA, 2013. [Google Scholar]
- Shneiderman, B.; Plaisant, C.; Cohen, M.S.; Jacobs, S.M.; Elmqvist, N.; Diakopoulos, N. Designing the User Interface: Strategies for Effective Human-Computer Interaction, 6th ed.; Pearson: Upper Saddle River, NJ, USA, 2016. [Google Scholar]
- Cooper, A.; Reimann, R.; Cronin, D.; Noessel, C. About Face: The Essentials of Interaction Design, 4th ed.; John Wiley & Sons: Hoboken, NJ, USA, 2014. [Google Scholar]
- Preece, J.; Sharp, H.; Rogers, Y. Interaction Design: Beyond Human–Computer Interaction, 4th ed.; John Wiley & Sons: Hoboken, NJ, USA, 2015. [Google Scholar]
- Hollan, J.; Hutchins, E.; Kirsh, D. Distributed cognition: Toward a new foundation for human–computer interaction research. ACM Trans. Comput. Interact. 2000, 7, 174–196. [Google Scholar] [CrossRef]
- Narayanan, H.; Hegarty, M. Multimedia design for communication of dynamic information. Int. J. Hum. Comput. Stud. 2002, 57, 279–315. [Google Scholar] [CrossRef]
- Sedig, K.; Rowhani, S.; Morey, J.; Liang, H.-N. Application of information visualization techniques to the design of a mathematical mindtool: A usability study. Inf. Vis. 2003, 2, 142–159. [Google Scholar] [CrossRef]
- Groth, D.P.; Streefkerk, K. Provenance and annotation for visual exploration systems. IEEE Trans. Vis. Comput. Graph. 2006, 12, 1500–1510. [Google Scholar] [CrossRef] [PubMed]
- Siirtola, H.; Raiha, K.J. Interacting with parallel coordinates. Interact. Comput. 2006, 18, 1278–1309. [Google Scholar] [CrossRef]
- Sedig, K.; Liang, H.-N.; Morey, J. Enhancing the usability of complex visualizations by making them interactive: A study. In Proceedings of the World Conference on Educational Multimedia, Hypermedia and Telecommunications, Honolulu, HI, USA, 22 June 2009; pp. 1021–1029.
- Pohl, M.; Wiltner, S.; Miksch, S.; Aigner, W.; Rind, A. Analysing interactivity in information visualisation. Künstliche Intelligenz 2012, 26, 151–159. [Google Scholar] [CrossRef]
- Wang, T.D.; Wongsuphasawat, K.; Plaisant, C.; Shneiderman, B. Extracting insights from electronic health records: Case studies, a visual analytics process model, and design recommendations. J. Med. Syst. 2011, 35, 1135–1152. [Google Scholar] [CrossRef] [PubMed]
- Sedig, K.; Liang, H.-N. Interactivity of visual mathematical representations: Factors affecting learning and cognitive processes. J. Interact. Learn. Res. 2006, 17, 179–212. [Google Scholar]
- De Leon, D. Cognitive task transformations. Cogn. Syst. Res. 2002, 3, 349–359. [Google Scholar] [CrossRef]
- Van Wijk, J.J. Views on visualization. IEEE Trans. Vis. Comput. Graph. 2006, 12, 421–432. [Google Scholar] [CrossRef] [PubMed]
- Huang, D.; Tory, M.; Adriel Aseniero, B.; Bartram, L.; Bateman, S.; Carpendale, S.; Tang, A.; Woodbury, R. Personal visualization and personal visual analytics. IEEE Trans. Vis. Comput. Graph. 2015, 21, 420–433. [Google Scholar] [CrossRef] [PubMed]
- Song, H.S.; Pusic, M.; Nick, M.W.; Sarpel, U.; Plass, J.L.; Kalet, A.L. The cognitive impact of interactive design features for learning complex materials in medical education. Comput. Educ. 2014, 71, 198–205. [Google Scholar] [CrossRef] [PubMed]
- Marchionini, G. Human–information interaction research and development. Libr. Inf. Sci. Res. 2008, 30, 165–174. [Google Scholar] [CrossRef]
- Fidel, R. Human Information Interaction: An Ecological Approach to Information Behavior; MIT Press: Cambridge, MA, USA, 2012. [Google Scholar]
- Albers, M.J. Human–Information Interaction with Complex Information for Decision-Making. Informatics 2015, 2, 4–19. [Google Scholar] [CrossRef]
- Sedig, K.; Parsons, P. Design of Visualizations for Human-Information Interaction: A Pattern-Based Framework; Ebert, D., Elmqvist, N., Eds.; Morgan & Claypool Publishers: San Rafael, CA, USA, 2016; Volume 4. [Google Scholar]
- Knauff, M.; Wolf, A.G. Complex cognition: The science of human reasoning, problem-solving, and decision-making. Cogn. Process. 2010, 11, 99–102. [Google Scholar] [CrossRef] [PubMed]
- Schmid, U.; Ragni, M.; Gonzalez, C.; Funke, J. The challenge of complexity for cognitive systems. Cogn. Syst. Res. 2011, 12, 211–218. [Google Scholar] [CrossRef]
- Kirsh, D. Interactivity and multimedia interfaces. Instr. Sci. 1997, 25, 79–96. [Google Scholar] [CrossRef]
- Parsons, P.; Sedig, K. Distribution of information processing while performing complex cognitive activities with visualization tools. In Handbook of Human-Centric Visualization; Huang, W., Ed.; Springer: New York, NY, USA, 2014; pp. 693–715. [Google Scholar]
- Morey, J.; Sedig, K. Adjusting degree of visual complexity: An interactive approach for exploring four-dimensional polytopes. Vis. Comput. 2004, 20, 565–585. [Google Scholar] [CrossRef]
- Liang, H.-N.; Sedig, K. Role of externalization and composite interactions in the exploration of complex visualization spaces. In Proceedings of the International Conference on Advanced Visual Interfaces—AVI’10, Rome, Italy, 26–28 May 2010; Volume 13, p. 426.
- Rao, R.; Card, S.K. The table lens: Merging graphical and symbolic representations in an interactive focus + context visualization for tabular information. In Proceedings of the SIGCHI Conference on Human Factors in Computing Systems CHI’94, Boston, MA, USA, 24–28 April 1994; pp. 1–7.
- Lamping, J.; Rao, R.; Pirolli, P. A focus+context technique based on hyperbolic geometry for visualizing large hierarchies. In Proceedings of the SIGCHI Conference on Human Factors in Computing Systems CHI’95, Denver, CO, USA, 7–11 May 1995; pp. 401–408.
- Djajadiningrat, T.; Overbeeke, K.; Wensveen, S. But how, Donald, tell us how? On the creation of meaning in interaction design through feedforward and inherent feedback. In Proceedings of the 4th Conference on Designing Interactive Systems: Processes, Practices, Methods, and Techniques DIS’02, London, UK, 25–28 June 2002; pp. 285–291.
- Vermeulen, J.; Luyten, K. Crossing the bridge over Norman’s gulf of execution: Revealing feedforward’s true identity. In Proceedings of the SIGCHI Conference on Human Factors in Computing Systems, Paris, France, 27 April–2 May 2013; pp. 1931–1940.
- Baldonado, M.Q.W.; Woodfruss, A.; Kuchinsky, A. Guidelines for using multiple views in information visualization. In Proceedings of the Working Conference on Advanced Visual Interfaces AVI’00, Palermo, Italy, 24–26 May 2000; pp. 110–119.
- North, C.; Shneiderman, B. Snap-together visualization: Can users construct and operate coordinated visualizations? Int. J. Hum. Comput. Stud. 2000, 53, 715–739. [Google Scholar] [CrossRef]
- Lam, H.; Bertini, E.; Isenberg, P.; Plaisant, C.; Carpendale, S. Empirical Studies in Information Visualization: Seven Scenarios. IEEE Trans. Vis. Comput. Graph. 2011, 18, 1520–1536. [Google Scholar] [CrossRef] [PubMed]
- Creswell, J.W. Research Design: Qualitative, Quantitative, and Mixed Methods Approaches; Sage: Thousand Oaks, CA, USA, 2013. [Google Scholar]
- Kennedy, S. Using video in the BNR usability lab. ACM SIGCHI Bull. 1989, 21, 92–95. [Google Scholar] [CrossRef]
- Zhou, M.X.; Feiner, S.K. Visual task characterization for automated visual discourse synthesis. In Proceedings of the SIGCHI Conference on Human Factors in Computing Systems, Los Angeles, CA, USA, 18–23 April 1998; pp. 392–399.
- Grbich, C. Qualitative Research in Health: An Introduction; Sage: Thousand Oaks, CA, USA, 1998. [Google Scholar]
- Braun, V.; Clarke, V. Thematic analysis. In APA Handbook of Research Methods in Psychology: Research Designs; Cooper, H., Ed.; American Psychological Association: Washington, DC, USA, 2012; Volume 2, pp. 57–71. [Google Scholar]
- Saldana, J. The Coding Manual for Qualitative Researchers, 3rd ed.; Sage: Thousand Oaks, CA, USA, 2015. [Google Scholar]
- Lam, H. A framework of interaction costs in information visualization. IEEE Trans. Vis. Comput. Graph. 2008, 14, 1149–1156. [Google Scholar] [CrossRef] [PubMed]
- Liang, H.-N.; Sedig, K. Role of interaction in enhancing the epistemic utility of 3D mathematical visualizations. Int. J. Comput. Math. Learn. 2010, 15, 191–224. [Google Scholar] [CrossRef]
- Findlater, L.; McGrenere, J. Beyond performance: Feature awareness in personalized interfaces. Int. J. Hum. Comput. Stud. 2010, 68, 121–137. [Google Scholar] [CrossRef]
- Elmqvist, N.; Moere, A.V.; Jetter, H.-C.; Cernea, D.; Reiterer, H.; Jankun-Kelly, T.J. Fluid interaction for information visualization. Inf. Vis. 2011, 10, 327–340. [Google Scholar] [CrossRef]

| Question | Mean Score |
|---|---|
| All in all, Polyvise is useful in helping me develop an understanding of 4D geometric objects. (5) strongly agree, (4) agree, (3) undecided, (2) disagree, (1) strongly disagree. | 4.5 |
| Compared to what you knew about 3D and 4D mathematical structures before using Polyvise, how much have you learned about these 3D and 4D structures now that you have used Polyvise? (5) I have learned all that there is to know, (4) I have learned quite a bit, (3) I have learned some, (2) I have learned very little, (1) I have not learned anything at all. | 3.5 |
| Polyvise made the 3D and 4D concepts less challenging (or easier) to explore and learn; (5) strongly agree, (4) agree, (3) undecided, (2) disagree, (1) strongly disagree. | 4.4 |
| Mean usability index | 4.13 |
| Interaction Technique | Rating |
|---|---|
| Stacking–Unstacking. Rate the usefulness of this feature in helping you explore and understand 4D structures using a scale from 1 to 10 (1 = not useful at all; 10 = extremely useful) | 9.25 |
| Focus+Scoping. Rate the usefulness of this feature in helping you explore and understand 4D structures using a scale from 1 to 10 (1 = not useful at all; 10 = extremely useful) | 8.75 |
| Filtering. Rate the usefulness of this feature in helping you explore and understand 4D structures using a scale from 1 to 10 (1 = not useful at all; 10 = extremely useful) | 8.75 |
| Overall. How would you rate (1–10; 1 = not effective at all; 10 = extremely effective) the overall effectiveness of Polyvise in supporting you in exploring and understand 4D structures | 8.58 |
| Mean usefulness index | 8.83 |
| Tasks | Single Interaction | S–U a F+S b | S–U Filtering | F+S Filtering | S–U F+S Filtering |
|---|---|---|---|---|---|
| Identify | 8 * | 15 | 15 | 0 | 62 |
| Locate | 0 | 38 | 0 | 23 | 38 |
| Distinguish | 15 | 0 | 23 | 0 | 62 |
| Categorize | 8 | 8 | 31 | 0 | 54 |
| Compare | 0 | 0 | 31 | 0 | 69 |
| Rank | 15 | 15 | 8 | 8 | 54 |
| Generalize | 0 | 8 | 15 | 0 | 77 |
| Emphasize | 8 | 0 | 8 | 15 | 69 |
| Reveal | 8 | 8 | 23 | 15 | 46 |
© 2016 by the authors; licensee MDPI, Basel, Switzerland. This article is an open access article distributed under the terms and conditions of the Creative Commons Attribution license ( http://creativecommons.org/licenses/by/4.0/).
Share and Cite
Sedig, K.; Parsons, P.; Liang, H.-N.; Morey, J. Supporting Sensemaking of Complex Objects with Visualizations: Visibility and Complementarity of Interactions. Informatics 2016, 3, 20. https://doi.org/10.3390/informatics3040020
Sedig K, Parsons P, Liang H-N, Morey J. Supporting Sensemaking of Complex Objects with Visualizations: Visibility and Complementarity of Interactions. Informatics. 2016; 3(4):20. https://doi.org/10.3390/informatics3040020
Chicago/Turabian StyleSedig, Kamran, Paul Parsons, Hai-Ning Liang, and Jim Morey. 2016. "Supporting Sensemaking of Complex Objects with Visualizations: Visibility and Complementarity of Interactions" Informatics 3, no. 4: 20. https://doi.org/10.3390/informatics3040020
APA StyleSedig, K., Parsons, P., Liang, H.-N., & Morey, J. (2016). Supporting Sensemaking of Complex Objects with Visualizations: Visibility and Complementarity of Interactions. Informatics, 3(4), 20. https://doi.org/10.3390/informatics3040020


