Abstract
Through recognizing the importance of a qualified workforce, skills research has become one of the focal points in economics, sociology, and education. Great effort is dedicated to analyzing labor demand and supply, and actions are taken at many levels to match one with the other. In this work we concentrate on skills needs, a dynamic variable dependent on many aspects such as geography, time, or the type of industry. Historically, skills in demand were easy to evaluate since transitions in that area were fairly slow, gradual, and easy to adjust to. In contrast, current changes are occurring rapidly and might take an unexpected turn. Therefore, we introduce a relatively simple yet effective method of monitoring skills needs straight from the source—as expressed by potential employers in their job advertisements. We employ open source tools such as RapidMiner and R as well as easily accessible online vacancy data. We demonstrate selected techniques, namely classification with k-NN and information extraction from a textual dataset, to determine effective ways of discovering knowledge from a given collection of vacancies.
1. Introduction
In the age of globalization labor markets are a major pillar of prosperity on the scale of the entire population. It can be argued that human resources have never before had such a profound impact on the world. Recent history shows that a single talent can change economies and societies across the globe. The achievements of Bill Gates, Angela Merkel, Henry Ford, or Oprah Winfrey are only a few spectacular examples of how individuals can affect the lives of millions. Technical acumen, social awareness, or passion for science—any type of a skill can be a valuable asset when recognized, supported, and put to good use. Wherever humans are concerned, jobs and careers are a significant part of the equation. This is always a matter of how one is making a living, which is directly dependent on what competencies one possesses. However, whether employed, freelancing, or a business owner, there is no doubt that professional choices are heavily constrained by a major player—labor market demands. As is apparent in the literature, minimalizing dissimilarity between skills needs and supply is the primary concern of policy makers around the world. Significant time, careful investigation, and financial resources are required to balance labor markets. Therefore employers, professional associations, educational bodies, governments, global agencies, and many more actively cooperate to develop tools that allow for assessing and forecasting skill needs.
In the European context, the creation of a unified labor market is undoubtedly one of the major achievements of the European Union. Although it struggles with the typical challenges arising from economic and cultural diversity, its key advantage is the support of the workforce mobility, therefore the harmonic development of all member states. A number of tools and initiatives have been put in place to facilitate transparency of skills and qualifications, and to help people moving across academic institutions, companies, sectors, and countries throughout Europe. Educational and occupational proxies are the two reference points commonly applied in such evaluations. They support highly aggregated measures such as skills demand and supply, which are typical for research conducted nationally and internationally to support effective labor market policies. In recent years, however, through the wide spread of information technology and the Internet, lower-level research has been gaining much attention. Using this approach, small multidisciplinary teams can process large repositories of digital data using data mining tools that are already well established in areas such as economic and financial modeling. Although employment is still mostly a subject of cumbersome high-level analysis, various authors have documented the successful extraction of information about skill demands through implementing machine learning algorithms and applying them to publicly available data.
The following section discusses skills research in more detail. I also explain the personal motivation behind the project later in this paper.
2. Related Work and Motivation
Skills measures in current use raise a number of conceptual and practical issues. In addition, each kind of data and its acquisition method has its own strengths and limitations. In the context of fast-changing and sometimes turbulent economies, every new perspective has potential for contributing valuable information about factors that can drive employment trends [1]. Researchers, policy makers, and public bodies are keenly interested in understanding how skill requirements are changing over time and how they affect the prosperity of a nation. Employers seek insight into current and future personnel needs to increase their competitiveness through hiring qualified workforce. Job holders, job seekers, parents, and youth want to know which job prospects and career paths look favorable. Finally, educators and training providers are eager to remain abreast of changes and respond to emerging labor market needs in a timely manner.
Handel, M. [2] argues that there is no widely accepted and available coding scheme for job skills requirements across countries comparable to the International Standard Classification of Occupations (ISCO). This has forced many researchers to rely on coarse or indirect measures based on job titles, even within the context of national studies. Occupational classification has the advantage of being relatively easy to use and indicating the kind of work performed, established through employer surveying [3]. As the main framework for labor information worldwide, ISCO allows for comparison of skills over geography and time, which is much more problematic when using other dimensions, for example educational proxy [3]. However, occupational titles have some limitations. Occupation is merely a concept and, as such, might take different meanings and interpretations. Furthermore, as a measure of skills, occupational title alone is insufficient because it is a nominal variable that offers relatively few broad categories—usually between two and ten highly aggregated groups. While occupational title is the essential starting point, more detail is necessary to better understand skills requirements. Additionally, the rigidity of a universal framework imposes another difficulty. Although it might help to produce employment projections for the industries at a global level, transitions specific to a particular country cannot be properly reflected. For example, areas of specialization, particularly those caused by technological advance, might occur in multiple geographic locations albeit at a different time or pace, or even in a new direction. Therefore, some aspects of a job must be compromised to fit it into a uniform classification [4]. Educational proxy is equally challenging. Definitions of education, intelligence, and skills converge, and the historic distinction between education and training is no longer valid. Unexpected and rapid changes, such as the emergence of social networks and creation of new workplaces in that area, might cause temporary skills shortages that force employers to adjust their requirements to the situation of a labor market. In such scenarios, on-the-job training takes priority over formal schooling and human capital available to recruiters is evaluated for its potential rather than according to the level of education. This issue is multidimensional and evokes discussion on the importance of informal education in measuring skills. It has long been acknowledged as a valid question and the majority of countries support initiatives in that area. A worldwide network of vocational courses, apprenticeships, and contracted training programs aligns formal certification with job-specific competencies [5]. These services complement educational system by providing tools for measuring vocational skills that are not included in the official qualification frameworks such as, for example, the International Standard Classification of Education [6].
Similarly to other institutions worldwide, the Irish Expert Group on Future Skills Needs highlights the fact that competency requirements are becoming more flexible, and that blurred job boundaries are one of the main tendencies urging the shift toward competency-based skill measures [5]. Whereas proxies are standardized and allow relatively easy summarization, comparison, and evaluation of the results in a broad perspective, existing schemes cannot be quickly revised and updated to accurately reflect current labor market demands. Additionally, many framework modifications result in the difficulty of dealing with discontinuity in time series, due to the volume of data that needs to be harmonized globally. Therefore, several authors have proposed an approach that helps with understanding skills needs by utilizing machine learning and digital vacancy data. The method, based on data mining techniques, has the advantage of being more flexible by retrieving detailed knowledge about competency requirements in a way that bypasses rigid occupational schemes. Online recruitment, with its strategic role in the European labor market, offers many benefits as numerous websites are being created, updated, and actively promoted in order to invite employers and jobseekers into virtual interaction. This activity produces enormous amounts of vacancy data and provides volumes of potentially useful information that can be retrieved and analyzed as discussed further.
A strictly practical approach to analyzing skills demand from online vacancies was presented in [7]. This work incorporates web and text mining techniques to retrieve advertisements and abstract facts from text. The project aimed at extracting specific competences from job descriptions, and therefore evidence about skills needs in software engineering. The data was scrapped from online repositories, parsed, and filtered based on a set of predefined keywords. Hierarchical agglomerative clustering and k-Means were the mining techniques used to identify groups of skills producing coherent job definitions. A similar experiment, however with a focus on soft skills in software development, was summarized in [8]. Based on the analysis of 500 job advertisements, the study evaluated the hypothesis that assigning people with particular soft skills to different phases of a project improves the quality of its final results. The data for occupations such as system analyst, software designer, computer programmer, and software tester were retrieved from online portals across all continents. Nevertheless, only nine soft skills were identified within the given vacancy descriptions. An interesting point is made that, despite growing awareness that technical skills alone are not sufficient to succeed in IT, the value of soft skills has not yet been appropriately recognized. In [9], job advertisements were analyzed to identify and quantify skills and personal attributes in demand in the Slovak labor market. The authors argue that online portals contain recruitment data that remain unexplored, despite their greater availability and huge potential. Using the example of low- and medium-skilled occupations, it is demonstrated how evaluation of vacancy descriptions can supply information about employers’ requirements. Frequencies of skills and simple summary statistics were applied to calculate skill intensity for all considered groups; however, no details were provided with regards to software or methodology. An interesting observation was made that there are significant differences in skills demand for relatively similar jobs with different job titles, for example postmen and couriers. Zhang, S. et al. [10] employs data mining to assist disabled Chinese jobseekers in acquiring interesting opportunities. A technique based on a cascaded linear model with two-layer architecture that combines character-based perception with real-valued features is proposed to segment online advertisements by geography and job type. The model joins word segmentation and part-of-speech tagging, which are common tasks in processing Asian languages [11]. The algorithms employed in the experiment include Naïve Bayes and Support Vector Machine, with a TF-IDF measure [12] modified in such a way that the importance of a sentence for identifying a document within a collection is taken into account. Debortoli, S. et al. [13] focuses on the application of latent semantic analysis (LSA) [14] and singular value decomposition (SVD) [15] in searching for patterns among business intelligence and big data job advertisements in the United States. The standard text pre-processing techniques were executed and the vocabulary was manually verified to select items describing various types of skills. Competency taxonomies were developed for the two groups using TF-IDF weighting scheme and SVD in R environment. A conclusion is made that there is a higher demand for skills related to business intelligence, which could be a reflection of the current market where companies are not yet ready to fully engage in big data analysis.
The discussed papers are examples of research largely inspired by the advances in information technology that continue to affect labor markets around the world. Many authors consider online recruitment to be the most significant development in that domain over the last decade. Internet with no control from any type of central authority has become the primary communication channel, and a large body of work in human resources, sociology, and management emphasizes the importance and benefits of the online presence. While companies rely on the instincts of their HR personnel and jobseekers struggle to narrow down their choices, the byproduct of this interaction is a valuable source of vacancy data. Research to date has tended to focus on theoretical issues such as universal frameworks for skills evaluation. Little importance has been given to developing current and reliable measures; nevertheless, the issue has been growing in importance. The types of required qualifications are important for planning education and training strategies; however, modeling interactions between supply and demand is a complex issue and proved to be feasible only in the medium to long term [16]. Despite the controversy over the reliability of the Internet resources, the online labor market is a powerful force and offers great insight into selected aspects of employment. We argue that, approached with caution and appropriate tools, job advertisements might be a good method for measuring skills demand in the short term.
Limitations in the literature encouraged me to proceed with my own data mining project. The originality of the proposed solution lies in the fact that I detail a procedure and deliver complementing code that allows others to process the content of job descriptions in a similar manner. The following two sections are intended as a case study to present how vacancy data might be approached and what can be achieved through analyzing unstructured text that is commonly discarded in skills research. For that reason, I employ R software, which offers a wide range of capabilities and allows users without extensive programming knowledge to engage with advanced analysis in a way that best suits their objectives. Taking these factors into account, I outline a series of consecutive steps that can be completed to retrieve information from job descriptions in a straightforward manner. At the same time, I encourage further experimentation with the extensive functionality of R, only touched upon here, and customizing the approach as required in a given context.
3. Vacancy Data Mining with RapidMiner
This R-based data mining project is built upon earlier work completed in RapidMiner. In this preliminary exercise, I developed a three-step flexible framework for examining the content of job advertisements based on two types of information: job titles and job descriptions. I used data published through the IrishJobs.ie domain between January and October 2014, a sample of 4846 IT vacancies. In the first step, I identified occupations represented in the given dataset. The JobTitle attribute was tokenized and frequent terms were selected to manually label all records and separate them into exclusive classes as follows: Administrator (254), Analyst (289), Consultant (208), Lead (1065), Designer (90), Developer (1257), Engineer (612), Specialist (156), Support (553), and Tester (362). Next I ran a number of classification and clustering algorithms to find the best method for automated segmentation of the vacancies. Dealing with a special type of variable, textual data, I applied appropriate pre-processing techniques to improve the performance of the models. I tested various combinations of the algorithms, attributes, and transformations to identify the optimal approach. I reached the best results implementing classification techniques, namely Naïve Bayes (73.81% accuracy) and K-Nearest Neighbors (84.25% accuracy). I took into account the percentage of misclassified examples, as well as the time and effort required to build a model. The overall accuracy of 84.25% for the algorithm with k = 1 was satisfactory, especially in comparison with the poor results achieved by using clustering techniques. Having all IT vacancy data sorted into uniform groups, I performed visualizations and examined competency requirements using web-based word clouds. With this simple and freely accessible tool I was able to identify key terms within the JobDescription attribute that apprehended the skill needs for the 10 occupational categories previously identified within the given dataset.
The RapidMiner exercise provided strong evidence of the applicability of text mining in the context of vacancy and skills analysis. Some important findings emerged. Firstly, job titles can oftentimes be ambiguous and fail to reflect the true nature of the work. This poses a challenge in manually sorting vacancies into occupational groups based on job titles, especially for large datasets. An accurate algorithm can automate and improve the process by separating examples based on the analysis of job descriptions that contain more details about a vacant position. Secondly, a word vector representing the terms’ occurrences allows for extracting meaningful information about skills in demand, included for the first time in the 2014 annual vacancy report produced for the Expert Group on Future Skills Needs in Ireland [17]. Therefore, to promote using text mining analysis in evaluating vacancy data, we decided to improve the method by developing a procedure that could be easily replicated by a wider audience and used on a regular basis. For that, we selected R, which provides all required functionality within a single environment, as detailed in the following section.
4. Vacancy Data Mining with R
The main objective of experimentation with R was to make the vacancy and skills analysis reliable, cost free, and reproducible. I followed the steps taken in RapidMiner, however limited the use of algorithms to the previously identified optimal segmentation technique—K-Nearest Neighbors. I focused on improving the pre-processing and visualization techniques, namely automating the occupational labeling and extracting information from job descriptions. At this time, I used the data published through the IrishJobs.ie domain between January and December 2014, a sample of 7090 IT vacancies.
4.1. Dataset Exploration
I began by loading the entire dataset, consisting of 39,872 rows and 15 variables, into the R workspace. Before retrieveing IT vacancies into a new dataset, I examined the attributes to gain a better understanding of the vacancies registered with IrishJobs.ie in 2014. My primary interest lay with two textual attributes, JobTitle and JobDescription, containing information about the occupation and the skills demand for each vacancy. The review of a sample revealed enormous diversity among job descriptions. Vacancy data varied in length, structure, and type of information included. It also required extensive cleaning, primarily of HTML tags and a wide range of punctuation marks (Figure 1). I removed HTML tags and punctuation using pattern matching and replacement techniques on the JobTitle and JobDescription attributes. I then created two corpuses, one for each variable, and completed the cleaning process by applying a number of functions such as transforming cases, removing stopwords, removing numbers, stripping whitespaces, and removing a vector of the user-defined terms with no informational value in the context of our dataset. I obtained two clean corpuses from which I created two term-document matrices for job titles and descriptions, respectively.
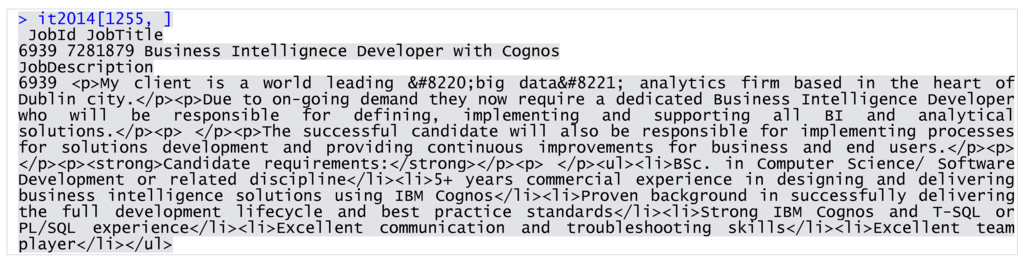
Figure 1.
Sample record from the IT dataset.
Figure 1.
Sample record from the IT dataset.

I reduced the dimensionality of the matrices by removing sparse terms appearing in less than 0.1 percent of the data. The process eliminated terms that were most likely transformation and pre-processing errors, such as those of unusual lengths. Through this procedure, I obtained JobTitle and JobDescription matrices with the 58 and 2503 most frequent terms, respectively (Figure 2).
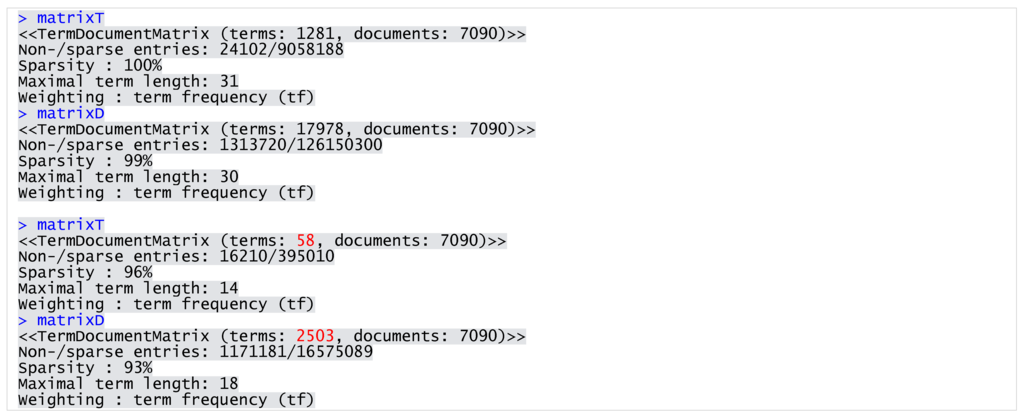
Figure 2.
JobTitle and JobDescription matrices (before and after sparse terms removal).
Figure 2.
JobTitle and JobDescription matrices (before and after sparse terms removal).

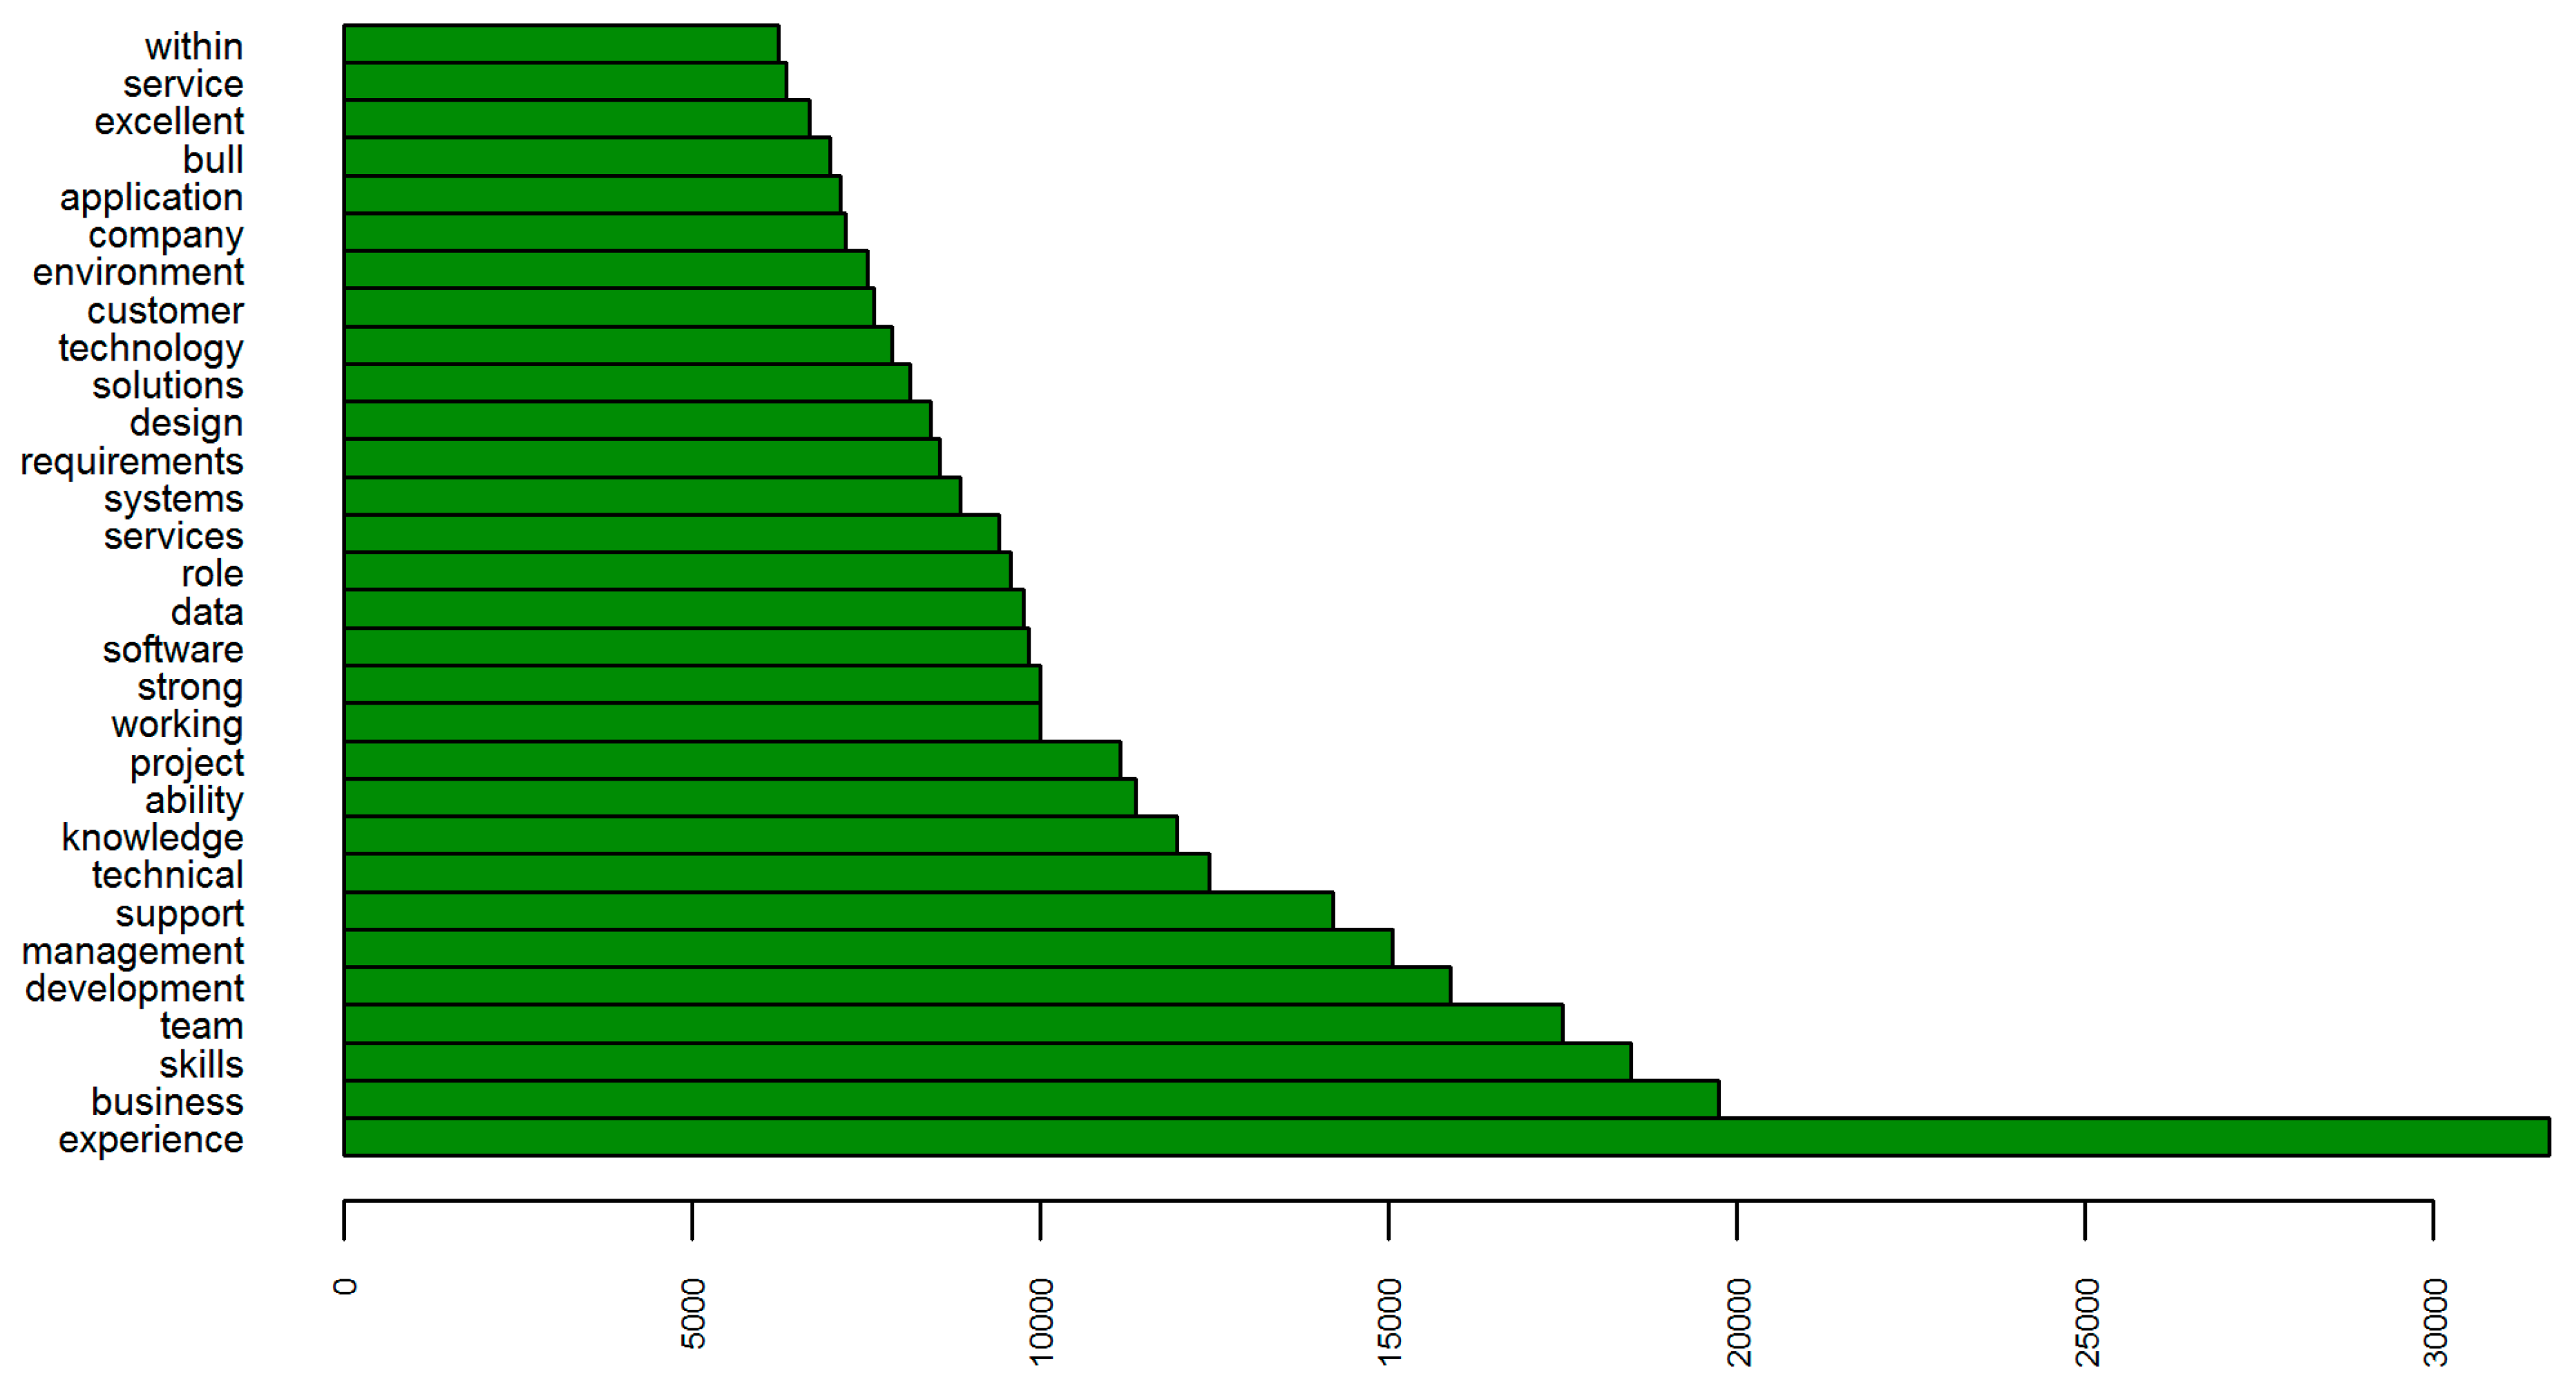
I then visualized the most frequent words within the 7090 examples of the IT dataset. The top 30 words appearing in the job titles are presented in Figure 3 and reference job positions (manager, senior, lead, etc.), IT occupational areas (engineer, developer, analyst, administrator, security, operations, etc.), and technologies (software, application, java, data, net, web, sap, oracle). Analysis of this attribute alone provides valuable insight into the demand for IT skills and experience in the Irish labor market in 2014. Figure 4, however, adds extra information extracted from the content of job descriptions. It illustrates the importance of experience, skills, and knowledge as well as the ability to work within a team and business and customer orientation. The number of occurrences denoted on the x-axis suggests the significance of a term (associated with a specific job requirement), compared against the total number of IT vacancies investigated.
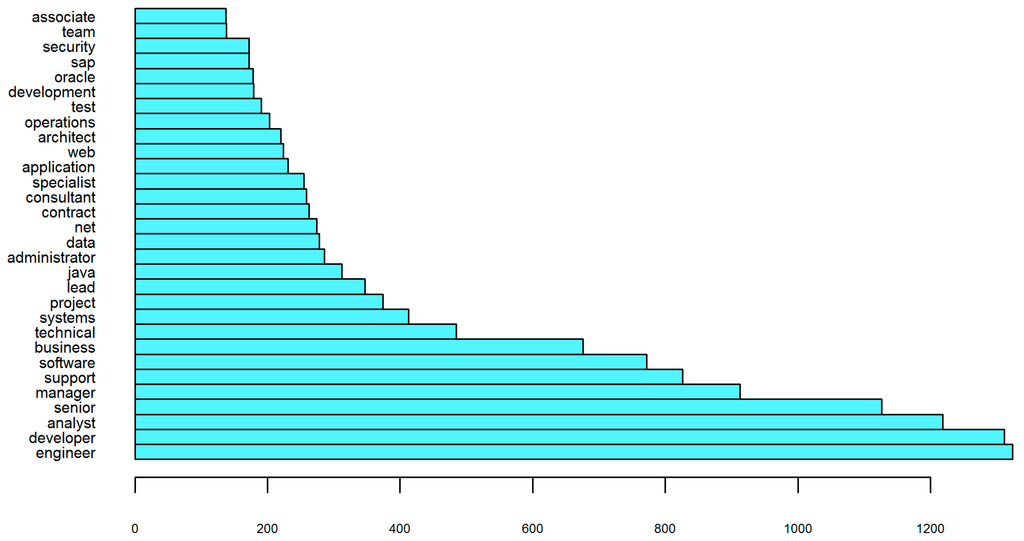
Figure 3.
Top 30 terms—IT dataset (JobTitle).
Figure 3.
Top 30 terms—IT dataset (JobTitle).


Figure 4.
Top 30 terms—IT dataset (JobDescription).
Figure 4.
Top 30 terms—IT dataset (JobDescription).
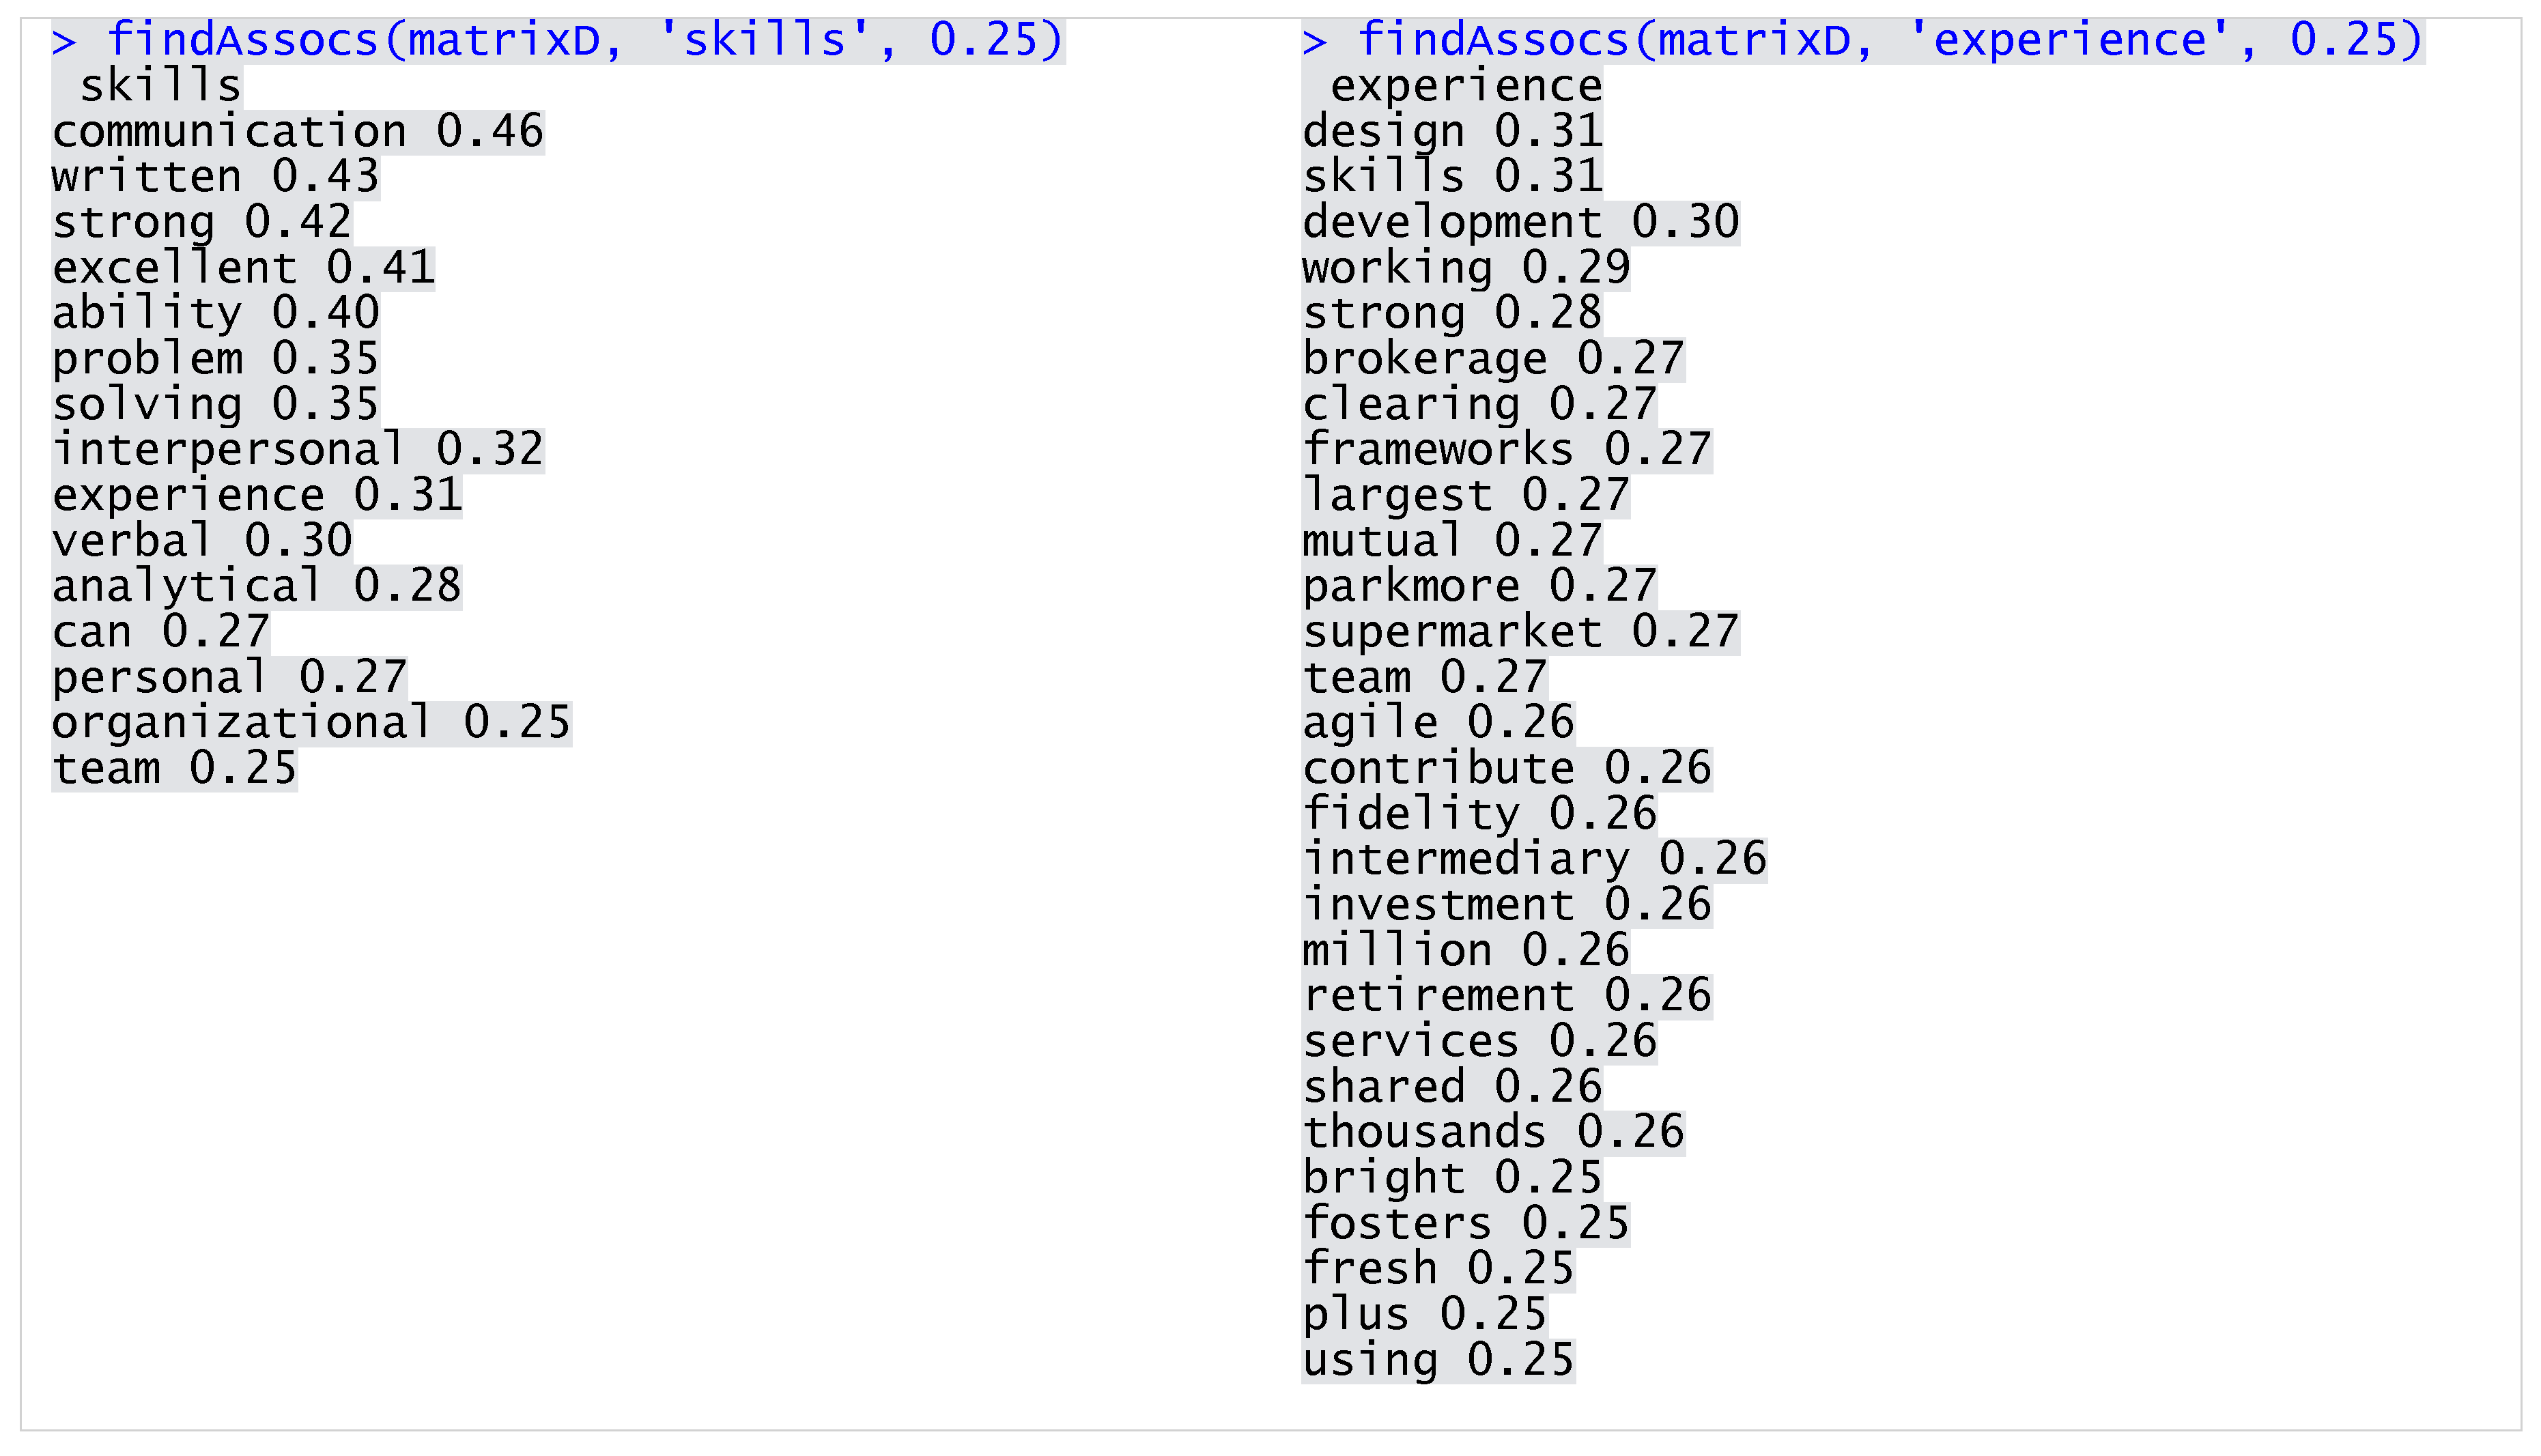
Before proceeding with data mining, I also examined correlation among the selected words using the association measures. The higher the value of the association (ranging from 0 to 1), the stronger the relationship between the terms in the dataset. This method allows us to further deepen the understanding of skill requirements. For example, we determined that, within the IT posts, the managerial positions primary relate to project management, whereas support is required in the technical context (Figure 5). Furthermore, communication as well as design and development skills and experience were in high demand (Figure 6).
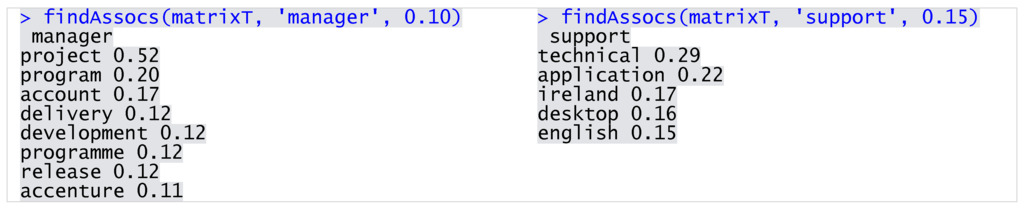
Figure 5.
Selected terms associations within JobTitle.
Figure 5.
Selected terms associations within JobTitle.
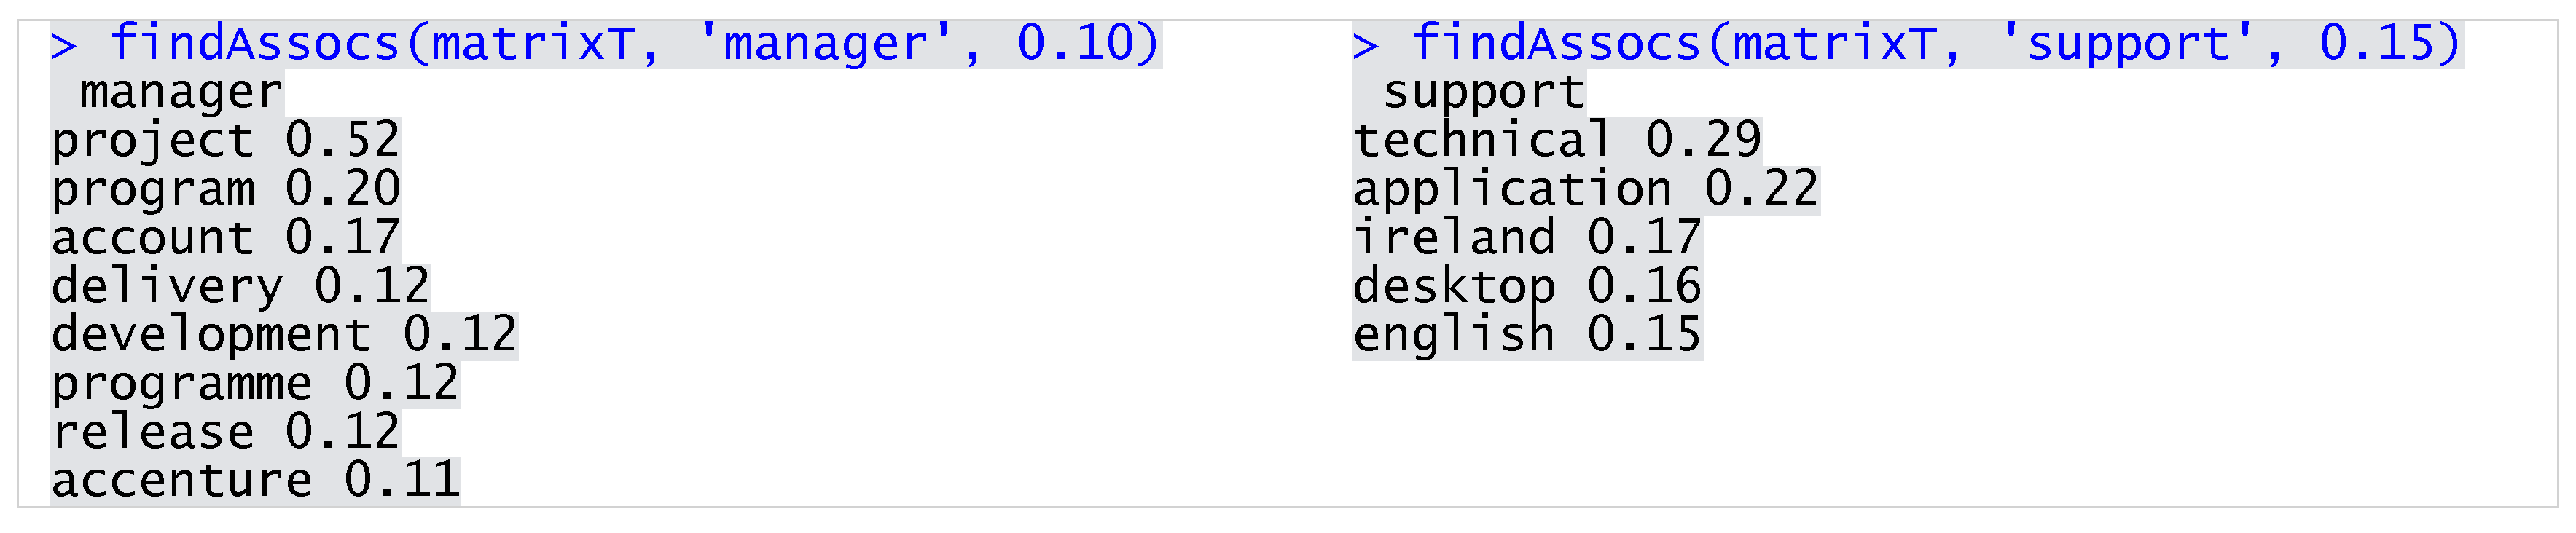
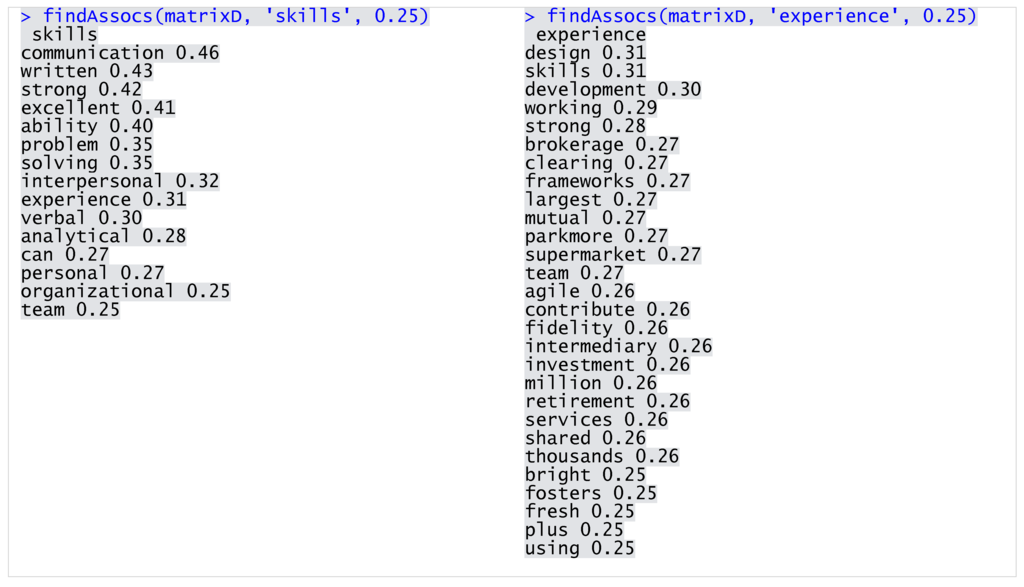
Figure 6.
Selected terms associations within JobDescription.
Figure 6.
Selected terms associations within JobDescription.
The above information cannot be extracted using occupational proxy frameworks, which have the opposite goal of aggregating skills into coarse categories. In this context, text mining, particularly word vectors, their visualizations, and association measures, give a more detailed overview of competency requirements and can be a supplementary technique adding value to the existing approach. While it is within the capacity of a particular practitioner to evaluate to what extend it might be useful to them, this method of analyzing job descriptions provides evidence-based knowledge built upon statistical measures and sophisticated algorithms. In some areas, for example vocational education and training (VET), such comprehensive examination of skill needs is, in fact, necessary. Since occupation is, in a sense, a “container” for a set of competences, it does not provide information that can be directly used to develop and deliver curricula responding to the specific demands of a particular job. Those demands, traditionally determined through employers’ surveys, are also contained within vacancy data and can be extracted through the technique proposed in this paper. In such scenarios, assigning each examined advertisement an appropriate occupational group is a prerequisite for obtaining reliable results from further investigation. A data mining model can be developed to automate this process and separate data, as explained in the following section.
4.2. Data Preparation
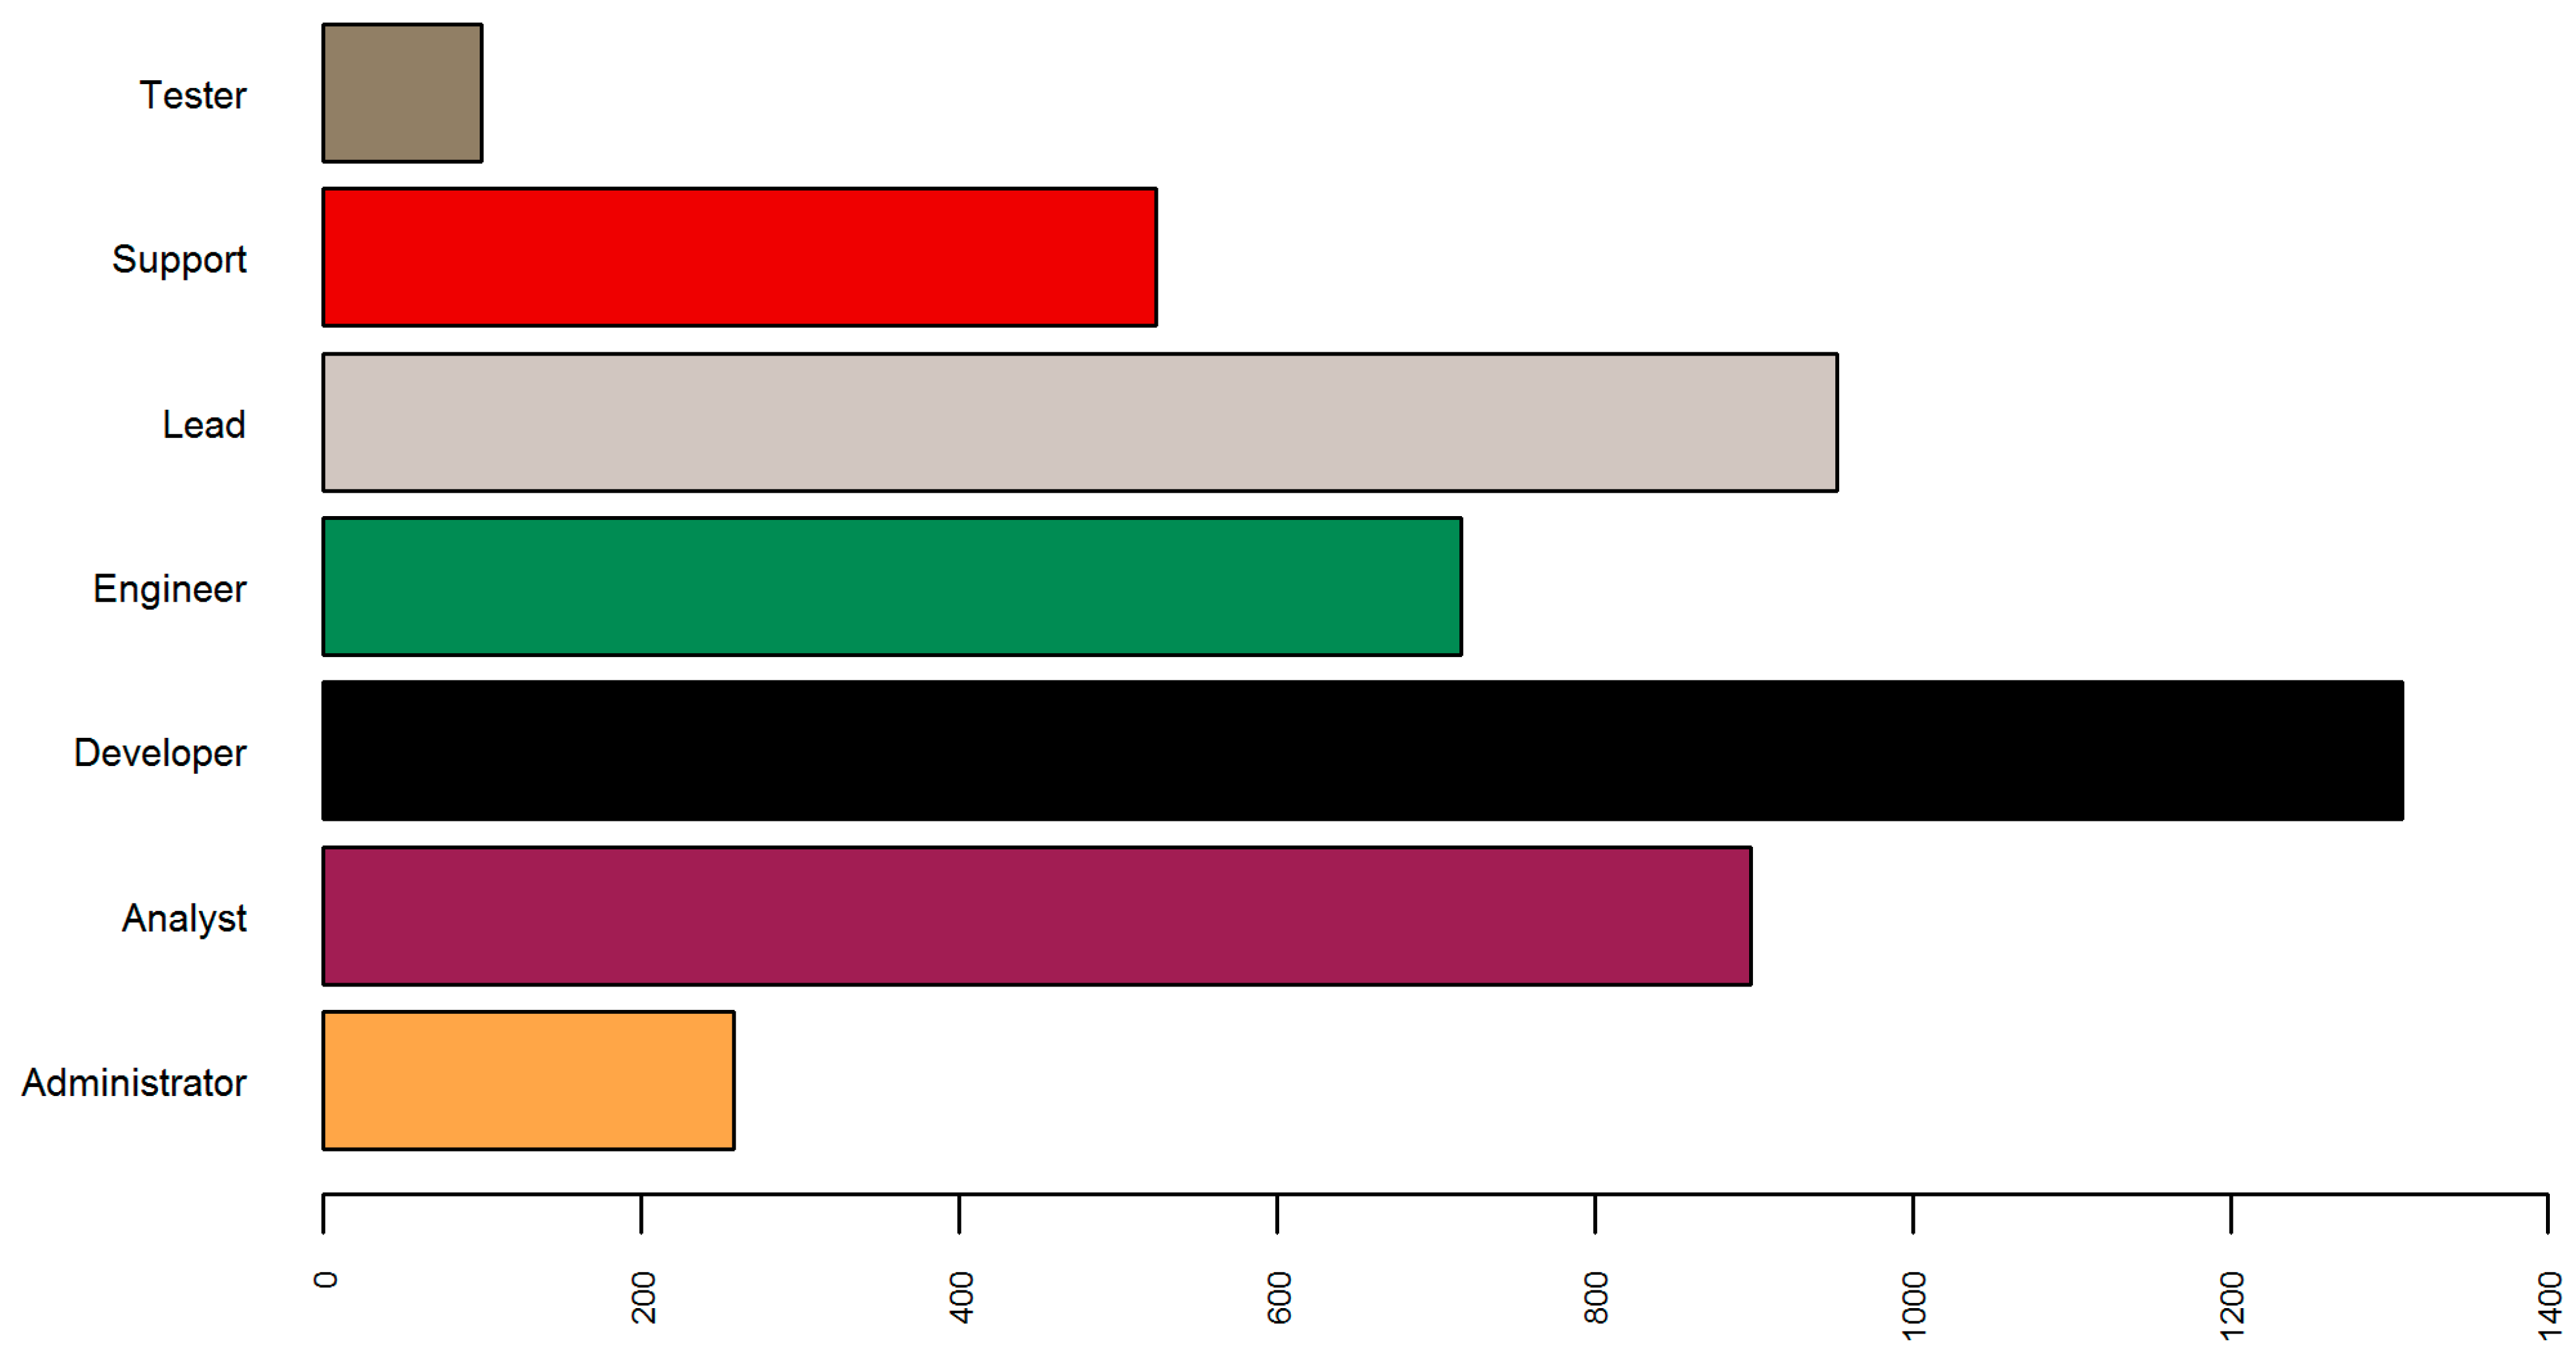
I retrieved the most frequent occupations within the IT dataset through analyzing the terms appearing within job titles (Figure 3). To improve the time and accuracy of the labeling examples used to build a model, I automated the process. Firstly, I created occupational subsets by retrieving vacancies for which job titles matched specific keywords. I then added a class column assigning the labels accordingly: Administrator (keyword: Administrator), Analyst (keyword: Analyst), Support (keywords: Support, Consultant), Developer (keywords: Developer, Architect), Engineer (keyword: Engineer), Lead (keywords: Lead, Manager), Tester (keywords: Test, Tester, Quality, QA). Subsequently, I merged all subgroups and removed the duplicated records previously retrieved into multiple subsets due to their job titles matching several of the keywords (i.e., Quality Engineer, Lead Developer, etc.). With this method I created a labeled dataset of 4755 examples (Figure 7). Furthermore, I saved the difference between the entire IT dataset and the labeled examples, and obtained a set of 2228 vacancies, which included jobs with ambiguous titles (corresponding with multiple keywords or none of them). Later in the paper, I refer to this as the unlabeled/unseen data.

Figure 7.
Labelled IT Dataset: Administrator (258), Analyst (898), Developer (1308), Engineer (716), Lead (952), Support (524), Tester (99).
Figure 7.
Labelled IT Dataset: Administrator (258), Analyst (898), Developer (1308), Engineer (716), Lead (952), Support (524), Tester (99).
To continue with text mining I created a custom function transform that executes a sequence of pre-processing and cleaning steps, produces a term-document matrix, and outputs it in a form of a data frame where rows represent advertisements and columns represent the terms appearing in their job descriptions. I called the function on both datasets the labeled (minus the labels) and unlabeled, and merged the outputs together. For that, I used a function that facilitates binding rows of data with varying attributes, and then filled all missing values with zeros. The goal was to ensure that all examples have the same variables; therefore the same algorithm might be applied on all of them. Based on row indexes, I split the transformed structure and recreated the two datasets. However, instead of the original labeled and unlabeled sets with a single JobDescription attribute, I obtained two sets with the same 8781 attributes, where values denoted the appearance of a particular term for each of the vacancies.
4.3. Data Modeling
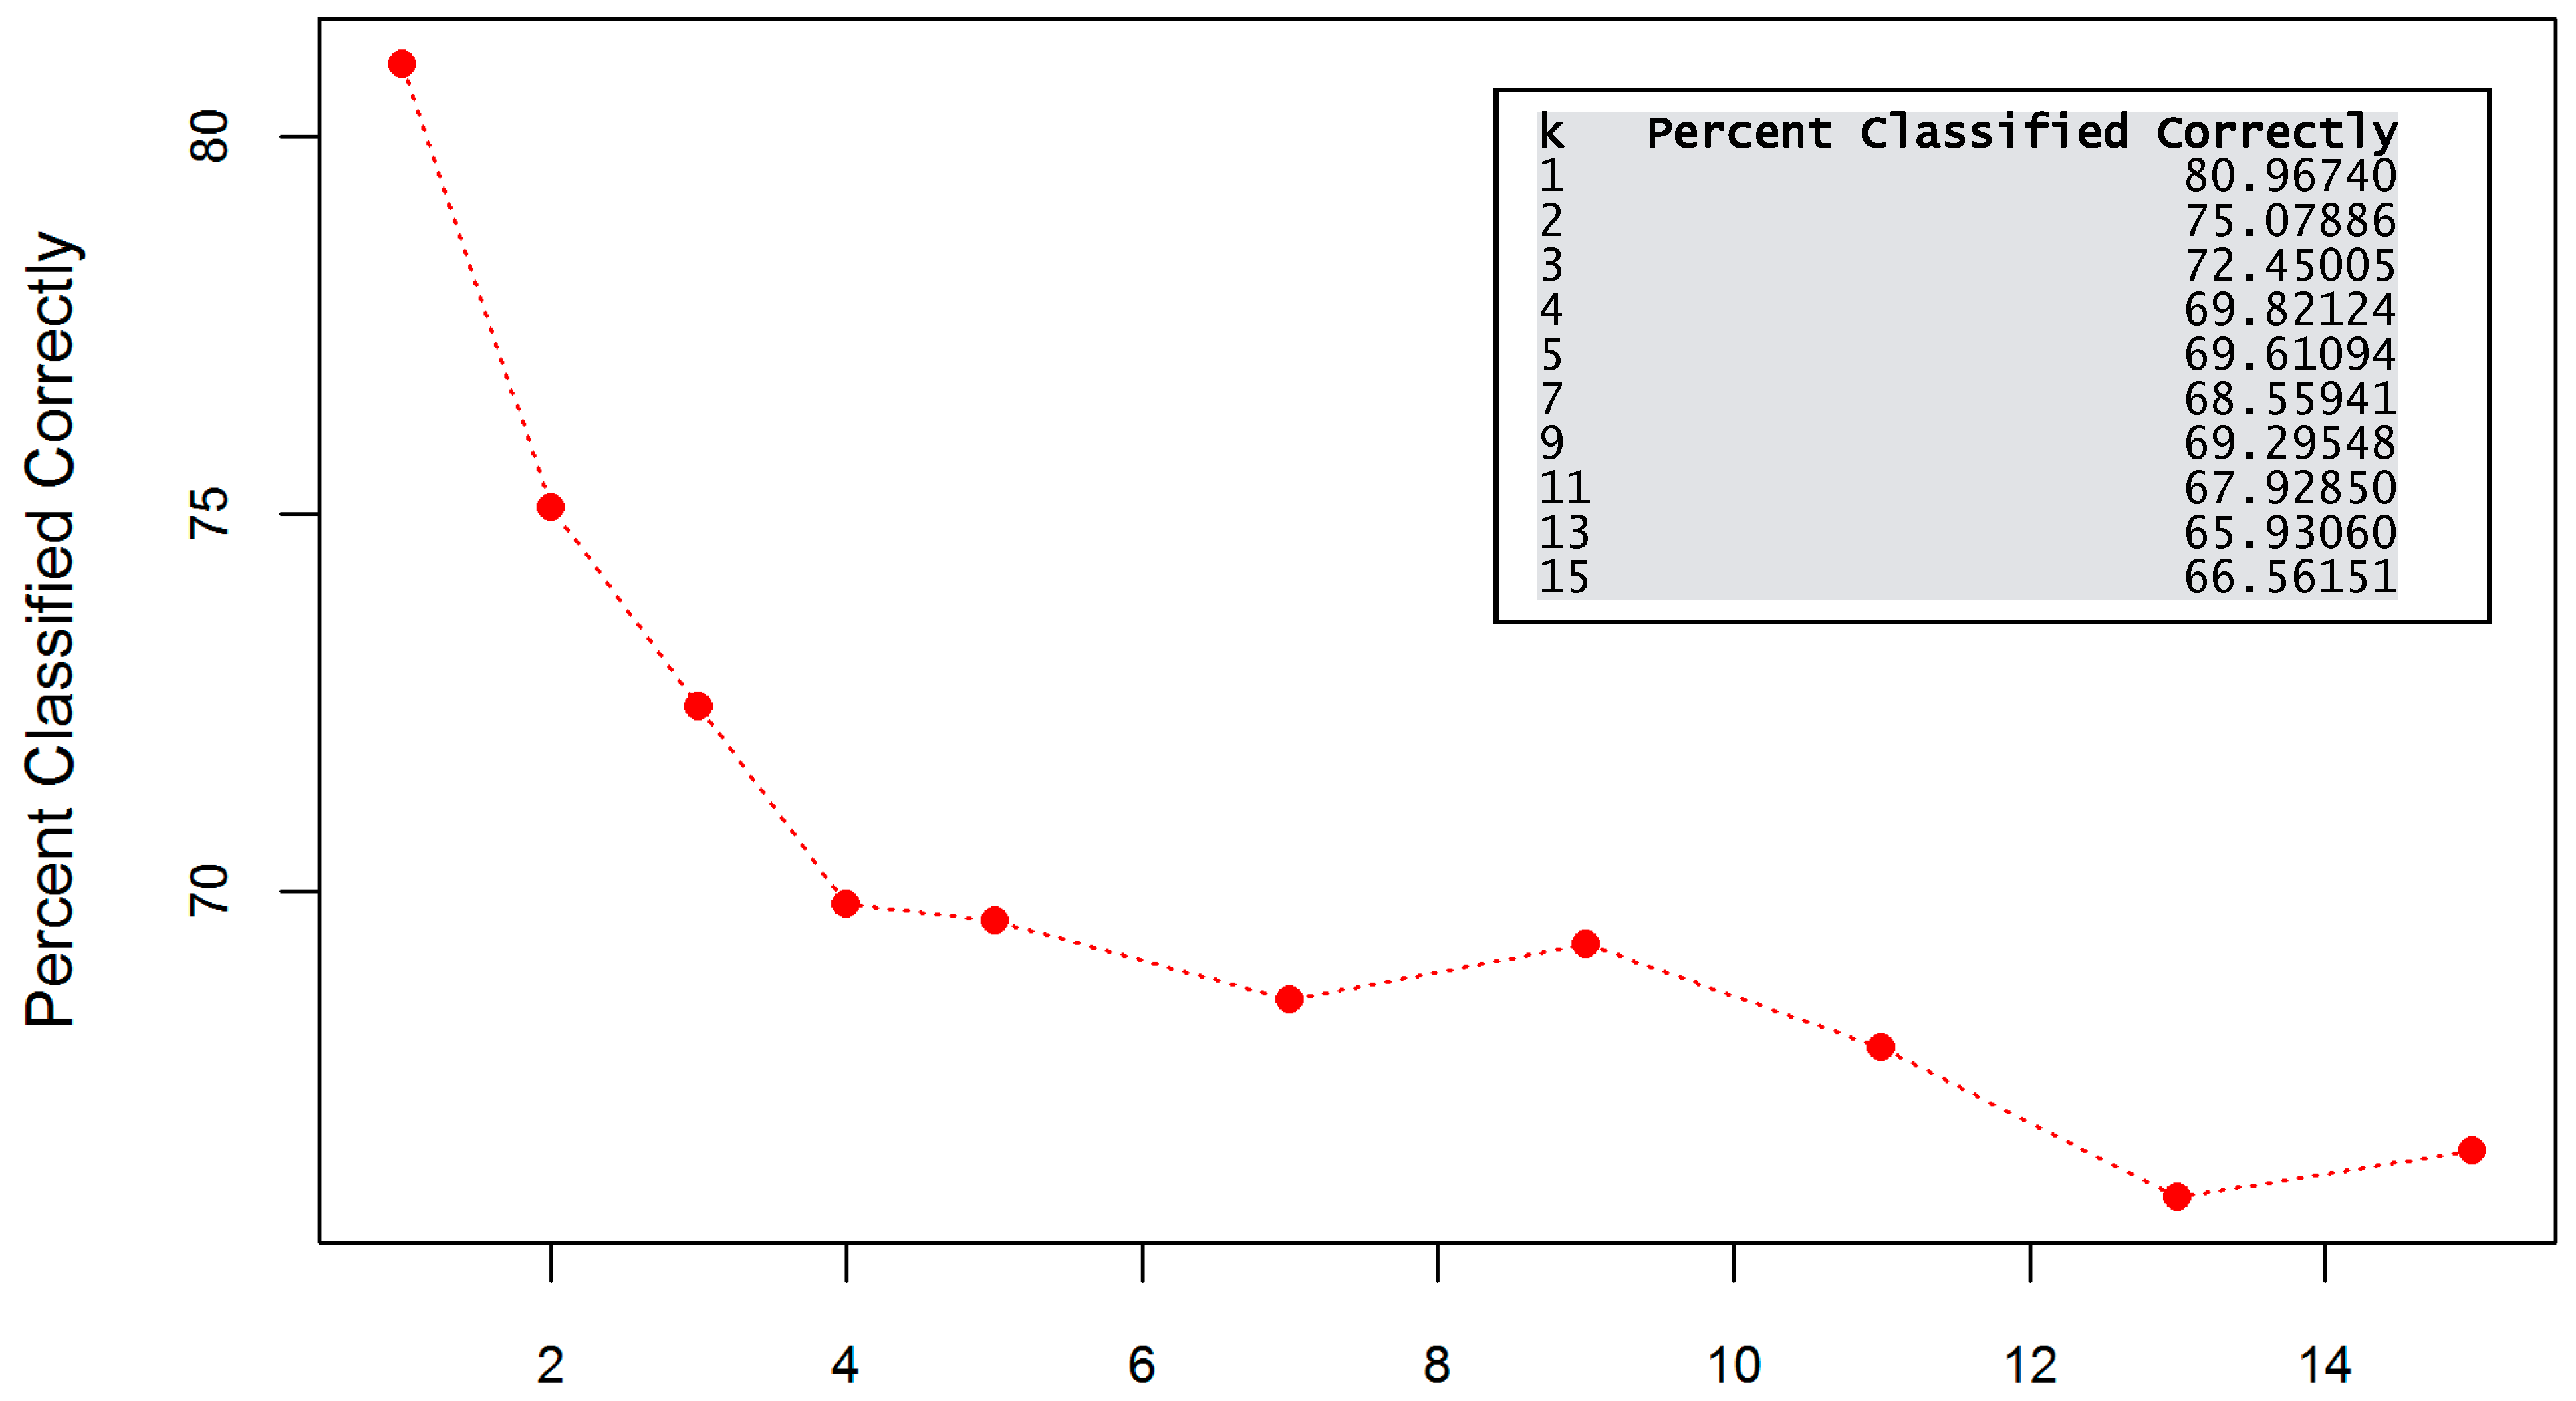
Following the results of the RapidMiner exercise, I decided to focus on modeling with the use of K-Nearest Neighbors. I used 80 percent of the labeled dataset to train a model and 20 percent to test its performance. I ran the algorithm and achieved the accuracy values confirming that, in fact, the best results were reached with a k value equal to 1 (Figure 8). It should be noted, however, that results can vary depending on the applied pre-processing and sampling techniques. Moreover, attention should be given to the fact that models built with the value of k set to 1 can be overfitted and less effective when applied to new data.
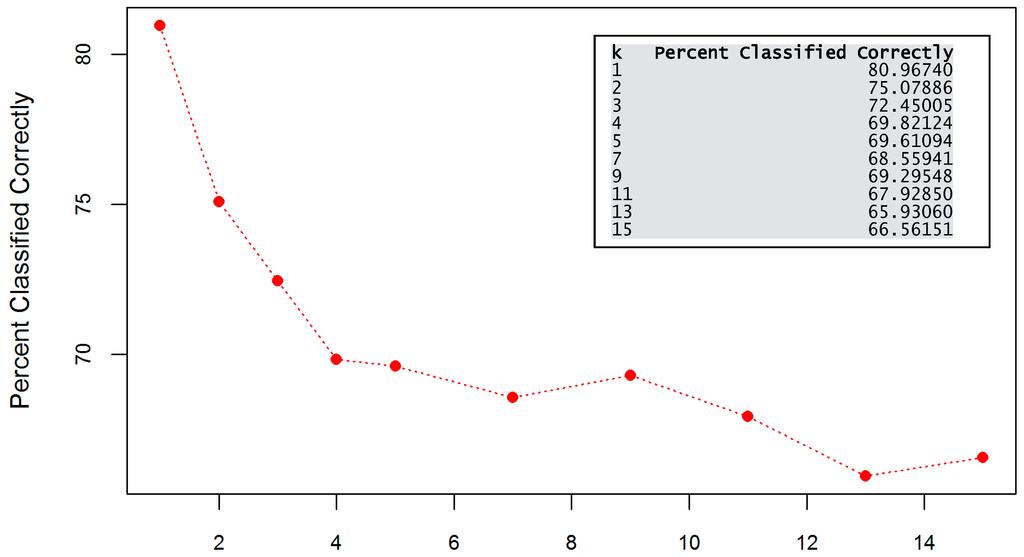
Figure 8.
K-NN accuracy for different k values.
Figure 8.
K-NN accuracy for different k values.
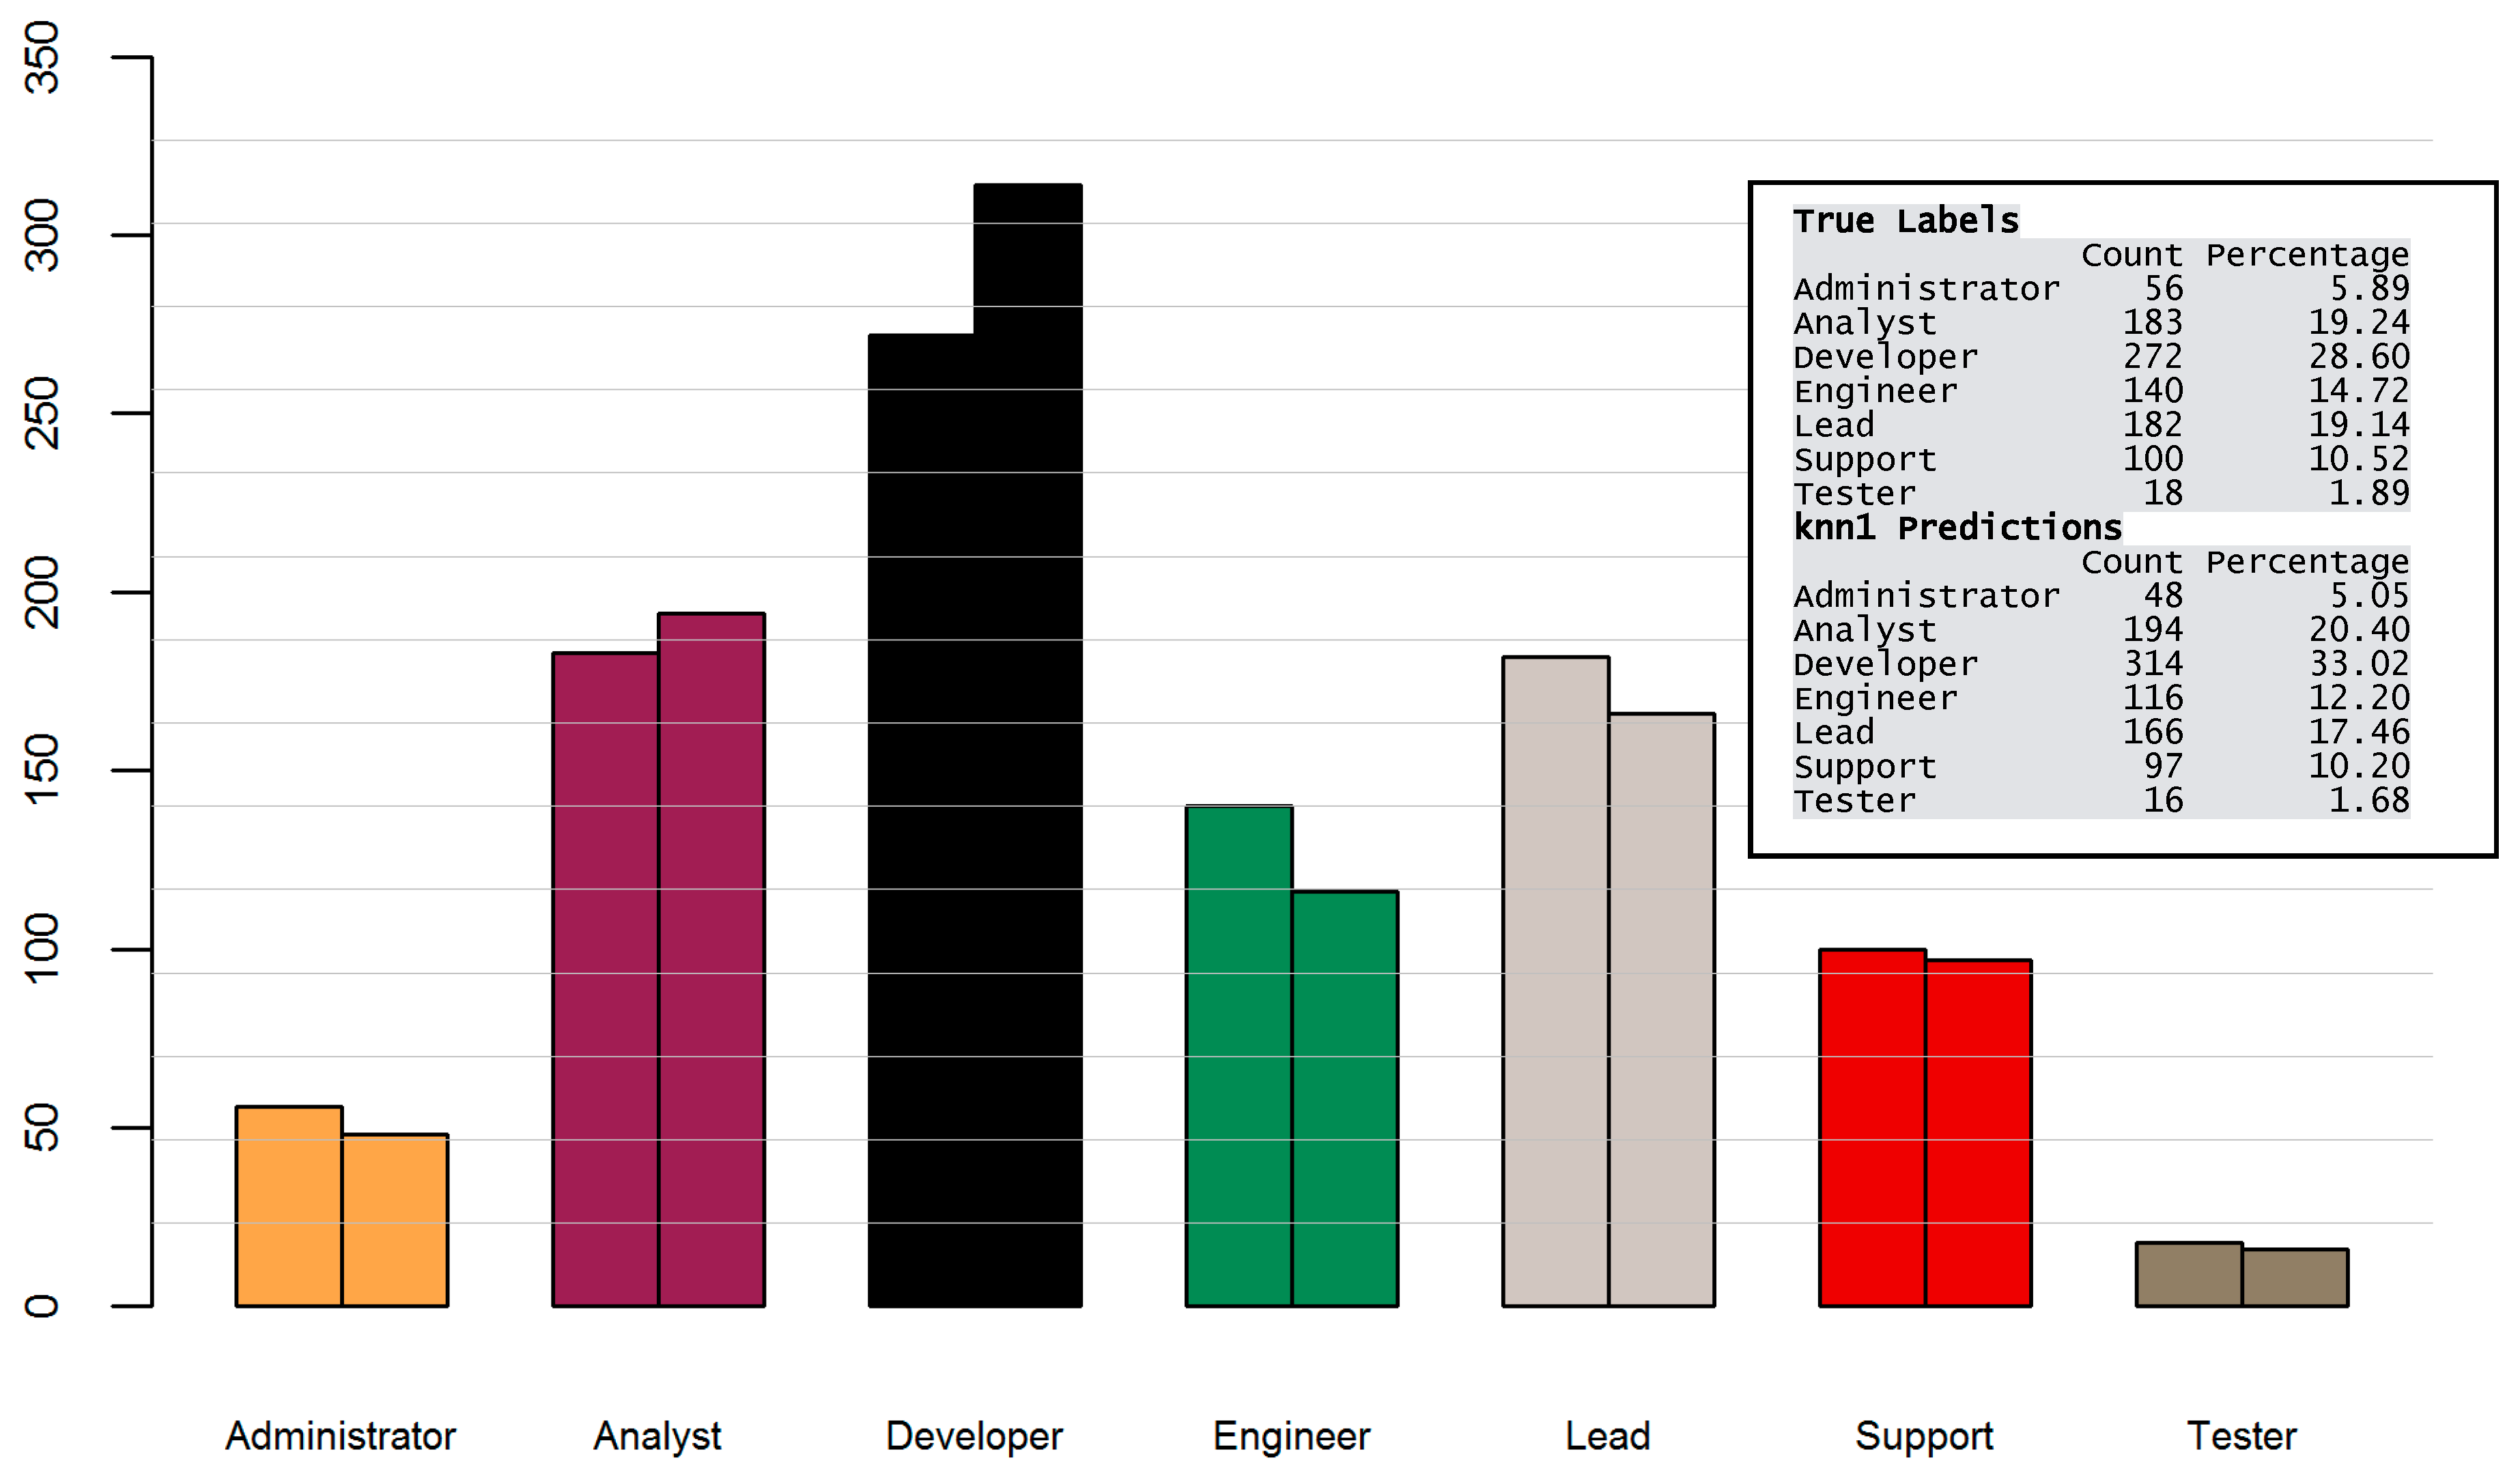
Having the best performing algorithm identified, I evaluated the classification results for the vacancies. As can be seen in Figure 9, in some cases the total number of predictions was lower than the actual number of examples (Administrator, Engineer, Lead, Support, Tester). In others, it was higher than the sum of true labels for that class (Analyst, Developer). This can be estimated by comparing the size of two bars, where the left bar visualizes the number of the actual examples and the right bar the number of predictions for each group.

Figure 9.
Distribution of true labels (left bar) and classification predictions (right bar).
Figure 9.
Distribution of true labels (left bar) and classification predictions (right bar).
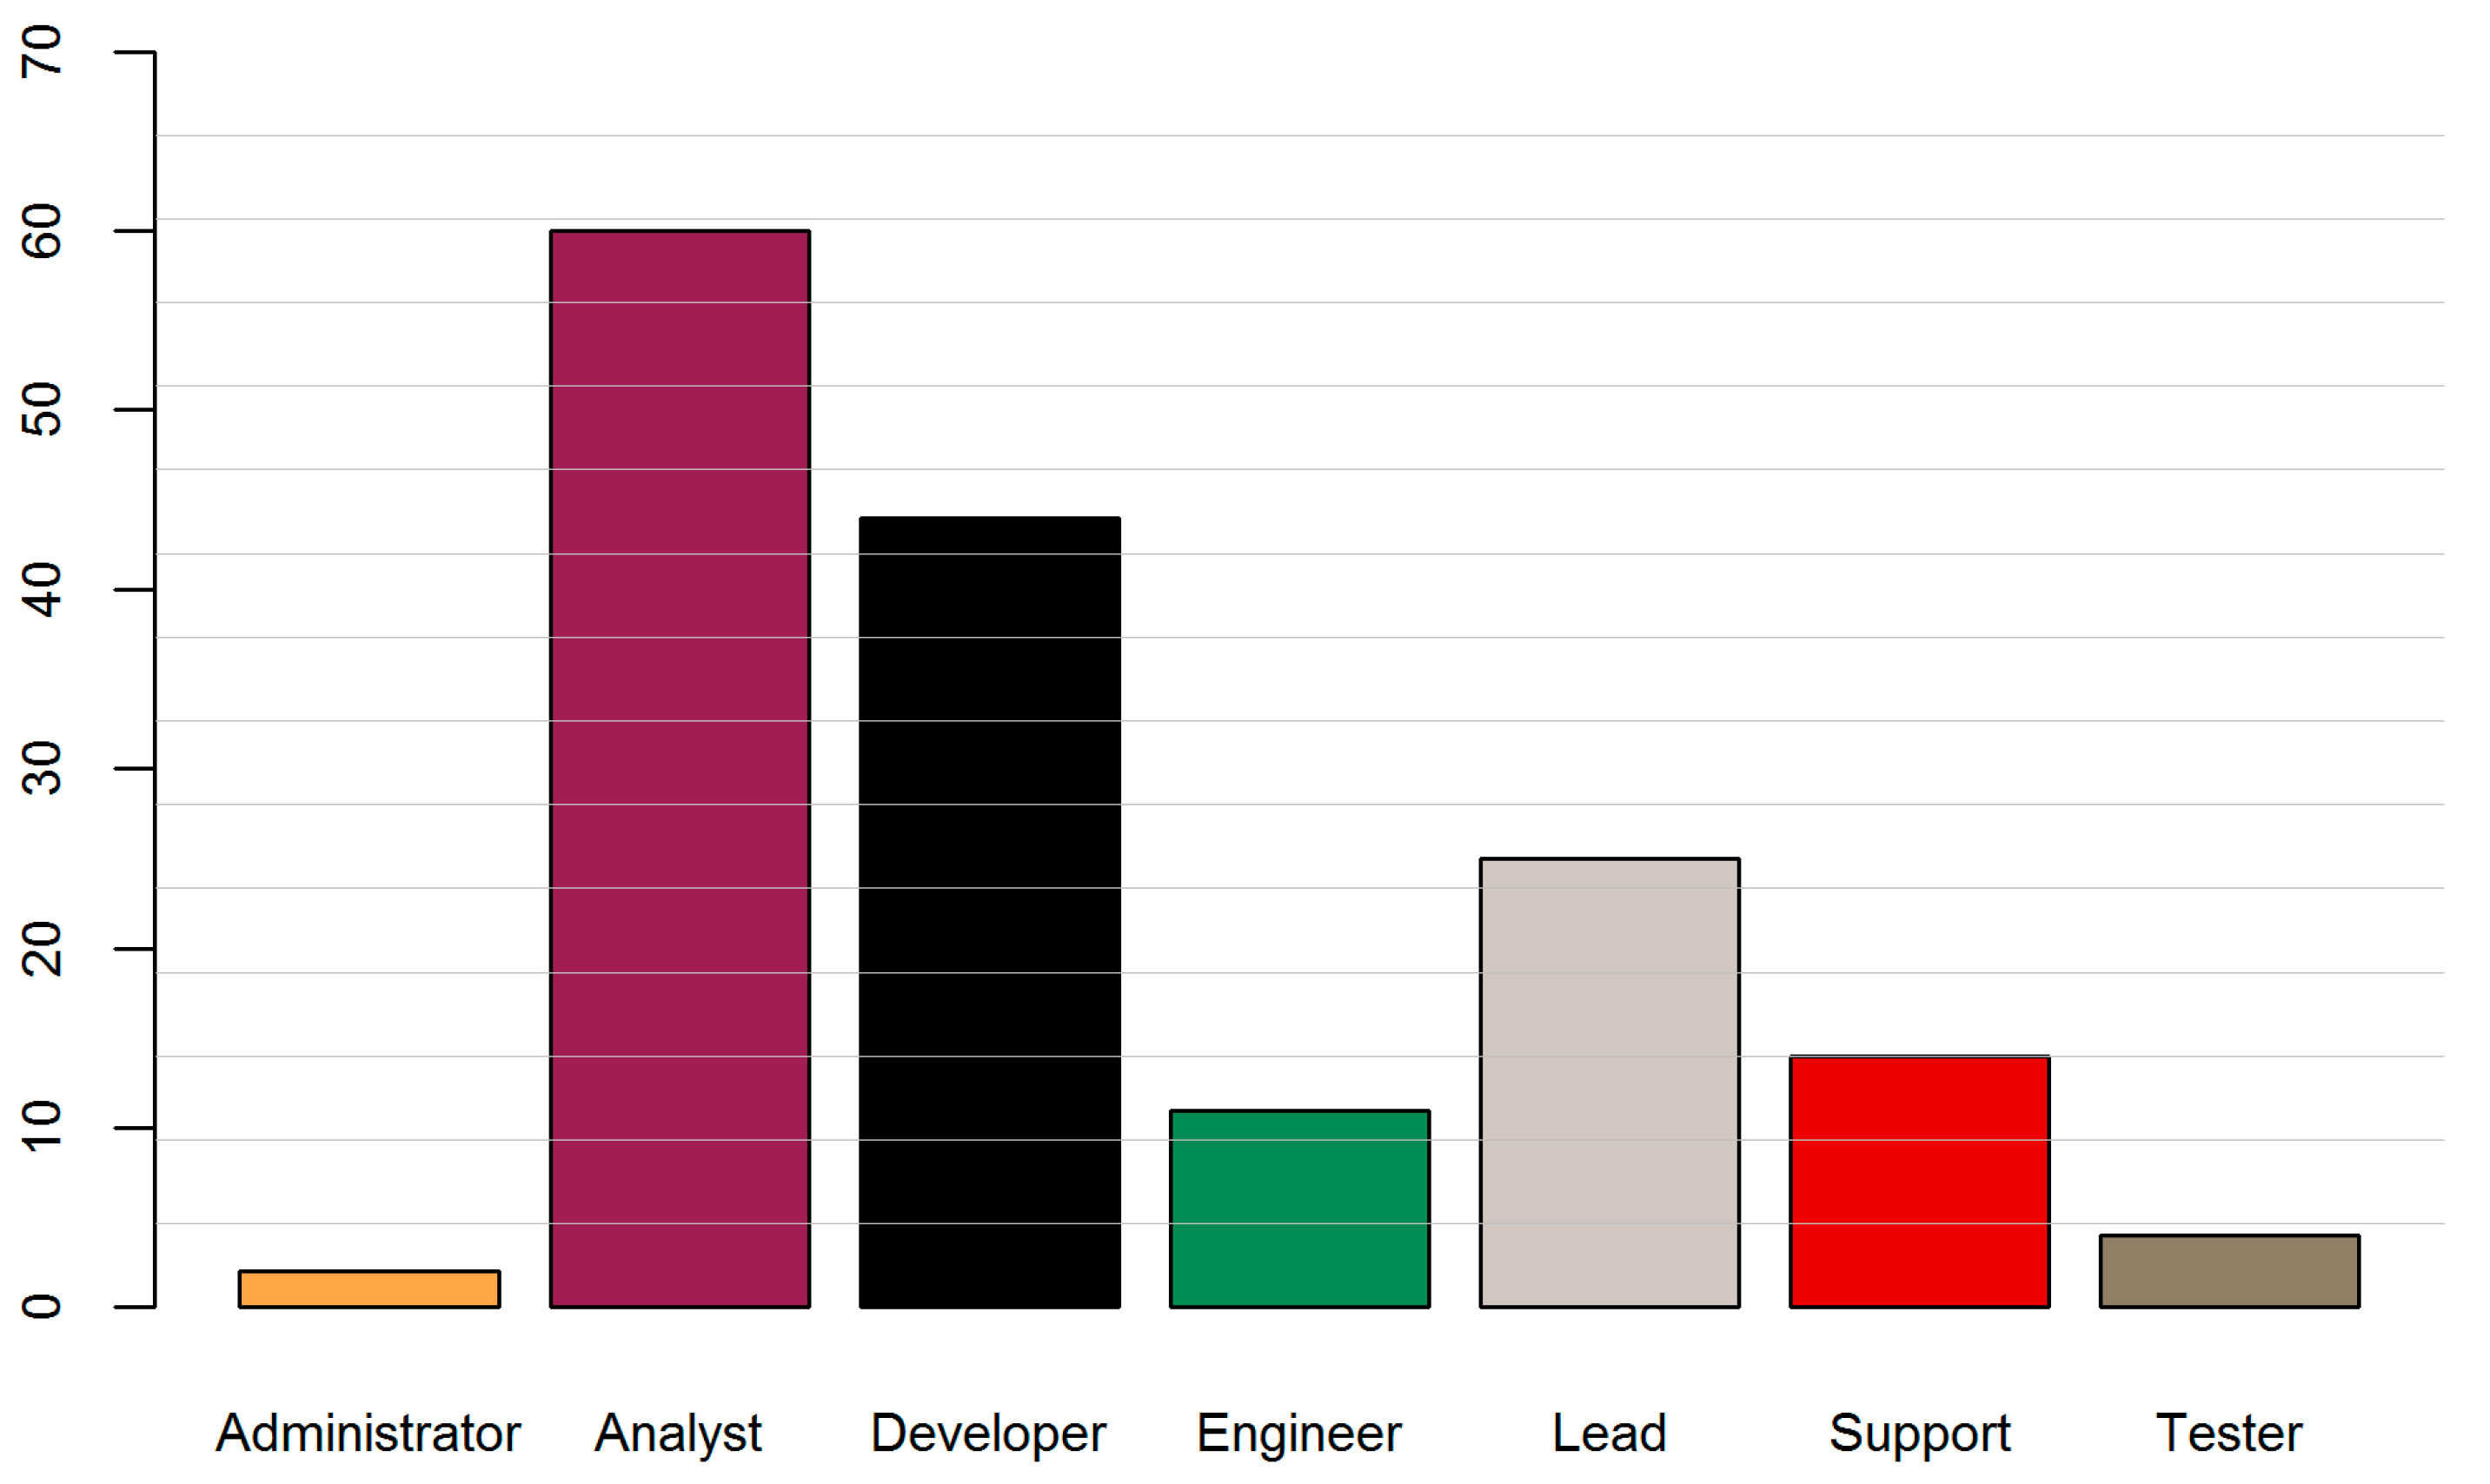
To further evaluate the applicability of this method, I replaced the test subset with previously unseen data and produced label predictions for the remaining 2228 examples. Distribution of predictions for the new data is illustrated in Figure 10.
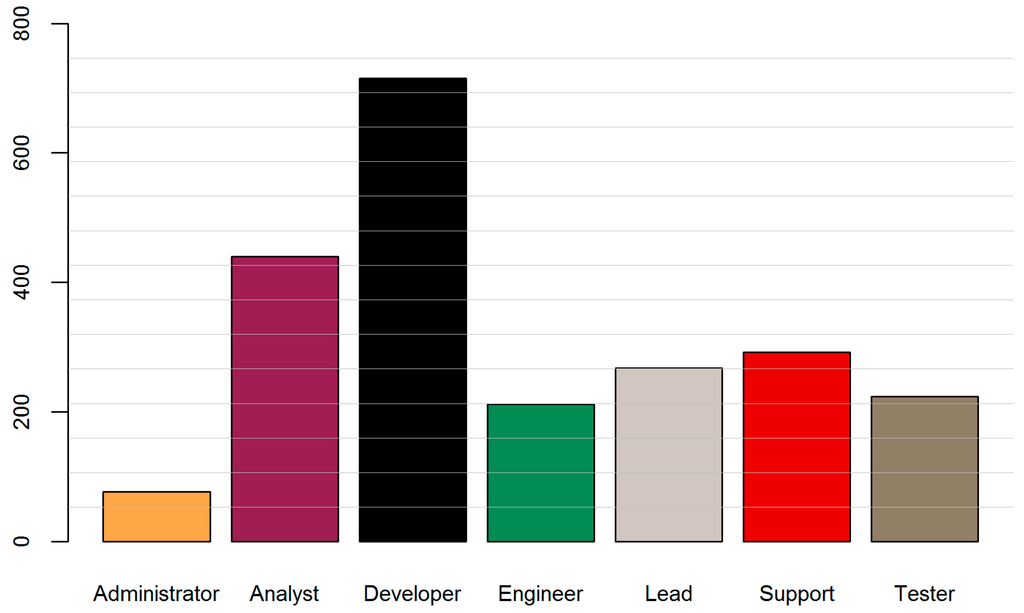
Figure 10.
Distribution of predictions (unseen data).
Figure 10.
Distribution of predictions (unseen data).

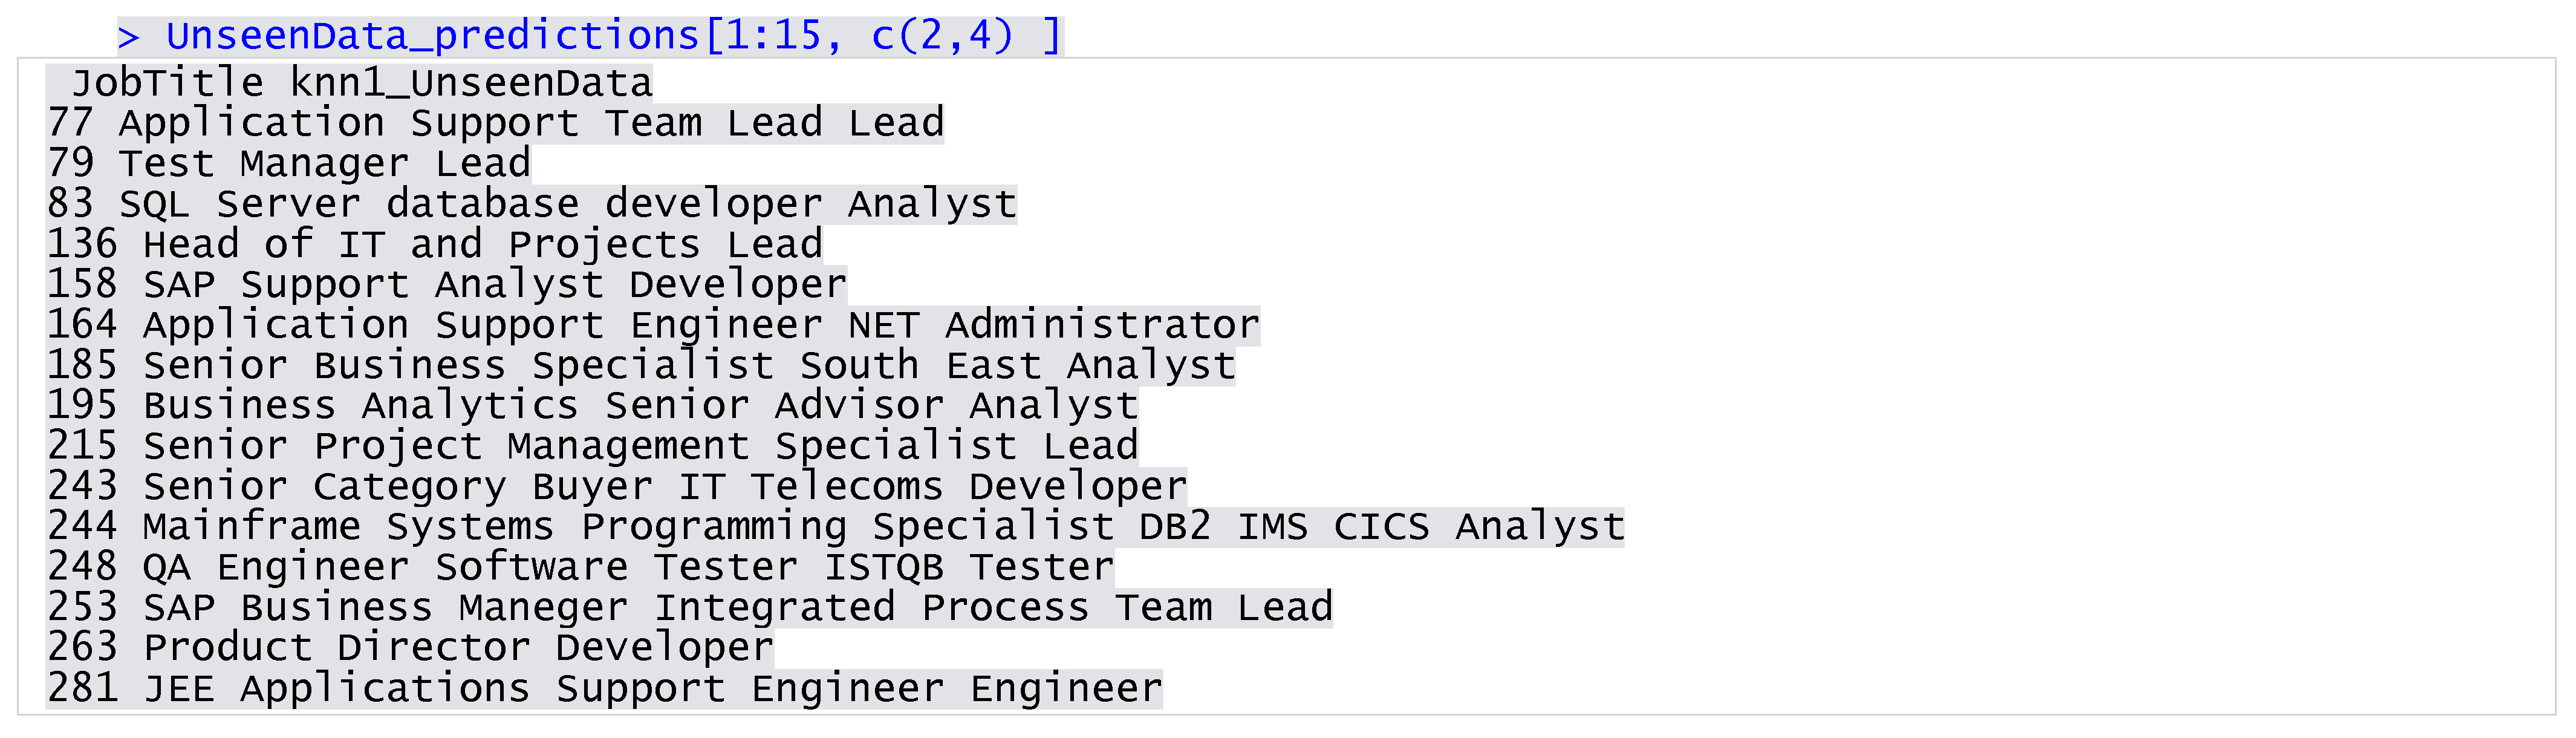
I obtained a vector of predictions that I compared against their job titles. As can be seen in the example (Figure 11), this achieved quality results. In the cases where job titles were ambiguous (i.e., Senior Category Buyer IT Telecoms), the algorithm assigned the labels quickly and efficiently based on analyzing job descriptions Wherever there might be any doubt with regard to label–job title pairs, manual verification can clarify whether a vacancy was misclassified. It is good practice to test a model on various datasets and, if necessary, make further alterations to enhance its performance before implementation.

Figure 11.
Comparison of job titles and predictions (unseen data).
Figure 11.
Comparison of job titles and predictions (unseen data).
Let us recall that the unseen data is comprised of vacancies with somewhat unclear job names. To improve the effectiveness of occupational classification, and consequently the skills analysis, it is therefore advisable to examine job descriptions. Using a data mining model allows for an understanding of the underlying requirements independently from the job title. As an example, I retrieved job posts described with a rather vague term—Specialist. Categorizing those examples with our classifier, I noticed a huge dissimilarity among vacancies that were distributed between all of the seven categories. I argue that, in many cases, the Specialist term could have been replaced with a more meaningful job name. This is particularly significant not only in skills research, but also in online recruitment, where large amounts of data are reviewed by potential applicants. The use of keywords rarely includes such broad expressions as Specialist. Using more specific terms suggested by the predicted labels (Figure 12) gives a better idea about the particular type of vacancy and the skills it might require.

Figure 12.
Predictions for Specialist vacancies (unseen data).
Figure 12.
Predictions for Specialist vacancies (unseen data).
4.4. Data Visualizations
One of the main objectives of the experiment was to propose a method for extracting information about current skills requirements from vacancy data. I have already detailed a procedure that allows for identifying occupations within a given dataset and splitting all advertisements into exclusive groups based on the content of their job descriptions. In this subsection, I illustrate how this content might be visualized to discover more detailed information about the skills in demand.
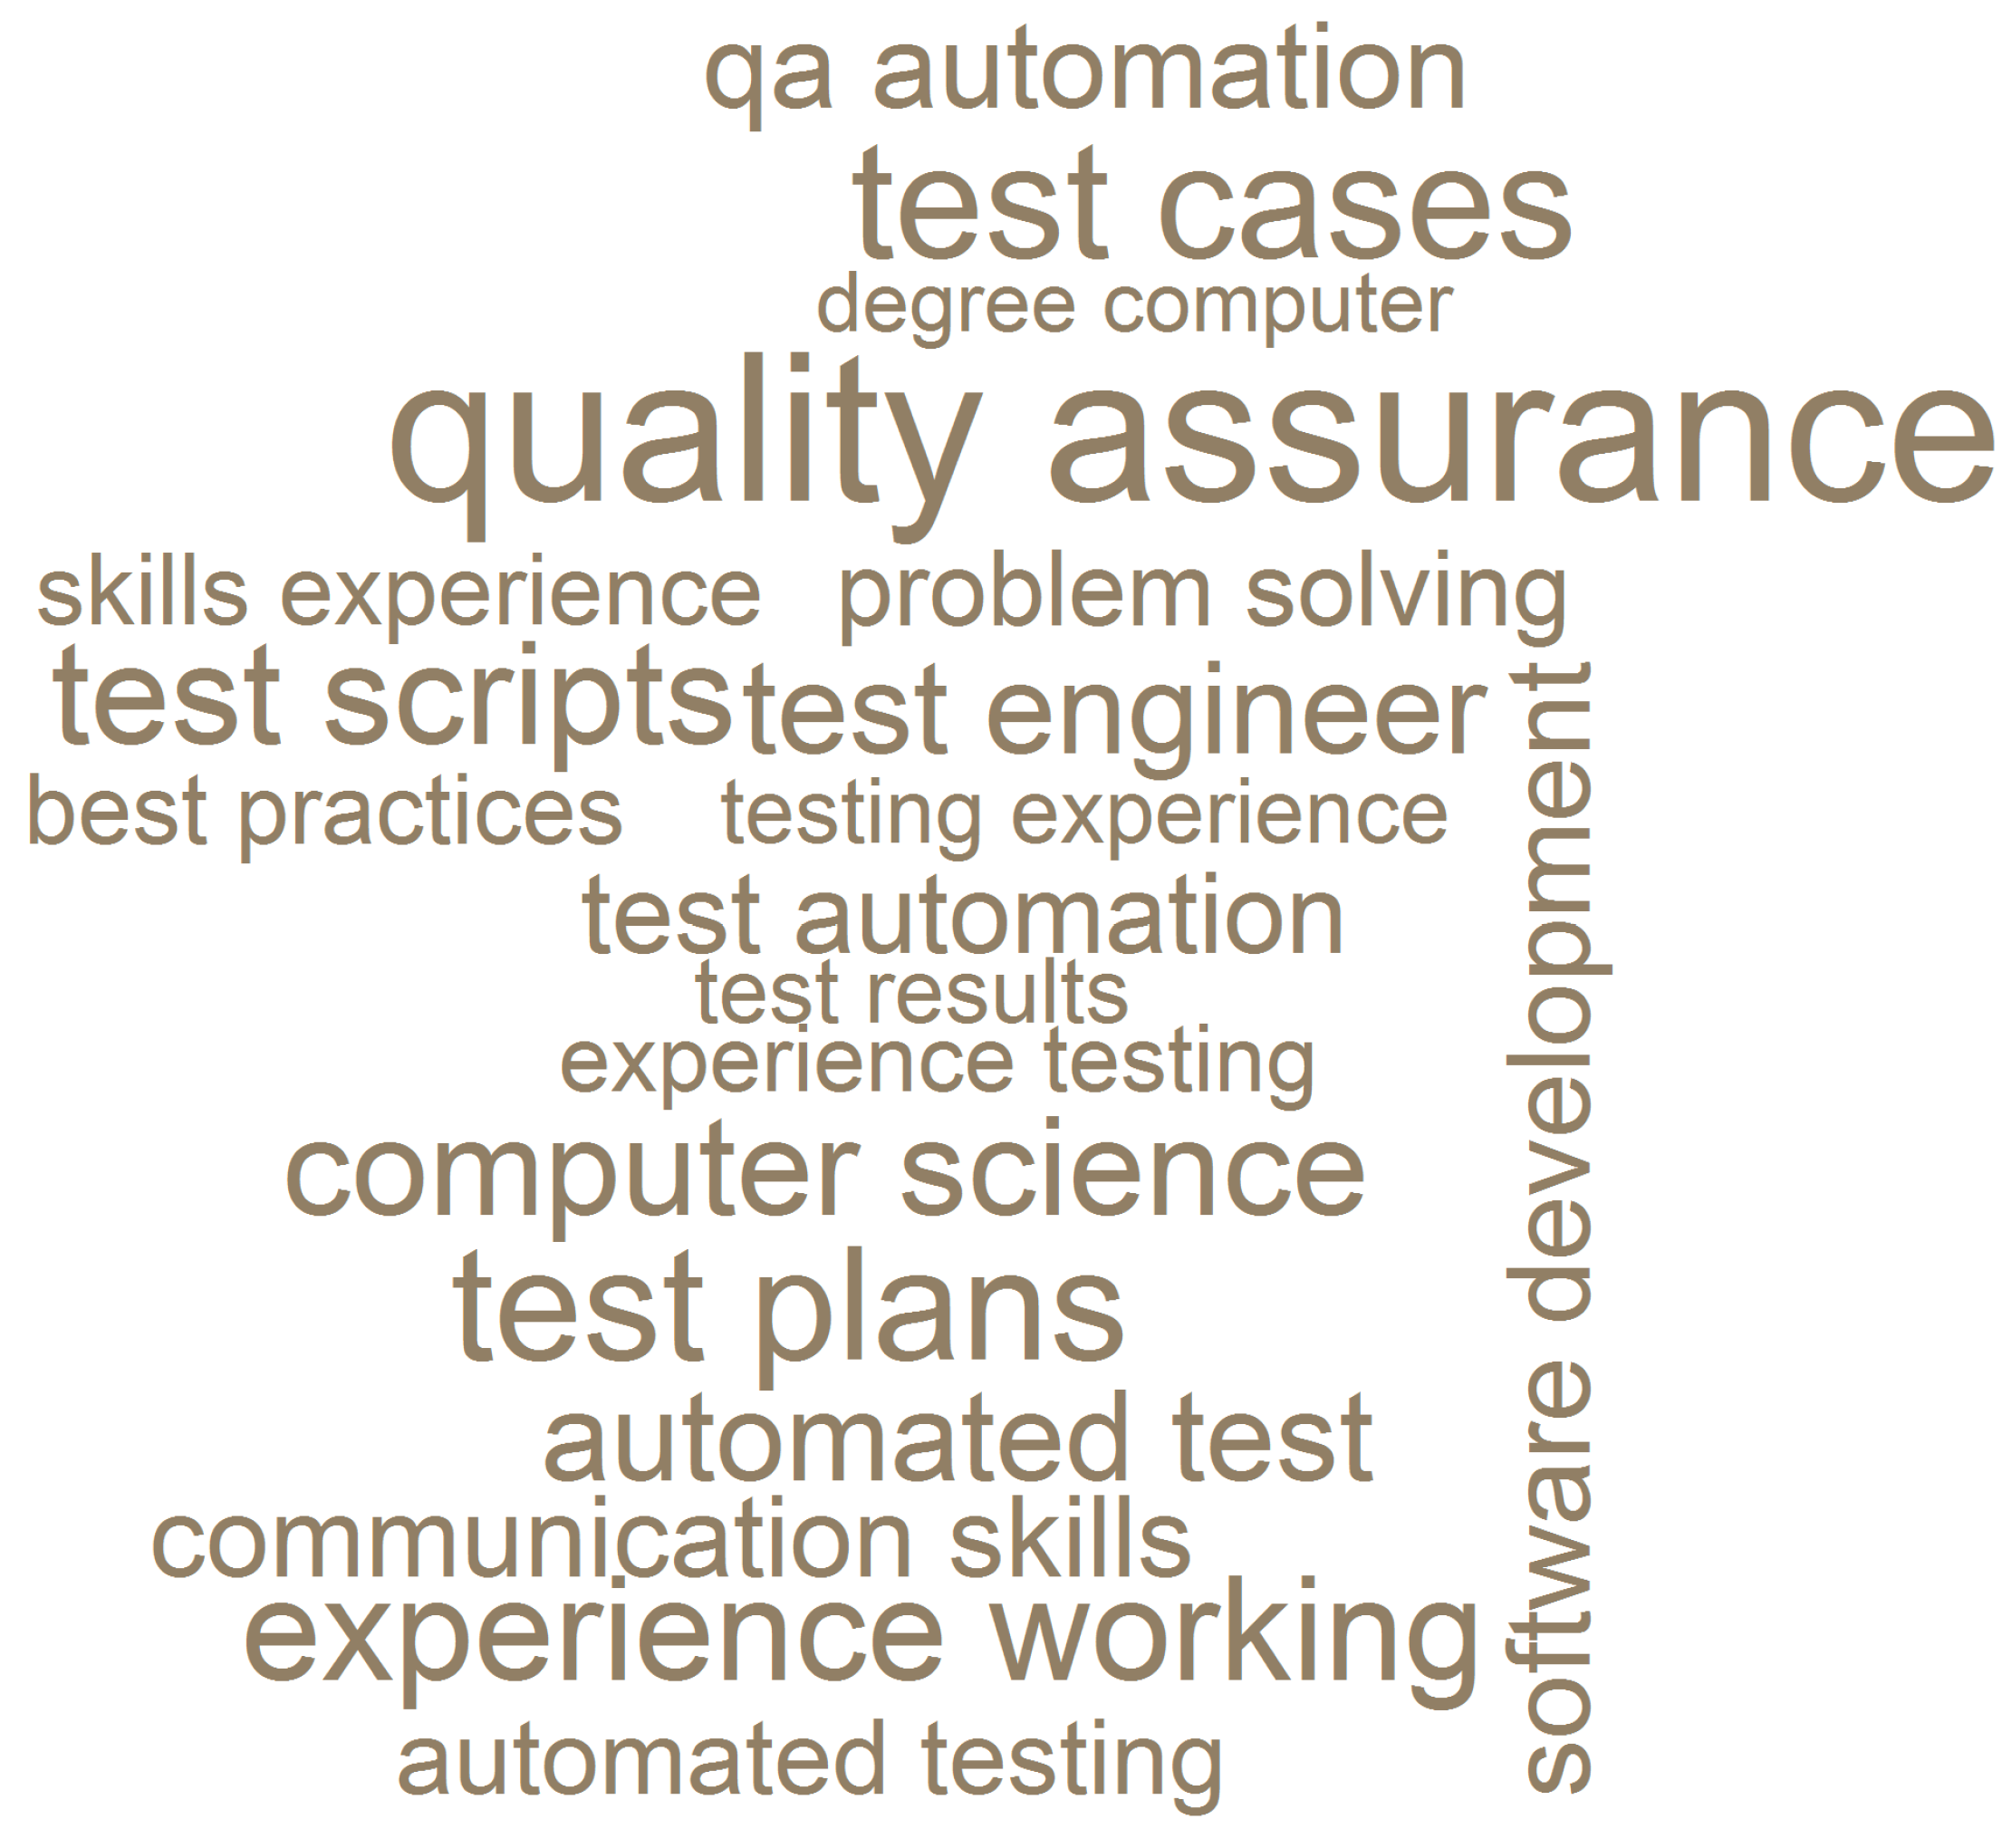
Firstly, I created a new function transformBi that returns a matrix of bigrams (two consecutive words) most frequently appearing in job descriptions. Next I split the unseen dataset into seven occupations based on their class predictions obtained with the k-NN model. I then applied transformBi to each group and visualized the top 20 bigrams for each of them using R’s wordcloud package (Figure 13, Figure 14, Figure 15, Figure 16, Figure 17, Figure 18 and Figure 19).

Figure 13.
Job Descriptions Visualization—Administrator (unseen data).
Figure 13.
Job Descriptions Visualization—Administrator (unseen data).


Figure 14.
Job Descriptions Visualization—Analyst (unseen data).
Figure 14.
Job Descriptions Visualization—Analyst (unseen data).

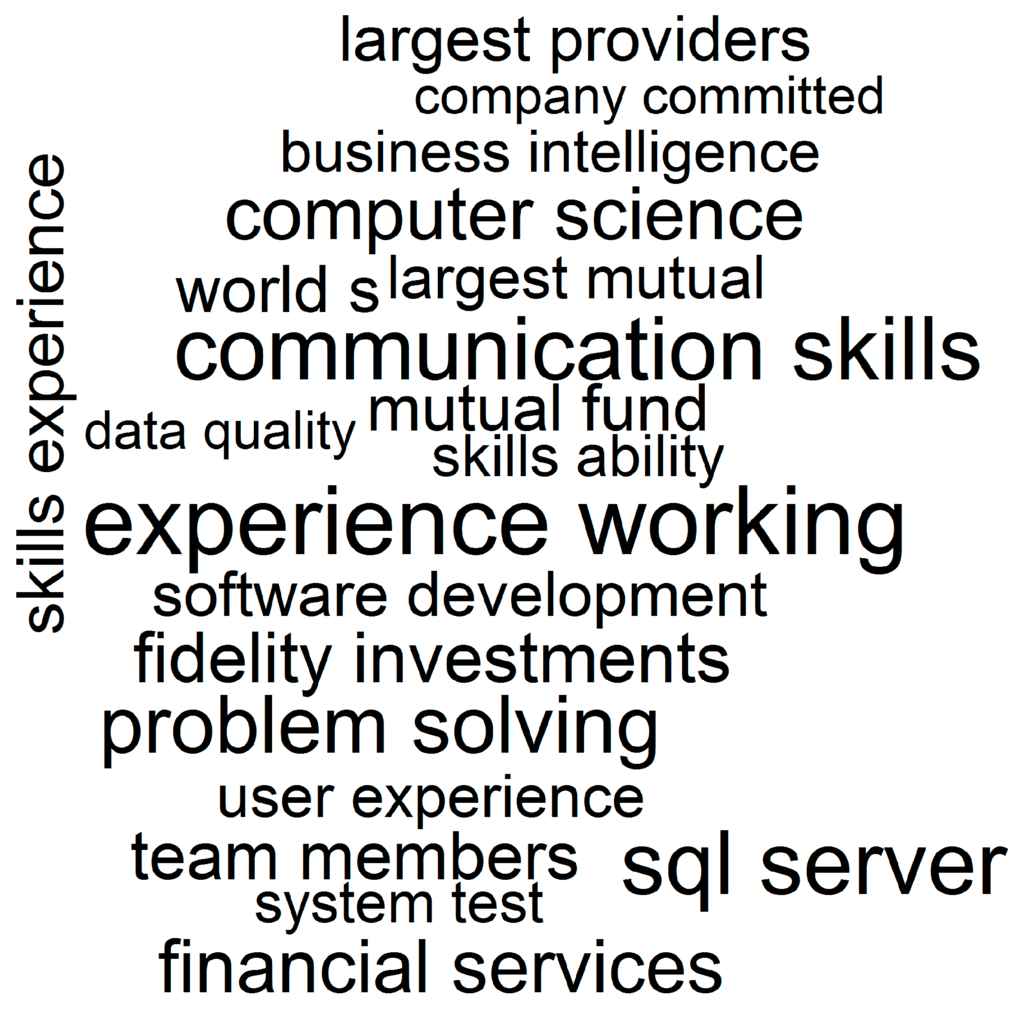
Figure 15.
Job Descriptions Visualization—Developer (unseen data).
Figure 15.
Job Descriptions Visualization—Developer (unseen data).
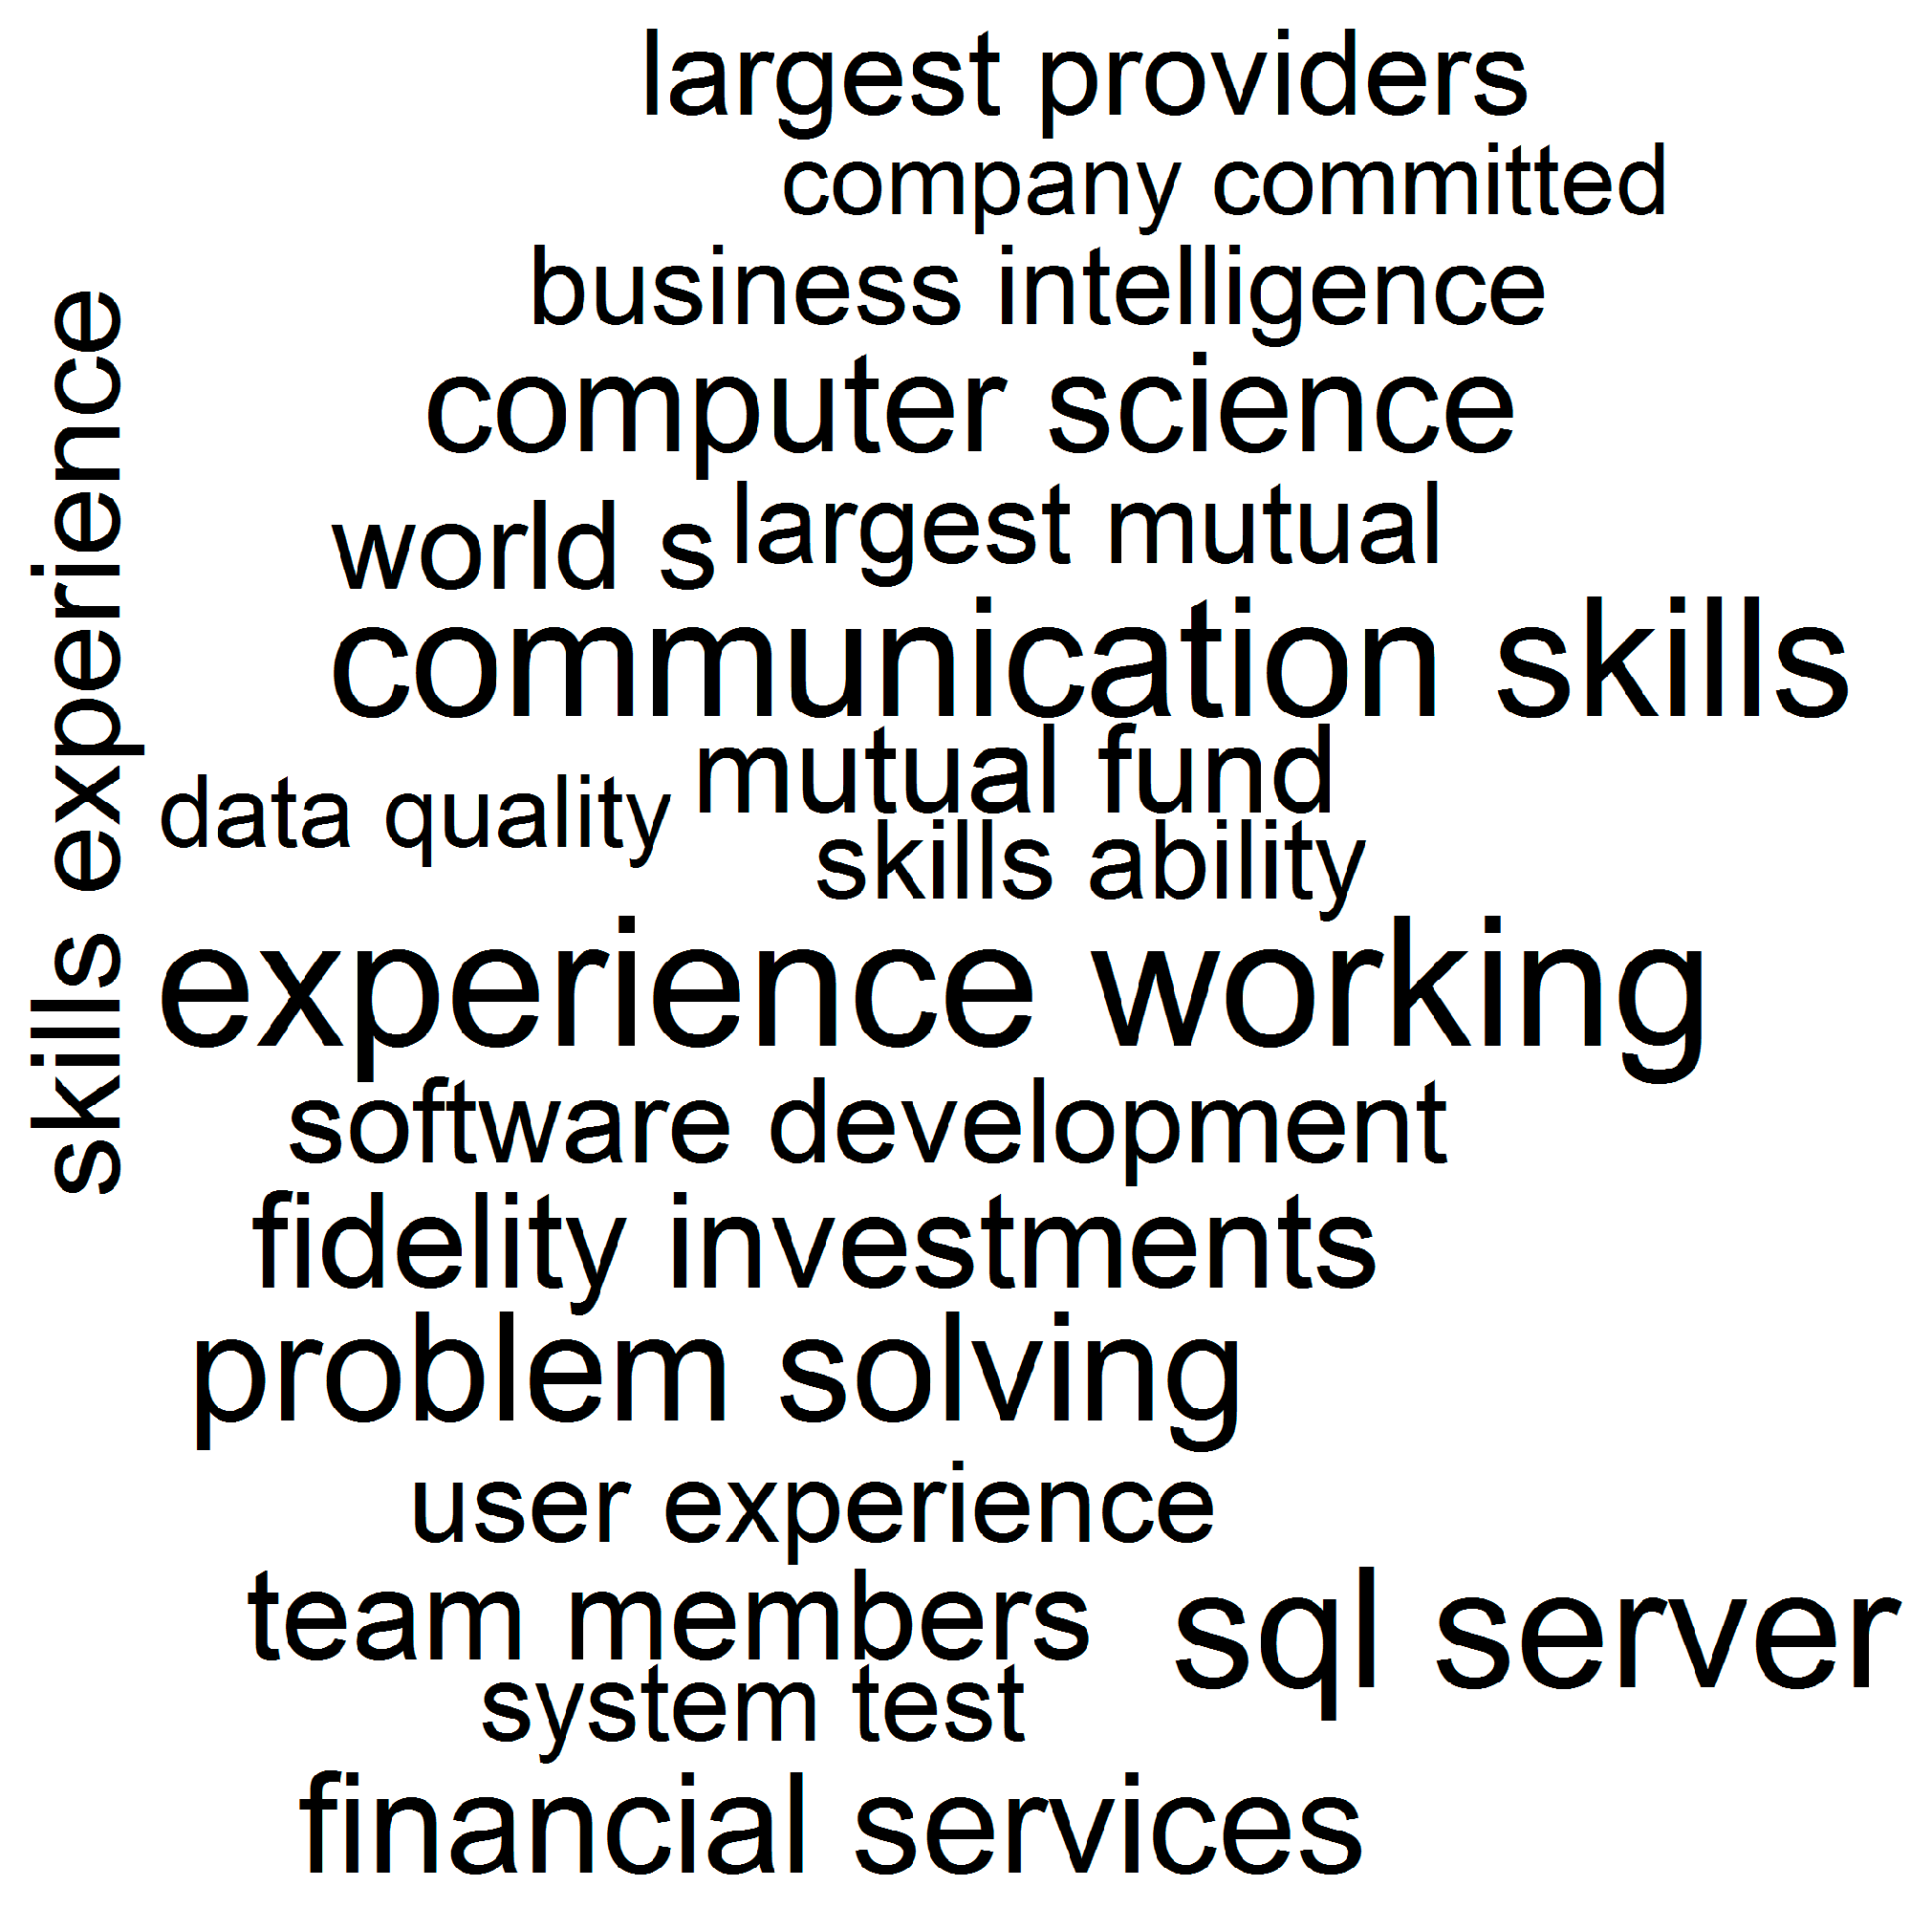

Figure 16.
Job Descriptions Visualization—Engineer (unseen data).
Figure 16.
Job Descriptions Visualization—Engineer (unseen data).
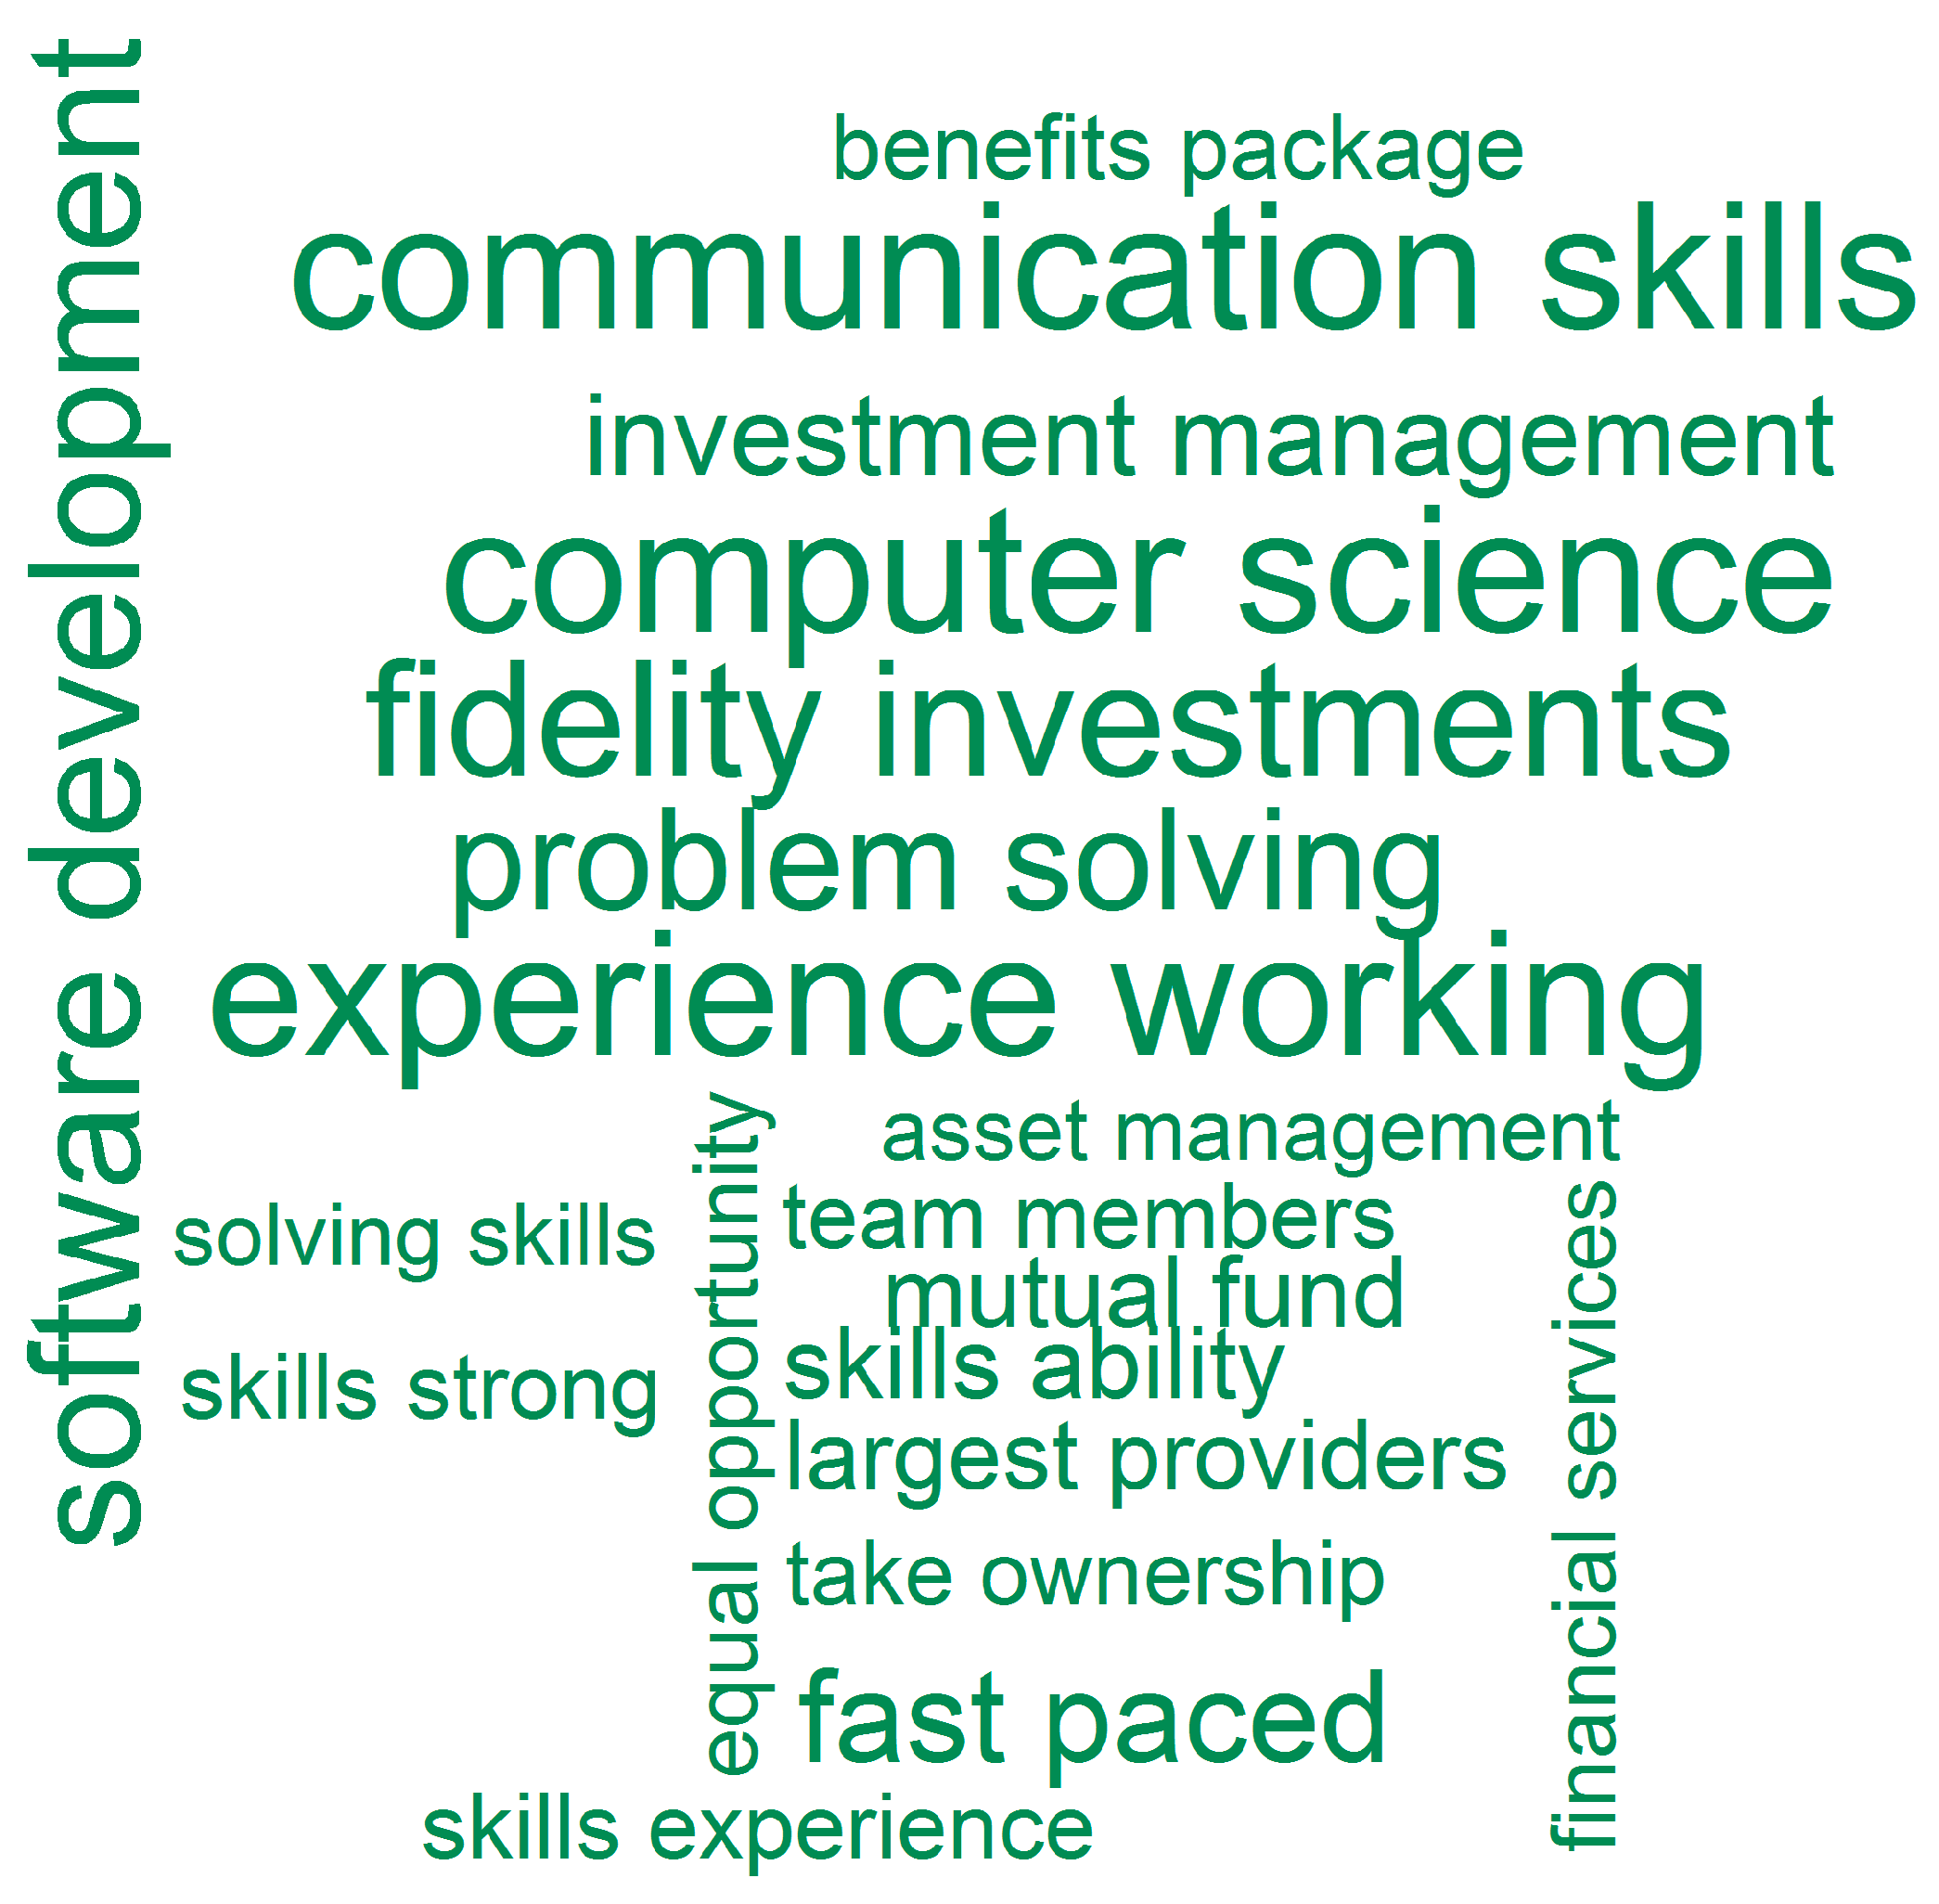
As is apparent in Figure 13, Figure 14, Figure 15, Figure 16, Figure 17, Figure 18 and Figure 19, word clouds are a reasonable representation of job descriptions. One can clearly identify information that, as previously argued, can be used to support planning and development of vocational curricula. Each distinct category includes a set of skills that can be further translated into training provision, and implemented to equip learners with soft and hard competencies accordingly to their chosen careers. For example, administrators require a number of database-related technical competences (i.e., database solutions and design, performance tuning, data engineering, oracle technology, etc.) as well as generic skills (i.e., team working, excellent communication). Analysts need to be communicative, able to manage complex projects, and adept at business computing. Developers should be educated in the areas of software development, business intelligence, and SQL Server technology with an emphasis on problem solving and user experience. In engineering, priority is given to software development and good communication. Not surprisingly, leaders are expected to demonstrate strong project management and communication skills as well as the ability to oversee teams. IT support is largely a matter of customer service, and thus requires a combination of technical and interpersonal skills. Finally, testers should be able to script and run appropriate tests in order to assure quality in software development.
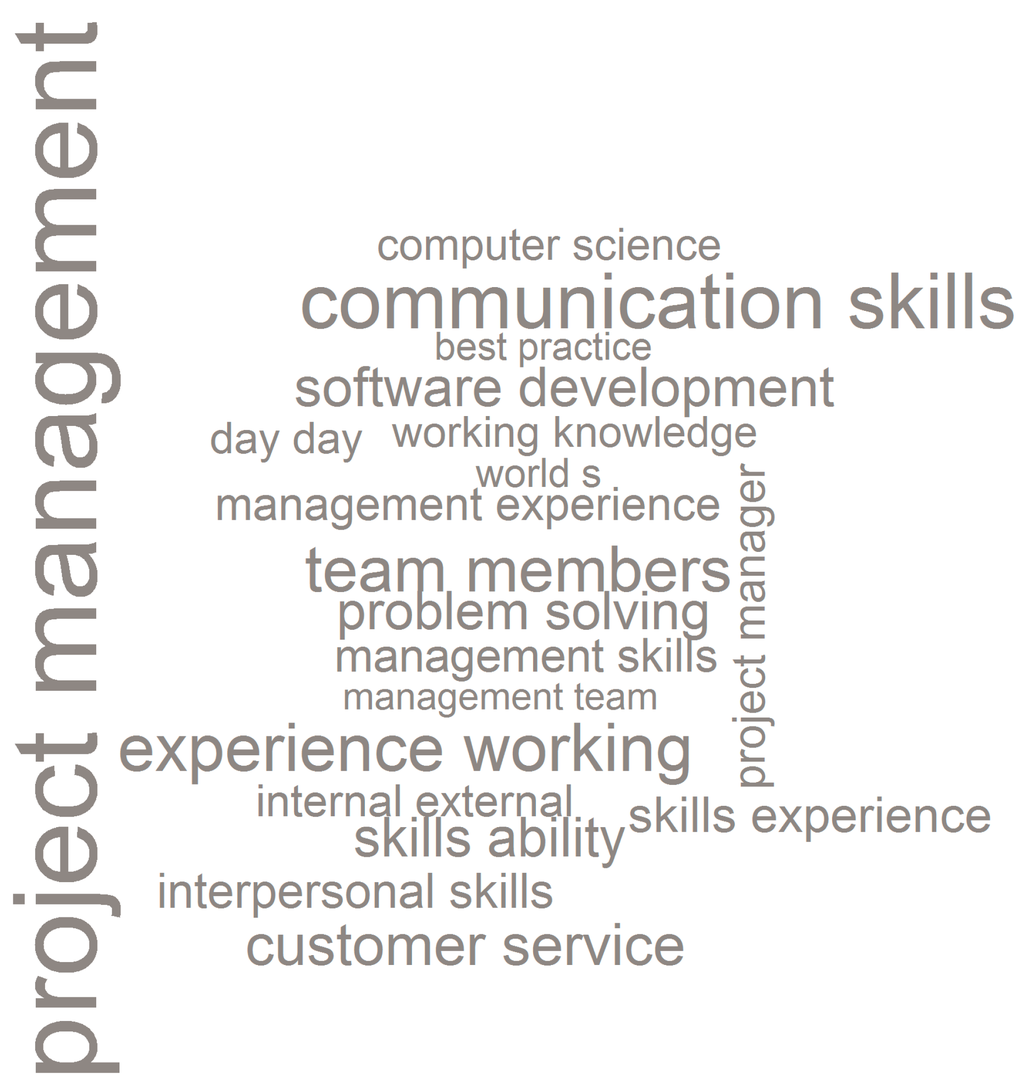
Figure 17.
Job Descriptions Visualization—Lead (unseen data).
Figure 17.
Job Descriptions Visualization—Lead (unseen data).


Figure 18.
Job Descriptions Visualization—Support (unseen data).
Figure 18.
Job Descriptions Visualization—Support (unseen data).


Figure 19.
Job Descriptions Visualization—Test (unseen data).
Figure 19.
Job Descriptions Visualization—Test (unseen data).
Specific job requirements can be identified and addressed through a series of modules composing effective learning programs in response to labor market demands. This applies not only in the context of jobseekers, but also to working individuals who are upskilling through pursuing further education. Therefore, in practical terms, this level of detail is a more valuable perspective on skills needs than any measure based on occupational or educational proxies.
5. Conclusions
In this paper I discussed the subject of data mining in the field of skills analysis. I introduced its theoretical underpinning and discussed practical applications as documented by other authors. I also proposed my own approach that allows for identifying occupations and labor market demands within a given vacancy dataset. I summarized the first experimental study completed in RapidMiner, and subsequent exercises that can be easily recreated in an R environment.
It is important to stress that the above case study is just a single perspective on the given vacancy data. However, R offers tools that implement a myriad of data processing and mining techniques to further enhance its effectiveness. For example, single terms can be analyzed, texts can be parsed applying different frequency measures, or vacancies can be split into distinctive occupational groups using various classification and clustering algorithms. A detailed discussion around data mining is beyond the scope of this paper, which is directed towards labor market practitioners. From this perspective, however, other approaches can be suggested. For example, instead of occupational classification, skill demands can be evaluated for vacancies belonging to various geographical locations, salary ranges, contract types, or employer categories. Digital vacancy data typically include a number of attributes that can be examined conjointly or in sequence to gain more insight into skills requirements. Although similar projects have been cited in Section 2, they do not offer reproducible research and do not address a wider labor market context. My goal is to encourage the application of data mining among those who can benefit from it but might not be aware of the methods and tools available to them. I therefore provide a complete manual for completing the vacancy analysis that can be used as a starting point for further experimentation with textual data. Since any data mining project begins with a concrete business question and is dependent on the underlying dataset, it is impossible to pinpoint a single direction that will best serve all practitioners. That said, I would argue that the proposed method can support skills research by providing a fact-based alternative for the resource-expensive employer surveying. Ideally, since both methods have their limitations (i.e., accessibility, reliability of a source, response latency, etc.), they can be used concurrently in order to improve understanding of skills needs. Our objective was to outline a certain procedure that relates to the existing occupational frameworks and, additionally, extracts more detailed and actionable information. Operating on vacancy data, it is possible to distinguish the professions in demand at a certain point of time and build an accurate model that will automatically separate large amounts of new data, as we have demonstrated in this paper. Our dynamic approach allows for identification of occupations that can be further mapped to any formal framework for a more structured comparative analysis. This procedure not only reduces the pre-processing time required to sort and clean data, but also improves the accuracy of dividing job advertisements by taking into account their full descriptions.
Future directions in our work include more advanced data pre-processing and cleaning techniques that might further improve the classification results and enhance information extraction from job descriptions. Since this was the first analysis of the IrishJobs.ie vacancies that employed data mining in an R environment and textual variables, I am also interested in examining the effectiveness of this method over time, particularly in the context of identifying shifts in skills demands.
Supplementary Materials
Supplementary Materials RCode is published alongside this paper and provides R code used to conduct the vacancy analysis detailed in the previous sections. Supplementary materials can be accessed at: http://www.mdpi.com/2227-9709/2/4/31/s1.
Acknowledgments
The author would like to thank her colleagues in the Skills and Labor Market Research Unit of the Further Education and Training Authority (SOLAS) and Markus Hofmann in the Institute of Technology Blanchardstown for inspiration, encouragement, and their positive feedback on the project.
Conflicts of Interest
The author declares no conflict of interest.
References
- The UK Commission for Employment and Skills. The Labour Market Story: Skills For the Future, 1st ed.The UK Commission for Employment and Skills (UKCES): London, UK, 2014.
- Handel, M. Trends in Job Skill Demands in OECD Countries. OECD Social, Employment and Migration Working Papers, No. 143. 2012. Available online: http://dx.doi.org/10.1787/5k8zk8pcq6td-en (accessed on 18 October 2015).
- Cedefop. User Guide to Developing an Employer Survey on Skill Needs; Publications Office of the European Union: Luxembourg, 2013. [Google Scholar]
- Manacorda, M.; Manning, A. Just Can’t Get Enough: More on Skill-Biassed Change and Labour Market Performance; London School of Economics and Political Science: London, UK, 1999. [Google Scholar]
- EGFSN. Tomorrow’s Skills. Towards a National Skills Strategy; Expert Group on Future Skills Needs: Dublin, Ireland, 2007. [Google Scholar]
- UNESCO. International Standard Classification of Education ISCED 2011; UNESCO Institute for Statistics: Montreal, QC, Canada, 2012. [Google Scholar]
- Litecky, C.; Aken, A.; Ahmad, A.; Nelson, H.J. Mining for Computing Jobs. IEEE Softw. 2010, 27, 78–85. [Google Scholar] [CrossRef]
- Ahmed, F.; Capretz, L.F.; Campbell, P. Evaluating the Demand for Soft Skills in Software Development. IEEE IT Prof. 2012, 14, 44–49. [Google Scholar] [CrossRef]
- Kurekova, L.; Haita, C.; Beblavy, M. Qualifications or Soft Skills? Studying Demand for Low-Skilled from Job Advertisements; NEUJOBS Working Paper No. 4.3.3; NEUJOBS: Brussels, Belgium, 2012. [Google Scholar]
- Zhang, S.; Li, H.; Zhang, S. Job Opportunity Finding by Text Classification. Procedia Eng. 2012, 29, 1528–1532. [Google Scholar] [CrossRef]
- Jiang, W.; Huang, L.; Liu, O.; Lu, Y. A Cascaded Linear Model for Joint Chinese Word Segmentation and Part-of-Speech Tagging. In Proceedings of the 46th Annual Meeting of the Association for Computational Linguistics, Columbus, OH, USA, 15–20 June 2008; pp. 897–904.
- Weiss, S.M.; Indurkhya, N.; Zhang, T. Texts in Computer Science. Fundamentals of Predictive Text Mining; Springer: London, UK, 2010. [Google Scholar]
- Debortoli, S.; Müller, O.; vom Brocke, J. Comparing Business Intelligence and Big Data Skills—A Text Mining Study Using Job Advertisements. Bus. Inf. Syst. Eng. 2014, 6, 289–300. [Google Scholar] [CrossRef]
- Landauer, T.K.; Foltz, P.W.; Laham, D. Introduction to Latent Semantic Analysis. Discourse Process. 1998, 25, 259–284. [Google Scholar] [CrossRef]
- Albright, R. Taming Text with the SVD. Available online: ftp://ftp.dataflux.com/techsup/download/EMiner/TamingTextwiththeSVD.pdf (accessed on 4 September 2015).
- Cedefop. Skills Supply and Demand in Europe. In Methodological Framework; Research Paper No. 25; Publications Office of the European Union: Luxembourg, 2012. [Google Scholar]
- McNaboe, J.; Cordon, N.; Milicevic, I.; Hogan, A.; Wowczko, I. Vacancy Overview 2014. Available online: http://www.solas.ie/docs/VacancyOverviewReport2015.pdf (accessed on 18 October 2015).
© 2015 by the authors; licensee MDPI, Basel, Switzerland. This article is an open access article distributed under the terms and conditions of the Creative Commons Attribution license ( http://creativecommons.org/licenses/by/4.0/).