Abstract
This study introduces a novel informatics framework for assessing regional sustainability by integrating Twin Mean-Variance Two-Stage Data Envelopment Analysis (TMV-TSDEA) with a desirability-based decision analytics system. The model evaluates both the efficiency and stability of economic and environmental performance across regions, supporting evidence-based policymaking and strategic planning. Applied to 16 Thai provinces, the framework incorporates a wide range of indicators—such as investment, population, tourism, industrial output, electricity use, forest coverage, and air quality. The twin mean-variance approach captures not only average efficiency but also the consistency of performance over time or under varying scenarios. A two-stage DEA structure models the transformation from economic inputs to environmental outcomes. To ensure comparability, all variables are normalized using desirability functions based on standardized statistical coding. The TMV-TSDEA framework generates composite performance scores that reveal clear disparities among regions. Provinces like Bangkok and Ayutthaya demonstrate a consistent high performance, while others show underperformance or variability requiring targeted policy action. Designed for integration with smart governance platforms, the framework provides a scalable and reproducible tool for regional benchmarking, resource allocation, and sustainability monitoring. By combining informatics principles with advanced analytics, TMV-TSDEA enhances transparency, supports decision-making, and offers a holistic foundation for sustainable regional development.
1. Introduction
Informatics is essential for the conversion of intricate, multidimensional data into actionable insights that guide sustainable development, support planning, and inform policy. Informatics frameworks facilitate the incorporation of environmental, economic, and social data to facilitate transparent, data-driven decision-making within the context of regional sustainability. Nevertheless, the dynamic, multi-layered nature of sustainability data is not adequately captured by numerous existing models, including traditional Data Envelopment Analysis (DEA). These models frequently concentrate exclusively on mean performance, neglecting critical factors such as real-world applicability, data uncertainty, and variability in decision support contexts.
In order to overcome these constraints, this investigation suggests a novel Twin Mean-Variance Two-Stage Data Envelopment Analysis (TMV-TSDEA) model that is the foundation of an integrated informatics-based framework for regional sustainability evaluation. This method integrates quantitative modeling with informatics principles, including data normalization, performance coding, and decision scoring, to create a unified system for regional performance assessment. Unlike single-stage models, TMV-TSDEA integrates both mean efficiency and variance (i.e., stability), thereby facilitating a more comprehensive comprehension of the consistent performance of regions in the economic and environmental domains. The framework’s design is in response to the increasing demand for digital systems that can facilitate multi-dimensional, longitudinal analysis in intricate environments.
Although traditional DEA and its variants have been extensively utilized to assess efficiency, the majority of methods prioritize mean performance. Although valuable, this one-dimensional perspective fails to consider an equally critical factor: the consistency or stability of performance in the face of changing conditions or over time. In sustainability contexts, such as regional planning and environmental governance, the absence of stability may result in volatile or unreliable outcomes, which could undermine long-term development objectives. The Twin Mean-Variance Two-Stage DEA (TMV-TSDEA) was introduced to address this methodological lacuna by explicitly incorporating both average efficiency and performance variability into a single, informatics-oriented framework. TMV-TSDEA provides a more resilient and actionable foundation for decision-making in the face of uncertainty by incorporating these dual aspects.
Additionally, the Malmquist Productivity Index, Bootstrapping, Stochastic DEA, and Window Analysis are all extensions of DEA that address temporal dynamics or random noise, but they do not explicitly measure stability as a standalone dimension. In the same vein, two-stage DEA models offer valuable insights into sequential processes; however, they frequently neglect to integrate environmental contextual factors or to convert heterogeneous indicators into a unified and comparable scale. In complex, data-driven sustainability evaluations, these constraints limit their applicability.
The TMV-TSDEA framework that has been proposed is designed to address these voids by incorporating desirability-based transformations into a two-stage structure. This framework enables the integration of a variety of economic and environmental variables into a standardized evaluation process. This innovation not only fortifies the methodological underpinnings of DEA but also improves its practical utility as a decision-support tool for regional sustainability governance. TMV-TSDEA offers policymakers a more comprehensive comprehension of performance by emphasizing efficiency and stability, thereby facilitating the development of informed strategies that balance environmental responsibility with economic growth.
The primary objective of conventional DEA models, as well as their sophisticated extensions, is to evaluate efficiency, which refers to the extent to which decision-making units (DMUs) convert inputs into outputs in comparison to the most effective observed practice. On the other hand, efficiency is fundamentally a static or average-oriented concept that reflects performance under typical or aggregate conditions. Stability, on the other hand, is the consistency and dependability of performance across various environmental contexts, scenarios, or time periods. A DMU may be highly unstable, resulting in fluctuating results that undermine its reliability as a benchmark for sustainable development, despite its average efficiency. In contrast, a moderately efficient DMU with minimal variability may offer a more reliable foundation for the development of long-term policies. This distinction is crucial in sustainability analytics, where resilience and reproducibility are equally significant as peak efficiency. TMV-TSDEA directly addresses this imbalance by incorporating both dimensions into a unified, informatics-driven framework.
Although Figure 1 presents a simplified schematic, the TMV-TSDEA framework comprehensively integrates economic indicators (e.g., investment, population, tourism), environmental metrics (e.g., GPP, CO, O3, PM2.5), and external spatial-contextual variables such as communal forest coverage and cultivated land area to capture the multidimensional nature of regional sustainability. This framework processes data from 16 Thai provinces. These data layers are processed using a desirability function that is derived from recorded statistical values. This function standardizes heterogeneous metrics into a unified, informatics-ready format. Within a digital sustainability management context, the composite scores that are generated can be used to inform policy design, regional comparisons, and resource allocation.
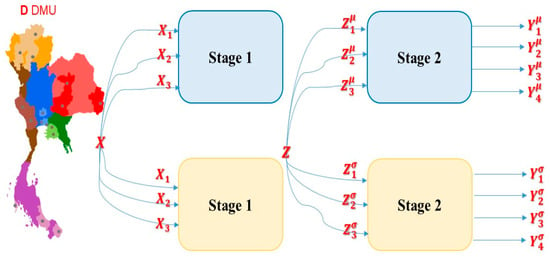
Figure 1.
Architecture of the TMV-TSDEA-based informatics framework for regional sustainability evaluation.
It is crucial to note that the proposed model is not solely a statistical technique; it is also a decision-support informatics instrument that can be integrated into regional planning systems or e-governance dashboards. Its extensibility and reproducibility render it appropriate for integration with smart city sustainability platforms, regional information portals, or geographic information systems (GIS). TMV-TSDEA contributes to the evolving science of informatics applied to environmental policy, public sector optimization, and sustainability evaluation by combining analytic rigor with digital decision infrastructure.
This paper is organized as follows: the subsequent section provides a comprehensive review of the current literature on two-stage DEA models and their evolving use in informatics applications. The TMV-TSDEA methodology is elaborated upon in Section 3, which encompasses data preparation, modeling phases, and performance transformation. The results and policy implications of the system are presented in Section 4, while the concluding section explores the system’s potential for integration with informatics platforms and future research directions.
2. Literature Review
The integration of data-driven frameworks and computational models is the foundation of informatics, a discipline that is characterized by its ability to interpret, manage, and optimize complex systems. In this context, Data Envelopment Analysis (DEA) has emerged as a valuable analytical method, providing a non-parametric approach to assessing the relative efficacy of decision-making units (DMUs) based on multi-input and multi-output configurations. DEA was initially developed for productivity assessment; however, it has since expanded to serve a wider range of informatics purposes, such as policy support, digital governance, and sustainability analytics.
The development of two-stage DEA models has been a significant contribution to DEA research. These models more effectively represent real-world systems that are characterized by sequential processes and intermediate variables. These models have been extensively implemented in various domains that are associated with informatics. For instance, Halkos and Argyropoulou [1] used a two-stage DEA with undesirable outputs to investigate the effects of health and air pollution, while Moutinho and Madaleno [2] integrated DEA with fractional regression to analyze the eco-efficiency of EU nations. Liu et al. [3] introduced a model for the allocation of CO2 emission quotas in China that is consistent with the informatics frameworks of Industry 4.0 and prioritizes environmental performance.
Gökgöz et al. [4] incorporated the Malmquist Productivity Index and DEA in financial informatics to assess the dynamic efficiency of Turkish banks. Chu et al. [5] employed two-stage network DEA to simulate scalability in production systems, while Ratner et al. [6] implemented DEA to optimize public investment in energy innovation—thereby illustrating the application of informatics in environmental governance.
The informativeness of DEA applications has been improved by a number of methodological innovations. The model introduced by Despotis et al. [7] was validated using automotive data and treats DMUs as both producers and consumers of intermediates. The evaluation of Ethiopian healthcare delivery by Lamesgen et al. [8] utilized output-oriented DEA with variable returns to scale, which revealed site-level performance disparities. Amirteimoori et al. [9] investigated the elasticity of scale in insurance processes, while Zhang et al. [10] developed a flexible priority model for two-stage systems to facilitate more adaptable informatics solutions.
DEA has also been integrated with clever informatics platforms and machine learning. Abdul Rashid et al. [11] assessed the efficacy of airlines by employing dynamic network DEA with innovation capital. DEA was employed by An et al. [12] to select classifiers in large datasets, incorporating ensemble learning. Afsharian et al. [13] suggested that contextual variables be used to make DEA corrections in the energy sector. Wu et al. [14] utilized DEA-Tobit models to assess the performance of smart tourism, while Teixeira et al. [15] established a correlation between consumer satisfaction and airport efficiency through a composite NDEA-AHP model.
The applicability of informatics analytics has been expanded by advanced methods, including meta-EBM and shared input DEA models. Using a two-stage EBM model, Huang et al. [16] investigated environmental stressors such as GDP and temperature. Through shared-input SBM-DEA, he and Zhu [17] evaluated pollution control. The effectiveness of industrial air pollution policies was assessed by Zhang et al. [18] through the use of a dynamic DEA model.
To further address the limitations of conventional DEA models in dynamic and uncertain environments, researchers have introduced several key methodological extensions. Window Analysis treats each time period as an independent DMU to detect performance trends. For example, de Oliveira et al. [19] applied it to Brazilian airports, while İlkaz and Çebi [20] and Pimentel and Mora-Monge [21] used it to assess insurance and hospital systems under policy shifts. The Malmquist Productivity Index (MPI) further extends DEA by quantifying productivity change, as seen in the studies by Adugna et al. [22], Ray [23], and Min et al. [24].
Bootstrapping increases DEA’s robustness by estimating confidence intervals, with applications in transport (Georgiadis et al. [25]), waste management (Salazar-Adams and Ramirez-Figueroa [26]), and economic resilience (Jakšić et al. [27]). Network DEA (NDEA) decomposes processes into interconnected stages, improving insight into internal structures (Despotis et al. [7]; Lou et al. [28]; Omid et al. [29]). Stochastic DEA separates inefficiency from random noise, enhancing accuracy in financial and environmental contexts (Amirteimoori et al. [30]; Wei et al. [31]; Amirteimoori et al. [32]). Dynamic DEA (DDEA) captures intertemporal dependencies, useful in long-term planning (Yin et al. [33]; Anouze et al. [34]; Hu et al. [35]; Perroni et al. [36]).
These studies collectively emphasize the potential of DEA to function as a fundamental element of informatics systems, with a particular emphasis on the modeling of efficiency, the monitoring of dynamic performance, and the facilitation of data-informed decision-making. Nevertheless, a prevalent limitation continues to exist: the majority of models concentrate exclusively on mean efficiency, neglecting performance stability, which is a critical concern in informatics systems where reliability and temporal consistency are essential. Most prior DEA-based studies implicitly assume that efficiency alone is sufficient for decision support. However, efficiency and stability are not interchangeable: efficiency reflects peak or average performance, whereas stability determines whether such performance can be sustained reliably. The absence of stability assessment in existing models creates a methodological blind spot, particularly in regional sustainability contexts where volatile results may undermine policy trustworthiness. TMV-TSDEA fills this gap by evaluating both dimensions concurrently. A diverse range of DEA variants has been applied across domains such as health, energy, tourism, and finance, often in conjunction with informatics tools to address dynamic and uncertain environments. Table 1 provides a consolidated summary of key studies, their application domains, and the DEA variants employed, highlighting the evolution of DEA in supporting complex decision analytics across sectors.

Table 1.
Summary of DEA methods and informatics applications.
To better contextualize prior research, existing DEA applications can be grouped into several methodological categories: two-stage models that represent sequential processes, temporal and dynamic extensions such as Window Analysis and the Malmquist Productivity Index, robustness-oriented approaches including bootstrapped and stochastic DEA, and hybrid or context-aware models that combine DEA with techniques such as AHP or machine learning. While these approaches have expanded DEA’s applicability, they share a common limitation: they emphasize efficiency, temporal change, or uncertainty, but do not explicitly integrate performance stability as a co-equal dimension.
In contrast to these prior studies, the proposed TMV-TSDEA framework advances DEA methodology by jointly evaluating mean efficiency and stability (variance), thereby addressing the critical gap of reproducibility and reliability in performance analysis. Furthermore, by embedding a desirability-based transformation, TMV-TSDEA enables heterogeneous economic and environmental indicators to be standardized and compared within a unified informatics-ready framework. This dual innovation distinguishes our study from existing approaches summarized in Table 1.
The Twin Mean-Variance DEA (TMV-DEA) approach is a novel contribution that arises to address this issue. TMV-DEA facilitates the development of decision frameworks that are more resilient and reproducible by assessing both the average efficiency and its variance. By increasing the decision readiness of analytics systems, accommodating variability, and enhancing interpretability, this dual-layered structure is consistent with the fundamental principles of informatics. Thus, TMV-DEA not only enhances the DEA methodology but also fortifies its position in informatics platforms that prioritize sustainability, governance, and intelligent resource management.
Although there have been numerous DEA extensions developed for two-stage systems and expectation-based analysis, these models primarily emphasize mean efficiency as the fundamental performance measure. For example, two-stage DEA models enable the sequential evaluation of inputs, intermediates, and outputs, while expectation-oriented DEA models capture average productivity under uncertainty. Nevertheless, these methods fail to explicitly consider performance stability, resulting in a methodological vacuum that is as critical as efficiency levels in the context of reliability and reproducibility.
This limitation is resolved by the proposed TMV-TSDEA, which integrates the advantages of two-stage DEA with a twin-dimensional perspective that assesses mean efficiency and variance (stability) concurrently. This innovation enables decision-makers to differentiate between units that are averagely efficient but unstable and those that achieve both consistency and effectiveness. Furthermore, the incorporation of a desirability-based transformation guarantees comparability among diverse economic and environmental indicators, a feature that is seldom included in previous DEA frameworks. The TMV-TSDEA model is distinguished from the extant two-stage and expectation DEA models by these innovations, which collectively provide a more robust and policy-relevant evaluation tool for regional sustainability.
3. Research Methods
This study addresses Thailand’s dual challenge of environmental sustainability and economic development through an informatics-driven regional assessment framework. In response to rapid industrial growth and environmental pressures, a digital methodology was developed integrating Twin Mean-Variance Two-Stage Data Envelopment Analysis (TMV-TSDEA), desirability functions, and coded-value transformation. This informatics architecture supports reproducible, data-driven evaluation of provincial economic and environmental performance, including both efficiency and stability, using structured multi-source datasets and decision analytics logic. The analysis begins with a nationwide screening of 77 provinces using the Simple Additive Weighting (SAW) method based on normalized indicators—population, investment, and tourism. A diverse subset of 16 provinces is selected for in-depth modeling via the novel two-stage TMV-TSDEA process. The first stage evaluates economic inputs and intermediate outputs (e.g., electricity use, vehicle density), while the second assesses environmental outcomes such as air quality and Gross Provincial Product, incorporating contextual variables like forest coverage and renewable energy adoption. The model offers a scalable decision-support tool for smart regional planning, sustainability governance, and policy prioritization.
The selection of economic and environmental indicators in the TMV-TSDEA framework is grounded in established theoretical and empirical foundations. Economic indicators such as investment, population, and tourism were chosen to reflect regional resource endowment and development potential, consistent with prior DEA-based sustainability assessments that emphasize socio-economic capacity as a determinant of performance (e.g., Halkos & Argyropoulou [1]; Moutinho & Madaleno [2]). Intermediate indicators—electricity use, industrial output, and vehicle density—capture energy consumption patterns and production intensity, reflecting the well-documented link between industrialization and environmental pressure in sustainability informatics (e.g., Liu et al. [3]; Ratner et al. [6]).
For the environmental dimension, air quality variables including CO, O3, and PM2.5 were selected as internationally recognized pollution measures directly associated with public health and ecological impact, aligning with studies that integrate undesirable outputs into DEA-based evaluations (e.g., Halkos & Argyropoulou [1]; Huang et al. [16]). Contextual variables such as forest coverage and cultivated land area draw on ecological economics principles, where ecosystem services and land-use intensity influence long-term sustainability outcomes. This is consistent with approaches that incorporate spatial or environmental context into DEA frameworks (e.g., Afsharian et al. [13]; Lou et al. [28]). Together, these indicators ensure transparency, comparability, and robustness in capturing the multidimensional nature of regional sustainability performance.
3.1. Simple Additive Weighting (SAW)
The study utilizes the Simple Additive Weighting (SAW) technique as a multi-criteria decision-making method to screen Thai provinces in order to commence the informatics-based regional performance assessment. Due to its computational simplicity and capacity to incorporate heterogeneous data into a composite performance index, SAW is well-suited for this stage. It functions as the initial stratum of the broader informatics framework, facilitating the systematic prioritization of regions based on key indicators that are in alignment with the potential for sustainable development and economic vitality.
The evaluation of provinces is conducted using normalized performance metrics, which include population, investment level, and tourist arrivals. Each criterion is weighted based on its relative impact on regional development, with weights determined through expert judgment in consultation with domain specialists and regional planners. The integrity of inter-regional comparisons is preserved by the normalization, which guarantees scale invariance across indicators. The composite scores that are generated facilitate the transparent evaluation and informed selection of high-potential regions. This digital preselection phase reduces the initial cohort of 29 provinces to 16 Decision-Making Units (DMUs), guaranteeing that all main regions (central, northern, southern, northeastern, eastern, and western) are represented.
The SAW-based selection process is characterized by objectivity and reproducibility, which are essential characteristics of informatics-driven planning systems. This step guarantees that subsequent analyses employing TMV-TSDEA are based on a representative and strategically pertinent subset of the national landscape by emphasizing provinces that demonstrate robust signals in both economic and environmental dimensions. Thus, the SAW method serves as a foundational component of a scalable decision-support system for regional informatics and sustainability governance, in addition to serving as a filtration mechanism.
3.2. Desirability Function Approach (DFA)
The Desirability Function Approach (DFA) is essential for the seamless integration of heterogeneous performance metrics into a unified, informatics-compatible scale, thereby facilitating the TMV-TSDEA framework. DFA, which was initially developed for industrial process optimization, is well-suited for informatics applications as a result of its capacity to normalize a variety of indicators and accommodate decision-makers’ preferences through parameterized scoring functions.
In this investigation, DFA transforms basic input, intermediate, and output variables into dimensionless scores that range from 0 (least desirable) to 1 (most desirable). A transformation function is assigned to each variable based on its policy relevance. Variables with optimal target ranges are labeled “Nominal-the-Best” (NTB, Equation (1)). For variables such as Gross Provincial Product and renewable energy use, the transformation function is “Larger-the-Better” (LTB, Equation (2)), while pollutants like CO, O3, and PM2.5 are assigned “Smaller-the-Better” (STB, Equation (3)). This allows for a meaningful comparison of variables with varying units, distributions, and policy implications.
where represent the input or output of the DMUs, desirability value, lower limit, upper limit, and target of the input or output of the DMUs, respectively. Meanwhile, , , and are desirability function power level specified by the decision-maker.
Moreover, the DFA model incorporates user-defined power levels (exponents) to represent the relative importance or sensitivity of each metric. These weights enable scenario-based modeling and flexible performance prioritization by incorporating expert judgment into the informatics pipeline. The composite performance indices for each DMU are formed by aggregating the desirability scores using a weighted geometric mean, thereby ensuring that they are consistent with the principles of decision analytics.
The allotment of power weights was determined through a combination of theoretical reasoning and consultation with domain experts. To reflect their relative influence on regional development, economic indicators were weighted at 1.2, 1.0, and 0.8, in accordance with multi-criteria decision-making principles that prioritize more significant factors. In accordance with the literature that emphasizes the central role of economic output and pollution management in sustainable growth, environmental indicators such as GPP, CO, O3, and PM2.5 were assigned higher weights (ranging from 1.5 to 2.25) to prioritize sustainability outcomes. This weighting scheme guarantees that the desirability transformation is not arbitrary, but rather consistent with empirical significance and policy relevance.
3.3. Data Envelopment Analysis (DEA) and Its Variants
Data Envelopment Analysis (DEA) is a non-parametric technique that is widely recognized and employed to assess the relative efficacy of decision-making units (DMUs) that convert multiple inputs into multiple outputs. DEA, which was first introduced by Charnes, Cooper, and Rhodes in 1978, establishes an empirical efficiency frontier by employing the most efficient DMUs as benchmarks for comparative performance analysis. The optimal efficiency is indicated by a score of 1, which is determined by the ratio of weighted outputs to weighted inputs. DEA’s model-free structure is one of its most significant advantages, as it does not necessitate a predefined functional form. This makes it particularly well-suited for deployment in data-driven informatics systems that depend on heterogeneous and frequently non-linear data relationships. Consequently, DEA has been implemented in a variety of sectors, including finance, education, healthcare, and, more recently, informatics-centric disciplines like sustainable energy analytics, digital health systems, and smart infrastructure.
The complexity of digital ecosystems has been more effectively accommodated by the extension of DEA through various methodological innovations in the ever-changing field of informatics. Window Analysis is advantageous in longitudinal informatics platforms because it facilitates temporal analysis by assessing DMU performance across numerous time segments. The Malmquist Productivity Index (MPI) is a tool that facilitates the identification of trends in dynamic environments, such as e-governance or digital service delivery, by decomposing performance into technological and efficiency change [31]. Bootstrapped DEA is a critical feature in informatics systems that require decision confidence and uncertainty quantification, as it improves statistical credibility. Network DEA (NDEA) facilitates system-level diagnostics in modular or layered ICT architectures by disaggregating performance across sub-processes. Stochastic DEA and Dynamic DEA (DDEA) introduce robustness to randomness and time-linkages, which are commonly found in informatics applications and correlate with real-time decision-making and digital feedback loops.
These DEA variants frequently prioritize efficiency in isolation, disregarding the variability of performance over time, despite their strengths. This is a critical concern in informatics systems, which must ensure stability, reproducibility, and resilience. The Twin Mean-Variance DEA (TMV-DEA) model offers an advanced informatics-oriented solution that simultaneously addresses efficiency and performance stability. TMV-DEA assesses the mean efficiency and the variance (i.e., stability) of DMUs in multiple observations or contexts. This twin-layered structure allows for a more nuanced interpretation of performance, distinguishing units that are consistently reliable and not only efficient on average. Therefore, TMV-DEA improves decision-support systems within informatics platforms by providing thorough insights into strategic planning under uncertainty, algorithm benchmarking, policy design, and resource optimization.
4. Informatics-Enabled Twin Mean-Variance DEA (TMV-DEA) Framework
4.1. Conceptual Framework of the Informatics-Enabled TMV-DEA
The Twin Mean-Variance Data Envelopment Analysis (TMV-DEA) model is a performance evaluation advancement that is informatics-oriented, as it simultaneously captures the efficacy and stability of Decision-Making Units (DMUs). Traditional DEA models predominantly evaluate mean efficiency, which is the degree to which a DMU converts inputs into outputs under ordinary conditions. Although beneficial, this one-dimensional approach fails to address a critical informatics requirement: performance consistency across multiple scenarios or over time. Stochastic variability and fluctuations are inevitable in environments that are data-rich and dynamic, such as digital health platforms, smart municipal systems, and algorithmic optimization. TMV-DEA addresses this lacuna by introducing a dual-dimensional evaluation framework that integrates both average performance and variance to provide a more robust and actionable assessment.
Tools that enable continuous monitoring and stability-aware decision-making are frequently necessary for informatics systems, as they often require more than just transient assessments. TMV-DEA fulfills this requirement by producing two distinct performance metrics: mean efficiency and performance variance. These dimensions enable system architects, planners, and policymakers to differentiate between units that are highly efficient but unstable and those that produce consistent, sustainable results. This is particularly important in disciplines such as algorithm optimization, where metaheuristics like simulated annealing or genetic algorithms can produce variable results even under controlled input conditions. TMV-DEA is an optimal choice for algorithm benchmarking, reliability analysis, and reproducibility auditing, as it not only quantifies average efficiency but also assesses consistency across iterations.
Although Window Analysis, MPI, Bootstrapped DEA, and Stochastic DEA are existing DEA variants that address specific analytic concerns, such as time dynamics or uncertainty, they do not explicitly characterize stability. A comprehensive solution for environments where sustained performance is as critical as peak efficiency is provided by TMV-DEA, which bridges this divide. TMV-DEA is a strategic component in integrated decision-support systems due to its computational compatibility with existing informatics platforms and flexibility. TMV-DEA improves strategic foresight, system reliability, and interpretability in a variety of settings, including real-time monitoring interfaces, digital twin environments, and sustainability evaluation platforms.
4.2. Informatics-Enabled TMV-DEA Sequential Procedures
The Twin Mean-Variance Data Envelopment Analysis (TMV-DEA) framework enhances traditional DEA by embedding dual-layered insights—mean efficiency and performance stability—into informatics-driven performance assessments. To improve clarity and reproducibility, the procedure is now presented in a step-by-step sequence, as summarized in Figure 2.
4.2.1. Data Collection
Gather input (X), intermediate (Z), and output (Y) data for each Decision-Making Unit (DMU) across multiple time periods or scenarios. Inputs are assumed fixed, while outputs and intermediates may vary.
4.2.2. Mean Calculation
Compute the mean values of all intermediates and outputs to evaluate the average performance of each DMU.
4.2.3. Variance Calculation
Compute the standard deviations of the same variables to capture stability (or variability) across periods.
4.2.4. Efficiency Evaluation
Apply a CCR-based DEA model to the mean values to obtain the mean efficiency score (θ) for each DMU.
4.2.5. Stability Evaluation
Apply a complementary DEA model using standard deviation values to derive the stability score (σ), which reflects reliability.
4.2.6. Integration of Scores
Combine θ and σ through a weighted synthesis function to produce a twin-dimensional performance measure.
4.2.7. Decision-Ready Output
Present the results in dashboards or reports, enabling policymakers to distinguish between DMUs that are efficient but unstable and those that balance efficiency with consistency.
Figure 2 provides a visual flow of these sequential steps, showing how data move from collection and transformation to the dual DEA models and, finally, to integrated decision-ready results.
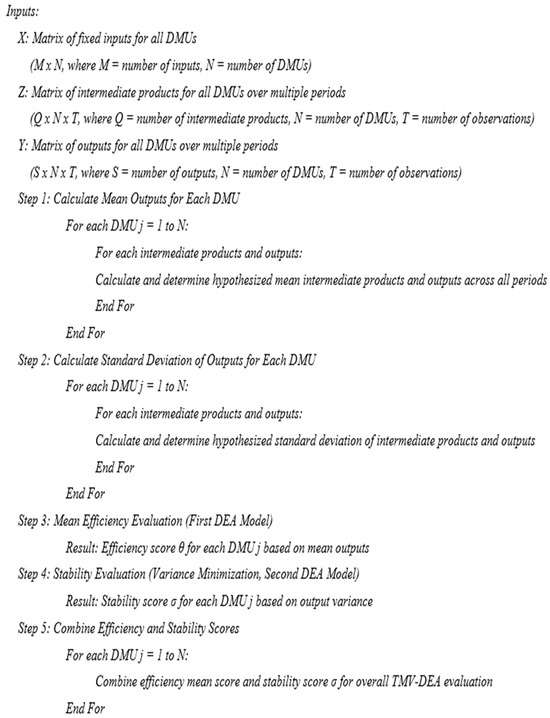
Figure 2.
Sequential procedures of the Informatics-Enabled TMV-DEA.
4.3. Evaluating Provincial Sustainability Performance Using TMV-TSDEA
The Twin Mean-Variance Two-Stage Data Envelopment Analysis (TMV-TSDEA) framework introduces an informatics-enhanced methodology for evaluating the multi-dimensional performance of Decision-Making Units (DMUs), particularly within regional sustainability and policy analytics contexts. TMV-TSDEA integrates economic and environmental performance metrics, transforming heterogeneous data into decision-ready insights through a structured, two-stage model that supports data normalization, variance awareness, and benchmarking.
In the first stage, TMV-TSDEA focuses on economic efficiency assessment, evaluating how effectively provinces transform core economic inputs—such as investment, population, and tourism—into key outputs including Gross Provincial Product (GPP) and environmental co-benefits like improved air quality (CO, O3, PM2.5). This stage models performance using linear programming to define an empirical frontier of best-performing provinces. DMUs on the frontier are recognized as efficiency leaders, while those below the frontier represent areas with improvement potential.
The second stage shifts to environmental sustainability assessment, analyzing the provinces’ ability to manage intermediate outputs (e.g., electricity use, manufacturing activity, and vehicle density) in producing favorable environmental outcomes. This stage incorporates additional external variables—such as normalized community forest coverage and cultivated land area—to enrich the analysis with spatial and ecological context. Together, these two stages form a robust informatics framework that accounts for both operational output and contextual sustainability dynamics.
A distinguishing innovation of the TMV-TSDEA framework is its application of statistical transformations, including T-tests and chi-square tests, to normalize natural data values. These are integrated into a Desirability Function Approach (DFA) to code and scale inputs, intermediates, and outputs. This method ensures comparability across variables and supports the integration of decision-maker preferences through adjustable power values. The use of both CCR and BCC DEA models, alongside these normalized inputs, enhances the precision and reproducibility of the efficiency scores.
The informatics strength of TMV-TSDEA lies in its ability to provide granular insights for regional planning and smart governance. High-performing provinces are identified as sustainability leaders, while underperforming regions are flagged for targeted support or policy intervention. This dual-stage evaluation enables evidence-based prioritization of resource allocation, investment, and regulation, thereby contributing to resilient and balanced regional development strategies. TMV-TSDEA’s architecture is well suited for integration into informatics platforms such as geographic dashboards, sustainability indices, and policy simulation environments. To illustrate the complete methodology, a comprehensive flowchart is provided in Figure 3.
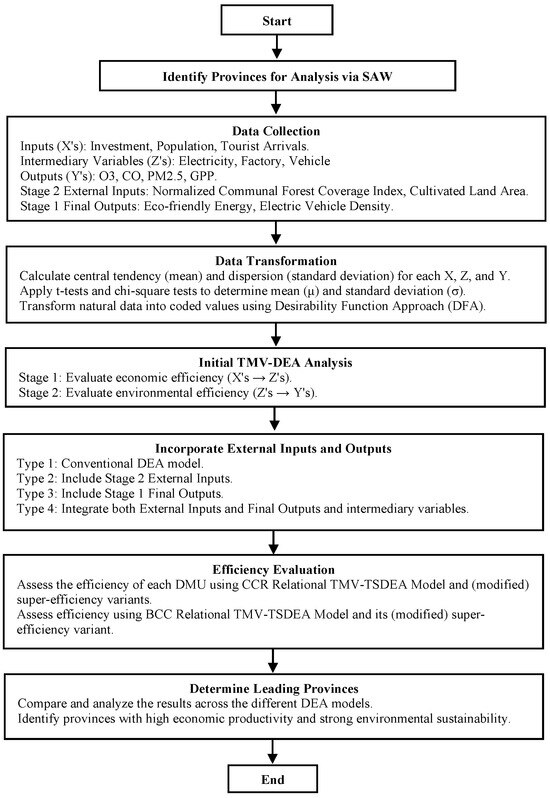
Figure 3.
Informatics-Enabled TMV-TSDEA flowchart on the complexity and innovation in sustainability. The flowchart illustrates the overall process, including input and contextual data selection, desirability-based transformation, the two-stage DEA modeling (mean and variance), and the generation of composite performance scores for regional sustainability evaluation.
By integrating Stage 2 external inputs with Stage 1 final outputs, the TMV-TSDEA framework enables a nuanced, informatics-driven evaluation of regional performance in terms of both efficiency and sustainability. The incorporation of environmental and land-based variables—such as the Normalized Communal Forest Coverage Index (NCFCI) and Cultivated Land Area (CLA)—adds spatial and ecological context to the analysis, enhancing its explanatory power within smart governance and sustainability informatics platforms. The NCFCI serves as a proxy for ecosystem health, with higher values reflecting stronger forest conservation efforts and greater alignment with regional environmental goals. In parallel, CLA reflects land resource utilization patterns, offering insight into how agricultural practices contribute to economic output and ecological impact.
The model’s final output variables—such as eco-friendly energy usage and electric vehicle (EV) density—function as forward-looking sustainability indicators, capturing regional efforts to reduce carbon intensity and transition toward cleaner technologies. By systematically comparing these outputs with their contextual inputs (NCFCI and CLA), the TMV-TSDEA framework supports a holistic performance assessment that recognizes the interconnectedness of environmental stewardship and development outcomes. This informatics-enhanced perspective facilitates the simulation of regional sustainability scenarios through four distinct environmental process models, enabling decision-makers to analyze performance across a range of ecological and economic configurations.
The TMV-TSDEA framework is classified into four structural types in order to reflect the different ways inputs, intermediates, outputs, and contextual variables interact in real-world systems. This classification ensures that the methodology can be flexibly adapted to diverse sustainability and decision-support contexts. Type I (Baseline Configuration) represents the standard two-stage structure, where inputs are transformed into intermediates and then into final outputs; this is most appropriate for systems with clearly sequential production processes. Type II (Context-Enriched Configuration) extends this structure by including external contextual inputs—such as forest coverage or cultivated land—in Stage 2, thereby enabling environmental and spatial factors to be explicitly incorporated.
Type III (Partial Output-Releasing Configuration) allows Stage 1 to produce both intermediates and final outputs, mirroring situations where immediate deliverables coexist with long-term outcomes, such as in logistics or service systems. Type IV (Fully Integrated Multi-Input Configuration) combines the features of Type II and Type III by simultaneously allowing contextual inputs and partial direct outputs, making it the most comprehensive model for complex systems. This configuration is particularly useful for integrated urban development, circular economy systems, and sustainability platforms where economic, environmental, and spatial variables must be jointly considered. Collectively, these four types ensure that TMV-TSDEA can be applied across a spectrum of policy, planning, and informatics environments, from simple sequential chains to multi-dimensional governance systems.
4.3.1. Type I: Baseline Configuration of the Informatics-Enabled TMV-TSDEA (TMV-TSDEA_Type_I)
The Type I structure of the Informatics-Enabled TMV-TSDEA represents the foundational two-stage process model, characterized by a linear transformation pathway from inputs (X) to outputs (Y) via intermediate variables (Z). This configuration serves as a baseline for system evaluation, suitable for applications where process flows are well-defined and stage boundaries are clearly distinguishable.
In this model, Stage 1 receives external inputs (e.g., investment, population, tourism) and produces intermediate outputs (e.g., electricity use, manufacturing output, vehicle density). These intermediates serve as direct inputs to Stage 2, which generates final outputs such as eco-friendly energy usage and electric vehicle density. Each stage is independently assessed using DEA to compute stage-specific efficiency scores: the Stage 1 efficiency is calculated as the ratio of intermediate outputs to original inputs, while the Stage 2 efficiency is derived from the ratio of final outputs to intermediate values.
The overall system efficiency is computed by relating final outputs directly to initial inputs, allowing decision-makers to trace the cumulative transformation efficiency across the entire process. This structure is particularly advantageous in informatics applications requiring clear attribution of performance outcomes to sequential resource transformations. TMV-TSDEA_Type_I thus provides a transparent and interpretable framework for benchmarking basic two-stage systems in environmental sustainability, resource planning, and digital policy evaluation contexts.
4.3.2. Type II: Context-Enriched Configuration of the Informatics-Enabled TMV-TSDEA (TMV-TSDEA_Type_II)
The TMV-TSDEA_Type II structure extends the baseline Type I model by introducing external contextual inputs directly into Stage 2. In this configuration, the second stage of the process is influenced not only by the intermediate outputs (Z) generated from Stage 1 but also by additional external environmental and spatial indicators—notably the Normalized Communal Forest Coverage Index (NCFCI) and Cultivated Land Area (CLA). These variables reflect ecological health and land-use intensity, making the model particularly suited for sustainability informatics and regional planning applications.
This multi-input design mirrors real-world systems where downstream processes require supplementary resources that are not directly derived from upstream stages. As a result, Stage 1 efficiency is calculated identically to Type I (intermediates per unit of initial input), while Stage 2 efficiency now depends on both intermediate measures and these Stage 2-specific external inputs. The inclusion of such auxiliary data necessitates a more nuanced approach to calculating overall system efficiency, incorporating not only input-output conversion but also the role of environmental or structural conditions in shaping final outcomes.
The TMV-TSDEA_Type II model emphasizes the value of contextual resource integration, allowing analysts and policymakers to better understand how additional land, ecological, or institutional assets contribute to sustainability performance. This informatics-enhanced configuration is ideal for use in environmental monitoring systems, smart agriculture evaluations, or regional policy simulations where external variables materially influence output generation and performance outcomes.
4.3.3. Type III: Partial Output-Releasing Configuration of the Informatics-Enabled TMV-TSDEA (TMV-TSDEA_Type_III)
The TMV-TSDEA_Type III structure introduces a variation in the flow of outputs by allowing the first stage to generate not only intermediate products (Z) for Stage 2 but also independent outputs that exit the system directly after Stage 1. This configuration reflects real-world scenarios where certain outputs—such as immediate economic gains or administrative deliverables—are finalized after initial processing and do not contribute to downstream operations.
From an informatics perspective, this structure is particularly useful for modeling hybrid systems where multi-stage processes produce both immediate and deferred outcomes. Stage 1 efficiency is calculated based on both the production of intermediate and final outputs using initial inputs, while Stage 2 continues to evaluate how the remaining intermediates are transformed—typically into environmental or sustainability-focused outputs. TMV-TSDEA_Type III enables a differentiated analysis of short-term deliverables versus long-term strategic outcomes, supporting nuanced assessments in smart city operations, logistics, or public service systems.
4.3.4. Type IV: Fully Integrated Multi-Input Configuration of the Informatics-Enabled TMV-TSDEA (TMV-TSDEA_Type_IV)
The TMV-TSDEA_Type IV structure is the most comprehensive and flexible configuration within the TMV-TSDEA framework. It integrates features from both Type II and Type III by enabling Stage 1 to produce both intermediate measures (Z) and immediate outputs, while Stage 2 simultaneously incorporates external contextual inputs (e.g., NCFCI, CLA) alongside the intermediates. This structure models complex, interdependent systems where multiple input and output streams interact across process boundaries.
In this configuration, Stage 1 efficiency accounts for the dual production of outputs and intermediates from external inputs. Stage 2 efficiency evaluates how the intermediates, combined with Stage 2-specific external inputs, are converted into final sustainability metrics. The overall system efficiency is derived from aggregating the performance of both stages, factoring in the interplay between short-term outputs, long-term impacts, and environmental or infrastructural enablers.
TMV-TSDEA_Type IV is particularly applicable in multi-sector informatics applications—such as integrated urban development, circular economy systems, and regional sustainability platforms—where economic, environmental, and spatial data must be evaluated holistically. This structure supports advanced decision-support modeling and simulation (Figure 4), enabling a fully contextualized understanding of systemic efficiency and resilience.
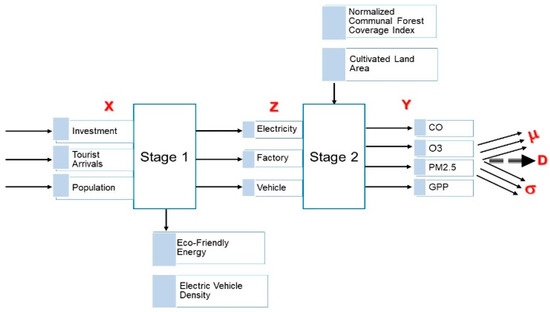
Figure 4.
Informatics-Enabled TMV-TSDEA_Type IV for ranking sustainable regional leaders.
The efficacy of all DMUs is evaluated by the TMV-TSDEA model, which employs a relational structure of the CCR based on the mean desirability function level as defined by Equations (4) and (5), to analyze the inputs and outputs at each stage of the process. For all decision-making units (DMUs), denoted as DMUj, where j = 1, 2, …, n, the conventional DEA model measures the efficiency of the kth DMU under the CRS assumption. Each DMU utilizes m inputs , where i = 1, 2, …, m, to produce s outputs , where r = 1, 2, …, s. In the case of a two-stage production process, it is further assumed that there are q intermediate products , where p = 1, 2, …, q, that are produced in the first stage and consumed in the second stage. is the relative efficiency of DMUk based on the mean desirability function () and ε is a small non-Archimedean number.
However, if the standard deviation were to be used instead, the standard deviation (σ) could replace the mean, offering an alternative perspective that emphasizes the consistency of the DMUs’ performance rather than just the average efficiency. Within the framework of a desirability function, this analysis encompasses two critical responses—mean and standard deviation—that ultimately result in an aggregate desirability function level. The inputs and outputs of each stage are examined in order to conduct efficiency calculations for each k-th DMU.
The optimization of multipliers is the means by which the efficiencies of both phases and the overall process are obtained when intermediate products are involved. This leads to a composite efficiency measure that represents the cumulative efficiency of the individual stages. It is crucial to acknowledge that the optimal multipliers employed in these calculations may not be distinctive, which could result in a variety of decompositions of the overall efficiency. This inherent non-uniqueness entails that there are multiple sets of optimal multipliers that can produce the same overall efficiency, thereby allowing for varying interpretations of the efficiency distribution across the stages. As a result, the interpretation of the efficiency scores must consider the possibility of multiple valid decompositions, underscoring the complexity and nuance of efficiency measurement within the TMV-TSDEA model.
Equations (4) and (5) define the desirability-based transformation used to compute the input and output values for the DEA models. Specifically, Equation (4) captures the mean desirability score μ, which represents the average performance of each DMU after normalization. Each original variable—whether input, intermediate, or output—is transformed using a desirability function that maps raw values into a standardized 0–1 scale. This allows for aggregation of heterogeneous indicators (e.g., GPP in baht vs. PM2.5 in µg/m3) into a unified evaluation framework.
Equation (5) extends this by incorporating multiple variables with different importance levels. The geometric mean form ensures that poor performance in even one variable substantially affects the overall score, aligning with the principle that sustainability requires balance across dimensions. Together, these equations serve as a bridge between raw statistical data and DEA inputs, enabling a consistent, preference-adjusted, and scale-free assessment of performance across all provinces. Without this transformation, meaningful comparison of diverse economic and environmental indicators would not be feasible.
In the BCC-based TMV-TSDEA model, weights assigned to Decision-Making Units (DMUs) are applied consistently across all relevant constraints related to input variables, with the exception of , which may be adjusted to accommodate specific structural or relational characteristics inherent to the model. This flexibility ensures that the DEA formulation can be adapted to reflect domain-specific priorities or architectural nuances—particularly relevant in informatics applications where data flows, stakeholder preferences, or resource hierarchies may require differentiated treatment.
The TMV-TSDEA framework incorporating super-efficiency (SE) extends the model’s evaluative capacity by dividing the assessment into two core dimensions: economic production and environmental sustainability. To account for potential inefficiencies and allow for more flexible optimization, the model incorporates input and output relaxation variables. Θ is a super-efficiency value. The variables and represent the input slack variables, which capture the extent to which inputs can be reduced without affecting output levels. Similarly, and denote the output slack variables, reflecting the potential for increasing the intermediate or final outputs without requiring additional inputs. These slack variables are essential for identifying not only whether a DMU is efficient but also by how much it can improve its performance. Their inclusion helps refine efficiency measurement beyond the radial projections used in traditional DEA models. In the first stage (Equation (6)), the model evaluates how effectively each DMU transforms economic inputs into measurable outputs such as investment return or gross provincial product. In the second stage (Equation (7)), it assesses the DMU’s ability to manage environmental consequences relative to its economic activity, using indicators like CO, O3, and PM2.5. Together, these stages yield a comprehensive view of a DMU’s ability to balance economic growth with environmental responsibility. The application of super-efficiency logic highlights not only efficient performers but also those that significantly exceed the frontier, enabling ranking beyond the conventional DEA boundary.
For the first stage:
For the second stage:
For CCR SE Relational TMV-TSDEA append nothing.
- For BCC SE Relational TMV-TSDEA append
Additionally, the modified super-efficiency BCC model strengthens the discriminatory power of the analysis by addressing feasibility issues under variable returns to scale (VRS)—a frequent consideration in complex systems with non-linear production relationships. By refining efficiency bounds and accounting for scale sensitivity, this approach delivers a more robust and granular performance evaluation. It is particularly advantageous in informatics environments involving adaptive systems, resource constraints, or evolving policy thresholds, where conventional models may fail to adequately differentiate among top-performing units (Equations (8) and (9)).
This analysis applies the mean-based desirability function to evaluate average efficiency across Decision-Making Units (DMUs). Alternatively, the standard deviation-based desirability function (σ) may be used in place of the mean to emphasize performance consistency. This substitution provides a complementary perspective, particularly relevant in informatics contexts where output stability and reliability are as critical as overall efficiency.
5. Results and Discussion
5.1. Selection and Representation of Decision-Making Units (DMUs)
The numerical analysis begins with the selection of 16 Decision-Making Units (DMUs), each corresponding to a province in Thailand. The selection process employs the Simple Additive Weighting (SAW) method, which ensures balanced geographic representation across the country—specifically, three provinces each from the central, northern, southern, and northeastern regions, and two from both the western and eastern regions. This approach supports a comprehensive evaluation by capturing economic and environmental diversity across regional contexts. By incorporating provinces from varying geographic and development profiles, the assessment aligns with the complexity and granularity required in sustainability informatics.
Following the selection, the TMV-TSDEA (Twin Mean-Variance Two-Stage Data Envelopment Analysis) model is applied to evaluate provincial performance using a multi-stage efficiency framework. The first stage focuses on economic efficiency, evaluating inputs such as investment, population, and tourist arrivals in relation to intermediary variables including electricity consumption, industrial output, and vehicle density. The resulting outputs consist of both economic indicators—such as gross provincial product (GPP)—and environmental metrics including CO, O3, and PM2.5 levels. The second stage incorporates external environmental and spatial inputs—namely the normalized communal forest coverage index and cultivated land area—along with final sustainability-oriented outputs such as eco-friendly energy usage and electric vehicle density. This structure captures interdependencies between economic activity and environmental sustainability, reflecting a key principle of open innovation and data-informed governance.
The analysis is based on five years of observed data, from which both mean values (central tendency) and standard deviations (variability) are calculated for each input and output variable. These statistical characteristics are further transformed into coded performance scores using desirability functions. The resulting desirability indices reflect both the level and consistency of each province’s performance, enabling the generation of composite scores for integrated evaluation. TMV-TSDEA models are deployed using both CCR and BCC configurations, including their super-efficiency extensions, to provide a comprehensive assessment of each province’s relative performance.
The SAW method is instrumental in the initial filtering and prioritization of provinces. A total of 29 candidates with complete datasets for core economic indicators were initially considered. SAW aggregates normalized scores for investment, population, and tourism using weighted preferences, facilitating a transparent and replicable ranking process. The final set of 16 DMUs includes prominent economic centers such as Bangkok, Chonburi, and Rayong, as well as strategic tourism-driven provinces like Phuket and Chiang Mai. This selection provides a representative cross-section of Thailand’s regional landscape, enabling nuanced performance comparisons and supporting informed policy formulation in regional sustainability planning.
5.2. Performance Evaluation Using TMV-TSDEA Models
To enhance model precision and comparability, the TMV-TSDEA framework applies Desirability Function Analysis (DFA) to transform the input (X), intermediate (Z), and output (Y) variables. This transformation optimizes scale alignment and embeds relative performance priorities within the modeling process. Input variables—namely investment, population, and tourist arrivals—are assigned power weights of 1.2, 1.0, and 0.8, respectively, to reflect their differentiated influence on regional development. Intermediate variables, including electricity consumption, factory output, and vehicle density, are each assigned a neutral power level of 1.0, preserving equal contribution across the production process.
The model assigns higher importance to output variables, reflecting their strategic significance in assessing sustainability and innovation. Specifically, ozone (O3), carbon monoxide (CO), PM2.5, and gross provincial product (GPP) are assigned power weights of 1.7, 1.5, 1.9, and 2.25, respectively, within the desirability function. This prioritization reinforces the framework’s emphasis on both environmental impact and economic performance as dual pillars of regional sustainability.
In the second stage, external inputs—including the normalized communal forest coverage index (NCFCI) and cultivated land area (CLA)—are assigned power values of 1.5 and 1.2, respectively. Final sustainability outputs, such as eco-friendly energy usage and electric vehicle density, are given lower but differentiated weights of 0.7 and 0.5, reflecting their status as emerging indicators of technological adoption and policy effectiveness. This weighted transformation supports a complexity-informed approach by integrating ecological, infrastructural, and innovation-oriented metrics into a cohesive performance evaluation.
5.3. DEA Configurations and Comparative Efficiency Analysis
The study applies both CCR and BCC DEA models, including their super-efficiency variants, to evaluate the 16 selected DMUs. Results are analyzed across four TMV-TSDEA configurations (Types I–IV), which represent different ways of structuring inputs, intermediate variables, and outputs. Each configuration uses transformed data to compute three key metrics: mean efficiency, standard deviation (stability), and overall desirability (D). Figure 5, a Pareto chart, highlights the relative contribution of each DMU to performance variation within the TMV-TSDEA framework. Provinces with longer bars contribute more significantly to observed differences in sustainability performance, helping prioritize policy focus. Table 2 presents ANOVA results assessing the significance of DMU effects and model type (CCR vs. BCC) on overall performance scores. The DMU effect is statistically significant (F = 22.07, p < 0.001), indicating meaningful performance differences across provinces. In contrast, the model type (TMV-TSDEA) does not have a statistically significant effect (F = 0.14, p = 0.713), suggesting robustness of the framework to the choice of DEA variant. Together, the chart and table confirm that regional performance varies substantially among provinces, while the overall modeling framework remains consistent and reliable across DEA variants.”
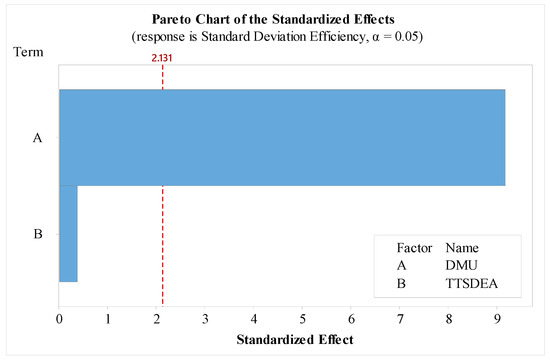
Figure 5.
Pareto chart illustrating significant DMU effects within the TMV-TSDEA evaluation framework.

Table 2.
ANOVA results for randomized block design assessing DMU and DEA variant effects within the TMV-TSDEA framework.
5.4. Interpretation of Provincial Rankings
The evaluation of provincial rankings across the CCR and BCC models and all TMV-TSDEA structure types reveals key insights into the efficiency and performance dynamics of Thailand’s provinces. Bangkok and Samut Prakan consistently rank among the top-performing DMUs in nearly all configurations, particularly under the BCC model, highlighting their strong ability to convert inputs into desirable outcomes under variable returns to scale. Lampang and Ayutthaya also demonstrate notable efficiency, with Ayutthaya achieving especially strong results in Type II and Type IV structures under the CCR model, which assumes constant returns to scale.
Figure 6 presents the DMU efficiency rankings across TMV-TSDEA models using the super-efficiency BCC approach. As illustrated in the figure, Nakhon Ratchasima consistently ranks at the bottom across all model types, highlighting persistent inefficiencies in both economic productivity and environmental performance. This structural underperformance suggests a need for immediate policy attention and targeted intervention. Similarly, Songkhla also ranks low in most model configurations, reflecting systemic challenges that inhibit its sustainable development potential.
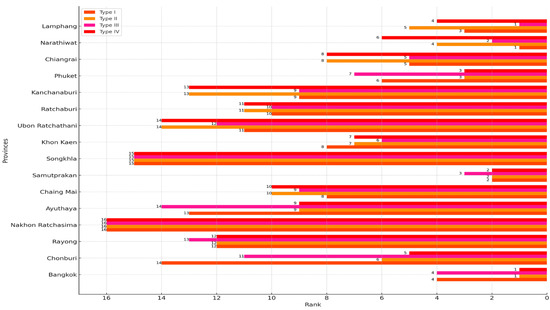
Figure 6.
DMU efficiency rankings across TMV-TSDEA models using the super-efficiency BCC approach.
Some provinces display mixed performance depending on the model and structural type. For instance, Narathiwat ranks relatively high in Type I and Type IV under the BCC model, indicating localized strengths or favorable returns to scale in specific configurations, but its inconsistency across types suggests performance volatility. Chonburi, Rayong, and Phuket show moderate efficiency with fluctuations across model types, signaling untapped potential and room for improvement in optimizing resource allocation and environmental outcomes.
These findings collectively highlight the strategic value of TMV-TSDEA in identifying both high-performing and underperforming regions. The results suggest that while provinces like Bangkok and Samut Prakan serve as benchmarks for balanced, stable efficiency, others—such as Nakhon Ratchasima and Songkhla—require focused investment and policy reform to enhance their sustainability profiles. This comparative analysis offers a valuable foundation for provincial governments to refine development strategies aimed at simultaneously advancing economic productivity and environmental responsibility.
The standard deviation (Stdev) metric within the TMV-TSDEA framework offers critical insights into the consistency and reliability of provincial performance. This measure complements mean efficiency by revealing whether outcomes are stable or prone to volatility. For instance, Bangkok exhibits low standard deviation values across most TMV-TSDEA configurations, signaling consistent and dependable performance. This level of stability reinforces its position as a provincial leader in both economic efficiency and environmental sustainability. In contrast, provinces such as Phuket and Songkhla display higher standard deviations, reflecting greater performance variability. While these provinces may occasionally achieve strong efficiency scores, their fluctuating performance may pose challenges for long-term sustainability planning and policy continuity.
Ayutthaya, with moderate variability, demonstrates a more balanced performance across model variants—highlighting the importance of maintaining both efficiency and stability in regional development. These findings underscore the need to evaluate DMUs not only by their average performance but also by their consistency over time or across scenarios. In this context, the integration of both mean and standard deviation metrics becomes essential to generate a more comprehensive understanding of each province’s capacity for sustainable and resilient development.
The TMV-TSDEA model enhances the traditional DEA framework by embedding this twin-dimensional assessment, enabling the identification of provinces that combine high average efficiency with low variability. The mean score provides a macro-level view of economic and environmental effectiveness, but when used in isolation, it may obscure performance volatility. Incorporating standard deviation ensures that rankings reflect not just peak efficiency, but also the reliability of outcomes, a key concern in long-term planning and resource allocation strategies.
Figure 7 illustrates the mean and standard deviation results of TMV-TSDEA_Type IV using the modified super-efficiency BCC model. As shown in the figure, Bangkok maintains strong mean rankings with minimal variability, making it a benchmark for robust and consistent performance. Narathiwat, while not always among the top in terms of average scores, exhibits stable performance across configurations, positioning it as a province with reliable growth potential. By distinguishing provinces that are both efficient and consistent, the TMV-TSDEA framework supports evidence-based policymaking—enabling decision-makers to allocate resources more effectively and prioritize regions with sustainable, scalable outcomes.
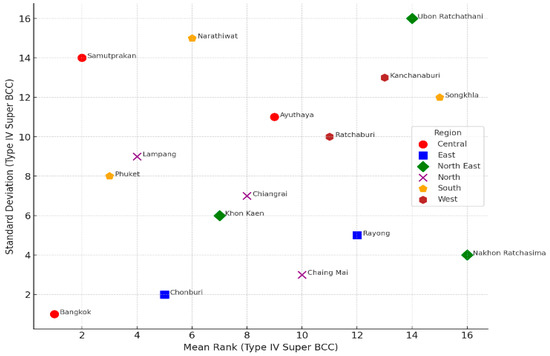
Figure 7.
Mean and standard deviation results of TMV-TSDEA_Type IV using the modified super-efficiency BCC model.
This approach also aligns with open innovation principles by fostering the diffusion of best practices among provinces. High-performing and stable regions such as Bangkok and Narathiwat serve as reference models, offering replicable strategies for other provinces seeking to improve performance. Through collaborative learning and data-informed evaluation, the TMV-TSDEA framework supports a culture of continuous improvement, addressing both economic productivity and environmental stewardship. Ultimately, the integration of efficiency and consistency metrics within a single informatics-enabled platform provides a holistic foundation for strategic planning and sustainable regional development.
The standard deviation (Stdev) values provide an essential dimension to the performance assessment by quantifying the consistency and reliability of each province’s efficiency across different TMV-TSDEA model configurations. For example, Bangkok consistently demonstrates high efficiency with low standard deviation values, indicating stable performance across varying model structures and data transformations. In contrast, provinces such as Phuket and Songkhla exhibit higher variability, suggesting performance volatility. While these provinces may occasionally rank well, their elevated Stdev values imply that such outcomes may be less dependable in the context of long-term planning or policy implementation. By incorporating both mean efficiency scores and performance variability, the TMV-TSDEA framework facilitates a comprehensive and stability-aware evaluation of provincial performance. This dual-metric approach enables more informed decision-making by identifying not only high-performing provinces but also those that consistently maintain their performance under different assumptions and data conditions.
The overall desirability index (D) synthesizes multiple efficiency evaluations across TMV-TSDEA configurations into a single composite measure. This index enables a unified comparison of provincial performance by integrating both mean efficiency and standard deviation metrics. Notably, Narathiwat (DMU15) and Bangkok (DMU1) achieve high overall desirability scores, reflecting both high efficiency and reliable consistency across DEA variants. Conversely, Songkhla continues to rank low in desirability, mirroring its underperformance in both individual and aggregate metrics (Figure 8). These findings underscore the importance of adopting a multi-dimensional performance evaluation framework. By accounting for both efficiency levels and performance consistency, the TMV-TSDEA approach ensures a more nuanced and resilient basis for strategic planning, resource allocation, and sustainability policy development across regions.
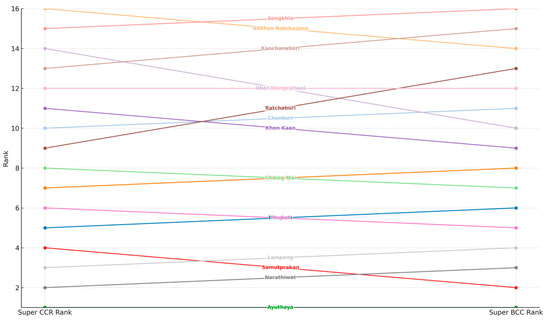
Figure 8.
Rank Shifts in TMV-TSDEA_Type IV Desirability Scores Across Super-Efficiency CCR and BCC Models.
5.5. Effect of Stage 2 External Inputs and Spatial Variables
The transition from TMV-TSDEA_Type I to Type II within the Super-Efficiency BCC model reveals performance shifts driven by the inclusion of external Stage 2 inputs—specifically, cultivated land area and the normalized communal forest coverage index (NCFCI). The results indicate that reductions in input variability—particularly in these environmental indicators—generally lead to improved efficiency rankings, although exceptions are observed. For example, a DMU ranked 4th in Type I rises to 1st in Type II, and another shifts from 14th to 6th, demonstrating that greater input alignment and contextual integration can enhance model sensitivity to sustainable performance.
Figure 9 presents the contour plot of TMV-TSDEA_Type II mean rankings using the super-efficiency BCC model with Stage 2 external inputs. The plot illustrates a spatial correlation between lower deviations in environmental indicators and higher overall efficiency scores, with regions exhibiting stable land-based inputs tending to cluster in zones of optimal performance. However, not all transitions result in rank improvement. Some DMUs, such as those previously ranked 9th and 11th, experienced a decline in efficiency under the Type II configuration. These deviations suggest that the model’s responsiveness to specific external inputs may yield varied outcomes depending on regional characteristics or input data distributions. While Type II modeling generally enhances rank precision by incorporating environmental context, its effectiveness remains case-dependent—highlighting the importance of scenario-specific calibration when applying TMV-TSDEA in regional sustainability assessments.
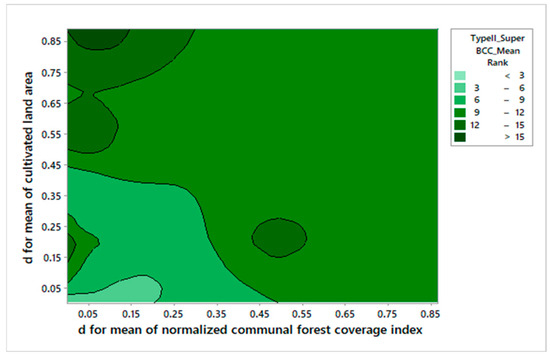
Figure 9.
Contour Plot of TMV-TSDEA_Type II mean rankings using the Super-Efficiency BCC Model with Stage 2 external inputs. Darker green areas indicate higher efficiency rankings, while lighter areas represent lower rankings. Axes display the standard deviations of the Normalized Communal Forest Coverage Index (NCFCI) and Cultivated Land Area (CLA), showing how stability in environmental indicators influences provincial performance.
Higher efficiency rankings—represented by darker green regions in the contour plot—are associated with lower variability in the standard deviation of the normalized communal forest coverage index (NCFCI) (approximately 0.3), combined with moderate variability in the standard deviation of cultivated land area (CLA) (ranging from 0.6 to 0.8). This spatial pattern suggests that provinces exhibiting stable forest coverage alongside moderate fluctuations in cultivated land-use tend to achieve superior performance under the Super-Efficiency BCC model within the TMV-TSDEA_Type II framework.
Figure 10 illustrates the contour plot of TMV-TSDEA_Type II standard deviation rankings using the super-efficiency BCC model with Stage 2 external inputs. These findings suggest that improved efficiency outcomes during the transition from Type I to Type II modeling may be achieved by maintaining ecological consistency—particularly in communal forest management—while permitting adaptive flexibility in agricultural land-use. This balance enhances the model’s capacity to capture sustainable and resilient regional performance dynamics. The insight underscores the value of TMV-TSDEA for scenario-based analysis, where understanding the interplay between ecological stability and land-use adaptability is essential for optimizing regional sustainability outcomes.
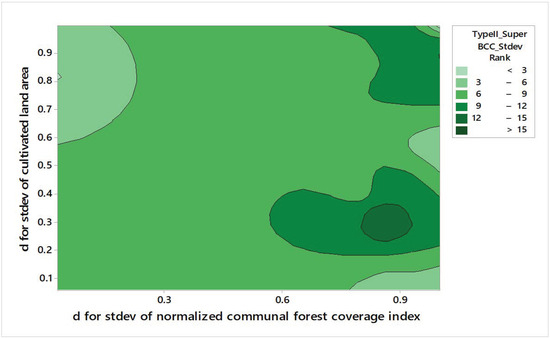
Figure 10.
Contour Plot of TMV-TSDEA_Type II Standard Deviation Rankings Using the Super-Efficiency BCC Model with Stage 2 External Inputs. Lower values (darker shading) indicate more stable performance, while higher values (lighter shading) suggest volatility. The plot highlights how ecological consistency in forest coverage and adaptive flexibility in land-use shape sustainable outcomes.
5.6. Role of Green Technology Indicators in Type III–IV Models
Figure 11 and Figure 12 highlight how the adoption of electric vehicles (EVs) and eco-friendly energy influences provincial performance under Type III–IV configurations. The results show that balanced adoption of green technologies is associated with higher efficiency, while inconsistent or uneven implementation leads to volatility. This suggests that sustainability outcomes are not maximized by scale alone but by aligning technological investments with regional capacity. These findings extend the rankings discussed in Section 5.4 by emphasizing the role of green technology indicators in shaping stability and long-term sustainability performance.
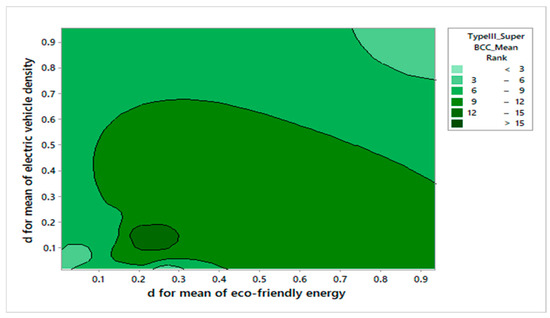
Figure 11.
Contour Plot of TMV-TSDEA_Type III Mean Rankings Using the Super-Efficiency BCC Model with Stage 1 Final Outputs. Darker green regions correspond to provinces achieving higher mean efficiency scores. The axes represent the mean values of electric vehicle (EV) density and eco-friendly energy usage, illustrating how balanced adoption of green technologies affects efficiency.
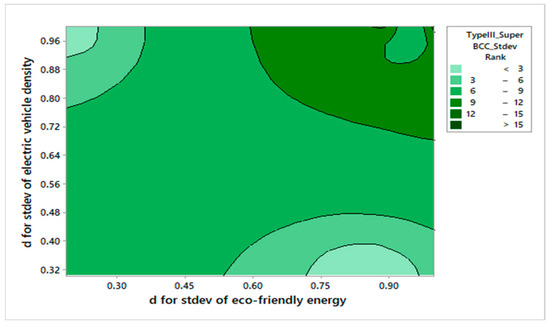
Figure 12.
Contour Plot of TMV-TSDEA_Type IV Standard Deviation Rankings Using the Super-Efficiency BCC Model with Stage 1 Final Outputs. Darker shades reflect greater stability across green technology adoption, while lighter shades reflect volatility. The axes represent the standard deviations of EV density and eco-friendly energy usage, showing how variability in these indicators relates to sustainable performance.
A desirability score was computed to map raw values into normalized counterparts. By assigning a uniform power of 1, the transformation preserves proportional differences across DMUs, ensuring interpretability and alignment with sustainable development principles. The TMV-TSDEA framework, incorporating both mean and standard deviation variables, provides a multi-dimensional assessment across four configurations (Types I–IV) under CCR and BCC models. This enables identification of high-performing provinces, those requiring improvement, and the influence of different model structures on outcomes.
Bangkok consistently ranks among the top performers, particularly under Type I and Type IV, confirming its benchmark status for integrated sustainability. Samut Prakan also performs strongly, while Narathiwat shows balanced and stable performance across models. In contrast, Rayong demonstrates moderate efficiency but higher variability, indicating a need for more consistent application of clean technologies and industrial management. Stability analysis further highlights Bangkok’s low variability, reinforcing its role as a reliable reference for benchmarking. Samut Prakan, despite strong average scores, exhibits greater fluctuations, suggesting areas for improved resilience.
5.7. Regional Performance Trends and Policy Implications
The combined results of TMV-TSDEA reaffirm the dual importance of efficiency and stability in regional sustainability evaluation (Figure 13). Provinces that are both efficient and stable can serve as benchmarks, while those with persistent inefficiencies require targeted intervention. The contour plots and Type-specific analyses demonstrate that ecological consistency (e.g., stable forest coverage), measured adoption of clean technologies, and adaptive land-use all contribute to stronger sustainability outcomes. Based on these insights, differentiated policy strategies are recommended: targeted investment in clean energy and EV infrastructure for provinces with moderate but unstable performance, systematic reforms in land-use and industrial regulation for persistently underperforming regions, and enhanced ecological conservation in areas where environmental stability supports efficiency. These measures translate the model’s results into feasible and actionable policy directions.
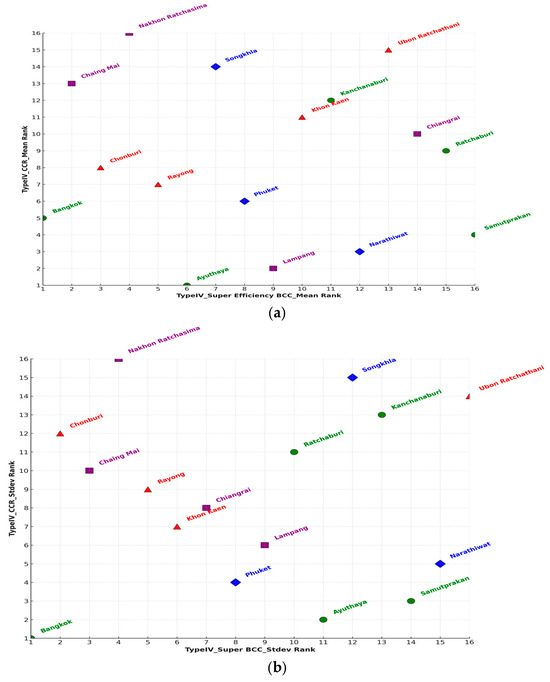
Figure 13.
Scatter Plot of DMU Performance on (a) Mean and (b) Standard Deviation in TMV-TSDEA_Type IV.
Using both mean efficiency and standard deviation within the TMV-TSDEA framework provides valuable insights for evidence-based policymaking. This dual-metric approach guides strategic resource allocation and highlights best practices from consistently strong performers such as Bangkok and Ayutthaya, which serve as benchmarks for sustainable governance. In contrast, provinces with low efficiency and high variability, including Songkhla and Nakhon Ratchasima, are identified as priority areas for targeted reform and capacity building.
The inclusion of a desirability score (D) integrates efficiency and stability into a single metric (Figure 14), enabling clear identification of reliable provinces. Bangkok, Narathiwat, and Samut Prakan perform strongly, although Samut Prakan’s variability underscores the need for ongoing monitoring. Provinces such as Phuket demonstrate a balanced profile, while Nakhon Ratchasima’s persistent underperformance emphasizes the need for systemic policy interventions. Collectively, these results confirm the TMV-TSDEA’s practical utility in identifying strengths, weaknesses, and opportunities for sustainable regional development.
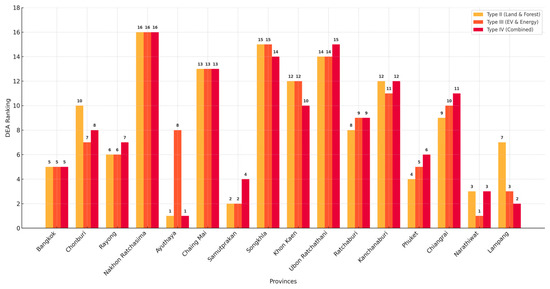
Figure 14.
DMU Desirability (D) Rankings Across TMV-TSDEA Variants and Model Types.
By integrating mean efficiency and standard deviation, the TMV-TSDEA framework provides a comprehensive evaluation of provincial sustainability in Thailand. Mean efficiency identifies top performers, while standard deviation captures stability, ensuring strategies account for both effectiveness and reliability. This dual assessment aligns with the SDGs by promoting balanced and resilient regional development.
Applied to 16 provinces, the framework highlights leaders such as Bangkok, Samut Prakan, and Ayutthaya, which demonstrate consistent strength in land management, environmental resilience, and green technology adoption. In contrast, Songkhla and Nakhon Ratchasima persistently underperform, underscoring the need for systemic reform. Other provinces, such as Narathiwat, show balanced growth, while Chiang Mai and Ubon Ratchathani face barriers to adopting clean technologies.
The results confirm TMV-TSDEA as a policy-relevant, stability-aware tool for guiding investment, reform, and ecological strategies. Sensitivity analysis, using ±20% weight variations, shows rankings remain robust for top (Bangkok, Ayutthaya) and low performers (Nakhon Ratchasima), with only modest shifts in mid-ranking provinces. This demonstrates the framework’s reliability for decision-making and cross-regional benchmarking.
The analysis results highlight the need for differentiated strategies across provinces. For regions with moderate efficiency but unstable outcomes, such as Phuket and Rayong, targeted investments in clean energy adoption and electric vehicle (EV) infrastructure can help stabilize performance while supporting green growth. Provinces that consistently underperform, including Nakhon Ratchasima and Songkhla, require systematic reforms in land-use planning, industrial regulation, and resource allocation to address structural inefficiencies. These reforms should be supported by capacity-building initiatives that enable local governments to implement sustainability measures more effectively.
At the same time, provinces where environmental stability strongly supports efficiency, such as Chiang Mai and Narathiwat, would benefit from strengthened forest conservation programs and ecological monitoring systems. Such interventions ensure the long-term preservation of ecosystem services that underpin regional sustainability. By linking these recommendations directly to the performance patterns revealed by TMV-TSDEA, the policy implications of this study are made more feasible and actionable, offering a clear roadmap for decision-makers to enhance both efficiency and stability in regional development.
6. Conclusions
This study presents a novel informatics-based framework—Twin Mean-Variance Two-Stage Data Envelopment Analysis (TMV-TSDEA) enhanced with desirability functions—for evaluating the economic and environmental performance of 16 Thai provinces. By integrating both mean efficiency and performance variability, the model captures not only average productivity but also the consistency of outcomes over time, supporting a more resilient and nuanced assessment of regional sustainability. The TMV-TSDEA approach models complex, interdependent systems through a two-stage structure: Stage 1 assesses economic inputs and intermediates (e.g., investment, population, energy use), while Stage 2 incorporates contextual environmental variables (e.g., forest coverage, cultivated land, EV adoption). The use of desirability transformation enables standardization and comparability across heterogeneous indicators, producing a unified performance score that informs regional benchmarking.
Aligned with the principles of open innovation and data-informed governance, the framework supports cross-provincial learning and strategic resource allocation. High-performing regions such as Bangkok and Ayutthaya serve as benchmarks for sustainable development, while underperforming areas can leverage these insights for policy improvement and capacity building. This method offers a scalable, transferable informatics tool for regional planners and policymakers, addressing the complexity of multi-criteria decision-making in sustainability contexts. Future extensions may incorporate machine learning or real-time data to enhance predictive capabilities and expand applicability across sectors and geographies.
Author Contributions
A.N. and P.L. contributed to the conceptualization, data curation, formal analysis, resources, software, validation, writing—original draft and writing—review and editing. P.A. contributed to the investigation, methodology, project administration, visualization. R.M. contributed to the investigation and writing—original draft. P.L. contributed to the funding acquisition and supervision. All authors have read and agreed to the published version of the manuscript.
Funding
This work was supported by research funding from the Faculty of Engineering, Thammasat School of Engineering, Thammasat University (contract no. 001/2568).
Institutional Review Board Statement
Not applicable.
Informed Consent Statement
Not applicable.
Data Availability Statement
The raw data supporting the conclusions of this article will be made available by the authors on request.
Conflicts of Interest
The authors declare no conflicts of interest.
References
- Halkos, G.; Argyropoulou, G. Modeling energy and air pollution health damaging: A two-stage DEA approach. Air Qual. Atmos. Health 2021, 14, 1221–1231. [Google Scholar]
- Moutinho, V.; Madaleno, M. A two-stage DEA model to evaluate the technical eco-efficiency indicator in the EU countries. Int. J. Environ. Res. Public Health 2021, 18, 1–21. [Google Scholar]
- Liu, H.; Chen, Y.; Wu, J.; Pan, Y.; Song, Y. Allocation of CO2 emission quotas for industrial production in Industry 4.0: Efficiency and equity. Comput. Ind. Eng. 2024, 194, 110375. [Google Scholar] [CrossRef]
- Gökgöz, F.; Yalçın, E.; Salahaldeen, N.A. Investigating the financial efficiencies and productivities of the banking sector. J. Econ. Stud. 2024, 51, 1036–1057. [Google Scholar]
- Chu, J.; Xu, F.; Zhu, Q.; Fukuyama, H. Production scale expansion and congestion in two-stage network systems. Comput. Ind. Eng. 2024, 193, 110317. [Google Scholar] [CrossRef]
- Ratner, S.V.; Lychev, A.V.; Krivonozhko, V.E. Data Envelopment Analysis-Based Approach to Improving of the Budget Allocation System for Decarbonization Targets. Economies 2024, 12, 160. [Google Scholar] [CrossRef]
- Despotis, D.K.; Sotiros, D.; Koronakos, G. Data envelopment analysis of two-stage processes: An alternative (non-conventional) approach. Int. Trans. Oper. Res. 2025, 32, 384–405. [Google Scholar] [CrossRef]
- Lamesgen, A.; Mengist, B.; Mazengia, E.M.; Endalew, B. Level of technical efficiency and associated factors among health centers in East Gojjam Zone, Northwest Ethiopia: An application of the data envelopment analysis. BMC Health Serv. Res. 2024, 24, 361. [Google Scholar]
- Amirteimoori, A.; Allahviranloo, T.; Arabmaldar, A. Scale elasticity and technical efficiency measures in two-stage network production processes: An application to the insurance sector. Financ. Innov. 2024, 10, 43. [Google Scholar] [CrossRef]
- Zhang, X.; Wei, F.; Xia, Q.; Song, S.; Wang, D. Efficiency assessment of two-stage systems with fixed-sum outputs: A noncooperative DEA model with uncertain stage priority. Expert Syst. Appl. 2024, 253, 124274. [Google Scholar] [CrossRef]
- Abdul Rashid, A.; See, K.F.; Yu, M.-M. Measuring airline efficiency using a dynamic network data envelopment analysis in the presence of innovation capital. Technol. Forecast. Soc. Chang. 2024, 206, 123457. [Google Scholar] [CrossRef]
- An, Q.; Huang, S.; Han, Y.; Zhu, Y. Ensemble learning method for classification: Integrating data envelopment analysis with machine learning. Comput. Oper. Res. 2024, 169, 106739. [Google Scholar] [CrossRef]
- Afsharian, M.; Kamali, S.; Ahn, H.; Bogetoft, P. Individualized second stage corrections in data envelopment analysis. Eur. J. Oper. Res. 2024, 317, 563–577. [Google Scholar] [CrossRef]
- Wu, D.; Li, H.; Huang, Q.; Li, C.; Liang, S. Measurement and determinants of smart destinations’ sustainable performance: A two-stage analysis using DEA-Tobit model. Curr. Issues Tour. 2024, 27, 529–545. [Google Scholar] [CrossRef]
- Teixeira, R.; Antunes, J.J.M.; Wanke, P.; Correa, H.L.; Tan, Y. Customer satisfaction and airport efficiency in Brazil: A hybrid NDEA-AHP approach. Benchmarking 2024, 31, 2239–2266. [Google Scholar] [CrossRef]
- Huang, K.-Y.; Chiu, Y.-H.; Chang, T.-H.; Lin, T.-Y. The effect of extreme temperature on electricity consumption, air pollution, and gross domestic product. Energy Environ. 2024, 35, 372–394. [Google Scholar] [CrossRef]
- He, K.; Zhu, N. Efficiency evaluation of Chinese provincial industry systems: A dynamic two-stage slacks-based measure with shared inputs. J. Ind. Manag. Optim. 2023, 19, 4959–4988. [Google Scholar] [CrossRef]
- Zhang, L.; Zhao, L.; Zha, Y. Efficiency evaluation of Chinese regional industrial systems using a dynamic two-stage DEA approach. Socio-Econ. Plan. Sci. 2021, 77, 101031. [Google Scholar] [CrossRef]
- de Oliveira, M.S.; Steffen, V.; Krukoski, F.A.; Mezoni, M.F.; Trojan, F. An integrated data envelopment analysis framework for operational efficiency assessment in Brazilian international airports. Decis. Anal. J. 2024, 12, 100493. [Google Scholar] [CrossRef]
- İlkaz, A.; Çebi, F. Multi-criteria decision-making model for evaluation of financial performance of insurance companies. In Chaos, Complexity, and Sustainability in Management; IGI Global: Hershey, PA, USA, 2024; pp. 141–170. [Google Scholar]
- Pimentel, V.; Mora-Monge, C.A. Benchmarking the operational efficiency of Mexican hospitals—A longitudinal study. Benchmarking 2024, 31, 309–329. [Google Scholar] [CrossRef]
- Adugna, M.; Dinsa, G.; Khuzwayo, N. Can performance-based financing improve efficiency of health centers in Ethiopia? A Malmquist Productivity Index analysis. BMC Health Serv. Res. 2024, 24, 696. [Google Scholar] [CrossRef]
- Ray, S.C. Nonparametric measurement of productivity growth and technical change. Found. Trends Econom. 2024, 13, 67–169. [Google Scholar]
- Min, H.; Ahn, Y.-H.; Ma, J.-H. Measuring dynamic supply chain risks for the offshoring decision in the post-COVID-19 era: A longitudinal study. Transp. J. 2024, 63, 188–206. [Google Scholar] [CrossRef]
- Georgiadis, G.; Kopsacheilis, A.; Andreadis, I.M.; Politis, I. Analyzing efficiency and built environment factors for achieving convenient access to public transport: A Europe-wide DEA application. Environ. Sci. Policy 2024, 158, 103792. [Google Scholar] [CrossRef]
- Salazar-Adams, A.; Ramirez-Figueroa, C. Organization, capital, and human resource factors influencing waste collection efficiency in Mexico. Util. Policy 2024, 88, 101747. [Google Scholar] [CrossRef]
- Jakšić, M.; Srejović, A.K.; Milanović, M.; Mimović, P. Measuring the economic performance of transition economies: DEA-bootstrapping approach. J. Econ. Stud. 2024, 51, 238–260. [Google Scholar] [CrossRef]
- Lou, J.; Yang, G.-L.; Song, L.; Liu, K.-D. From resources to capital: Investigating the efficiency of forest ecosystem products value realization in China. Socio-Econ. Plan. Sci. 2024, 96, 102052. [Google Scholar] [CrossRef]
- Omid, A.; Azar, A.; Taleb, M. Assessing environmental and operational efficiencies: A multi-objective optimization problem in a two-stage network data envelopment analysis. IMA J. Manag. Math. 2024, 35, 693–713. [Google Scholar] [CrossRef]
- Amirteimoori, A.; Allahviranloo, T.; Nematizadeh, M. A firm-specific Malmquist productivity index model for stochastic data envelopment analysis: An application to commercial banks. Financ. Innov. 2024, 10, 66. [Google Scholar] [CrossRef]
- Wei, B.-W.; Ma, Y.-Y.; Ji, A.-B. Stage stochastic incremental data envelopment analysis models and applications. Socio-Econ. Plan. Sci. 2024, 95, 102056. [Google Scholar] [CrossRef]
- Amirteimoori, A.; Cezar, A.; Zadmirzaei, M.; Susaeta, A. Environmental performance evaluation in the forest sector: An extended stochastic data envelopment analysis approach. Socio-Econ. Plan. Sci. 2024, 94, 101943. [Google Scholar] [CrossRef]
- Yin, C.; Hsiao, B.; See, K.F. Efficiency analysis of China’s urban water supply utilities using a dynamic multiactivity network DEA model. Struct. Chang. Econ. Dyn. 2024, 71, 387–404. [Google Scholar] [CrossRef]
- Anouze, A.L.; Al Khalifa, M.M.; Al-Jayyousi, O.R. Reevaluating national innovation systems: An index based on dynamic-network data envelopment analysis. Socio-Econ. Plan. Sci. 2024, 95, 102003. [Google Scholar] [CrossRef]
- Hu, J.-L.; Huang, Y.-S.; You, C.-Y. Renewable Energy Generation Efficiency of Asian Economies: An Application of Dynamic Data Envelopment Analysis. Energies 2024, 17, 4682. [Google Scholar] [CrossRef]
- Perroni, M.G.; da Veiga, C.P.; Su, Z.; Ramos, F.M.; da Silva, W.V. Dynamic Equilibrium of Sustainable Ecosystem Variables: An Experiment. Sustainability 2023, 15, 6744. [Google Scholar] [CrossRef]
Disclaimer/Publisher’s Note: The statements, opinions and data contained in all publications are solely those of the individual author(s) and contributor(s) and not of MDPI and/or the editor(s). MDPI and/or the editor(s) disclaim responsibility for any injury to people or property resulting from any ideas, methods, instructions or products referred to in the content. |
© 2025 by the authors. Licensee MDPI, Basel, Switzerland. This article is an open access article distributed under the terms and conditions of the Creative Commons Attribution (CC BY) license (https://creativecommons.org/licenses/by/4.0/).