Article

A Patent-Based Technology Roadmap for AI-Powered Manipulators: An Evolutionary Analysis of the B25J Classification

by
Yujia Zhai
1,
Zehao Liu
1,
Rui Zhao
1,
Xin Zhang
2 and
Gengfeng Zheng
2,*
1
School of Management, Tianjin Normal University, Tianjin 300387, China
2
Fujian Key Laboratory of Special Intelligent Equipment Safety Measurement and Control, Fujian Special Equipment Inspection and Research Institute, Fuzhou 350008, China
*
Author to whom correspondence should be addressed.
Informatics 2025, 12(3), 69; https://doi.org/10.3390/informatics12030069
Submission received: 4 April 2025 / Revised: 5 July 2025 / Accepted: 9 July 2025 / Published: 11 July 2025

Abstract

Technology roadmapping is conducted by systematic mapping of technological evolution through patent analytics to inform innovation strategies. This study proposes an integrated framework combining hierarchical Latent Dirichlet Allocation (LDA) modeling with multiphase technology lifecycle theory, analyzing 113,449 Derwent patent abstracts (2008–2022) across three dimensions: technological novelty, functional applications, and competitive advantages. By segmenting innovation stages via logistic growth curve modeling and optimizing topic extraction through perplexity validation, we constructed dynamic technology roadmaps to decode latent evolutionary patterns in AI-powered programmable manipulators (B25J classification) within an innovation trajectory. Key findings revealed: (1) a progressive transition from electromechanical actuation to sensor-integrated architectures, evidenced by 58% compound annual growth in embedded sensing patents; (2) application expansion from industrial automation (72% early stage patents) to precision medical operations, with surgical robotics growing 34% annually since 2018; and (3) continuous advancements in adaptive control algorithms, showing 2.7× growth in reinforcement learning implementations. The methodology integrates quantitative topic modeling (via pyLDAvis visualization and cosine similarity analysis) with qualitative lifecycle theory, addressing the limitations of conventional technology analysis methods by reconciling semantic granularity with temporal dynamics. The results identify core innovation trajectories—precision control, intelligent detection, and medical robotics—while highlighting emerging opportunities in autonomous navigation and human–robot collaboration. This framework provides empirically grounded strategic intelligence for R&D prioritization, cross-industry investment, and policy formulation in Industry 4.0.

1. Introduction

Technology roadmapping is a systematic method that provides key inputs for Technology Foresight by identifying strategic research domains and emerging technologies with significant socioeconomic potential through a multidimensional analysis of scientific, technological, and socioeconomic trajectories [1]. This process generates critical inputs for evidence-based policy formulation and strategic planning [2], particularly in the context of intensifying global technological competition where effective R&D resource allocation and innovation risk mitigation have become paramount [3]. As an integral component of technology governance frameworks, it bridges technological development with policy implementations [4].
Conventional technology analysis approaches exhibit distinct limitations. Qualitative methods such as the Delphi technique, which are valuable for expert consensus building, involve time-intensive iterative processes (typically requiring multiple survey rounds) and inherent subjectivity [5,6]. Conversely, quantitative bibliometric analyses provide objective innovation indicators [7] but remain constrained to macroscopic trend observations, lacking granular insights into technological evolution mechanisms.
Patent documentation constitutes a vital knowledge infrastructure for technological innovation by systematically archiving technical specifications through standardized disclosure protocols [8]. These structured records enable a comprehensive analysis of technological evolution, establishing patent analytics as an indispensable tool for formulating research and innovation strategies [9]. Within technology analysis frameworks, patent text mining enhances both the depth and precision of technological feature extraction and serves as a critical methodology for identifying emerging technologies [10]. Current approaches predominantly employ lexical pattern analysis (via word frequency statistics) and semantic mapping (through vector space models) [11], yet face three persistent limitations: (1) surface-level feature extraction neglecting contextual relationships, (2) computational inefficiency from high-dimensional representations in large-document processing, and (3) unresolved semantic equivalence across synonymous technical terms (e.g., \“actuator\” vs. \“drive mechanism\”). These constraints collectively hinder the identification of the latent technological relationships and evolutionary pathways.
To provide a solid and policy-relevant theoretical foundation, this study adopts the Organization for Economic Co-operation and Development (OECD) definition of an “AI system”: “Machine-based system that, for explicit or implicit objectives, infers, from the input it receives, how to generate outputs such as predictions, content, recommendations, or decisions that can influence physical or virtual environments.” [12]. This definition has become an intergovernmental standard, adopted by entities such as the European Union, the United States, and the United Nations, providing an authoritative basis for this analysis.
Topic modeling advances text analysis by probabilistically inferring latent thematic structures within document collections, thereby overcoming the lexical limitations of conventional vector space approaches. Unlike term-frequency matrices that capture surface-level word distributions, this methodology decodes the semantic relationships between technical concepts through hierarchical Bayesian frameworks. The Latent Dirichlet Allocation (LDA) algorithm exemplifies this capability, enabling temporal integration to track thematic evolution across patent lifecycle stages. LDA extensions demonstrate three critical advantages in technology analysis: (1) automated semantic pattern recognition, (2) cross-document knowledge trajectory mapping, and (3) predictive modeling of emerging technological paradigms. Seminal applications validate its analytical versatility: technology entropy analysis in graphene development [13], risk pattern extraction for industrial safety [14], evolutionary mapping of perovskite photovoltaics [15], medical innovation feasibility assessment [16], aerospace technology forecasting [17], and blockchain patent dynamics modeling [18]. These implementations collectively establish LDA’s capacity to process the voluminous technical literature while elucidating complex innovation pathways.
However, the challenges in technology analysis stem from the difficulty of effectively combining both qualitative and quantitative methods, as well as the lack of integration between external and internal technological characteristics. Many traditional methods, although effective for broad trend analysis, fail to account for the dynamic and evolving nature of technology. Moreover, the increasing volume of patent data presents challenges in efficiently mining and processing relevant information [19]. Consequently, there is an urgent need for more comprehensive, integrated, and intelligent methods in technology analysis research.
This study aims to construct an analytical framework that can reveal the evolution path of key technology fields through mining large-scale patent data. The starting point of the research is to conduct extensive searches of global patents in the field of artificial intelligence, and initially obtain over 600,000 patent records. Faced with such a massive dataset, we first conducted an exploratory International Patent Classification (IPC) code frequency analysis to identify the high-impact technology branches with the most concentrated innovation activities. The analysis results show that the number of patents with IPC classification number B25J (i.e., programmable robotic arm) occupies a dominant position among all AI-related technologies. This discovery highlights the importance of B25J as the core area of current AI technology research and development, and prompts us to focus our research on this area, conducting an in-depth, data-driven case analysis of its technological evolution trajectory. Therefore, this study does not presuppose a country but is guided by the distribution characteristics of the data itself, selecting B25J as the analysis object, in order to decode the internal innovation dynamics of this key technology field. Focusing on three critical dimensions of patent documentation—novelty, use, and advantages—we establish a multistage analytical process to enhance analysis reliability. The methodology bridges quantitative topic modeling with qualitative evolutionary pattern recognition, enabling the granular interpretation of technological trajectories through temporal–semantic integration. This dual approach facilitates a comprehensive analysis of both the explicit and latent innovation pathways.
The remainder of this paper is organized as follows: Section 2 details the three-phase analytical framework comprising data acquisition and preparation, model optimization, and pathway prediction, integrating LDA topic modeling with logistic growth curve analysis. Section 3 presents empirical validation using AI-driven programmable manipulators (B25J classification) as a case study, including the Derwent Innovation Index data collection (2008–2022), lifecycle stage segmentation via S-curve inflection points, and technology roadmap construction. Section 4 discusses the capacity of the framework to reconcile quantitative and qualitative paradigms while identifying implementation constraints. Section 5 concludes the paper with strategic recommendations for industrial robotics and methodological extensions for adjacent technological domains.

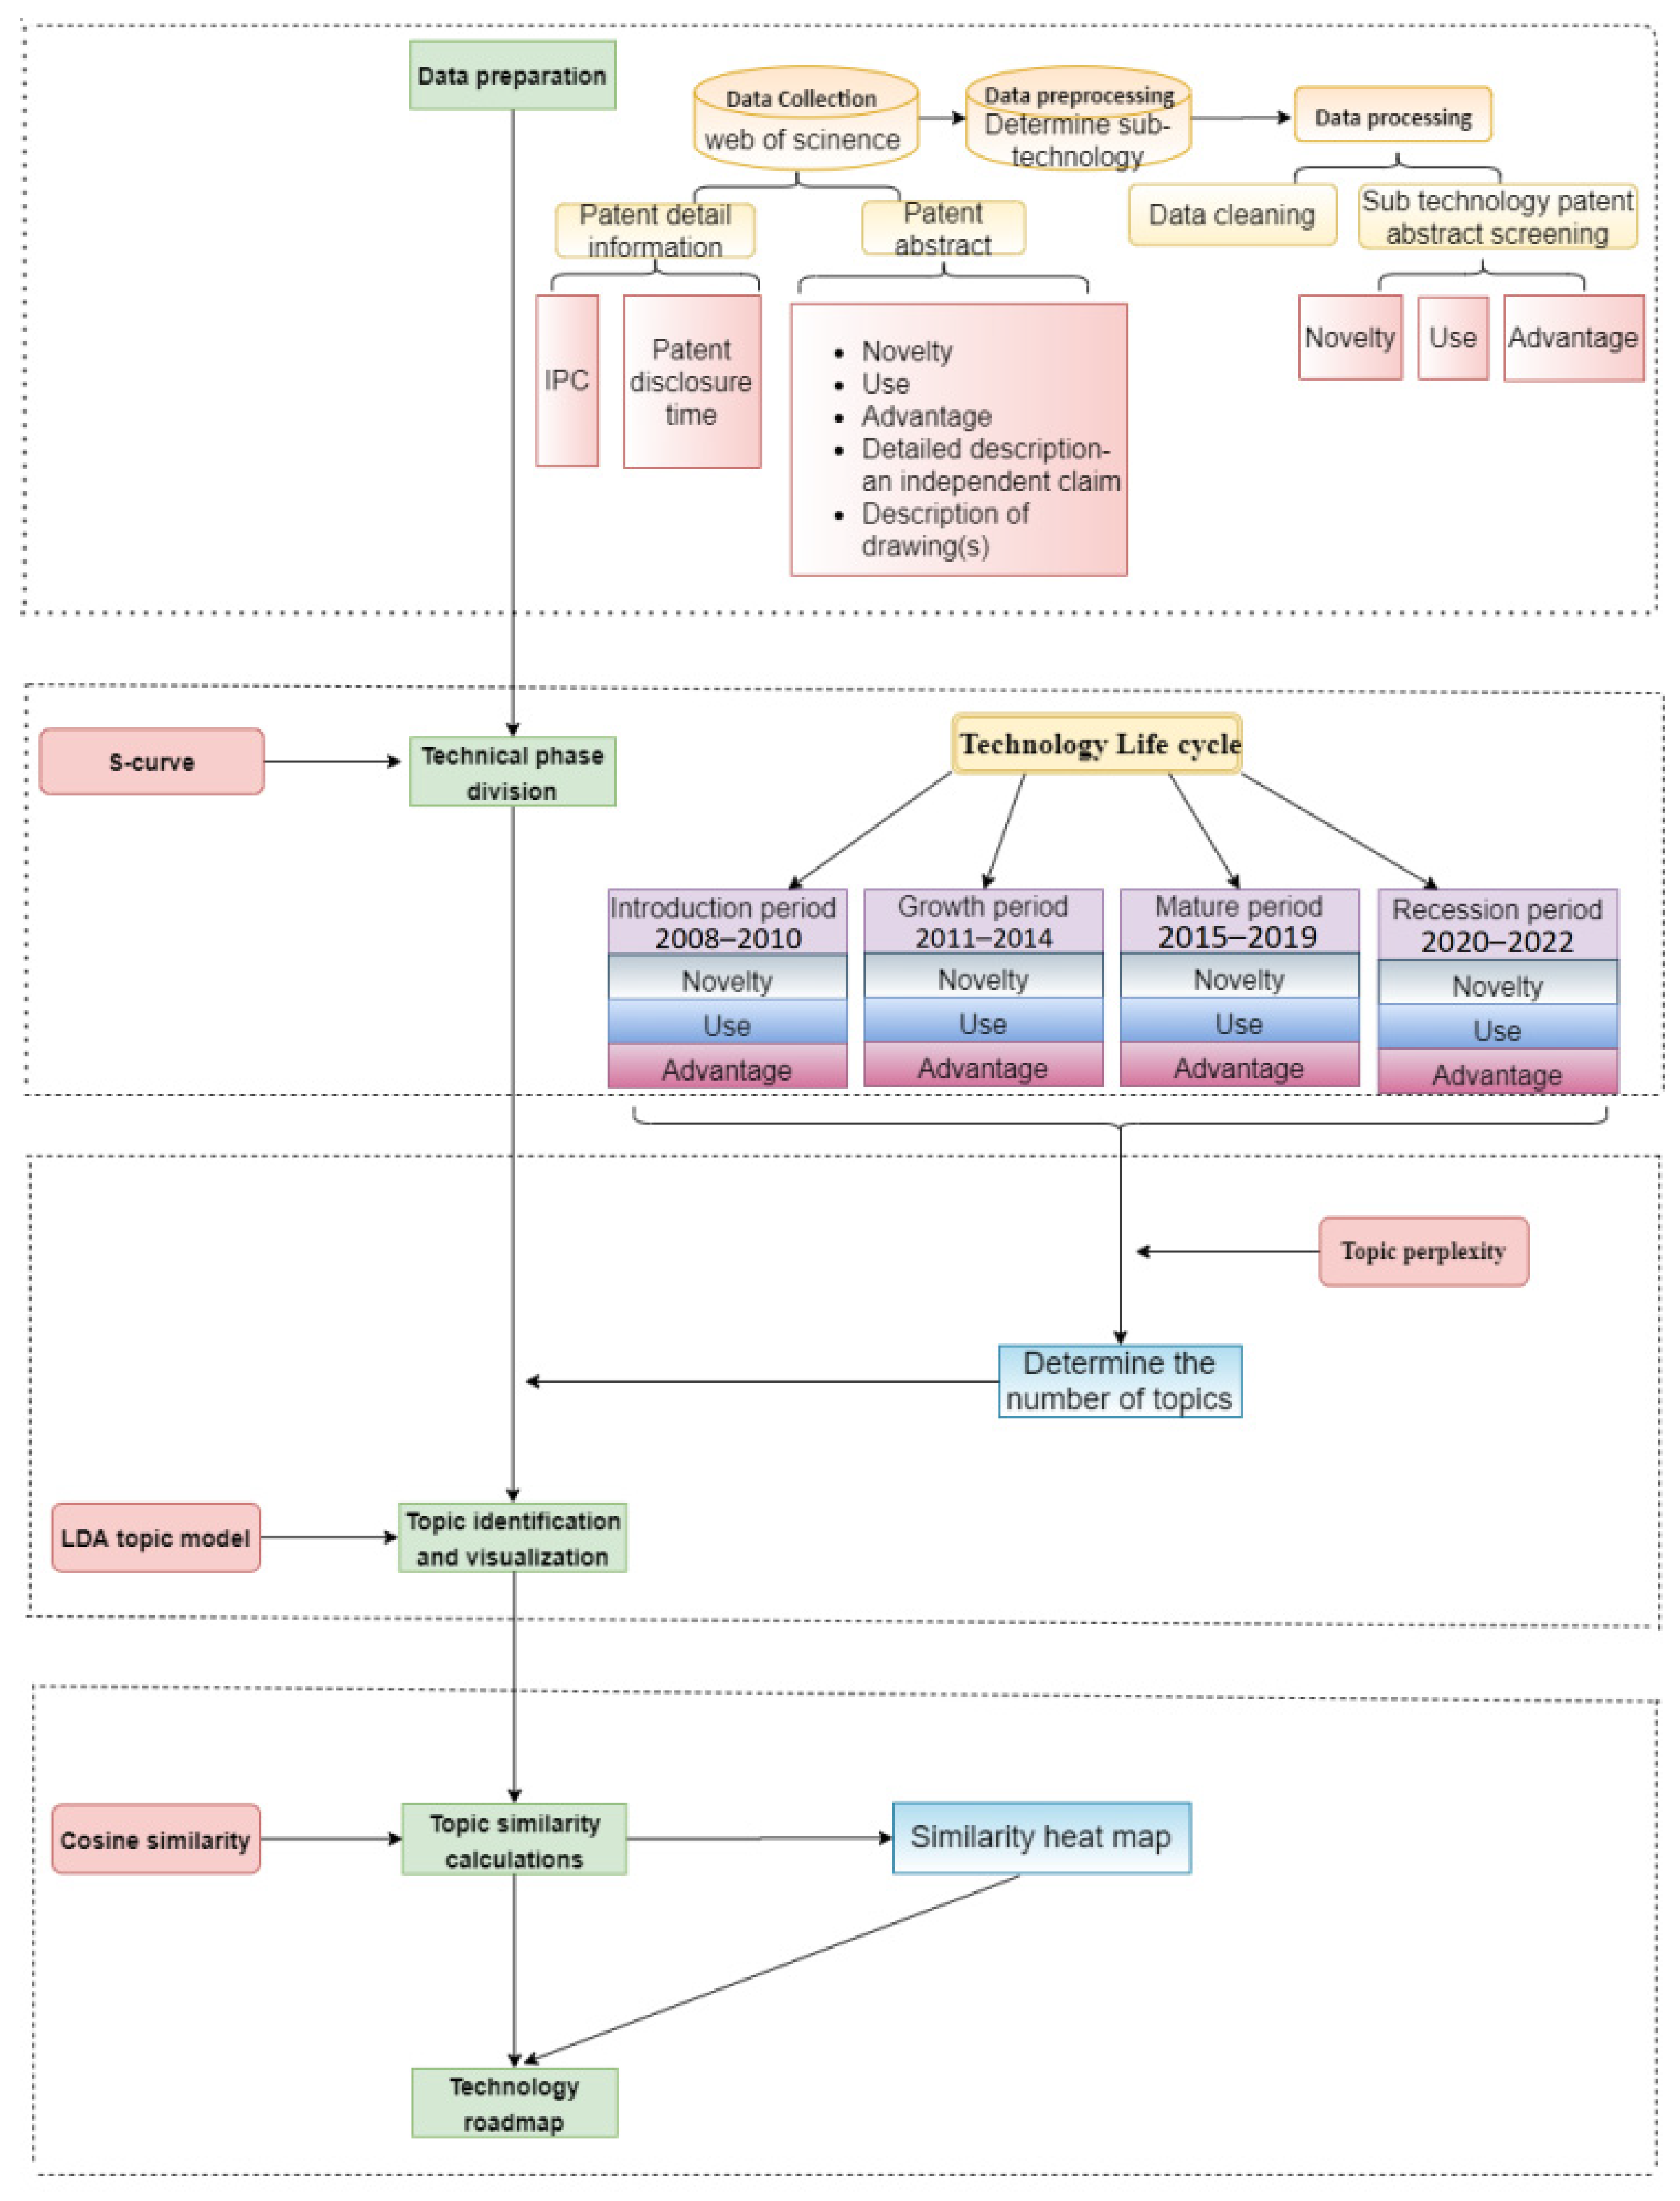
2. Methodology and Analytical Framework

This study establishes a quantitative research framework integrating patent analytics and temporal topic modeling for technology roadmapping, systematically combining patent application timelines, International Patent Classification (IPC) codes, and abstract texts across three analytical dimensions. The Novelty field precisely articulates the invention’s fundamental difference from prior art, revealing its technological breakthrough or original solution. Subsequently, the Use field connects this abstract technical concept to the real world, detailing the specific scenarios and potential commercial value of its application, thereby answering the question, “What can it be used for?” Finally, the Advantage field directly showcases the invention’s competitiveness over existing solutions through quantitative or qualitative measures—such as lower costs, higher efficiency, or superior performance—clearly indicating “why it is better” and providing a strong basis for technology assessment. This three-dimensional structured data provides a solid foundation for this study to deeply analyze the evolution of technology from different levels.
The analytical framework implements a three-stage workflow comprising data-driven preparation, model optimization, and evolutionary path prediction. As illustrated in Figure 1, this integrated process enables technology roadmap construction through the systematic classification of topics based on quantified strength metrics and continuity coefficients.

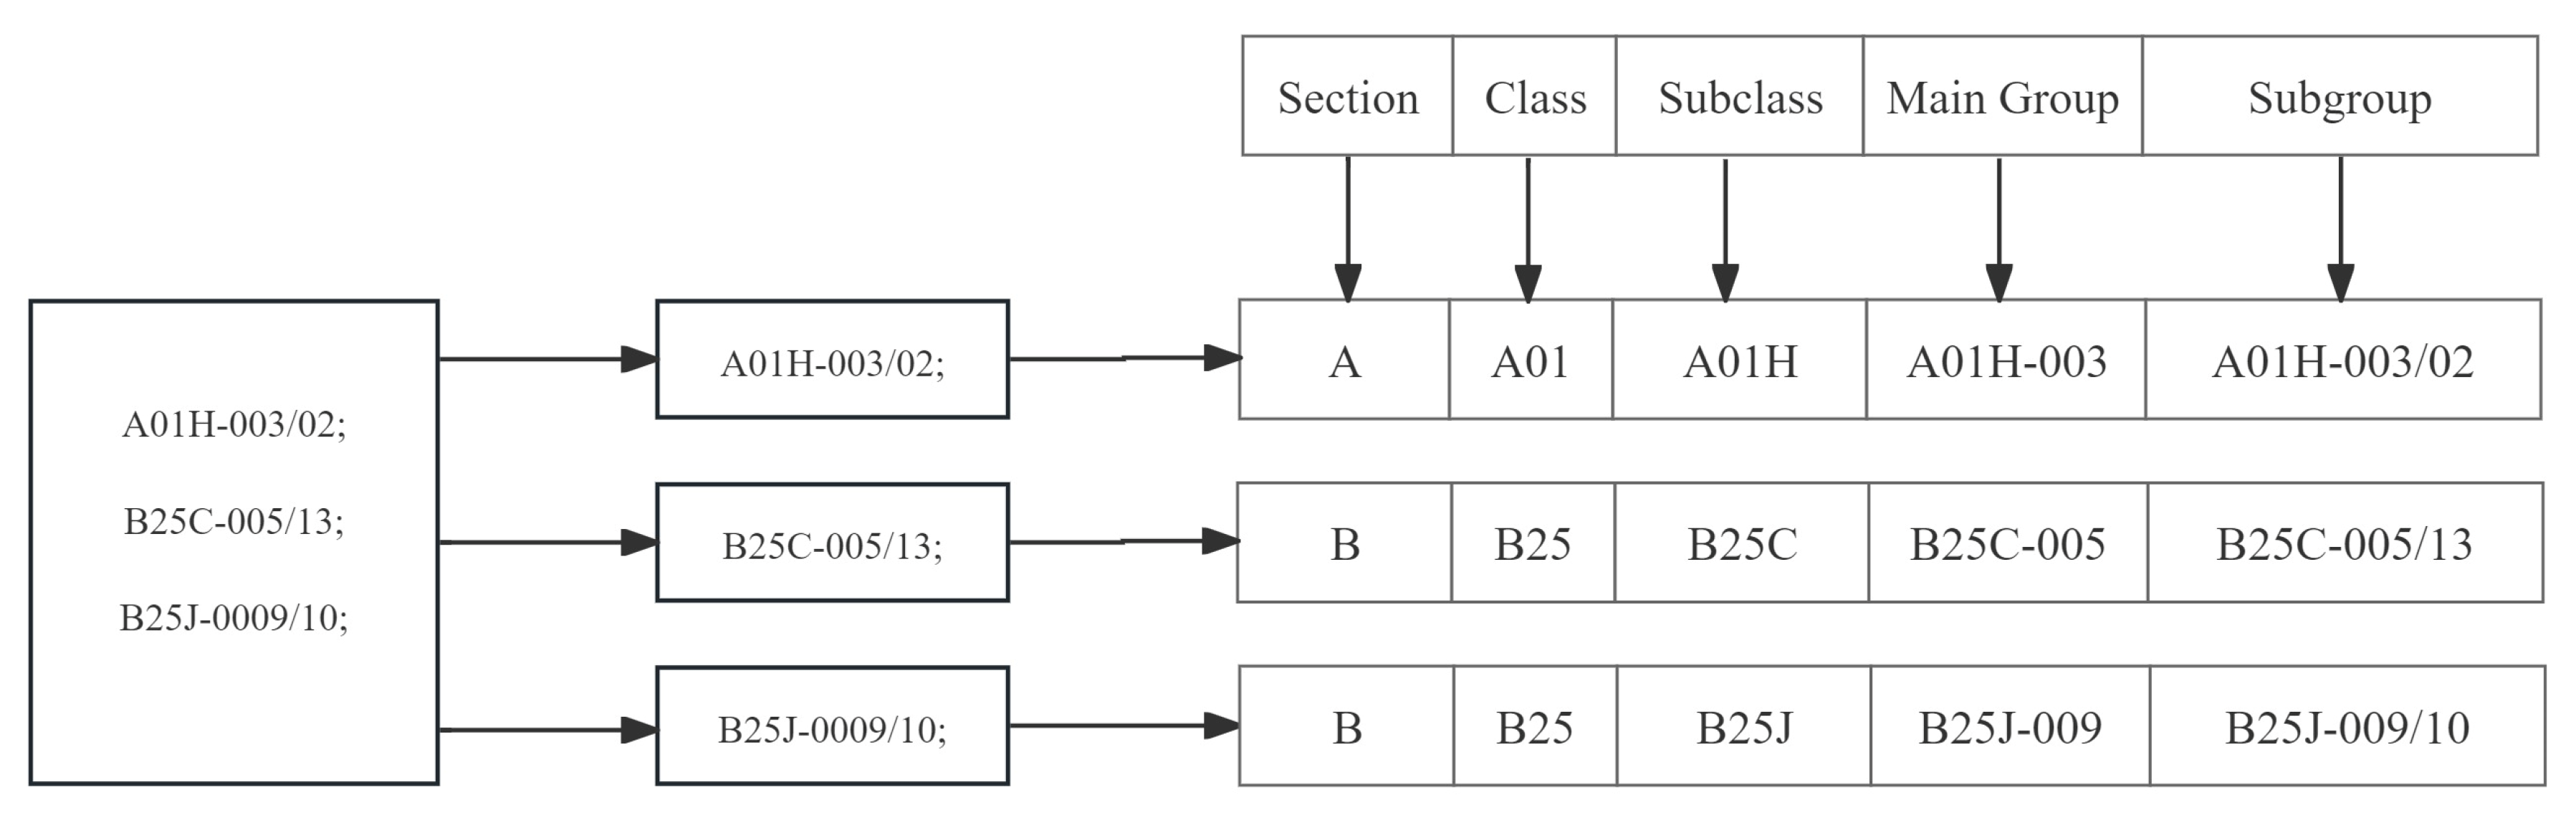
2.1. Data Acquisition and Preparation

Initial data processing involves using patent mining techniques for abstract text categorization and statistical profiling. This study utilized the Derwent Innovation Index (DII) database, initially obtaining 626,587 AI-related patent records through a broad keyword search. A preliminary frequency analysis of the IPC classifications within these records revealed that B25J (programmable manipulators) was the overwhelmingly dominant technical field, particularly among patents originating from China. This finding provides a solid empirical basis for selecting B25J as the focal point of this case study, enabling a deep dive into innovation ecosystem in this specific domain.

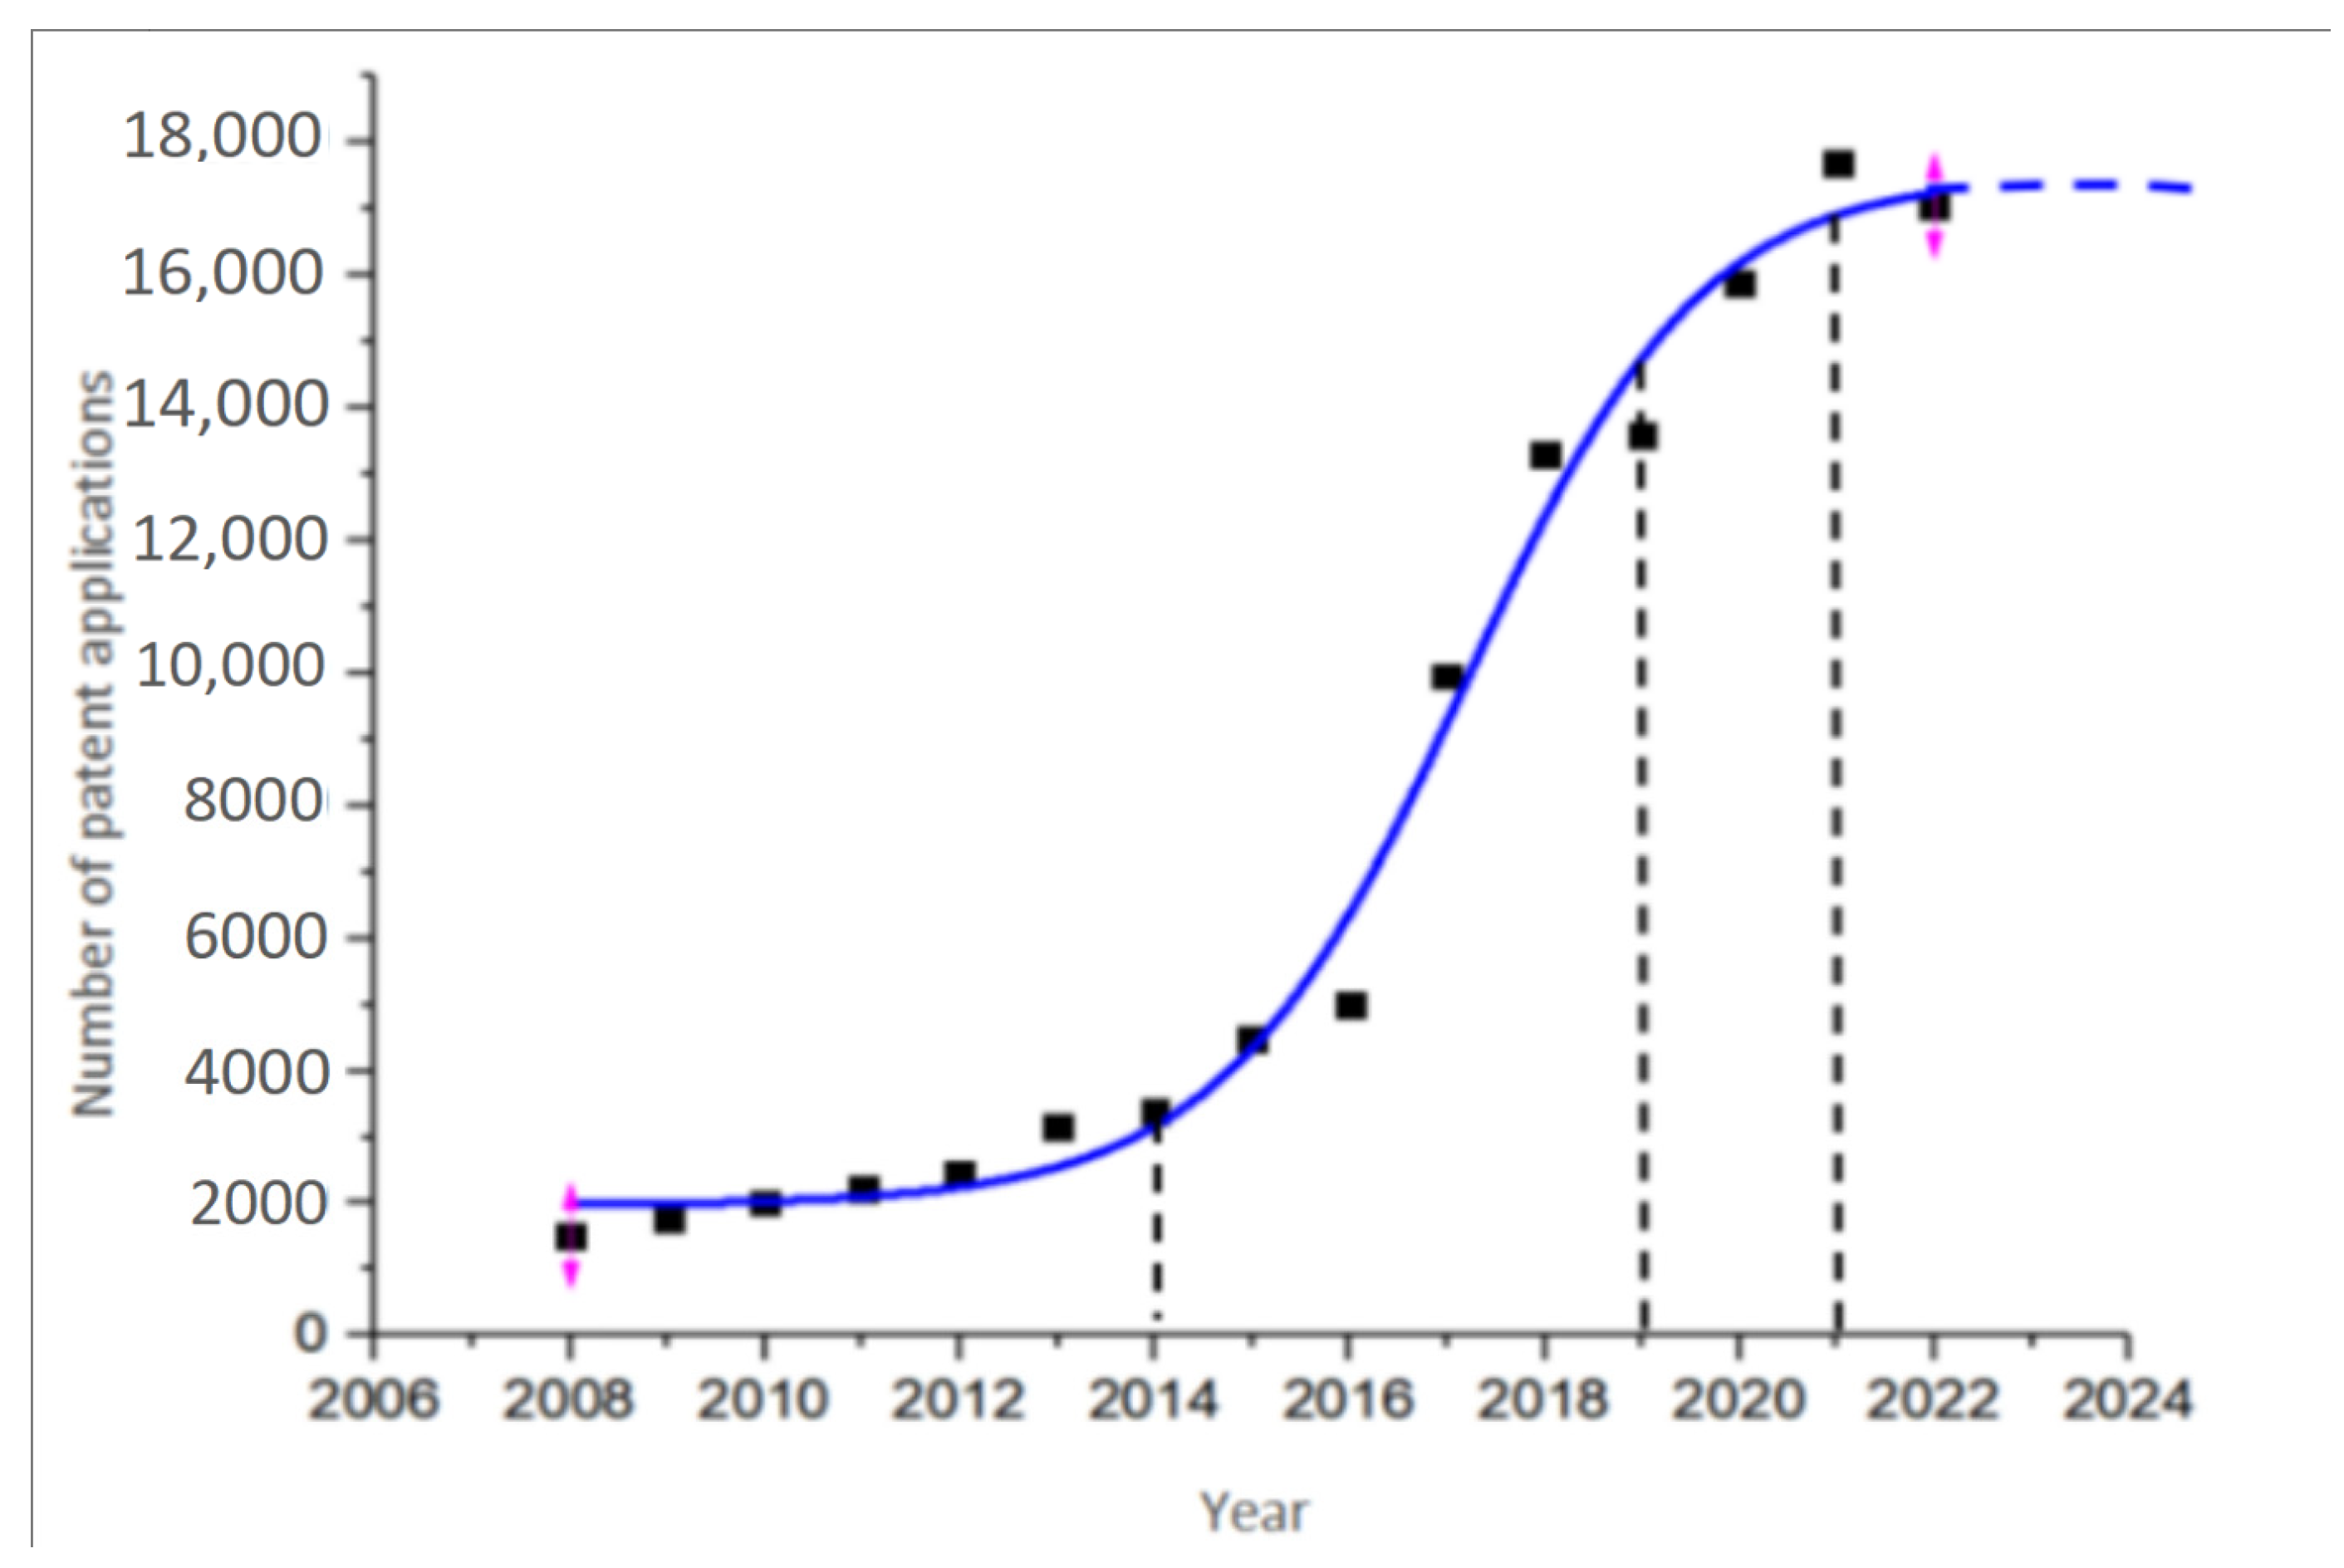
2.2. Technology Lifecycle Modeling

Technology stage segmentation constitutes the methodological foundation for foresight analysis, with patent time-series data integral to the analytical framework. Technology lifecycle theory operationalizes developmental patterns through S-curve modeling, where inflection points demarcate four evolutionary phases: emergence (positive acceleration), growth (linear progression), maturity (negative acceleration), and decline (stabilization). This temporal structuring inherently embeds future-oriented characteristics, enabling the probabilistic forecasting of technological trajectories [20]. The logistic variant of the S-curve analysis proves particularly effective for modeling exponential growth patterns in disruptive technologies, as demonstrated in prior innovation studies [21].
Technology stage classification is implemented through a temporal analysis of Derwent patent publication dates, with logistic growth modeling applied to characterize developmental phases. While priority dates are standard for pinpointing the moment of invention, this study employs publication dates. This choice is based on two considerations: First, the research focuses on the technology’s public evolutionary trajectory, for which the publication date—marking its official entry into the public domain—is a more relevant anchor for roadmap construction. Second, this approach ensures methodological consistency, as the publication date was the most complete timestamp in the initial dataset retrieved from the Derwent Innovation Index.

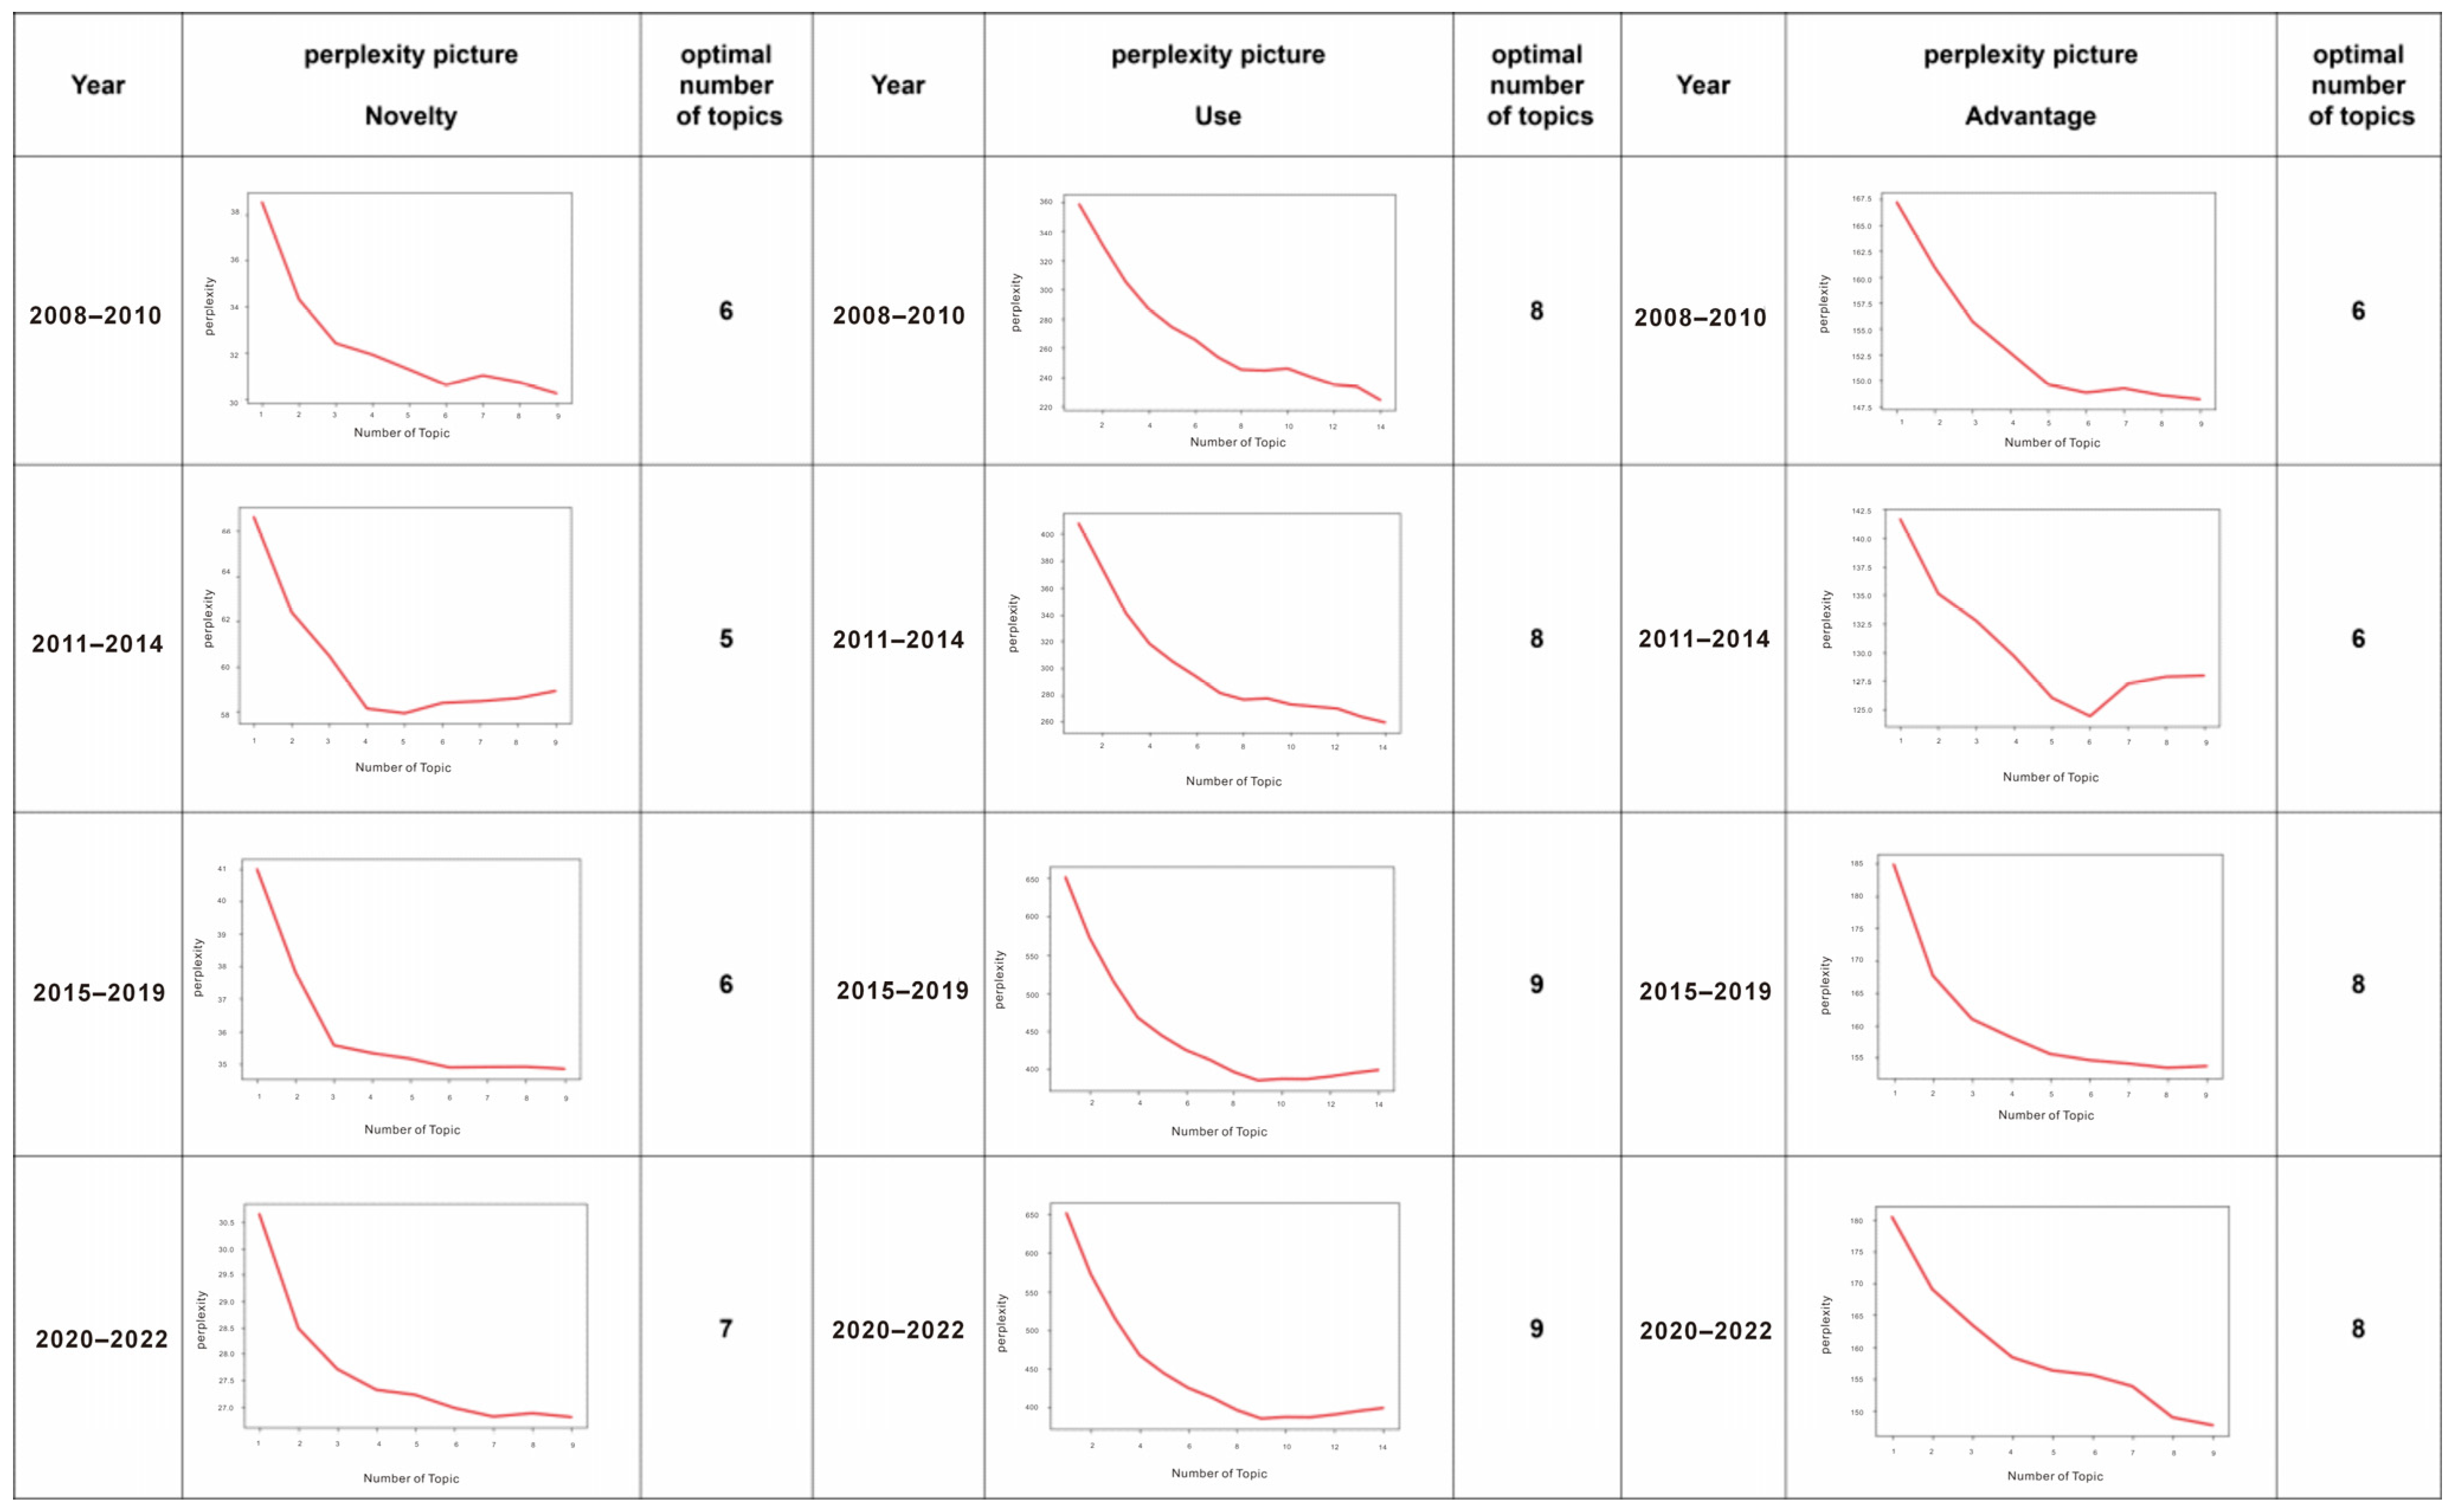
2.3. Topic Identification and Optimization

The Latent Dirichlet Allocation (LDA) model is subsequently employed for multidimensional topic extraction, with iterative training via Python 3.7 Gensim library optimizing model parameters through perplexity minimization. The perplexity metric is calculated as follows, with reference to the foundational work of Blei et al. [22]:
p e r p l e x i t y D = exp log p ( w ) d 1 M N d
where p w represents the probability of word w in document d , N d denotes the total number of words in document d , and N is the total number of words in the test set (i.e., the sum of all N d ).

2.4. Construction of the Technological Roadmap

The trained model processed data from 12 sub-datasets across four stages, revealing topic strength in three dimensions: novelty, use, and advantages. To address the fragmentation of topics over time, a technological roadmap was constructed to visualize the evolutionary trajectory over the entire lifecycle. Empirical validation was conducted through a statistical analysis of patent volumes, with robotic arm technology serving as a case study. Ultimately, the technology roadmap is constructed by systematically classifying topics based on quantified strength metrics and continuity coefficients, facilitating dynamic insight into technological trajectories.

3. Empirical Research

3.1. Data Preparation

3.1.1. Data Source and Collection

This study utilized data from the Derwent Innovation Index (DII) database. Compared to other databases, the DII patent index follows a standardized approach to rewriting patent data and includes essential bibliographic elements such as patent titles, abstracts, and classification codes. This standardization enhances the searchability and discoverability of patent data [23]. Therefore, the DII database was chosen as the primary data source for collecting artificial intelligence patent records from 2008 to the present.
As artificial intelligence spans a wide range of technical domains and covers various disciplines, it is essential to ensure the accuracy and comprehensiveness of the search. To refine the search strategy, a thorough review of the key domestic and international literature on artificial intelligence [24,25] was conducted and consultations with domain experts were held. Following extensive discussions and trial runs, the search string was finalized as follows:
TS = (“artificial intelligence” OR “natural language processing” OR “image grammars” OR “pattern recognition” OR “image matching” OR “symbolic reasoning” OR “symbolic error analysis” OR “physical symbol system” OR “natural languages” OR “pattern analysis” OR “image alignment” OR “optimal search” OR “machine learning” OR “neural networks” OR “reinforcement learning” OR “logic theorist” OR “bayesian belief networks” OR “unsupervised learning” OR “deep learning” OR “knowledge representation and reasoning” OR “crowdsourcing and human computation” OR “neuromorphic computing” OR “decision making” OR “machine intelligence” OR “computer vision” OR “robot” OR “robot systems” OR “collaborative system” OR “humanoid robotics” OR “sensor network” OR “sensor data fusion” OR “systems and control theory” OR “layered control systems”).
The search was conducted on 30 December 2023, yielding 626,587 patent records in the field of artificial intelligence.

3.1.2. Data Filtering

The International Patent Classification (IPC) system provides a hierarchical taxonomy for global patent analysis, structuring technologies across five granular levels: section (alphabetic codes A-H), class (two-digit numerals), subclass (uppercase letters), main group (1–3 digits with/00 suffix), and subgroup (modified main group identifiers). This multilevel classification architecture enables systematic navigation through technological domains, as visually decomposed in Figure 2 through representative IPC code deconstruction.
Given the critical role of the first four IPC digits in defining the core technological scope, this study focuses on section–class–subclass–main group analysis. Computational processing using Python and Excel identified B25J (programmable manipulators) as the predominant technical domain within AI-related patents, with its application volume being significantly higher than adjacent classifications.
In order to identify a representative research focus from a wide range of artificial intelligence technology fields, we conducted a statistical analysis of the top two hundred major classification number patent records initially retrieved from the International Patent Classification (IPC). As shown in Figure 3, accounting for 21% of the total was B25J, surpassing G06N and G06F in terms of scale, data representation, and other technical fields, such as record carriers. The advantages of B25J indicate that robot arm technology is one of the most active and concentrated core areas in the current layout of artificial intelligence patents. Therefore, this study chooses B25J as the case study object to conduct in-depth evolutionary analysis of this key technology.

3.1.3. Data Preprocessing

A data sanitization pipeline was implemented for robotic manipulator patents (B25J classification), involving the sequential removal of non-conforming entries (missing values, duplicates, and anomalous records) to yield a refined dataset of 113,449 patent records. Derwent-rewritten abstracts containing structured descriptions of technological novelty, functional applications, and competitive advantages were prioritized for analysis because of their standardized semantic richness, which supports robust competitor benchmarking and trend analysis [26]. These expert-curated abstracts provide granular technical specifications that are absent in raw patent filings.
Derwent abstracts follow a tripartite structure, emphasizing novelty claims, application scenarios, and technological advantages, with auxiliary elements (legal claims, schematic diagrams) excluded as non-essential to feature extraction. Automated text segmentation was implemented using Python scripts by parsing abstracts into discrete novelty–use–advantage corpora based on predefined syntactic markers. This structured decomposition enables targeted topic modeling across each technological dimension, ensuring analytical alignment with the framework triaxial design.

3.2. Technology Lifecycle Division

Thematic content is often consistent across generations in the process of technological evolution. New technologies are not built up from scratch but are the result of new combinations of existing technologies [27]. This indicates that temporality is a key characteristic of technology, and plays an essential role in technological foresight. To achieve more objective results in technology forecasting, this study first divided the technology lifecycle before conducting topic identification. Given the low number of patent applications in the B25J category before 2008, this study considered patents published between 2008 and 2022. The technology lifecycle was fitted using a logistic growth curve, as shown in the following equation:
N ( t ) = K 1 + e r ( t t 0 )
After using Origin2024 software for nonlinear fitting, we obtained the technology lifecycle S curve as shown in Figure 4. Based on the mathematical characteristics of the fitted curve, we have identified the key turning points. The inflection point of the curve, which is the point with the fastest growth rate ( d 2 N / d t 2 = 0 ), appeared in 2019, marking the transition of technology from a period of rapid growth to a mature stage. We further use 2014, when growth began to significantly accelerate, as did the boundary between the germination and growth stages, and 2021, when growth rates began to noticeably slow down, as did the boundary between the maturity and decline stages. The fitting results revealed key turning points in the technology lifecycle in 2014, 2019, and 2021. From this, four distinct technological development stages were identified.
Stage 1 (2008–2014), Stage 2 (2014–2019), Stage 3 (2019–2021), and Stage 4 (2021–2022). In Stage 1, the number of patent applications is low, indicating significant potential for technology development. In Stage 2, the rate of patent growth accelerates, suggesting that the technology is in a rapid growth phase. In Stage 3, the growth rate of patents slows, marking the transition to a maturity phase, where the number of patents peaks. In Stage 4, the number of patent applications stabilizes, and the S-curve shows a slow decline. This could be attributed to the 18-month technical review period for patents [28], which led to a slight underestimation of the patent counts for 2021 and 2022. Thus, Stage 4 was analyzed separately, with ongoing monitoring in future research. Since the focus of this study is not on the identification of technology stages but rather on using these stages as temporal divisions to construct topic evolution paths for technological forecasting, this division does not impact the overall research.

3.3. Topic Identification and Visualization

3.3.1. LDA Model Training

The Latent Dirichlet Allocation (LDA) model advances traditional topic identification through its unsupervised hierarchical Bayesian framework, which probabilistically infers latent technological features from document–word distributions [29,30]. Unlike conventional approaches employing subject–action–object (SAO) vectors or keyword frequency matrices, LDA operates via a three-layer architecture that models document generation as a stochastic process of topic sampling (governed by Dirichlet priors α and β). As shown in Figure 5, the model iteratively optimizes these hyperparameters through Gibbs sampling, converging on an optimal topic configuration (K) that maximizes the posterior probability of the observed word distributions. This process enables the automated discovery of coherent technological themes while preserving the semantic relationships between terminological variants.
The LDA modeling process is initiated by sampling document–topic distributions from a Dirichlet prior (α), followed by iterative word–topic assignments through multinomial distributions governed by hyperparameter β. For each document, this generative process sequentially selects (1) a topic distribution from Dirichlet(α), (2) specific topics per word position via multinomial sampling, and (3) words from topic-specific multinomial distributions. Through M iterations across N documents, the algorithm converges to stable topic–word and document–topic distributions, effectively modeling latent technological relationships that conventional methods obscure [29]. Figure 5 illustrates this hierarchical Bayesian inference mechanism, highlighting its capacity to decode implicit knowledge structures in the patent literature.
Determine the optimal topic count (K) transitions from subjective estimation to data-driven selection through perplexity minimization. Defined as the exponential of the negative log-likelihood per word, perplexity quantifies model uncertainty in predicting an unseen document [31]. This study systematically evaluates K ∈ [1,10] across 12 sub-datasets (four lifecycle stages × three analytical dimensions), identifying Kopt, where the perplexity plateaus (Figure 6). The x/y-axes denote candidate topic numbers and the corresponding perplexity values, respectively, with minima indicating optimal model configurations [32]. This empirical approach eliminates arbitrary K selections while ensuring semantic coherence in the extracted technological themes.

3.3.2. Topic Visualization

Following optimal topic count (K) determination, the trained LDA model undergoes semantic visualization via pyLDAvis, an interactive web interface built upon LDAvis that spatially maps topic–keyword relationships through dimensionality reduction [33]. As illustrated in Figure 7, this visualization framework simultaneously encodes three critical dimensions: (1) intertopic distances (reflecting conceptual dissimilarity), (2) keyword saliency (term frequency–inverse topic frequency metrics), and (3) topic prevalence (proportional document coverage). The resultant topology enables intuitive exploration of technological theme evolution, with sphere positions indicating semantic proximity, and diameters representing topic strength across lifecycle stages.

3.4. Topic Evolution Analysis

3.4.1. Topic Strength Calculation

To quantify the relative importance of different topics in the process of technological evolution, this study introduces the “Topic Intensity” metric. This metric is designed to measure the prevalence or dominance of a specific topic within a particular lifecycle stage and analytical dimension (novelty, use, advantage).
Specifically, Topic Intensity is calculated from the marginal topic distribution derived from the pyLDAvis visualization output. In the intertopic distance map generated by pyLDAvis (as shown in Figure 7), each topic is represented by a circular bubble, where the area of the bubble is proportional to the intensity of the topic. A larger bubble signifies that the topic accounts for a higher proportion of the corresponding patent literature corpus—that is, more tokens have been assigned to this topic by the model—thereby indicating its centrality in the innovation discourse of that period.
Therefore, Table 1 does not present a distribution of the most dominant topic but rather the individual intensity scores for all topics. Through these scores, we can objectively identify high-intensity core technology themes across all stages and dimensions. For standardized classification, topics marked with an asterisk (*) in the table indicate that their intensity exceeds a threshold of the average intensity (μ) plus 0.5 times the standard deviation (σ) for that dimension, thus being identified as high-intensity topics.

3.4.2. Topic Continuity Analysis

Thematic continuity across lifecycle stages was quantified through cosine similarity analysis of topic keyword distributions, with coefficients ∈[0,1] reflecting the semantic overlap intensity. A conservative threshold (θ = 0.2) was applied to filter transient topics, retaining only persistent thematic clusters exhibiting cross-stage continuity. The heatmap visualization (Figure 8) organizes these relationships across three transitional intervals: (left) emergence-to-growth, (center) growth-to-maturity, and (right) maturity-to-decline phases. The chromatic gradient (blue: low similarity, red: high) reveals the evolutionary pathways within each analytical dimension (novelty/use/advantage), where diagonally aligned high-similarity clusters (red zones) indicate stable technological trajectories. Continuity mapping establishes the empirical foundation for technology roadmap construction by identifying dominant innovation pathways that are resilient to temporal fragmentation.

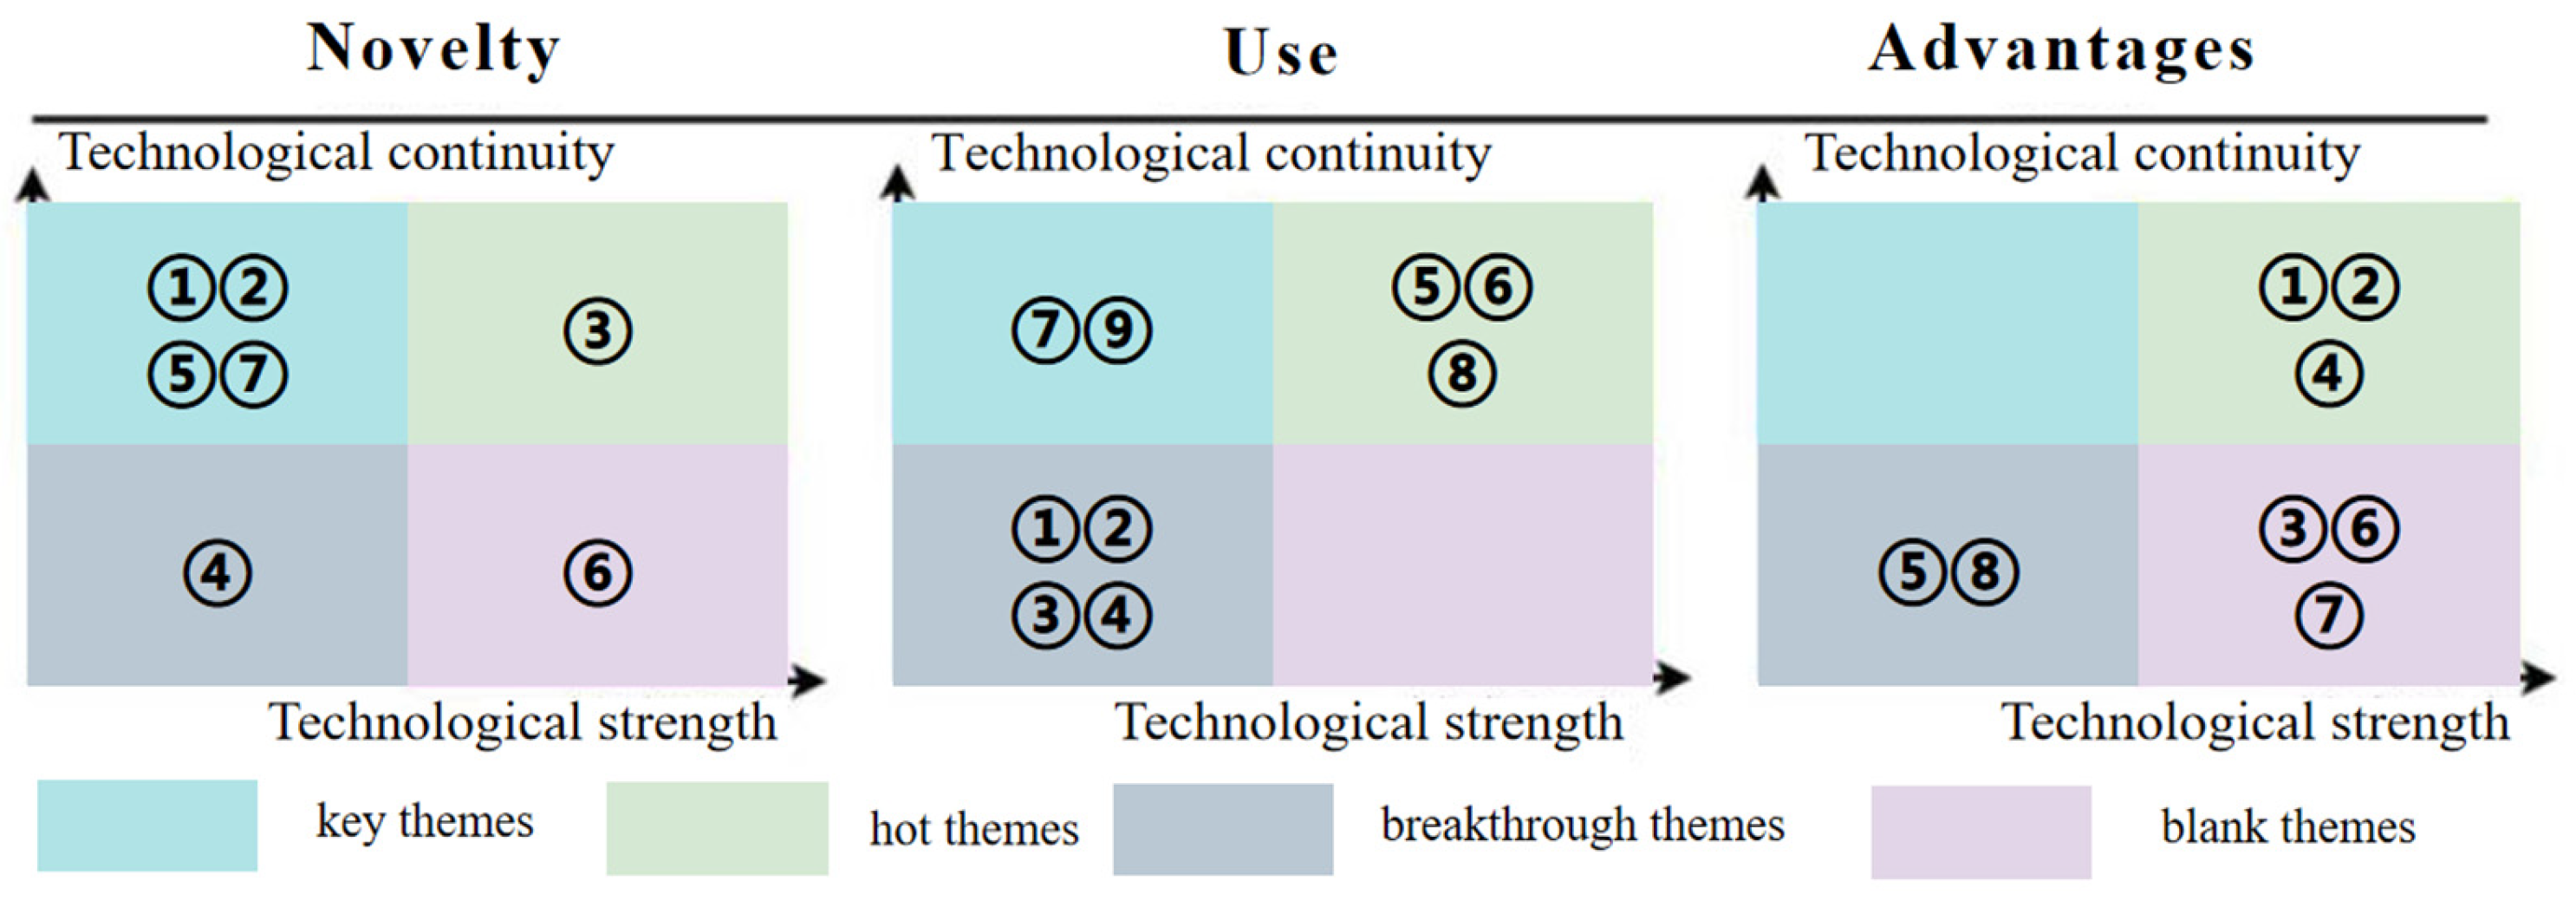
3.4.3. Topic Type Classification

Technological themes were systematically classified through a dual-criteria framework integrating topic strength (weighted averages normalized to dimension-specific baselines) and continuity (cross-stage persistence frequency quantified using cosine similarity thresholds). As depicted in Figure 9, this taxonomy delineates four strategic categories spatially mapped by chromatic encoding.
Key Themes (Green): These themes possess both high strength (e.g., an intensity value greater than the mean μ plus one standard deviation σ) and high continuity (e.g., persisting across three or more lifecycle stages). They represent the entrenched, continuously developing core technologies within the field and are the cornerstone for long-term R&D investment.
Hot Themes (Purple): These themes exhibit high strength but have lower continuity (e.g., appearing concentrated in only one or two stages). They represent emerging technological hotspots with rapidly increasing attention, which may be rapidly iterating fields or transient technological trends.
Breakthrough Themes (Blue): These themes have lower intensity (e.g., below the mean μ) but possess high continuity. They represent potential disruptive technologies in nascent or niche markets, accumulating potential through continuous incremental innovation and meriting strategic attention and investment.
Blank Themes (Gray): These themes are low in both strength and continuity. They typically reflect outdated, obsolete, or extremely niche technological directions, strategically warranting consideration for divestment or reduced focus [34].
The integrated visualization framework (Figure 9) and technology roadmap enabled the systematic identification of thematic archetypes across the novelty, application, and advantage dimensions. As exemplified in the novelty analysis, Topic 3 emerged as the predominant key theme, demonstrating sustained strength indices exceeding μ+2σ across all lifecycle stages alongside uninterrupted continuity (cosine similarity >0.6 between adjacent phases). Concurrently, hot themes manifest as transient high-intensity clusters in growth phases (e.g., Topic 7 in 2014–2019), whereas breakthrough themes exhibit latent persistence in early stage maturation (e.g., Topic 12’s cross-phase continuity despite sub-μ strength). Table 2 codifies these classifications, mapping 12 prioritized topics to their constituent technological features—such as \”sensor fusion algorithms\” dominating novelty’s key themes, and \”adaptive gripper mechanisms\” characterizing advantage-focused breakthroughs—thereby operationalizing the taxonomy for strategic decision making in industrial R&D prioritization.

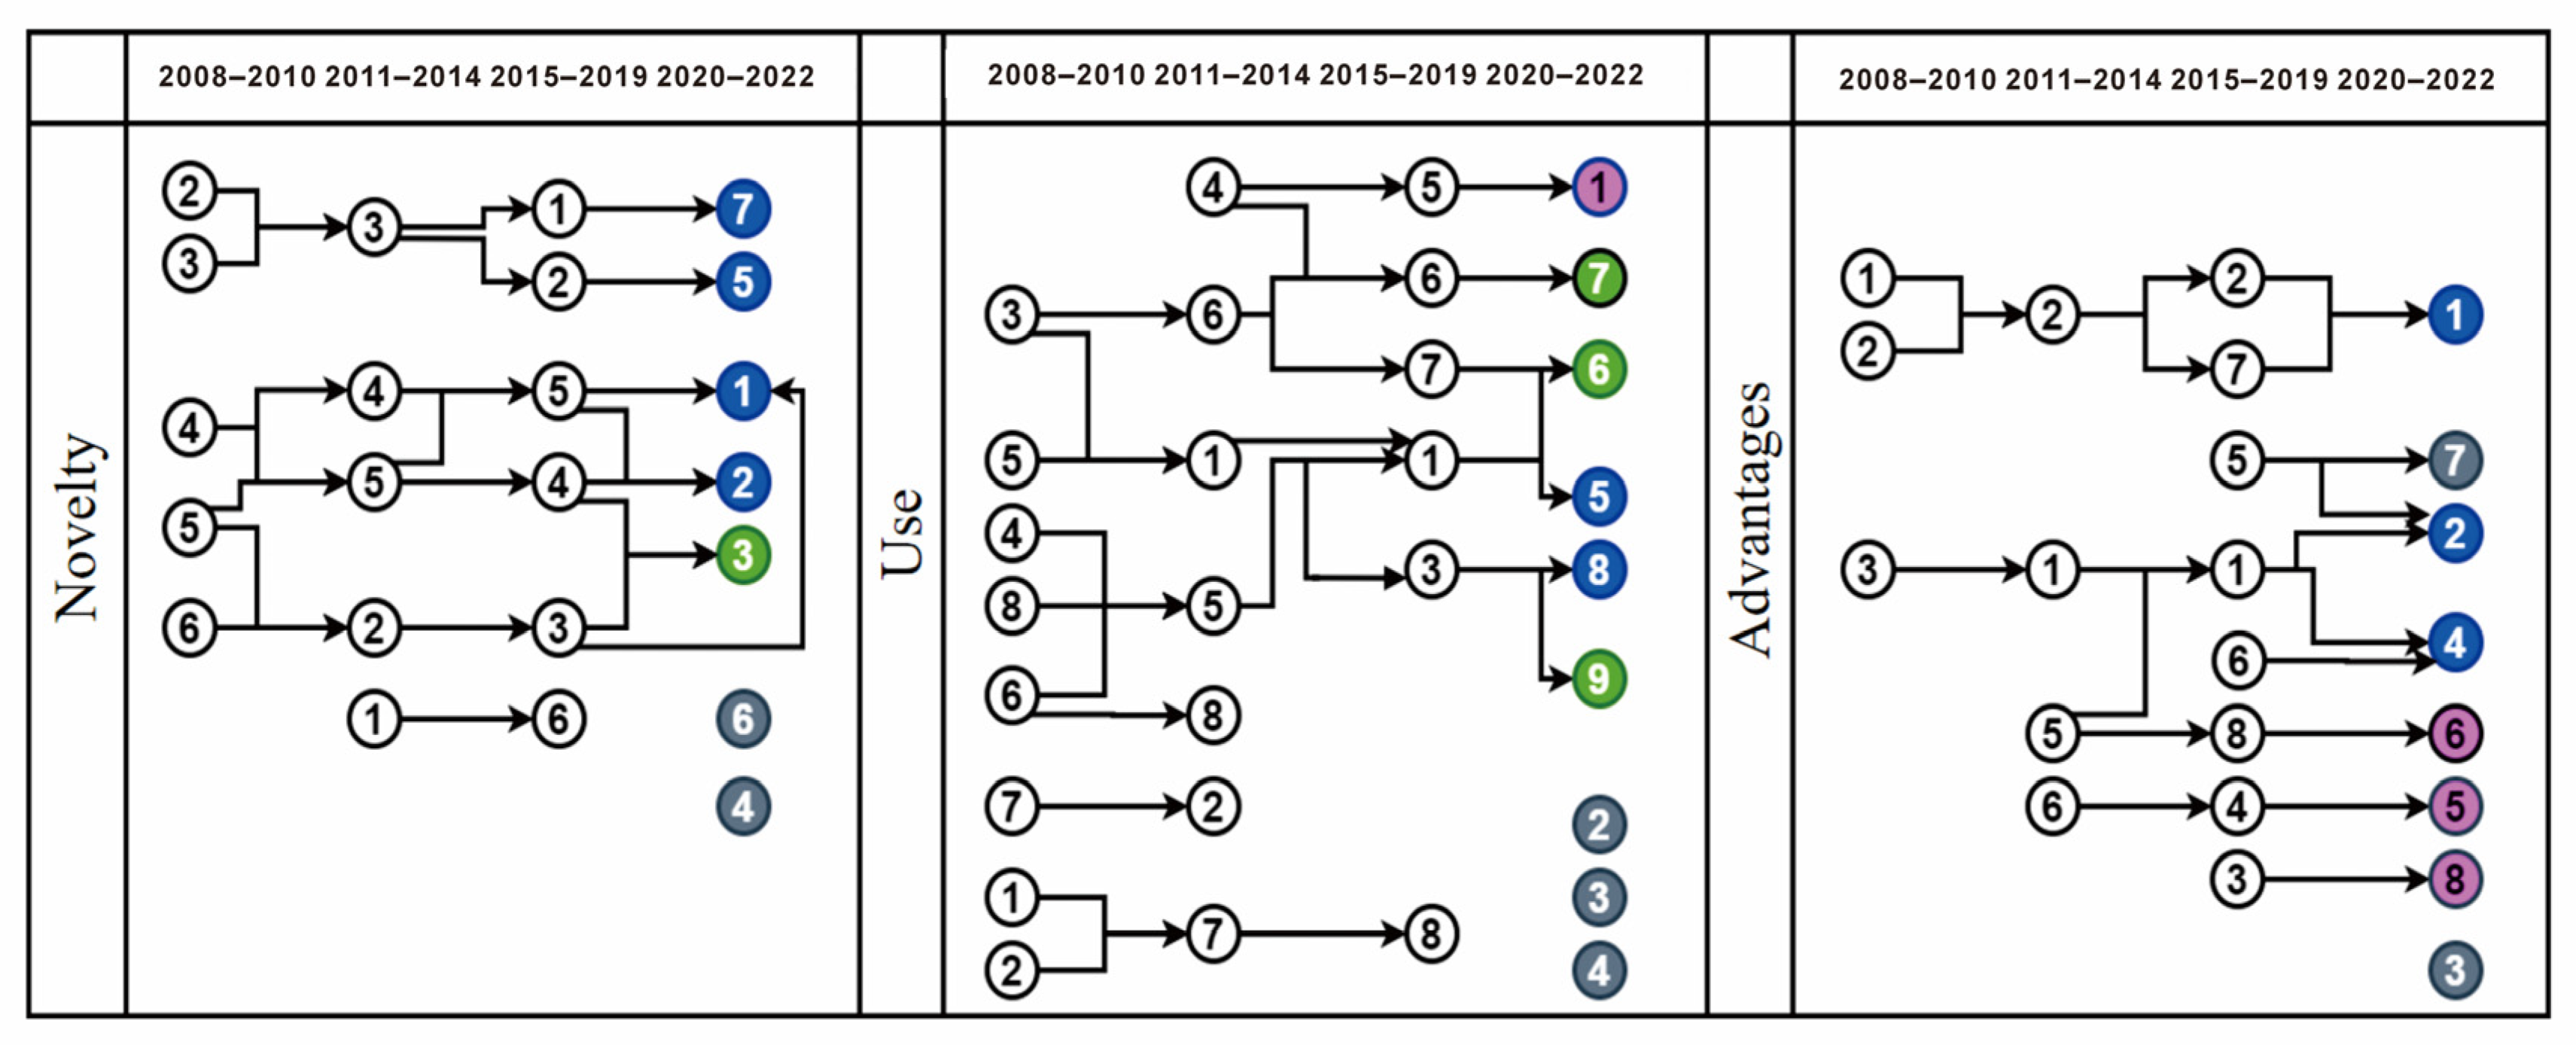
3.4.4. Construction of Technical Roadmap

The construction of the technology evolution roadmap (Figure 10) is designed to translate the aforementioned quantitative analysis results into a visual and interpretable innovation pathway. Its construction process is as follows: First, the continuity between topics is measured by calculating the cosine similarity of the keyword distributions of topics in adjacent lifecycle stages. When the cosine similarity between two topics exceeds a preset threshold of 0.2, we determine that an evolutionary association exists between them and represent it with a connecting line on the roadmap. Subsequently, each topic node is color-coded according to its strategic category (Key, Hot, Breakthrough, Blank) as determined in Section 3.4.3. The final technology foresight diagram (Figure 10) is then built upon this roadmap, providing a qualitative interpretation of the most significant evolutionary paths (particularly those of key and hot themes) and translating abstract topic transitions into a concrete narrative of technological trends. As demonstrated in Figure 10, prolonged connectors between sequential stages (e.g., Stage 1 → 2 key theme linkages) signify stable technological evolution, whereas fragmented connections (e.g., Stage 3 → 4 hot theme discontinuities) reveal innovation bottlenecks. Through the systematic integration of strength indices, continuity metrics, and lifecycle dynamics, this roadmap enables stakeholders to prospectively identify (1) sustainable core technologies warranting investment, (2) transient innovations requiring continuity reinforcement, and (3) latent opportunities poised for exponential growth, thereby operationalizing foresight insights for strategic R&D planning.

3.4.5. Technology Forecasting Results Analysis

The technology forecasting diagram (Figure 11) systematically visualizes the evolutionary trajectories of the three critical dimensions in patent abstract analysis through subplots (a), (b), and (c). For instance, Key Topic 3 in the novelty dimension (green section, Figure 11a) demonstrates dual evolutionary pathways: one progressing mechanically from wheel-fixed axle technology to wheel-lifting telescopic technology, and ultimately to telescopic spring technology, whereas the other advances through directional clamping → molding clamping → fixed connection mechanisms. This bifurcation illustrates the concurrent mechanical and functional innovations in robotic-arm systems.
The evolution within the Use dimension (Figure 11b) provides critical insights into the technology’s market trajectory. For instance, the path of Key Topic 5 from “mobile home cleaning” to “advanced learning computer systems” signifies a crucial market expansion from consumer-grade applications to high-value enterprise solutions. Similarly, the emergence of “medical robot” (Table 2) as a key application area reflects the growing demand within the global healthcare market for high-precision, minimally invasive surgical solutions. This indicates that the technology is successfully transitioning from its traditional industrial base into new commercial arenas driven by specific market needs. Key Topic 6 evolves from rechargeable robotic arms through camera vision detection to integrated control/calibration systems, emphasizing applications in vision-based detection, control optimization, and system integration. These advancements collectively highlight the expanding scope of robotic-arm technology, particularly in areas such as computational learning, sensor integration, and system-level automation.
The Advantage dimension (Figure 11c) reveals the core drivers of product competitiveness. The consistent dominance of themes like “enhanced production efficiency” (Key Topic 1) is not merely a technical goal but a critical value proposition for end-users. Innovations contributing to this theme directly translate into tangible product benefits such as reduced operational costs, higher throughput, and improved return on investment. This underscores that successful products in this domain are those that can demonstrably enhance the economic efficiency of their users’ operations, thereby creating a strong competitive edge in the marketplace. Key Topic 2 evolves through positional control → target sensor integration → control signal image alignment → coordinate system synchronization, whereas Key Topic 4 emerges from foundational recognition operation programs. These developments collectively underscore persistent technical strengths in operational efficiency enhancement, sensor-based control refinement, and automated process recognition, which are key enablers validated through iterative technological implementations.
Analysis of the four-stage evolutionary patterns reveals that key topics consistently demonstrate exceptional performance in core domains, including telescopic actuation systems, structural fixation mechanisms, computational learning paradigms, control/sensor integration, production optimization, and system alignment protocols. Their sustained prominence reflects both technological maturity and research prioritization, indicating a strong correlation between topic persistence and industrial relevance.
Hot topics, characterized by high patent activity and innovation potential, currently dominate areas such as stacking positioning improvements (Use dimension, Hot Topic 7) and gripper friction reduction/remote monitoring/system fault mitigation (Advantage dimension, Topics 6 and 7). These high-impact innovations represent immediate technological frontiers with a significant potential for industry disruption. Breakthrough topics (blue sections), though less mature, exhibit promising continuity in mechanical system innovations (Novelty Topics 1, 2, and 5) and adaptive control algorithms (Use Topics 1, 8, and 9), signaling emerging research directions meriting strategic investment. Conversely, underexplored domains (gray sections), including vacuum/underwater robotics (Novelty Topics 4/6) and autonomous operation systems (Use Topics 2–4, Advantage Topics 3/5/8), present limited development potential but require ongoing monitoring for niche applications.
This analysis revealed a clear trajectory toward smartification and automation in robotic arm technology, with computational intelligence and system integration emerging as the dominant innovation drivers. Strategic recommendations include prioritizing sensor/actuator advancements to enhance precision in industrial automation, accelerating intelligent detection system development, and fostering AI-driven adaptive programming frameworks. Future research should maintain leadership in core areas while exploring palletizing robots (mobile technology strengths) and potential breakthroughs in medicine and assembly robotics. Underexplored domains require proactive R&D to mitigate competitive risks and ensure comprehensive technological preparedness for Industry 4.0.

4. Discussion

4.1. Methodological Contributions

This study makes several notable methodological contributions to the field of technology forecasting. First, we introduce a perplexity-optimized Latent Dirichlet Allocation (LDA) model for topic identification, effectively addressing the common issue of parameter uncertainty in traditional LDA applications. This approach enhances the reliability of the topic extraction process, making it more robust in predicting technological trends. The use of perplexity as an objective measure for optimizing the number of topics has proven to be an effective strategy for improving the accuracy of the model.
Additionally, this study performed an in-depth analysis of technological features across three dimensions: novelty, application, and advantage. This multidimensional approach provides a comprehensive framework for understanding the evolution of technological characteristics, enabling a deeper exploration of technological trends. By integrating technology lifecycle theory with topic modeling, we developed a technology roadmap that visualizes the evolution of key technological themes over time. This combined approach, which evaluates both topic strength and continuity, offers a more thorough analysis of technological trends and provides clearer insights into their long-term trajectories.

4.2. Practical Implications

This research also has significant practical implications for both industry and academia. Several key areas that could drive further innovation have been identified from a research and development perspective. Our findings offer actionable intelligence by linking technology, market, and product dimensions. For instance, the roadmap shows that R&D in ”sensor fusion” and “adaptive control algorithms” (Novelty/Technology dimension) should be directly guided by the market demand for “human–robot collaboration” (Use/Market dimension). The goal is to create products with tangible competitive benefits, such as enhanced safety features and intuitive user interfaces (Advantage/Product dimension), which are critical for market adoption. This integrated approach ensures that technological advancements are not pursued in isolation but are strategically aligned with market opportunities and product differentiation, ultimately leading to more commercially successful innovations. These innovations have the potential to significantly enhance the efficiency and effectiveness of robotic systems, thereby making them more capable across a wide range of tasks.
In terms of investment, our study highlights smart detection systems and human–robot collaboration as promising areas for future investment. These fields have the potential to transform industry by enhancing automation and improving safety, efficiency, and productivity. Companies should prioritize investments in these areas to remain competitive and meet the growing demand for advanced automation technologies in sectors such as manufacturing and healthcare.
Furthermore, we identify emerging applications in fields such as microoperation, underwater tasks, and autonomous systems. As robotic technology continues to evolve, these applications are expected to gain greater significance, particularly as industries seek to leverage automation in increasingly complex environments. Robotics in these areas could offer solutions for industries dealing with challenges, such as hazardous environments or the need for precision in small-scale operations.

5. Conclusions

This study proposes a method for constructing a technology roadmap based on patent abstract mining, which integrates an optimized LDA topic model and technology lifecycle theory to systematically analyze the evolutionary path of AI-powered manipulator technology. By analyzing 113,449 patents under the highly concentrated B25J classification globally, this study reveals that the core innovations in this field are primarily focused on precision control and intelligent detection, while medical robotics, human–robot collaboration, and autonomous navigation emerge as the most promising future application directions. This research not only validates the effectiveness of the method in identifying key innovation hotspots and revealing technological evolution trends but also provides valuable, data-driven decision support for R&D strategies and policymaking in related fields.

5.1. Limitations of the Study

While this study provides a robust analytical framework and valuable insights, it is necessary to acknowledge several limitations, which point to directions for future research.
First, regarding the nature of “foresight” in this study. The analysis in this research is designed to identify and interpret historical evolutionary paths to generate strategic intelligence, which is a core function of technology roadmapping. However, it is not a quantitative forecasting model and cannot predict the probability or specific timing of future events. The interpretation of topic evolution inherently involves qualitative judgment. Therefore, the “foresight” provided by this study should be understood as strategic inference based on identified trends, rather than deterministic prediction. This is consistent with the strategic planning goal of technology roadmapping, which aims to support decision making in uncertain environments.
Second, regarding the scope and representativeness of the patent data. This study adopts a data-driven approach, selecting the B25J classification as a case study due to its empirical dominance in global AI-related patents. However, global patenting activity is not geographically uniform, and innovation activities in high-output jurisdictions can significantly influence trend observations within a single IPC classification. Consequently, this study reflects the de facto global innovation landscape of this specific field but does not standardize for the disparate patenting propensities among different countries. If the research question was focused on comparing the relative innovative output of specific nations, analyzing transnational patent families—patents for which protection is sought in multiple jurisdictions—would be a superior approach. Transnational patent families can effectively filter for higher-value inventions and neutralize “home-country advantage,” thereby providing a more balanced global view of innovation.
Third, regarding the selection of the technology focus. While B25J (programmable manipulators) is the most prominent IPC classification in our initial dataset at 21%, G06N (computer systems based on specific computational models) also represents a very significant portion at 20%. Our data-driven decision to focus on B25J was based on its status as the single largest category, allowing for an in-depth case study of AI’s application in a key physical domain. However, we acknowledge that this focus creates a potential bias. The study’s findings are more reflective of the innovation trends in the mechanical and mechatronic applications of AI, rather than the entire AI technology landscape. The exclusion of G06N, which often pertains to core AI algorithms and software-based systems, means that our analysis may underrepresent crucial developments in the foundational models that drive the physical systems in B25J. A future comparative study analyzing the interplay and evolutionary trajectories of both B25J and G06N would provide a more holistic and balanced view of the AI innovation ecosystem.

5.2. Directions for Future Research

The limitations of this study open up several promising avenues for future work.
Introducing Transnational Patent Families for Analysis: A highly valuable subsequent study would be to apply this research’s roadmapping framework to a dataset of transnational patent families within the B25J classification. By focusing on inventions that seek protection in multiple key markets such as the United States, Europe, and Japan, the analysis could filter for higher-value, global innovations. This would provide a perspective on the global technology trajectory that is weighted by geographical and economic value, complementing the findings of the current study.
Applying Supervised Topic Models to Enhance Objectivity: To address the qualitative nature of topic interpretation, future research could employ supervised or semi-supervised topic models, such as Supervised Latent Dirichlet Allocation (sLDA). The unsupervised LDA used in this study identifies topics based solely on word co-occurrence. In contrast, sLDA can integrate external metadata—such as patent citation counts, patent family size, or even grant status—as a supervisory signal. This would enable the model to discover latent topics that are not only thematically coherent but also statistically predictive of a patent’s impact or value, thereby adding a layer of objectivity to the analysis of technological evolution and reducing reliance on subjective interpretation.
Expanding to Adjacent Technology Fields: Finally, the analytical framework developed in this study can be extended to other key robotics technology fields within the context of Industry 4.0, such as welding (B23K) and transport and storage (B65G). This would allow for the construction of a more comprehensive, cross-domain innovation map for industrial automation, providing a broader perspective for understanding the technological evolution of the entire smart manufacturing ecosystem.

Author Contributions

Conceptualization, Y.Z. and G.Z.; methodology, G.Z.; software, Y.Z.; resources, X.Z. and G.Z.; data curation, Z.L. and X.Z.; writing—original draft, Z.L., R.Z. and X.Z.; writing—review and editing, Y.Z. and G.Z.; funding acquisition, X.Z. and G.Z. All authors have read and agreed to the published version of the manuscript.

Funding

This research was funded by the Talent Program of the State Administration for Market Regulation, grant number QNBJ202319; the research project of Fujian Provincial Market Supervision Bureau, grant number FJMS2023016; the Fujian Key Laboratory of Special Intelligent Equipment Safety Measurement and Control for the Open fund, grant number FJIES2023KF09; the National Social Science Project, grant number 24BTQ045; and the Graduate Research Innovation Project of Tianjin Normal University, grant number 2024KYCX148F.

Institutional Review Board Statement

Not applicable.

Informed Consent Statement

Not applicable.

Data Availability Statement

The data are not publicly available because they are part of a larger project involving more researchers. If you have any questions, please ask the contact author.

Conflicts of Interest

The authors declare no conflicts of interest.

References

  1. Schatzmann, J.; Schäfer, R.; Eichelbaum, F. Foresight 2.0-Definition, Overview & Evaluation. Eur. J. Futures Res. 2013, 1, 1–15. [Google Scholar]
  2. Alsan, A.; Atilla Oner, M. An Integrated View of Foresight: Integrated Foresight Management Model. Foresight 2003, 5, 33–45. [Google Scholar] [CrossRef]
  3. Weng, Y. Big Data and Machine Learning in Defence. Int. J. Comput. Sci. Inf. Technol. 2024, 16, 25–35. [Google Scholar] [CrossRef]
  4. Hashemkhani Zolfani, S.; Salimi, J.; Maknoon, R.; Kildienė, S. Technology Foresight about R&D Projects Selection; Application of SWARA Method at the Policy Making Level. Eng. Econ. 2015, 26, 571–580. [Google Scholar]
  5. Fink-Hafner, D.; Dagen, T.; Doušak, M.; Novak, M.; Hafner-Fink, M. Delphi Method: Strengths and Weaknesses. Adv. Methodol. Stat. 2019, 16, 1–19. [Google Scholar] [CrossRef]
  6. Gnatzy, T.; Warth, J.; von der Gracht, H.; Darkow, I.L. Validating an Innovative Realtime Delphi Approach—A Methodological Comparison Between Real-Time and Conventional Delphi Studies. Technol. Forecast. Soc. Change 2011, 78, 1681–1694. [Google Scholar] [CrossRef]
  7. McBurney, M.K.; Novak, P.L. What Is Bibliometrics and Why Should You Care? In Proceedings of the IEEE International Professional Communication Conference, Portland, OR, USA, 17–20 September 2002; pp. 108–114. [Google Scholar]
  8. Krestel, R.; Chikkamath, R.; Hewel, C.; Risch, J. A Survey on Deep Learning for Patent Analysis. World Pat. Inf. 2021, 65, 102035. [Google Scholar] [CrossRef]
  9. Zhang, L.; Liu, Z. Research on Technology Prospect Risk of High-Tech Projects Based on Patent Analysis. PLoS ONE 2020, 15, e0240050. [Google Scholar] [CrossRef]
  10. Tseng, Y.H.; Lin, C.J.; Lin, Y.I. Text Mining Techniques for Patent Analysis. Inf. Process. Manag. 2007, 43, 1216–1247. [Google Scholar] [CrossRef]
  11. Abuhay, T.M.; Nigatie, Y.G.; Kovalchuk, S.V. Towards Predicting Trend of Scientific Research Topics Using Topic Modeling. Procedia Comput. Sci. 2018, 136, 304–310. [Google Scholar] [CrossRef]
  12. Baruffaldi, S.; van Beuzekom, B.; Dernis, H.; Harhoff, D.; Rao, N.; Rosenfeld, D.; Squicciarini, M. Identifying and measuring developments in artificial intelligence: Making the impossible possible. In OECD Science, Technology and Industry Working Papers 2020/05; OECD: Paris, France, 2020. [Google Scholar] [CrossRef]
  13. Wu, H.; Yi, H.; Li, C. An Integrated Approach for Detecting and Quantifying the Topic Evolutions of Patent Technology: A Case Study on Graphene Field. Scientometrics 2021, 126, 6301–6321. [Google Scholar] [CrossRef]
  14. Song, B.; Suh, Y. Identifying Convergence Fields and Technologies for Industrial Safety: LDA-Based Network Analysis. Technol. Forecast. Soc. Change 2019, 138, 115–126. [Google Scholar] [CrossRef]
  15. Li, X.; Xie, Q.; Daim, T.; Huang, L. Forecasting Technology Trends Using Text Mining of the Gaps Between Science and Technology: The Case of Perovskite Solar Cell Technology. Technol. Forecast. Soc. Change 2019, 146, 432–449. [Google Scholar] [CrossRef]
  16. Erzurumlu, S.S.; Pachamanova, D. Topic Modeling and Technology Forecasting for Assessing the Commercial Viability of Healthcare Innovations. Technol. Forecast. Soc. Change 2020, 156, 120041. [Google Scholar] [CrossRef]
  17. Garzaniti, N.; Tekic, Z.; Kukolj, D.; Golkar, A. Review of Technology Trends in New Space Missions Using a Patent Analytics Approach. Prog. Aerosp. Sci. 2021, 125, 100727. [Google Scholar] [CrossRef]
  18. Wang, J.; Fan, Y.; Zhang, H.; Feng, L. Technology Hotspot Tracking: Topic Discovery and Evolution of China’s Blockchain Patents Based on a Dynamic LDA Model. Symmetry 2021, 13, 415. [Google Scholar] [CrossRef]
  19. Zhang, L.; Li, L.; Li, T. Patent Mining: A Survey. ACM Sigkdd Explor. Newsl. 2015, 16, 1–19. [Google Scholar] [CrossRef]
  20. Bisinella, V.; Christensen, T.H.; Astrup, T.F. Future Scenarios and Life Cycle Assessment: Systematic Review and Recommendations. Int. J. Life Cycle Assess. 2021, 26, 2143–2170. [Google Scholar] [CrossRef]
  21. Chang, S.H.; Fan, C.Y. Identification of the Technology Life Cycle of Telematics: A Patent-Based Analytical Perspective. Technol. Forecast. Soc. Change 2016, 105, 1–10. [Google Scholar] [CrossRef]
  22. Blei, D.M.; Ng, A.Y.; Jordan, M.I. Latent Dirichlet Allocation. J. Mach. Learn. Res. 2003, 3, 993–1022. [Google Scholar]
  23. Clarivate Analytics. Derwent Innovations Index Enhances Searchability and Discoverability of Patent Data. Available online: https://www.lib.u-tokyo.ac.jp/sites/default/files/database/manual/Derwent-Innovations-Index_User-Guide-Mar-2022 (accessed on 1 April 2024).
  24. Yoo, Y.; Lim, D.; Kim, K. Artificial Intelligence Technology Analysis Using Artificial Intelligence Patent Through Deep Learning Model and Vector Space Model. arXiv 2021, arXiv:2111.11295. [Google Scholar]
  25. Pan, D.; Ren, X.; Zhang, L.; Song, Z.; Nie, Y.; Zhang, L.; Ma, M.; Han, D. A Disruptive Technology Identification Method for New Power Systems Based on Patent Evolution Analysis. Electronics 2023, 12, 2045. [Google Scholar] [CrossRef]
  26. Ulmschneider, K.; Glimm, B. Semantic Exploitation of Implicit Patent Information. In Proceedings of the 2016 IEEE Symposium Series on Computational Intelligence (SSCI), Athens, Greece, 6–9 December 2016; pp. 1–8. [Google Scholar]
  27. Fink, T.M.A.; Teimouri, A. The Mathematical Structure of Innovation. arXiv 2019, arXiv:1912.03281. [Google Scholar]
  28. Lee, M. An Analysis of the Effects of Artificial Intelligence on Electric Vehicle Technology Innovation Using Patent Data. World Pat. Inf. 2020, 63, 102002. [Google Scholar] [CrossRef]
  29. Jelodar, H.; Wang, Y.; Yuan, C.; Feng, X. Latent Dirichlet Allocation (LDA) and Topic Modeling: Models, Applications, a Survey. Multimed. Tools Appl. 2019, 78, 15169–15211. [Google Scholar] [CrossRef]
  30. Fang, Y.; Si, L.; Somasundaram, N.; Yu, Z. Mining Contrastive Opinions on Political Texts Using Cross-Perspective Topic Model. In Proceedings of the 5th ACM International Conference on Web Search and Data Mining, Seattle, WA, USA, 8–12 February 2012; pp. 63–72. [Google Scholar]
  31. Anupriya, A.P.; Karpagavalli, S. LDA Based Topic Modeling of Journal Abstracts. In Proceedings of the 2015 International Conference on Advanced Computing and Communication Systems, Coimbatore, India, 5–7 January 2015; pp. 1–5. [Google Scholar]
  32. Yang, C.; Huang, C.; Su, J. A Bibliometrics-based research Framework for Exploring Policy Evolution: A Case Study of China’s Information Technology Policies. Technol. Forecast. Soc. Change 2020, 157, 120116. [Google Scholar] [CrossRef]
  33. Gao, Q.; Jiang, M. Exploring Technology Fusion by Combining Latent Dirichlet Allocation with Doc2vec: A Case of Digital Medicine and Machine Learning. Scientometrics 2024, 129, 4043–4070. [Google Scholar] [CrossRef]
  34. Haleem, A.; Mannan, B.; Luthra, S.; Kumar, S.; Khurana, S. Technology Forecasting (TF) and Technology Assessment (TA) Methodologies: A Conceptual Review. Benchmarking Int. J. 2019, 26, 48–72. [Google Scholar] [CrossRef]
Figure 1. Research flowchart.
Informatics 12 00069 g001
Figure 2. Breakdown of IPC fields.
Informatics 12 00069 g002
Figure 3. IPC distribution map.
Informatics 12 00069 g003
Figure 4. Fitted technology lifecycle curve. The red box indicates the start and end times of the data collection period.
Informatics 12 00069 g004
Figure 5. LDA schematic diagram.
Informatics 12 00069 g005
Figure 6. Topic perplexity.
Informatics 12 00069 g006
Figure 7. Topic visualization diagram.
Informatics 12 00069 g007
Figure 8. Topic similarity heatmap.
Informatics 12 00069 g008
Figure 9. Types of patent technology themes.
Informatics 12 00069 g009
Figure 10. Technology roadmap.
Informatics 12 00069 g010
Figure 11. Technical foresight diagram. (a) Technology path based on Novelty, focusing on the evolution of hardware components and systems; (b) Technology path based on Use, illustrating how core functions lead to specific applications; (c) Technology path based on Advantage, focusing on topics related to improving efficiency and performance.
Informatics 12 00069 g011
Table 1. Topic intensity table.
NoveltyUseAdvantages
Topic 10.114Topic 10.106Topic 10.132 *
Topic 20.162Topic 20.07Topic 20.126 *
Topic 30.288 *Topic 30.103Topic 30.125 *
Topic 40.072Topic 40.094Topic 40.15 *
Topic 50.143Topic 50.202 *Topic 50.084
Topic 60.61Topic 60.131 *Topic 60.171 *
Topic 7 0.16Topic 7 0.096Topic 7 0.16 *
Topic 80.114 *Topic 80.051
Topic 90.085
Average0.221Average0.111Average0.125
Note: * indicates that their intensity exceeds a threshold of the average intensity (μ) plus 0.5 times the standard deviation (σ) for that dimension.
Table 2. Subject matter of patent abstract.
Keyword
Novelty1, gripper, actuator, rotation, assembly, connector
2, motor, mechanical, wheel, rotating, driven
3, connecting, fixing, sliding, supporting, clamping
4, device, welding, track, storage, pipeline
5, control, supply, robot, circuit, infrared
6, coordinate, system, calibration, point, positioning
7, target, value, method, parameter, robot
Use1, structure, mechanical, artificial, articulated, wearable
2, smart, dimensional, multifunctional, underwater, auxiliary
3, robotic, gripper, effector, handling, testing
4, guide, mechanism, unmanned, parallel, sensing
5, method, controlling, computer, planning, learning
6, system, control, detection, calibration, position
7, monitoring, drive, safety, integrated, distribution
8, industrial, medical, robot, production, clamping
9, workpiece, apparatus, processing, picking, holding
Advantages1, improves, problem, efficiency, production, working
2, sensor, position, target, calibration, coordinate
3, cable, medical, charging, service, micro
4, operator, manipulator, recognition, operation, control
5, gripper, object, actuator, suction, radiating
6, rotating, clamping, drive, mechanism, motor
7, inspection, improving, environment, monitoring, learning
8, water, pressure, elastic, element, protective
Disclaimer/Publisher’s Note: The statements, opinions and data contained in all publications are solely those of the individual author(s) and contributor(s) and not of MDPI and/or the editor(s). MDPI and/or the editor(s) disclaim responsibility for any injury to people or property resulting from any ideas, methods, instructions or products referred to in the content.

